
Multi-Indicator Assessment of a Thermal Insulation Investment, Taking into Account the Pre-Set Temperature


1
Institute of Economics and Finance, Faculty of Economics and Management, University of Zielona Góra, ul. Licealna 9, 65-417 Zielona Góra, Poland
2
Institute of Mathematics, Faculty of Mathematics, Computer Science and Econometrics, University of Zielona Góra, ul. Licealna 9, 65-417 Zielona Góra, Poland
3
Institute of Management and Quality Sciences, Faculty of Economics and Management, University of Zielona Góra, ul. Licealna 9, 65-417 Zielona Góra, Poland
*
Author to whom correspondence should be addressed.
Sustainability 2024, 16(9), 3544; https://doi.org/10.3390/su16093544
Submission received: 18 March 2024
/
Revised: 19 April 2024
/
Accepted: 22 April 2024
/
Published: 24 April 2024
(This article belongs to the Special Issue Intelligent and Innovative Solutions for Sustainable and Healthy Built Environment)
Abstract
:The article proposes indicators to evaluate a thermal insulation investment in a building, such as net present value (NPV), profitability index, discounted payback period, and ecological cost efficiency. Economic and ecological aspects were taken into account. Life Cycle Assessment (LCA) was used in the ecological analysis. The following heat sources in the building were considered: condensing gas boiler and heat pump. The developed indicators also depend on the pre-set temperature in residential premises. A methodology to determine the optimum thermal insulation thickness for both economic and ecological reasons was also proposed. A case study was analyzed, and a reference building, typical for Polish construction conditions, was used for research. Various solutions were suggested regarding the type of thermal insulation material and heat sources. The values of the indicators were determined for the proposed variants and for the economically and ecologically optimum thermal insulation thicknesses. Based on the conducted research, it was found that air temperatures maintained in the rooms of the building undergoing thermal modernization should be taken into account in the energy audit. The energy demand of the building for a room temperature of 26 °C is higher by 61% compared to the demand for the same building at the design temperature (20 °C). The innovation in the proposed approach to the economic and ecological assessment of a building is the combination of a wide range of temperatures potentially maintained in living spaces with ecological cost-effectiveness.
1. Introduction
The construction sector is the economic sector that largely contributes to generating environmental impacts. Scientific literature states that the construction sector is responsible for 40% of greenhouse gas emissions and 36% of global energy consumption [1,2]. One of the methods to reduce the pressure of this economic sector on the environment is to improve the energy efficiency of existing buildings. One of the basic principles of the revised Energy Efficiency Directive is: “energy efficiency first” [3]. Energy efficiency is perceived as the “first” fuel [4] that has not been used, resulting in avoided emissions and improved energy security. From an economic point of view, improving energy efficiency seems to be justified, especially during the global energy crisis [5,6]. It is obvious that there are certain boundary conditions for a pro-efficiency investment, beyond which the investment (e.g., thermal modernization) turns out to be economically unprofitable [7]. In times of the global energy crisis, the assessment of the economic profitability of a pro-efficiency investment is very dynamic due to the constantly rising prices of energy carriers [8]. The above situation has a significant impact on society (quality of life) and, in particular, on the risk of widespread energy poverty [9]. Energy poverty should be seen as a result of economic conditions, but this is not discussed further in this article.
The scientific aim of the article is to present a method for the economic and ecological assessment of a pro-efficiency investment—thermal modernization of external, vertical walls of a single-family detached building. The approach to assessing investments jointly—economic and ecological—results from the assumptions of sustainable construction. Any action aimed at improving energy efficiency is burdened with the need to increase the load on the environment at the time of the investment, regardless of the method of implementation of this investment. Energy efficiency in the construction sector can be improved by using Renewable Energy Sources (RES) [10], improving the insulation of building walls (transparent and non-transparent) [11], improving the insulation of central heating pipes (if any) and hot water [12], replacing heating and cooling devices with more efficient ones [13], heat recovery systems from ventilation air [14], etc. Each of these pro-efficiency activities is related to the need to obtain raw materials and produce products from them, as well as logistic issues related to delivering the product to the consumer (investor) and installing it in the building. In all phases of the life cycle of these products, there is increased pressure on the environment, even though they are ultimately intended to reduce the building’s environmental pressure [15]. The ecological assessment of the thermal modernization investment allows for assessing its profitability throughout the entire life cycle.
As previously mentioned, the subject of the research is the assessment of the economic and ecological profitability of the thermal insulation investment of external vertical walls, a model detached, single-family building, which was erected in 2013 in Poland. The model building was consciously chosen, and it was built relatively recently, and the energy performance of the building currently does not meet the requirements. The obtained research results are intended to be helpful for investors considering thermal modernization investments in relatively “new” buildings. In times of the energy crisis, it can be expected that some users of residential premises will reduce heating costs, among other things, by lowering the temperature in rooms, regardless of the level of insulation of external walls [16]. Due to the above, the research proposed a wide temperature range potentially maintained in residential rooms, for which the energy demand was determined, and the economic and ecological benefits of investing in thermal insulation of non-transparent vertical building walls were assessed. There is a lack of literature in scientific research presenting the impact of temperatures maintained in living rooms on the economic and ecological profitability of the thermal modernization investment. Most of the literature refers to a fixed value for the design temperature. It turns out that the actual temperature in residential rooms has a significant impact on generating economic benefits or losses for this investment.
The rest of the article (Section 2) reviews the literature in the context of demonstrating the research gap. Section 3 is the research methodology that takes into account the economic, ecological, and energy aspects of the assessment of the thermal modernization investment. Section 4 is a case study in which a reference building, typical for the conditions of Polish construction, was adopted as the research subject. Various solutions were proposed regarding the type of insulation material and heat sources. One of the proposed heat sources is a heat pump, which is widely used in Renewable Energy Sources (RES) systems. Section 5 discusses the obtained results, while the last Section 6 presents research conclusions.
2. Literature Review
Energy efficiency in the twenty-first century is becoming a sine qua non. This is due to many factors, but the main aspect is the improvement of the quality of life due to better external air quality, lower costs of maintaining a comfortable temperature in living rooms, energy security, the possibility of practicing sports outdoors, etc.
C. Filippín and S. Flores Larsen [17] note that improving energy efficiency in new buildings by 30% to 50% generates low economic costs of up to 2% of additional construction costs, and sometimes improving energy efficiency does not generate additional costs. Unfortunately, improving energy efficiency in existing buildings is associated with higher financial outlays, but this investment is often economically justified [18]. The cost of a thermal modernization investment depends on the scope of construction works, the thermal insulation materials used, the type of windows, the type of roofing, the need to perform earthworks, the type of a new heat (or cold) source, etc.
The topic of thermal modernization in Poland is particularly important due to the climate (According to the Kȍppen-Geiger classification—Dfb) and the large number of buildings, especially in Central and Eastern Poland, which are energy-intensive [19]. Potentially, there are still great opportunities to improve energy efficiency in Poland. In Poland, the Long-Term Building Renovation Strategy (LTBRS) was adopted in 2022, in which it is planned that 7.5 million thermal modernization investments will be made in the years 2021–2050, with 4.7 million buildings subject to deep thermal modernization (Deep thermal modernization—thermal modernization that meets the requirements related to energy saving and thermal insulation contained in the Technical Guidelines (TG) regulation, and if it is justified from a technical and economic point of view—enabling the achievement of lower values of the annual demand for non-renewable primary energy (PE) than specified in the TG regulation) [20].
Research on the ecological and economic assessment of thermal modernization projects is increasingly discussed in scientific articles. The combined assessment of these two aspects is the basis for sustainable construction. The social aspect of sustainable construction is implemented, as it were, spontaneously due to the improvement of the relationship of this sector with the environment, which results in an improvement in the quality of life of the society [21]. However, an energy assessment is necessary to perform an economic and ecological assessment of the analyzed thermal modernization variants.
Blazy R. et al. [22] proposed a scenario method in the economic and ecological assessment of thermal modernization. The authors found that for the most economically attractive scenario, the reduction in air pollution resulting from the production of thermal energy is only 17–18% compared to the reference building. The study by Sadowska B. et al. [23] assessed the economic and ecological aspects and verified the obtained theoretical values resulting from the energy audit of the building with the actual energy demand after the thermal modernization investment. The real reduction in energy consumption in the analyzed building in the years 2017–2020 ranged from 37.7% to 45.7%, and the reduction of energy consumption resulting from the energy audit amounted to 50.4%. However, it should be noted that the calculations performed for the purposes of developing an energy audit are made taking into account historical values of heating degree days (HDD); hence, it is possible to obtain lower values of the energy demand in reality in the subsequent years of use of the building. This conclusion is confirmed by the analysis of historical values of heating degree days (HDD) in Poland [24].
There are few studies in the literature on the subject that assess the economic and ecological thermal modernization investment for various temperature values that are maintained in residential premises. The temperature in residential premises is most often different from the calculation temperature (on average 20 °C according to PN-EN 12831-1:2017-08 [25]) due to the preferences, age, physical activity, body weight, type of room, and the financial situation of the residents. In the study by Basińska M. and Koczyk H. [26], internal temperature was measured in four rooms, including the bathroom. In the rooms, the temperature was between 16.0 °C (min.) and 23.5 °C (max.) in the winter (heating) season, while in the bathroom, the difference was even greater and amounted to between 20.9 °C and 29.2 °C. Considering the above and the German energy saving ordinance, which takes into account temperature fluctuations in residential premises between 17 °C and 26 °C, depending on the user’s profile [27], residents’ preferences regarding air temperature should be included, especially in thermal modernization investments. Dylewski R. and Adamczyk J. [7] note that considering the value of internal air temperature (especially higher than the standard 20 °C) in the energy audit of the building before the thermal modernization process may have consequences in terms of higher energy savings and lower environmental burden in the later use of the residential premises.
3. Methodology
The basic indicator for assessing the economic effects of the investment is Net Present Value (NPV). Taking into account environmental factors, the Ecological Net Present Value (ENPV) indicator can be defined analogously (see [7]). Based on these indicators, we propose indicators such as investment profitability and discounted payback period in the article, both for economic and ecological reasons. Additionally, it is possible to determine the so-called ecological cost efficiency, an indicator that includes ecological and economic factors. The nomenclature used is consistent with that used in the literature [28]. The next steps in the proposed methodology are presented in the flowchart (see Figure 1).
3.1. Economic Indicators for Assessing a Thermal Insulation Investment
For the economic assessment, the economic net present value NPV of the investment can be used, depending on the pre-set temperature in the residential premises Tb, in relation to 1 m2 of the wall area ([7]):
where:
NPV (Tb) = −(Km · d + Kw) + SN · (U0 − U) · G0 (Tb) [PLN/m2],
Km—cost for 1 m3 of thermal insulation material [PLN/m3],
Kw—cost of thermal insulation of 1 m2 of wall area [PLN/m2],
d—thickness (depth) of the thermal insulation layer [m],
—cumulative discount factor,
N—duration of use of thermal insulation [years],
r—real annual interest rate,
s—real annual increase (in percent) in heating costs,
G0 (Tb)—annual economic cost of heating,
U—heat transfer coefficient of the wall with a thermal insulation layer [W/m2K],
U0—heat transfer coefficient of the wall without a thermal insulation layer [W/m2K],
where 1/U = 1/U0 + d/λ,
λ—thermal conductivity coefficient of the thermal insulation material [W/mK].
The investment is profitable if the NPV (Tb) is greater than or equal to 0. When comparing different investment variants (due to this indicator), the one for which the higher NPV (Tb) is obtained is better.
It is essential to determine the economic cost of heating G0 (Tb) depending on the temperature value Tb in the residential premises in relation to 1 m2 of the area of the considered external wall:
where:
G0 (Tb) = (DUo (Tb) − DUn (Tb))/(U0 − Un) · Kc · (pu/p) [(PLN∙K)/(W∙year)]
Un = 0.20 [W/m2K]—the value of the heat transfer coefficient of the wall with a thermal insulation layer, required from 2021 (in accordance with [29]),
DU (Tb)—annual energy demand for heating in relation to 1 m2 of usable area, with the coefficient U [kWh/m2year] (DUo with U0 and DUn with Un, respectively), for the temperature Tb,
pu—usable area of the building [m2],
p—area of external vertical walls [m2],
Kc—cost of heat generation for a heat source and fuel [PLN/kWh], taking into account the production efficiency.
Another indicator when comparing investments with different expenditures is the economic profitability index PI (Tb):
PI (Tb) = (SN · (U0 − U) · G0 (Tb))/(Km · d + Kw) [PLN/PLN]
The value of PI (Tb) = 1 means that NPV (Tb) = 0. Therefore, the investment is profitable if PI (Tb) ≥ 1. When comparing different investment variants (with respect to this indicator), the one for which the higher value PI (Tb) is better.
Another indicator is the economic discounted payback period (in units of time). This is the shortest period [0, T (Tb)] for which the economic net present value of all flows occurring during this period is non-negative. The economic discounted payback period is identified with its final moment T (Tb):
T (Tb) = min {t: −(Km · d + Kw) + St · (U0 − U) · G0 (Tb) ≥ 0} [years]
If NPV < 0 for the entire period covered by the investment, we say that the investment has no return. When comparing different investment variants (with respect to this indicator), the variant for which the smaller T (Tb) was obtained is considered better.
3.2. Ecological Indicators for Assessing a Thermal Insulation Investment
Taking into account ecological considerations, we introduce the ecological net present value NPVE for the investment, depending on the pre-set temperature in the residential premises Tb, and in relation to 1 m2 of the wall area ([7]):
where:
NPVE (Tb) = −Kl · d + N · (U0 − U) · GE (Tb) [Pt/m2],
Kl—LCA analysis results for 1 m3 of thermal insulation material [Pt/m3],
GE (Tb)—annual ecological heating cost,
the rest—as before.
In the ecological analysis, first of all, the ecological heating costs GE (Tb) are determined depending on the temperature maintained by users in the residential premises Tb:
where:
GE (Tb) = (DUo (Tb) − DUn (Tb))/(U0 − Un) · Ke · (pu/p) [(Pt∙K)/(W∙year)],
Ke—LCA analysis result of obtaining 1 kWh of thermal energy for a heat source and fuel [Pt/kWh],
the rest—as before.
Similar to the economic assessment, the ecological profitability index PIE (Tb) can be introduced:
PIE (Tb) = (N · (U0 − U) · GE (Tb))/(Kl · d) [Pt/Pt],
Similarly, if PIE (Tb) = 1, it means that NPVE (Tb) = 0. Therefore, the investment is profitable if PIE (Tb) ≥ 1. When comparing different investment variants (with respect to this indicator), the one for which a higher PIE (Tb) is obtained is considered better.
The ecological discounted payback period of the investment can also be determined. This is the shortest period [0, TE (Tb)], for which the ecological net present value of all flows occurring during this period is non-negative. The ecological discounted payback period is identified with its final moment TE (Tb):
TE (Tb) = min {t: −Kl · d + t · (U0 − U) · GE (Tb) ≥ 0} [years]
If the entire period covered by the investment NPVE is negative, we say that the investment does not pay off for ecological reasons. When comparing different investment variants (with respect to this indicator), the variant for which the lower TE (Tb) was obtained is considered better.
3.3. Ecological Cost Effectiveness of a Thermal Insulation Investment
The CEA (Cost-Effectiveness Analysis) method can also be used to compare different variants of thermal insulation investment. This method can be used when benefits are measured in units other than monetary units (see [30]). In our case, environmental benefits are determined in ecopoints [Pt]. CEA analysis is performed using the indicator DGC (Dynamic Generation Cost). This indicator determines the financial cost of obtaining a unit of the intended result. In our case, CEA combines the ecological benefits of thermal insulation with economic costs. For the thermal insulation investment, ecological cost-effectiveness (DGC indicator) can be defined as the cost (in PLN) of reducing the environmental burden by 1 Pt as a result of implementing the investment:
DGC (Tb) = (Km · d + Kw)/(−Kl · d + N · (U0 − U) · GE (Tb)) [PLN/Pt]
When comparing different investment variants (with respect to this indicator), the variant for which the lower DGC (Tb) was obtained is considered better.
3.4. Optimum Thermal Insulation Thicknesses
The indicator NPV (Tb) as a function of the variable U is strictly concave function and limited from above. Based on Equation (1), it is possible to determine the value of the coefficient U, which is the indicator that reaches its maximum value. It is necessary to determine the derivative of NPV (Tb) with respect to U and then at what value of U this derivative is equal to 0. We will denote this value by Uopt (Tb):
Uopt (Tb) = (λ · Km/(SN · G0 (Tb)))1/2 [W/m2K].
Therefore, the optimum thickness of the thermal insulation for economic reasons is:
dopt (Tb) = λ · (1/Uopt (Tb) − 1/U0) [m].
A similar situation occurs for NPVE (Tb). It is therefore possible, based on Equation (5), to determine its maximum value with respect to U. Let us denote the value of U, for which NPVE (Tb) reaches its maximum, by UEopt (Tb):
UEopt (Tb) = (λ · Kl/(N · GE (Tb)))1/2 [W/m2K].
Therefore, the optimum thickness of the thermal insulation for ecological reasons is:
dEopt (Tb) = λ · (1/UEopt (Tb) − 1/U0) [m].
4. Case Study of the Building
The reference building was a single-family, detached building with an attic with a usable area pu = 137 m2, which was built in 2013 (see Figure 2. Ground floor and attic floor plans). The choice of this building, which is a relatively new building, was aimed at finding an answer to the research problem: is it profitable to carry out thermal modernization in a building erected less than 10 years ago? In the last decade in Poland, energy efficiency requirements for new buildings have been subject to constant changes [31]. Since the year the building was constructed (2013), the requirements for the heat transfer coefficient of building partitions have changed three times.
The size of the building (usable area) is the standard size of buildings erected in Poland. Even though the building in question has been built in Poland, the proposed method has no geographical limitations. The walls are made of aerated concrete blocks (Uwall = 0.28 W/m2K). In 2013, this type of wall, in accordance with standard requirements (Umax = 0.30 W/m2K), did not require the use of additional thermal insulation. The attic ceiling is wooden; the roof is gable, wooden, insulated with mineral wool, and covered with roof tiles (Uroof = 0.20 W/m2K). The heated volume of the building is 366 m3, and the area of external vertical walls is p = 207.56 m2. The building is used by four people. Double-glazed windows with a heat transfer coefficient of 1.30 W/m2K were used.
4.1. Summary of Data for Analysis
Table 1 shows the energy demand for heating, determined using the program CERTO 2015, in accordance with Directive (EU) 2018/844 of the European Parliament and of the Council of 30 May 2018 on the energy performance of buildings. The situation was analyzed when the building walls were without a thermal insulation layer (U0 = 0.28 W/m2K) and when the walls were with a thermal insulation layer at which Un = 0.20 W/m2K. The demand was determined for various temperatures maintained in the building, ranging from 17 to 26 °C. Obviously, the difference in energy demand between the variant with thermal insulation and without thermal insulation is greater at higher temperatures; at Tb = 17 °C it is 7.35 kWh/m2year, and at Tb = 26 °C it is 15.01 kWh/m2year. It can be noticed that at Tb = 26 °C, the energy demand is more than twice as high as at Tb = 17 °C, both in the variant without and with thermal insulation.
Data regarding heat sources is summarized in Table 2. Two types of heat sources were included: S1—condensing gas boiler and S2—heat pump. In the LCA analysis, the ReCiPe E method was used to determine Ke [32]. Lower costs of heat production, both economic and ecological, were obtained for the heat pump (S2).
Two thermal insulation materials are included: I1—Polystyrene EPS and I2—Polystyrene XPS. Data regarding these thermal insulation materials are summarized in Table 3. Lower economic and ecological costs were obtained for Polystyrene EPS (I1).
4.2. Results of the Economic Analysis
This subsection presents the results of the economic analysis based on the methodology introduced in the previous section. The use of thermal insulation was assumed for N = 25 years, and the interest rates were assumed to be r = 5% and s = 3%. For Table 4, Table 5, Table 6, Table 7, Table 8, Table 9, Table 10, Table 11, Table 12, Table 13, Table 14 and Table 15, the header specifies which quantity is presented in the table together with the unit. In the beginning, the costs G0 (Tb) were determined (see Formula (2)). The results are presented in Figure 3. These costs, like the energy demand for heating, are higher at higher temperatures Tb. For the same pre-set temperature, these costs are much higher for the heat source S1 (condensing gas boiler) due to the higher economic costs of heat generation Kc (see Table 2).
In the following part, the values of indicators for economic evaluation were determined for optimum thermal insulation thicknesses. To determine these thicknesses, it is first necessary to determine the optimum values of Uopt (Tb) (see Formula (10)). The results are presented in Table 4. Obviously, for a particular heat source and thermal insulation material, lower Uopt (Tb) values are obtained at higher temperatures Tb. It should be noticed that for the I2-S2 variant and temperatures Tb in the range from 17 to 22 °C, Uopt (Tb) values were obtained higher than the maximum allowable value Un = 0.20 [W/m2K].

Table 4.
Values of the heat transfer coefficient Uopt (Tb) [W/m2K].
| Thermal Insulation Material | Heat Source\Tb [°C] | 17 | 18 | 19 | 20 | 21 | 22 | 23 | 24 | 25 | 26 |
|---|---|---|---|---|---|---|---|---|---|---|---|
| I1 | S1 | 0.144 | 0.139 | 0.132 | 0.129 | 0.123 | 0.118 | 0.113 | 0.108 | 0.106 | 0.101 |
| S2 | 0.194 | 0.187 | 0.178 | 0.173 | 0.166 | 0.160 | 0.152 | 0.146 | 0.143 | 0.136 | |
| I2 | S1 | 0.187 | 0.181 | 0.172 | 0.167 | 0.160 | 0.154 | 0.147 | 0.141 | 0.138 | 0.131 |
| S2 | 0.253 | 0.244 | 0.232 | 0.226 | 0.216 | 0.208 | 0.198 | 0.190 | 0.186 | 0.177 |
For known values Uopt (Tb), the optimum thermal insulation thickness can be determined for economic reasons (see Formula (11)). The results are presented in Table 5. For the set temperature Tb, the highest thicknesses were obtained for the I1-S1 variant. At higher temperatures Tb, it is economically more advantageous to install a thicker layer of thermal insulation.
Table 5.
Optimum thermal insulation thickness dopt (Tb) [m].
| Thermal Insulation Material | Heat Source\Tb [°C] | 17 | 18 | 19 | 20 | 21 | 22 | 23 | 24 | 25 | 26 |
|---|---|---|---|---|---|---|---|---|---|---|---|
| I1 | S1 | 0.104 | 0.113 | 0.124 | 0.130 | 0.141 | 0.151 | 0.164 | 0.176 | 0.182 | 0.197 |
| S2 | 0.049 | 0.055 | 0.063 | 0.068 | 0.076 | 0.083 | 0.093 | 0.102 | 0.106 | 0.117 | |
| I2 | S1 | 0.062 | 0.069 | 0.078 | 0.084 | 0.093 | 0.102 | 0.114 | 0.124 | 0.129 | 0.142 |
| S2 | 0.013 | 0.019 | 0.026 | 0.030 | 0.037 | 0.044 | 0.052 | 0.059 | 0.063 | 0.073 |
The main indicator for economic assessment is NPV (Tb). The obtained values of this indicator (see Formula (1)) depending on the temperature Tb, with thermal insulation thickness d = dopt (Tb) and U = Uopt (Tb) are summarized in Table 6. For most cases, no return on the thermal insulation investment was obtained (NPV (Tb) < 0). Only for the I1-S1 variant at temperatures from 23 to 26 °C and the I2-S1 variant at 26 °C is the thermal insulation investment economically profitable (NPV (Tb) > 0).
Table 6.
Economic net present values NPV (Tb) [PLN/m2].
| Thermal Insulation Material | Heat Source\Tb [°C] | 17 | 18 | 19 | 20 | 21 | 22 | 23 | 24 | 25 | 26 |
|---|---|---|---|---|---|---|---|---|---|---|---|
| I1 | S1 | −31.54 | −26.90 | −20.11 | −15.54 | −8.30 | −0.26 | 10.36 | 20.71 | 26.61 | 41.03 |
| S2 | −53.80 | −52.16 | −49.65 | −47.91 | −45.06 | −41.82 | −37.41 | −33.02 | −30.48 | −24.17 | |
| I2 | S1 | −46.78 | −43.57 | −38.69 | −35.32 | −29.86 | −23.65 | −15.27 | −6.94 | −2.14 | 9.75 |
| S2 | −59.38 | −58.79 | −57.70 | −56.84 | −55.31 | −53.42 | −50.68 | −47.79 | −46.06 | −41.63 |
The indicator for the relative assessment investment in the economic aspect is the economic profitability index PI (Tb) (see Formula (3)). The results are presented in Table 7. Where NPV (Tb) < 0, the profitability of PI (Tb) < 1 is obtained (for these variants, thermal insulation is unprofitable for economic reasons). The highest profitability was obtained at the highest temperatures, Tb. For example, for the I1-S1 variant and temperature Tb = 26 °C, for every PLN 1 invested, PLN 1.351 is returned.
Table 7.
Economic profitability indicators PI (Tb) [PLN/PLN].
| Thermal Insulation Material | Heat Source\Tb [°C] | 17 | 18 | 19 | 20 | 21 | 22 | 23 | 24 | 25 | 26 |
|---|---|---|---|---|---|---|---|---|---|---|---|
| I1 | S1 | 0.650 | 0.709 | 0.790 | 0.841 | 0.918 | 0.997 | 1.096 | 1.187 | 1.236 | 1.351 |
| S2 | 0.274 | 0.312 | 0.365 | 0.399 | 0.450 | 0.503 | 0.569 | 0.631 | 0.664 | 0.742 | |
| I2 | S1 | 0.461 | 0.515 | 0.588 | 0.634 | 0.703 | 0.773 | 0.860 | 0.939 | 0.982 | 1.080 |
| S2 | 0.098 | 0.137 | 0.189 | 0.222 | 0.272 | 0.323 | 0.385 | 0.442 | 0.473 | 0.545 |
The last economic indicator is the economic discounted payback period T (Tb) (see Formula (4)). The results are presented in Table 8. Unfortunately, only in a few cases (when NPV (Tb) > 0) is it determined. For example, for the I1-S1 variant and temperature Tb = 26 °C, the investment in thermal insulation would pay off the fastest after T (Tb) = 18 years, and for variants where NPV (Tb) < 0 (see Table 7), the economic discounted payback period does not exist. This is marked in Table 9 by “-”.
Table 8.
Economic discounted payback period T (Tb) [years].
| Thermal Insulation Material | Heat Source\Tb [°C] | 17 | 18 | 19 | 20 | 21 | 22 | 23 | 24 | 25 | 26 |
|---|---|---|---|---|---|---|---|---|---|---|---|
| I1 | S1 | - | - | - | - | - | - | 23 | 21 | 20 | 18 |
| S2 | - | - | - | - | - | - | - | - | - | - | |
| I2 | S1 | - | - | - | - | - | - | - | - | - | 23 |
| S2 | - | - | - | - | - | - | - | - | - | - |
Table 9.
Values of the heat transfer coefficient UEopt (Tb) [W/m2K].
| Thermal Insulation Material | Heat Source\Tb [°C] | 17 | 18 | 19 | 20 | 21 | 22 | 23 | 24 | 25 | 26 |
|---|---|---|---|---|---|---|---|---|---|---|---|
| I1 | S1 | 0.072 | 0.069 | 0.066 | 0.064 | 0.061 | 0.059 | 0.056 | 0.054 | 0.053 | 0.050 |
| S2 | 0.083 | 0.080 | 0.076 | 0.074 | 0.071 | 0.068 | 0.065 | 0.062 | 0.061 | 0.058 | |
| I2 | S1 | 0.165 | 0.159 | 0.152 | 0.147 | 0.141 | 0.136 | 0.129 | 0.124 | 0.121 | 0.116 |
| S2 | 0.191 | 0.184 | 0.175 | 0.170 | 0.163 | 0.157 | 0.149 | 0.143 | 0.140 | 0.133 |
4.3. Results of the Ecological Analysis
This subsection summarizes the results of the ecological analysis based on the methodology introduced in Section 3. First, GE (Tb) was determined using the Formula (6). The results are presented in Figure 4. Ecological costs, like economic costs, are higher at higher temperatures Tb. Higher ecological costs occur for the heat source S1 (condensing gas boiler) due to the higher ecological costs of producing heat Ke (see Table 2).
Then, the optimum values of U for ecological reasons were determined (see Formula (12)) depending on the temperature Tb. The results are summarized in Table 9. For a fixed thermal insulation material and heat source, lower values of coefficient UEopt (Tb) are obtained for higher temperatures Tb. For each case, values UEopt (Tb) are less than the maximum allowable value Un = 0.20 [W/m2K].
The optimum thermal insulation thicknesses determined for ecological reasons (Formula (13)) are listed in Table 10. For the pre-set temperature Tb, the highest thermal insulation thicknesses were obtained for the I1-S1 variant, and the smallest for the I2-S2 variant. Much greater optimum thermal insulation thicknesses were obtained than for economic reasons. Similarly to the economic analysis, at higher temperatures Tb, it is more advantageous for ecological reasons to install thicker layers of thermal insulation.
Table 10.
Optimum thermal insulation thicknesses dEopt (Tb) [m].
| Thermal Insulation Material | Heat Source\Tb [°C] | 17 | 18 | 19 | 20 | 21 | 22 | 23 | 24 | 25 | 26 |
|---|---|---|---|---|---|---|---|---|---|---|---|
| I1 | S1 | 0.322 | 0.339 | 0.361 | 0.375 | 0.395 | 0.417 | 0.442 | 0.466 | 0.479 | 0.508 |
| S2 | 0.264 | 0.279 | 0.298 | 0.310 | 0.328 | 0.346 | 0.369 | 0.389 | 0.400 | 0.425 | |
| I2 | S1 | 0.087 | 0.095 | 0.106 | 0.113 | 0.123 | 0.133 | 0.146 | 0.157 | 0.163 | 0.178 |
| S2 | 0.059 | 0.066 | 0.075 | 0.081 | 0.090 | 0.099 | 0.110 | 0.120 | 0.125 | 0.137 |
Table 11 shows (see Formula (5)) the ecological net present values NPVE (Tb), with d = dEopt (Tb) and U = UEopt (Tb). In each of the analyzed variants, a positive NPVE (Tb) value was obtained. However, for a fixed temperature value Tb, the highest values occur for the I1-S1 variant and the lowest for the I2-S2 variant.
Table 11.
Ecological net present values NPVE (Tb) [Pt/m2].
| Thermal Insulation Material | Heat Source\Tb [°C] | 17 | 18 | 19 | 20 | 21 | 22 | 23 | 24 | 25 | 26 |
|---|---|---|---|---|---|---|---|---|---|---|---|
| I1 | S1 | 6.35 | 7.01 | 7.96 | 8.59 | 9.55 | 10.61 | 11.97 | 13.28 | 14.01 | 15.78 |
| S2 | 4.27 | 4.75 | 5.42 | 5.87 | 6.56 | 7.32 | 8.31 | 9.25 | 9.78 | 11.06 | |
| I2 | S1 | 1.93 | 2.30 | 2.86 | 3.24 | 3.84 | 4.52 | 5.42 | 6.31 | 6.82 | 8.07 |
| S2 | 0.88 | 1.10 | 1.43 | 1.67 | 2.05 | 2.48 | 3.07 | 3.65 | 3.98 | 4.82 |
For the relative evaluation of the investment in the ecological aspect, the ecological profitability PIE (Tb) was used (see Formula (7)). In contrast to economic profitability, PIE (Tb) > 1 was obtained for each variant (see Table 12). The highest profitability was obtained for the I1-S1 variant. Even at the temperature of Tb = 17 °C, it is already 3.910 Pt/Pt.
Table 12.
Ecological profitability indicators PIE (Tb) [Pt/Pt].
| Thermal Insulation Material | Heat Source\Tb [°C] | 17 | 18 | 19 | 20 | 21 | 22 | 23 | 24 | 25 | 26 |
|---|---|---|---|---|---|---|---|---|---|---|---|
| I1 | S1 | 3.910 | 4.059 | 4.259 | 4.384 | 4.570 | 4.762 | 4.997 | 5.209 | 5.323 | 5.588 |
| S2 | 3.388 | 3.517 | 3.690 | 3.798 | 3.959 | 4.126 | 4.329 | 4.512 | 4.612 | 4.841 | |
| I2 | S1 | 1.695 | 1.760 | 1.847 | 1.901 | 1.981 | 2.065 | 2.166 | 2.258 | 2.308 | 2.423 |
| S2 | 1.469 | 1.525 | 1.600 | 1.647 | 1.717 | 1.789 | 1.877 | 1.956 | 1.999 | 2.099 |
Similarly to economic considerations, the ecological discounted payback period TE (Tb) can be determined (see Formula (8)). The ecological payback period for each variant is much faster than the assumed use life of the thermal insulation, N = 25 years (see Table 13). The fastest payback is for the I1-S1 variant, from TE (Tb) = 7 years at Tb = 17–18 °C to TE (Tb) = 5 years at Tb = 23–26 °C.
Table 13.
Ecological discounted payback period TE (Tb) [years].
| Thermal Insulation Material | Heat Source\Tb [°C] | 17 | 18 | 19 | 20 | 21 | 22 | 23 | 24 | 25 | 26 |
|---|---|---|---|---|---|---|---|---|---|---|---|
| I1 | S1 | 7 | 7 | 6 | 6 | 6 | 6 | 5 | 5 | 5 | 5 |
| S2 | 8 | 8 | 7 | 7 | 7 | 7 | 6 | 6 | 6 | 6 | |
| I2 | S1 | 15 | 15 | 14 | 14 | 13 | 13 | 12 | 12 | 11 | 11 |
| S2 | 17 | 17 | 16 | 16 | 15 | 14 | 14 | 13 | 13 | 12 |
4.4. Ecological Cost Effectiveness of Thermal Insulation
This section determines the costs (in PLN) of reducing the environmental burden by 1 Pt as a result of the investment, i.e., the ecological cost effectiveness DGC (Tb) (see Formula (9)). Table 14 shows the results for the thermal insulation thicknesses optimum for economic reasons d = dopt, and Table 15 for the thicknesses optimum for ecological reasons d = dEopt.
Table 14.
Ecological cost effectiveness DGC (Tb) [PLN/Pt], with thermal insulation thickness d = dopt.
Table 14.
Ecological cost effectiveness DGC (Tb) [PLN/Pt], with thermal insulation thickness d = dopt.
| Thermal Insulation Material | Heat Source\Tb [°C] | 17 | 18 | 19 | 20 | 21 | 22 | 23 | 24 | 25 | 26 |
|---|---|---|---|---|---|---|---|---|---|---|---|
| I1 | S1 | 18.57 | 16.94 | 15.11 | 14.14 | 12.89 | 11.80 | 10.68 | 9.82 | 9.41 | 8.56 |
| S2 | 32.22 | 28.11 | 23.89 | 21.79 | 19.23 | 17.10 | 15.03 | 13.51 | 12.80 | 11.39 | |
| I2 | S1 | 47.66 | 41.01 | 34.29 | 30.99 | 27.02 | 23.78 | 20.66 | 18.41 | 17.38 | 15.34 |
| S2 | 162.07 | 111.70 | 77.14 | 64.04 | 50.67 | 41.34 | 33.46 | 28.37 | 26.17 | 22.09 |
It can be observed that the best cost effectiveness is obtained for the I1-S1 variant and the worst for I2-S2, for each temperature Tb. The results are consistent with those for NPVE (Tb), PIE (Tb) and TE (Tb). For these indicators, the best result was also obtained for the I1-S1 variant, and the worst for I2-S2.
Table 15.
Ecological cost effectiveness DGC (Tb) [PLN/Pt], with thermal insulation thickness d = dEopt.
Table 15.
Ecological cost effectiveness DGC (Tb) [PLN/Pt], with thermal insulation thickness d = dEopt.
| Thermal Insulation Material | Heat Source\Tb [°C] | 17 | 18 | 19 | 20 | 21 | 22 | 23 | 24 | 25 | 26 |
|---|---|---|---|---|---|---|---|---|---|---|---|
| I1 | S1 | 24.12 | 22.51 | 20.64 | 19.60 | 18.24 | 17.01 | 15.70 | 14.67 | 14.16 | 13.11 |
| S2 | 31.92 | 29.60 | 26.94 | 25.48 | 23.57 | 21.86 | 20.05 | 18.64 | 17.96 | 16.54 | |
| I2 | S1 | 50.64 | 43.92 | 37.02 | 33.61 | 29.45 | 26.03 | 22.70 | 20.29 | 19.18 | 16.97 |
| S2 | 97.42 | 80.53 | 64.45 | 56.95 | 48.24 | 41.40 | 35.06 | 30.64 | 28.65 | 24.81 |
5. Discussion
The article analyzes the building with the assumption that the inhabitants, for various reasons, may maintain different internal air temperatures (from 17 °C to 26 °C). The purpose of the study was not to question the adopted calculation method, which assumes an average air temperature of 20 °C (Depending on the type of rooms: 20 °C for rooms, kitchen, halls, 24 °C for a bathroom), but to draw attention to the scientific problem that occurs when maintaining higher air temperatures in rooms. Basically, when investing in the thermal insulation of walls and using funding from the Clean Air (A program for owners and co-owners of single-family houses or separate residential premises in single-family buildings with a separate land and mortgage register, subsidizing thermal modernization investments) program, an energy audit of the building is required. At the same time, the residents’ preferences regarding maintaining the temperature inside the building are known. Taking into account the above, it should be justified to include these preferences in the energy audit, which may contribute to improving the energy efficiency of the building in the context of adjusted temperatures inside the building, optimum insulation thickness, and lower energy demand. The above postulate seems to be justified by the bottom-up temperature limit that was set for the design temperature value (20 °C).
It should also be noted that all economic indicators were determined without taking into account subsidies for thermal modernization from the Clean Air program due to different levels of the subsidy for this investment, which depend on household income and range from PLN 66,000 to PLN 135,000. Including these grants could potentially be a future direction for research.
The building erected in 2013 can be considered relatively “new”. Taking into account economic aspects, it is justified to carry out the thermal modernization investment only for an investor who maintains higher values of air temperature in rooms (above 23 °C) for the I1-S1 variant and the assumed period of use of thermal insulation (25 years). However, from an ecological aspect, each of the analyzed variants is characterized by high ecological profitability. This kind of disproportion between economic and ecological indicators in the field of thermal modernization investment demonstrates a high potential for improving the energy efficiency of buildings due to ecological aspects. Unfortunately, not all pro-ecological activities are conditioned by economic benefits. Probably, after considering the value of subsidies for the thermal modernization of buildings from the Clean Air program, most of the analyzed variants would also be economically beneficial, which justifies state intervention in this area.
In previous studies [7], the authors obtained similar results in terms of a high degree of dependence on the air temperature in rooms and the thickness of thermal insulation. However, previous research was conducted on an older building for which the economic and ecological profitability was high. In this study, only a few thermal modernization variants were economically profitable.
6. Conclusions
The proposed method for assessing the economic and ecological thermal modernization requires the investigator researcher to proceed according to an established action plan:
- determining the energy demand of the building;
- determining the environmental impact of the thermal energy source and production of thermal insulation materials used, for example, using the SimaPro computer program;
- determining the annual economic and ecological costs of heating depending on the actual air temperature Tb maintained in the rooms;
- determining the optimum heat transfer coefficient and optimum thermal insulation thickness for economic and ecological reasons, depending on the temperature Tb;
- determining the economic and ecological net present value, profitability index, discounted payback period, and ecological cost-effectiveness, depending on the temperature Tb.
The proposed assessment method is a universal method, independent of the geographical location of the assessed building.
The use of the design temperature value (20 °C) is completely justified for determining the demand for new buildings, while for modernized buildings, it should be the temperature value maintained in the rooms in reality, for which the building’s energy demand should be determined. Even though the above analysis examined a wider range of air temperatures in the building (from 17 °C to 26 °C), it is proposed to use the lowest design temperature of 20 °C mentioned above.
It is also proposed that the building energy audit include a record of the temperature value for which the building’s energy demand was determined; this will be important information for current and future users.
If the proposed change in the energy audit is included in the form of presenting the results of the building’s energy demand in relation to two temperature values (designed 20 °C and actual/preferred by users), this information may have an educational nature. It can be expected that building users will pay attention to the increased energy demand when higher temperatures are maintained and will voluntarily strive to reduce heating costs. If the energy demand of a building meeting current standards for Polish conditions is higher by 61% (see Table 1) for a room temperature of 26 °C, compared to the energy demand of the same building for the design temperature (20 °C), then this information is crucial for users. Any reduction in energy demand resulting from providing this information to the user will not only have an energy and economic dimension but also an ecological one in the form of reduced pressure on the environment.
An interesting issue from a scientific point of view is also the cognitive issue of the users’ approach to voluntarily lowering the temperature during the heating season. Although the literature draws attention to the fact that the value of air temperature in rooms depends on mentality, age, gender, and physical activity and is also genetically determined [33], in times of energy crisis, it is also economically determined. This aspect may constitute a direction for future scientific research.
Author Contributions
Conceptualization, R.D. and J.A.; Methodology, R.D., J.A. and M.R.; Software, J.A.; Validation, R.D., J.A. and M.R.; Resources, J.A.; Data Curation, R.D.; Writing—Original Draft Preparation, R.D., J.A. and M.R.; Writing—Review and Editing, J.A., R.D. and M.R.; Visualization, R.D.; Supervision, R.D. and J.A.; Project Administration, R.D. and J.A. All authors have read and agreed to the published version of the manuscript.
Funding
This research received no external funding.
Institutional Review Board Statement
Not applicable.
Informed Consent Statement
Not applicable.
Data Availability Statement
The dataset is available upon request from the authors.
Conflicts of Interest
The authors declare no conflicts of interest.
References
- Crawford, R.H. IOP Conference Series: Materials Science and Engineering; IOP Publishing: Bristol, UK, 2022; Volume 1218, p. 012047. [Google Scholar] [CrossRef]
- Tirth, V.; Algarni, S.; Agarwal, N.; Saxena, A. Greenhouse gas emissions due to the construction of residential buildings in Moradabad, India. Appl. Ecol. Environ. Res. 2019, 17, 12111. [Google Scholar] [CrossRef]
- DIRECTIVE (EU) 2023/1791 OF THE EUROPEAN PARLIAMENT AND OF THE COUNCIL of 13 September 2023 on energy efficiency and amending Regulation (EU) 2023/955. Available online: https://eur-lex.europa.eu/legal-content/EN/TXT/?uri=OJ%3AJOL_2023_231_R_0001 (accessed on 17 November 2023).
- Yang, M.; Yu, X. Energy Efficiency Becomes First Fuel. In Energy Efficiency; Green Energy and Technology; Springer: London, UK, 2015. [Google Scholar] [CrossRef]
- Smal, T.; Wieprow, J. Energy Security in the Context of Global Energy Crisis: Economic and Financial Conditions. Energies 2023, 16, 1605. [Google Scholar] [CrossRef]
- Ozili, P.; Ozen, E. Global Energy Crisis: Impact on the Global Economy. SSRN Electron. J. 2022, 1–18. [Google Scholar] [CrossRef]
- Dylewski, R.; Adamczyk, J. Economic and Ecological Optimization of Thermal Insulation Depending on the Pre-Set Temperature in a Dwelling. Energies 2023, 16, 4174. [Google Scholar] [CrossRef]
- Bednář, O.; Čečrdlová, A.; Kadeřábková, B.; Řežábek, P. Energy Prices Impact on Inflationary Spiral. Energies 2022, 15, 3443. [Google Scholar] [CrossRef]
- Sokołowski, J.; Kiełczewska, A.; Lewandowski, P. Defining and Measuring Energy Poverty in Poland, IBS Research Report 01/2019. Available online: https://ibs.org.pl/app/uploads/2019/01/IBS_Research_Report_01_2019.pdf (accessed on 1 November 2023).
- Gołąbeska, E. The impact of the energy efficiency of the building to its market value. Ekon. I Sr. 2019, 3, 55–62. [Google Scholar] [CrossRef]
- Shahee, A.; Abdoos, M.; Aslani, A.; Zahedi, R. Reducing the energy consumption of buildings by implementing insulation scenarios and using renewable energies. Energy Inf. 2024, 7, 18. [Google Scholar] [CrossRef]
- Mukhametrakhimov, R.; Galautdinov, A.; Panchenko, A.; Tatyana Gorbunova, T. Improving the quality of installation of preinsulated pipelines of heat supply systems, E3S Web Conf. Volume 264, 2021. In Proceedings of the International Scientific Conference “Construction Mechanics, Hydraulics and Water Resources Engineering” (CONMECHYDRO—2021), Online, 5 April 2021. [Google Scholar] [CrossRef]
- Hyemi, K.; Kyung-Soon, P.; Soolyeon, C.; Young-Hak, S. A Study on Utility of Retrofit that Minimizes the Replacement of Heat-Source System in Large Offices. Energies 2019, 12, 4309. [Google Scholar] [CrossRef]
- Zender-Świercz, E. A Review of Heat Recovery in Ventilation. Energies 2021, 14, 1759. [Google Scholar] [CrossRef]
- Rödger, J.-M.; Beier, J.; Schönemann, M.; Schulze, C.; Thiede, S.; Bey, N.; Herrmann, C.; Hauschild, M.Z. Combining Life Cycle Assessment and Manufacturing System Simulation: Evaluating Dynamic Impacts from Renewable Energy Supply on Product-Specific Environmental Footprints. Int. J. Precis. Eng. Manuf.-Green Tech. 2021, 8, 1007–1026. [Google Scholar] [CrossRef]
- Dascalaki, E.; Balaras, C. Impacts on Indoor Thermal Comfort and Heating Energy Use in Hellenic Dwellings from Occupant Behavioral Reactions. Appl. Sci. 2021, 11, 6254. [Google Scholar] [CrossRef]
- Filippín, C.; Flores Larsen, S. Energy efficiency in buildings. In Hofman, Energy Efficiency, Recovery and Storage; Hofman, K.A., Ed.; Nova Science Publishers, Inc.: Hauppauge, NY, USA, 2007; pp. 223–245. [Google Scholar]
- Szafranko, E. Methodology for assessment of the cost effectiveness of simple energy efficient investments. Constr. Optim. Energy Potential 2020, 9, 111–119. [Google Scholar] [CrossRef]
- Dzikuć, M.; Piwowar, A.; Szufa, S.; Adamczyk, J.; Dzikuć, M. Potential and Scenarios of Variants of Thermo-Modernization of SingleFamily Houses: An Example of the Lubuskie Voivodeship. Energies 2021, 14, 191. [Google Scholar] [CrossRef]
- Długoterminowa strategia renowacji budynków Wspieranie renowacji krajowego zasobu budowlanego (Long-Term Building Renovation Strategy (LTBRS)). In Proceedings of the Załącznik do uchwały nr 23/2022 Rady Ministrów z dnia 9 lutego 2022 r, Warszawa, Poland, 9 February 2022. (In Polish).
- Lis, A. The efficiency of energy-saving activities in the process of thermal modernization of multi-family buildings. Constr. Optim. Energy Potential 2019, 8, 107–116. [Google Scholar] [CrossRef]
- Blazy, R.; Błachut, J.; Ciepiela, A.; Łabuz, R.; Papiez, R. Thermal Modernization Cost and the Potential Ecological Effect—Scenario Analysis for Thermal Modernization in Southern Poland. Energies 2021, 14, 2033. [Google Scholar] [CrossRef]
- Sadowska, B.; Piotrowska-Woroniak, J.; Woroniak, G.; Sarosiek, W. Energy and Economic Efficiency of the Thermomodernization of an Educational Building and Reduction of Pollutant Emissions—A Case Study. Energies 2022, 15, 2886. [Google Scholar] [CrossRef]
- Cooling and Heating Degree Days by NUTS 3 Regions—Annual Data. Available online: https://ec.europa.eu/eurostat/databrowser/view/nrg_chddr2_a/default/table?lang=en (accessed on 17 November 2023).
- PN-EN 12831-1:2017-08; Charakterystyka Energetyczna Budynków—Metoda Obliczania Projektowego Obciążenia Cieplnego—Część 1: Obciążenie Cieplne, Moduł M3-3. Polski Komitet Normalizacyjny: Warsaw, Poland, 2017. (In Polish)
- Basińska, M.; Koczyk, H. Analiza zmienności temperatur w obiekcie doświadczalnym eksploatowanym z osłabieniem nocnym. Fiz. Budowli W Teor. I Prakt. 2007, 2, 21–24. (In Polish) [Google Scholar]
- EnEV 02-17; Energiesparverordnung, Referentenentwurf 06-11. BMVBS: Berlin, Germeny, 2007.
- Kaynakli, O. A review of the economical and optimum thermal insulation thickness for building applications. Renew. Sustain. Energy Rev. 2012, 16, 415–425. [Google Scholar] [CrossRef]
- Rozporządzenie Ministra Transportu. Budownictwa i Gospodarki Morskiej z Dnia 5 Lipca 2013 r. Zmieniające Rozporządzenie: W Sprawie Warunków Technicznych, Jakim Powinny Odpowiadać Budynki i ich Usytuowanie (Dz.U. 2013 poz. 926); Minister Transportu, Budownictwa i Gospodarki Morskiej: Warsaw, Poland, 2013. (In Polish) [Google Scholar]
- Minister for Regional Development: National Strategic Reference Framework 2007–2013. The Guidance on the Selected Issues Related to the Preparation of Investment Projects, Including Revenue-Generating Projects (Minister Rozwoju Regionalnego: Narodowe Strategiczne Ramy Odniesienia 2007–2013); Wytyczne w Zakresie Wybranych Zagadnień Związanych z Przygotowaniem Projektów Inwestycyjnych, w Tym Projektów Generujących Dochód: Warszawa, Poland, 2007. (In Polish)
- Adamczyk, J.; Dylewski, R. Changes in heat transfer coefficients in Poland and their impact on energy demand—An environmental and economic assessment. Renew. Sustain. Energy Rev. 2017, 78, 530–538. [Google Scholar] [CrossRef]
- Stavropoulosa, P.; Giannoulisa, C.; Papacharalampopoulosa, A.; Foteinopoulosa, P.; Chryssolouris, G. Life cycle analysis: Comparison between different methods and optimization challenges. In Proceedings of the 48th CIRP Conference on Manufacturing Systems (CIRP CMS 2015), Procedia CIRP 41, Gulf of Naples, Italy, 3–5 June 2015; pp. 626–631. [Google Scholar] [CrossRef]
- Tham, K.; Willem, H. Room air temperature affects occupants’ physiology, perceptions and mental alertness. Build. Environ. 2010, 45, 40–44. [Google Scholar] [CrossRef]
Figure 1.
Flowchart for the proposed methodology.

Figure 2.
Ground floor and attic floor plans.

Figure 3.
Annual economic heating costs G0 (Tb) [(PLN∙K)/(W∙year)].
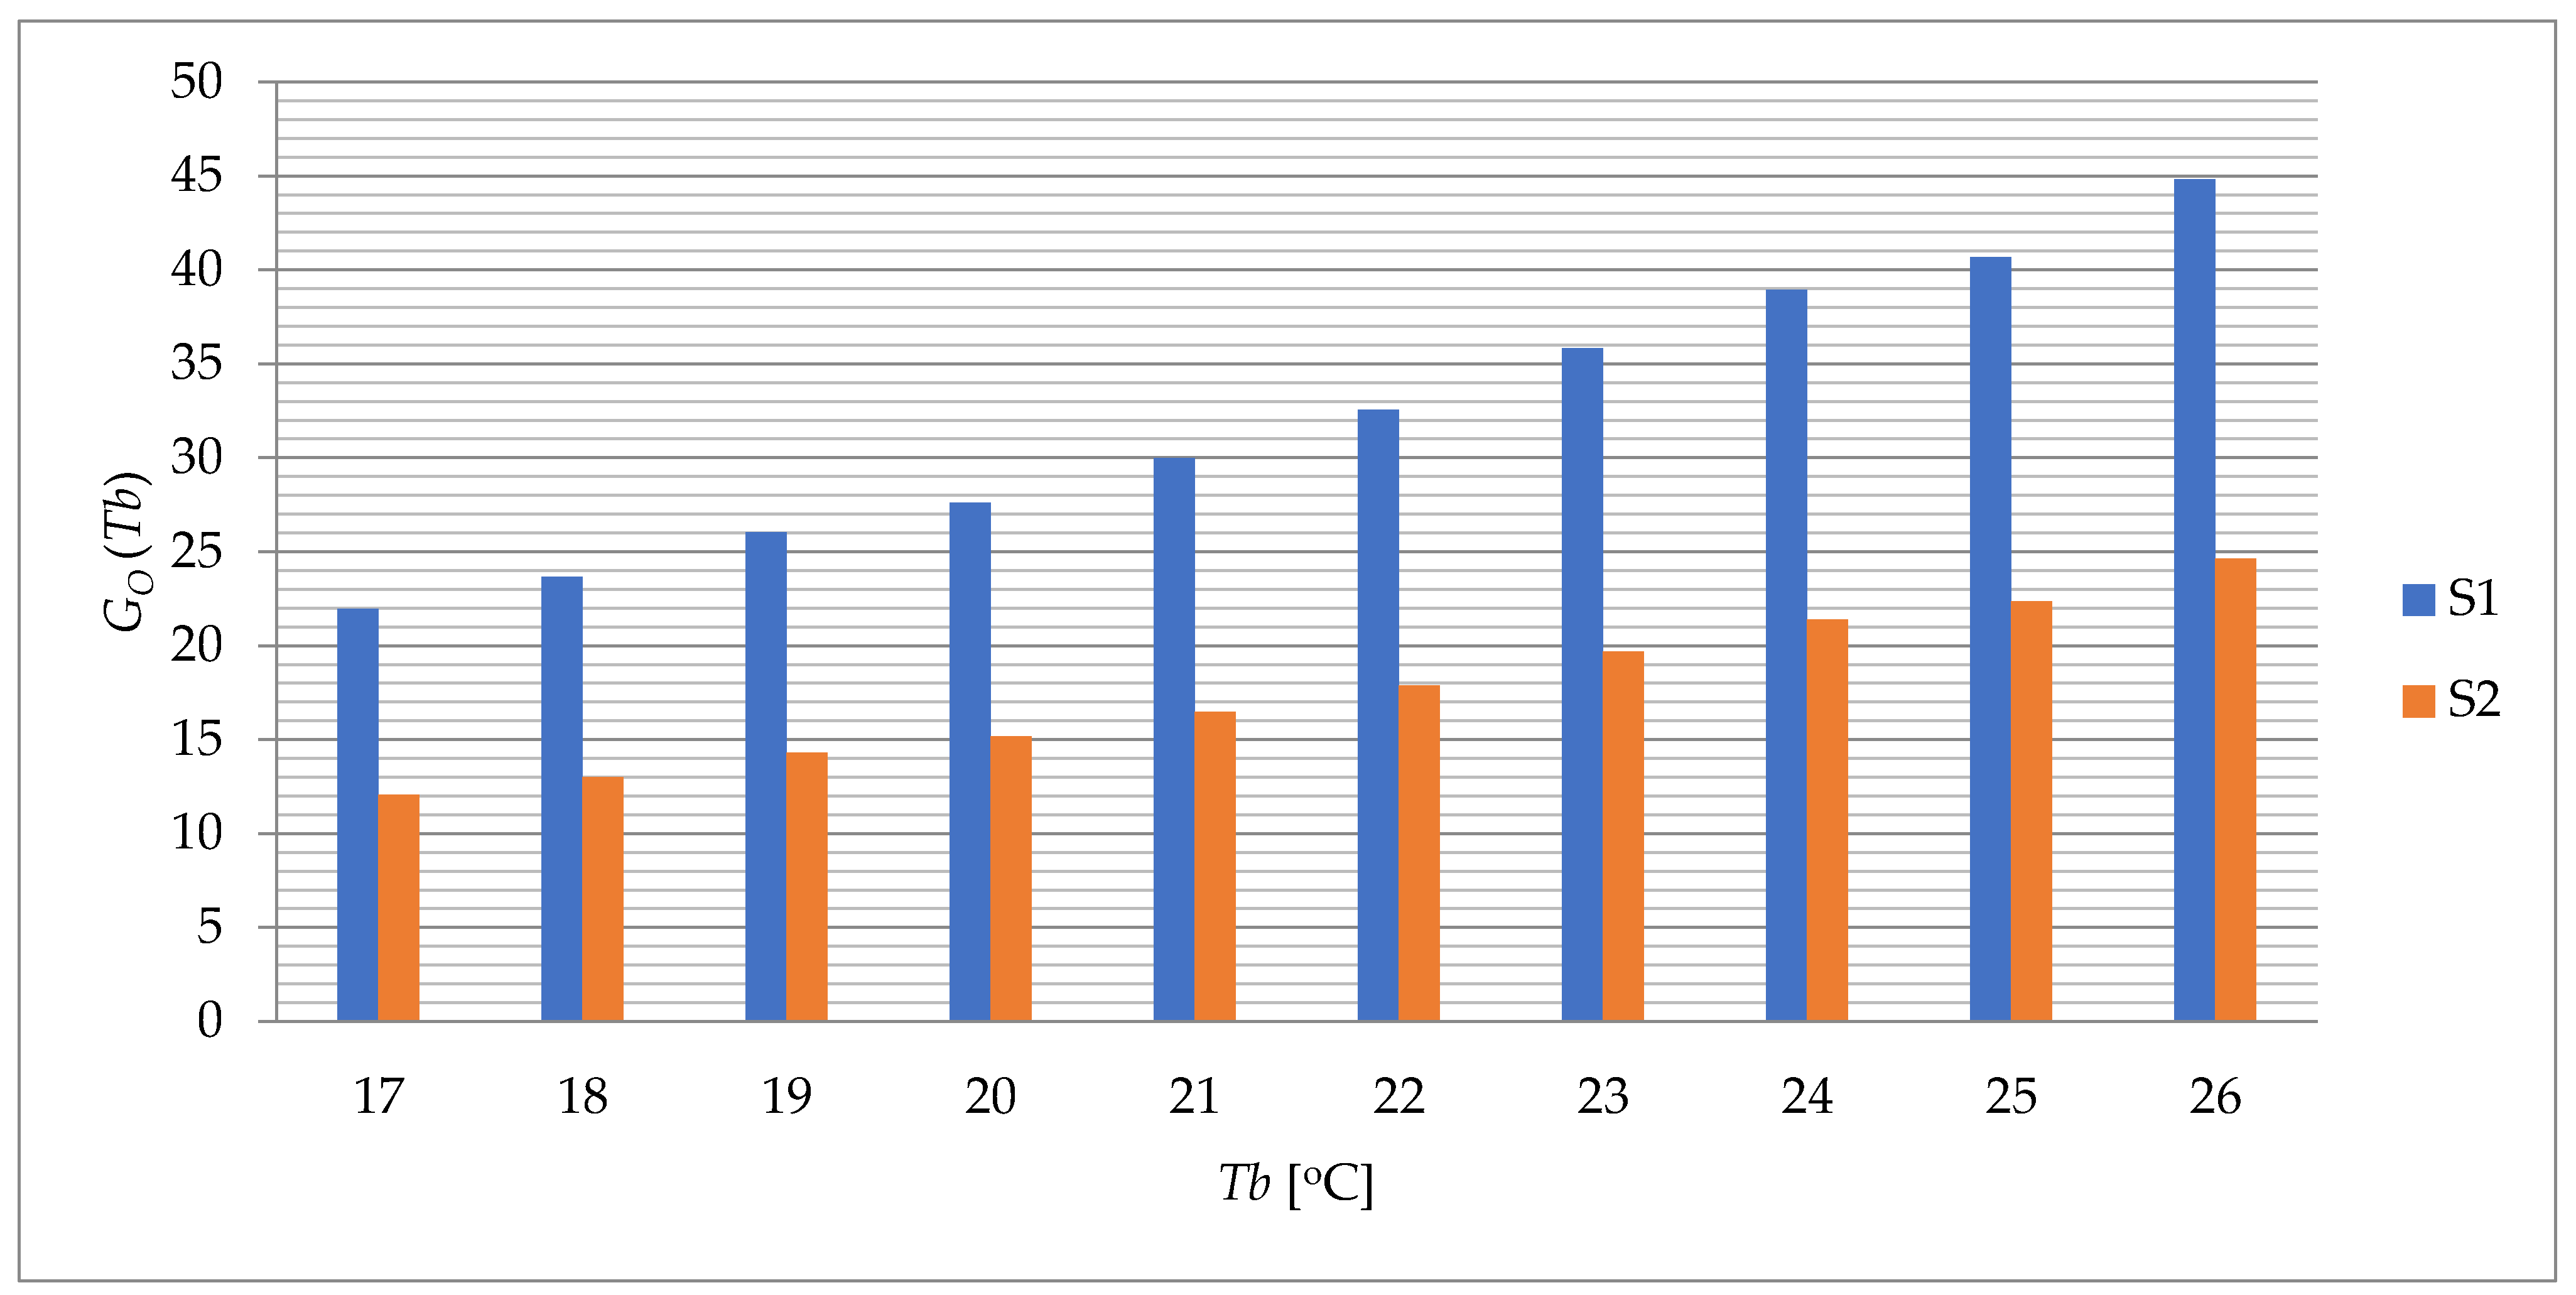
Figure 4.
Annual ecological heating costs GE (Tb) [(Pt∙K)/(W∙year)].
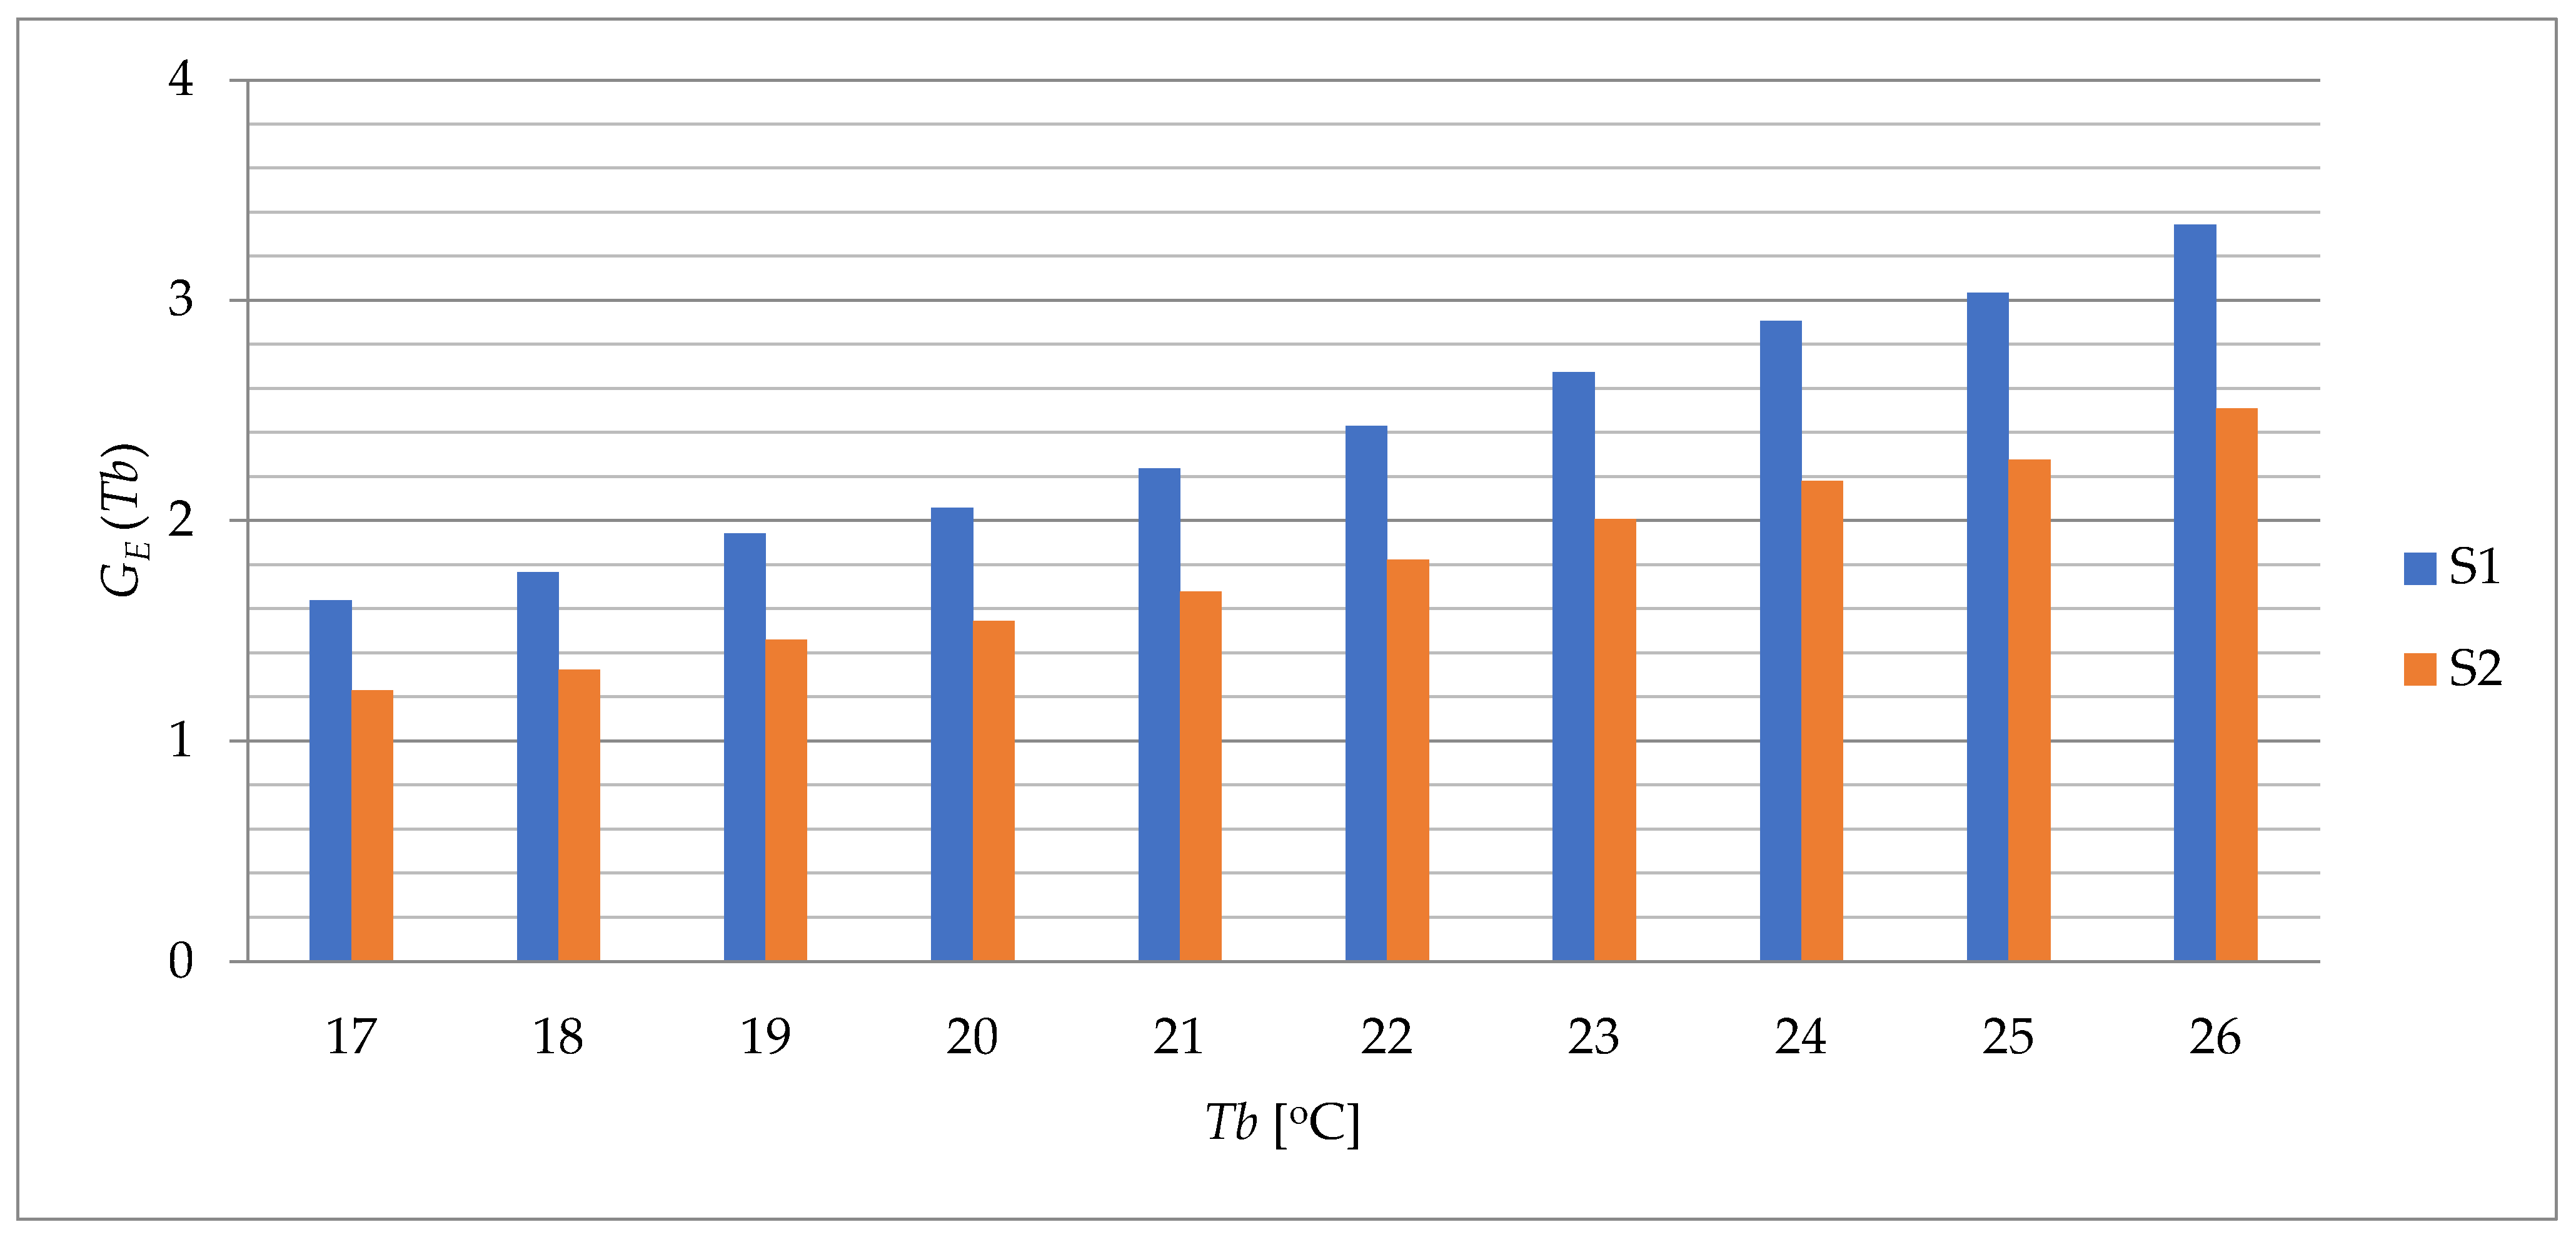
Table 1.
Energy demand for heating.
| Temperature Tb [°C] | 17 | 18 | 19 | 20 | 21 | 22 | 23 | 24 | 25 | 26 |
|---|---|---|---|---|---|---|---|---|---|---|
| DUo (Tb) [kWh/m2year] for U0 = 0.28 W/m2K | 81.53 | 90.97 | 100.13 | 109.47 | 119.14 | 129.40 | 140.52 | 152.51 | 164.15 | 176.81 |
| DUn (Tb) [kWh/m2year] for Un = 0.20 W/m2K | 74.18 | 83.05 | 91.41 | 100.23 | 109.10 | 118.50 | 128.52 | 139.47 | 150.53 | 161.80 |
Table 2.
Heat sources.
| Heat Source | Condensing Gas Boiler (S1) | Heat Pump (S2) |
|---|---|---|
| Efficiency/SEER | 98% | 5.28 |
| Kc [PLN/kWh] | 0.3620 | 0.1989 |
| Ke [Pt/kWh] | 0.0270 | 0.0203 |
Table 3.
Data for thermal insulation materials.
| Thermal Insulation Material | Polystyrene EPS (I1) | Polystyrene XPS (I2) |
|---|---|---|
| λ [W/mK] | 0.031 | 0.035 |
| Km [PLN/m3] | 289.07 | 433.00 |
| Kw [PLN/m2] | 60.00 | 60.00 |
| Kl [Pt/m3] | 6.77 | 31.90 |
Disclaimer/Publisher’s Note: The statements, opinions and data contained in all publications are solely those of the individual author(s) and contributor(s) and not of MDPI and/or the editor(s). MDPI and/or the editor(s) disclaim responsibility for any injury to people or property resulting from any ideas, methods, instructions or products referred to in the content. |
© 2024 by the authors. Licensee MDPI, Basel, Switzerland. This article is an open access article distributed under the terms and conditions of the Creative Commons Attribution (CC BY) license (https://creativecommons.org/licenses/by/4.0/).
Share and Cite
MDPI and ACS Style
Adamczyk, J.; Dylewski, R.; Relich, M. Multi-Indicator Assessment of a Thermal Insulation Investment, Taking into Account the Pre-Set Temperature. Sustainability 2024, 16, 3544. https://doi.org/10.3390/su16093544
AMA Style
Adamczyk J, Dylewski R, Relich M. Multi-Indicator Assessment of a Thermal Insulation Investment, Taking into Account the Pre-Set Temperature. Sustainability. 2024; 16(9):3544. https://doi.org/10.3390/su16093544
Chicago/Turabian StyleAdamczyk, Janusz, Robert Dylewski, and Marcin Relich. 2024. "Multi-Indicator Assessment of a Thermal Insulation Investment, Taking into Account the Pre-Set Temperature" Sustainability 16, no. 9: 3544. https://doi.org/10.3390/su16093544
Note that from the first issue of 2016, this journal uses article numbers instead of page numbers. See further details here.