
Innovative Approaches to Sustainable Computer Numeric Control Machining: A Machine Learning Perspective on Energy Efficiency

1
Department of Electrical Engineering, State Polytechnic of Malang, Malang 65141, Indonesia
2
Department of Mechanical Engineering, Chung Yuan Christian University, Taoyuan 320314, Taiwan
3
R&D Center for Smart Manufacturing, Chung Yuan Christian University, Taoyuan 320314, Taiwan
*
Author to whom correspondence should be addressed.
Sustainability 2024, 16(9), 3569; https://doi.org/10.3390/su16093569
Submission received: 17 March 2024
/
Revised: 19 April 2024
/
Accepted: 20 April 2024
/
Published: 24 April 2024
(This article belongs to the Special Issue Selected Papers on Sustainability from IMETI 2022)
Abstract
:Computer Numeric Control (CNC) five-axis milling plays a significant role in the machining of precision molds and dies, aerospace parts, consumer electronics, etc. This research aims to explore the potential of the machine learning (ML) technique in improving energy efficiency during the CNC five-axis milling process for sustainable manufacturing. The experiments with various machining parameters, forms of toolpath planning, and dry cutting conditions were carried out, and the data regarding energy consumption were collected simultaneously. The relationship between machine parameters and energy consumption was analyzed and built. Subsequently, a machine learning algorithm was developed to classify test methods and identify energy-efficient machining strategies. The developed algorithm was implemented and assessed using different classification methods based on the ML concept to effectively reduce energy consumption. The results show that the Decision Tree and Random Forest algorithms produced lower Root Mean Square Error (RMSE) values of 4.24 and 4.28, respectively, compared to Linear, Lasso, and Ridge Regression algorithms. Verification experiments were conducted to ascertain the real-world applicability and performance of the ML-based energy efficiency approach in an operational CNC five-axis milling machine. The findings not only underscore the potential of ML techniques in optimizing energy efficiency but also offer a compelling pathway towards enhanced sustainability in CNC machining operations. The developed algorithm was implemented within a simulation framework and the algorithm was rigorously assessed using machine learning analysis to effectively reduce energy consumption, all while ensuring the accuracy of the machining results and integrating both conventional and advanced regression algorithms into CNC machining processes. Manufacturers stand to realize substantial energy savings and bolster sustainability initiatives, thus exemplifying the transformative power of ML-driven optimization strategies.
1. Introduction
The Industrial Internet of Things (IIoT) is the next level of Internet of Things (IoT) technology, and it is unique in its manufacturing transformation [1,2,3]. However, this increase in production and efficiency has not come without environmental consequences. The simultaneous escalation of energy consumption has underscored the urgent need for sustainable manufacturing practices that minimize resource utilization, improve energy efficiency [4,5], and promote environmentally friendly methodologies. Through a series of carefully designed experiments conducted on a CNC five-axis milling machine, this study investigates the complex interaction between various machining parameters, innovative toolpath planning strategies, and consequential energy consumption patterns.
The main goal is to develop a thorough and multidimensional plan that incorporates several components, including energy efficiency and calculation. By using these strategies, the aim is not only to benefit the environment but also to promote more efficient and responsible manufacturing practices. A key focus of the research lies in predicting and calculating energy consumption in machining processes. The use of machine learning emerges as a robust methodology to understand the intricate and dynamic nature of machining operations [6,7]. Advanced algorithms enable the identification of patterns, optimization of parameters, and refinement of predictions, ultimately contributing to more accurate estimations of energy usage. In the field of machining, the research emphasizes that spindle speed plays a central role in determining overall energy consumption, surpassing even cutting energy. These methods enable us to understand the complex relationships between different factors to enhance energy efficiency in machining processes. By incorporating the principles of the Taguchi analysis, the research aims to enhance the precision and reliability of energy consumption predictions [8,9]. Through comparisons with Decision Tree analysis, valuable insights are gained into the factors significantly influencing energy consumption [10].
Calculating and forecasting energy consumption is very important, especially for the CNC machining process [11,12,13]. It has become obvious that power consumption changes depending on the toolpath as the number of axes on machine tools has risen and the motion of machines has become more sophisticated. Unique milling circumstances of a machining operation, such as the spindle motor speed and feed rate, as well as its predicted electrical energy consumption and the maximum electrical power in watts during the operation duration, are referred to as the processing mode. Researchers have also tackled a conceptual issue by creating an energy-load profile with the goal of reducing the profile length, and they have talked about how their method may be used as the foundation for green manufacturing processes. We provide a theoretical framework, mostly using machine learning tools, for processes that are energy-efficient in a five-axis machine. On the basis of actual machining data, our system employs energy-load profiles and the processing modes of machine tools.
Machine learning regression techniques have emerged as powerful tools to understand and predicting complex relationships within manufacturing processes [14,15,16,17,18]. In the context of CNC machining, various research parameters, such as spindle speed, feed rate, depth of cut, material properties, and tool characteristics, affect the resulting energy consumption. A basic method called Linear Regression assumes a linear connection between the input and output variables (in this case, energy consumption). It provides valuable insight into how changes in individual parameters affect energy use. Lasso regression, which combines regression analysis with regularization, promotes the selection of important variables while penalizing less significant one [19,20,21]. This technique is crucial when dealing with datasets where some parameters might have a negligible impact. Ridge regression, similar to Lasso, incorporates regularization. It is particularly useful in the presence of multicollinearity, where input variables are highly correlated [22,23]. Ridge regression helps mitigate the impact of correlated variables on the model. Decision Trees, a non-linear regression technique, break down the data into hierarchical structures, enabling the modeling of complex relationships. Decision Tree Regressors are adept at capturing intricate patterns within the data [24,25]. Finally, like another type of statistic modelling, we know that Random Forests, an ensemble technique, utilize multiple Decision Trees to enhance predictive accuracy. By averaging the output of numerous trees, Random Forest Regressors reduce overfitting and improve the robustness of predictions [26,27].
This research significantly contributes by thoroughly examining energy optimization strategies in five-axis CNC machining through the lens of machine learning. We conducted careful experiments and applied advanced regression techniques to gain practical insights into the complex relationships between machining parameters and energy consumption. The central hypothesis guiding our work is straightforward: employing machine learning methods like Linear Regression and Decision Trees will improve our capacity to predict and optimize energy usage. This, in turn, contributes to the advancement of sustainable and efficient practices in manufacturing. The recent focus on machine learning in various research projects underscores the significance of machining operations’ efficiency. The exploration of optimization methodologies using machine learning gains more attention as the volume of data expands exponentially and the complexity of the model increases [28]. The essence of future manufacturing lies in incremental optimization that extends from the supply chain to the final products. Critical to cost savings and heightened overall profitability per production run, the optimization of CNC machine tool operations is essential for boosting productivity and minimizing defects in manufactured components. By integrating motion system kinematics, a sophisticated motion-cueing algorithm is developed to improve simulator performance. This algorithm focuses on enhancing the precision of coupled movements by limiting actuator extensions. This restriction plays a crucial role in the refinement of the overall operation, ensuring smoother and more accurate machining processes. As a result, the implementation of this optimal motion-cueing algorithm contributes to increased efficiency and reduction in defects during the manufacturing of components [29].
Critical for advancing the precision and efficiency of CNC machining operations in component manufacturing are optimization techniques for machining parameters and machine tool performance, as emphasized in reference [30]. The utilization of artificial intelligence and machine learning with real-time production data facilitates automated optimization, consequently increasing the accuracy of machined components and the productivity of part manufacturing through optimized machining parameters [31]. A comprehensive method for multi-response machining processes is established, utilizing a combination of machine learning and genetic algorithms. The incorporation of a multi-objective evolutionary algorithm during CNC machining operations enhances both the convergence speed and the part production performance [32]. Part production processes may be made more efficient by utilizing the machine learning method to improve the optimization process on the shop floor during CNC machining operations. An in-depth analysis is conducted on the utilization of machine learning in CNC machine tools, with the aim of improving the stability of component production and reducing the likelihood of unforeseen failures.
2. Materials and Methods
2.1. Machine Learning Alhgorithm
Machine learning algorithms can analyze historical data to identify optimal toolpaths for specific materials and geometries. By minimizing unnecessary movements and milling strategies, these algorithms reduce machining time and subsequently lower energy consumption and lifecycle analysis. Therefore, our design is shown in Figure 1.
Linear Regression models build the relationship between independent variables or factors that explain or influence a phenomenon (predictors) and a dependent variable through the equation
In this context, ϵ is understood as a random observational error or fluctuations. When measurements are performed n times, producing n values of for n sets of , the model for each observation (i-th observation) can be expressed as:
In this formulation is the observed value of the dependent variable for the i-th set of observations. are the parameters to be estimated. is the i-th observation of the j-th predictor variable. represents the unobserved random error for the i-th observation. Ridge and Lasso regression methods offer regularization of estimated coefficients, addressing some drawbacks of the Ordinary Least Squares (OLS) estimator, particularly in scenarios with a large number of predictors relative to the sample size ( > n) [33]. In situations where the relationship between variables is nearly linear and the number of predictors is significantly less than the sample size ( << n), OLS may perform well. However, when k is not substantially smaller than n, estimates obtained through Ordinary Least Squares (OLS) are prone to high variance and diminished accuracy. Regularization techniques, such as Ridge and Lasso, come into play when dealing with high-dimensional data. They effectively mitigate the problem of high variance in OLS estimates by introducing a controlled amount of bias, which ultimately leads to improved prediction accuracy. In cases where the number of predictors exceeds the sample size ( > n), OLS fails to produce a unique solution, resulting in infinite estimate variance. Regularization methods help stabilize and enhance predictive performance in such situations.
A classification technique, often referred to as a classifier, is a systematic method for creating classification models based on a provided input dataset [34,35,36]. Different examples of classification techniques encompass Decision Tree classifiers, rule-based classifiers, neural networks (NNs), SVM, and Naïve Bayes classifiers. The initial strategy explicitly computes the generalization error, taking into account both the training error and a penalty term addressing the complexity of the model. This resulting generalization error serves as a pessimistic assessment of the effectiveness of the model. As an illustration, consider n(ti), which denotes the number of training records classified by node t, and e(ti), representing the count of incorrectly categorized data entries. The pessimistic error estimate, denoted as (T), for a Decision Tree T is calculated as follows:
Here, represents the number of leaf nodes, e(T) denotes the overall training error of the Decision Tree, represents the number of training records, and Ω(ti) signifies the penalty term attributed to each node ti.
When the machine tool is turned on, it starts to use the energy. The preparatory stage requires energy to position the tool and workpiece in optimal milling positions, while also setting the spindle speed. Subsequently, during the actual material removal process, milling energy becomes imperative. The assignment of a numerical value to this enables the modeling of the corresponding emissions.
where the total power consumption of a machine tool, denoted as , is determined by the specific milling energy for a given workpiece material, represented by , multiplied by the material removal rate (Q) and the cutting time ().
encompasses the energy consumption of the spindle, accounting for the energy needed for material removal from the workpiece. pertains to the energy consumption associated with the axis feed, while refers to the energy consumption during tool changes. corresponds to the energy usage of the coolant equipment, and is indicative of the energy consumption of the fan motor and servo system.
2.2. Experimental Setup
2.2.1. Electrical Connection
The circuit diagram can be seen in Figure 2. This research uses three PA-310 3P3W-3CT power meters manufactured by Arch Meter Corporation, Hsinchu, Taiwan. Each power meter measures three electrical lines to obtain current and voltage data. Clamp-on current sensors are used in this experiment to read the current on each line. The voltage value on each line is measured directly using a power meter. The first power meter in Figure 2a measures the current and voltage of the X-axis, Y-axis, and Z-axis servo motors via one of the 3 phase lines (wires A, B, C) on each axis. The second power meter measures the voltage and electric current of the servo motor on one line from the C-axis, namely line W, and two lines from the A-axis, namely lines U and V. Each phase provides electrical power, and the phases are typically labeled as U, V, and W; these represent the three phases of alternating current. Connecting the A-axis to lines U and V helps maintain a balanced power distribution. In a three-phase system, distributing the load evenly across all three phases ensures efficient and stable operation. Spindles in CNC machines are responsible for the actual milling or cutting process. They often require higher power output compared to servo motors. Distributing the power across three phases helps in achieving higher torque and speed, contributing to better machining performance, like in the case of the A-axis, where connecting the motor to three phases helps balance the load across the power supply. This balance is crucial for stable and reliable operation. Spindle speed and rotation direction are critical parameters in machining. Connecting to three phases allows for precise control over these parameters, enabling the CNC machine to achieve accurate and efficient milling processes. The last power meter measures the voltage and current on three spindle lines, namely S1, S2, and S3. The purpose of measuring each axis of the CNC machine is to determine the energy profile of each axis when carrying out the milling process.
As in the example of the circuit for the X-axis shown in Figure 2b, it can be seen that the clamp-on sensor is connected to one of the three-phase X-axis lines, namely line W, and then the clamp-on is connected to the input ports 1 and 2 of the power meter. Furthermore, a parallel circuit from the same line is connected to input port 14 to obtain the voltage value on that line. The same connection pathway is also applied to the Y- and Z-axis. Furthermore, the power meter output ports 11 and 12 are connected to the computer via the RS-485 cable manufactured by Belden Inc., Belden Suzhou, China to collect the measurement results.
Figure 3a depicts the LCD display of the PA310 Clip-on CT Smart Power Meter. The LCD display serves as the user interface, providing real-time data and information regarding energy consumption, voltage, current, power factor, and other relevant electrical parameters. It offers a user-friendly interface for navigating through different menus, configuring settings, and viewing energy usage data. The display may include various features, such as backlighting for readability in various lighting conditions, numeric and graphical representations of data, and navigation buttons for ease of use. Figure 3b showcases the PA310 Clip-on CT Smart Power Meter as part of the Smartmeter line. This device is designed for accurate measurement and recording of both AC (alternating current) and DC (direct current) electrical parameters. It is equipped with advanced clip-on CT technology, allowing for non-intrusive installation and measurement of electrical currents without interrupting the circuit. The Smartmeter line may include various models and configurations tailored to different energy monitoring needs, with the PA310 being a prominent example. These meters are capable of monitoring power usage, voltage levels, current flow, power factor, and other critical parameters, enabling users to track and analyze energy consumption effectively for improved efficiency and cost management.
As show in Table 1, the line stands out for its extensive range of specifications, designed to cater to a diverse array of energy-monitoring requirements across various industrial and commercial settings. One of its key strengths lies in its adaptable voltage input, spanning from 10 V to 480 V, ensuring compatibility with a wide range of electrical systems encountered in different environments. This versatility extends to current input options, where users can choose between internal CTs rated at 5 A or opt for clip-on CTs available in various diameters, accommodating currents ranging from 10 mA to a substantial 1000 A. Additionally, the auxiliary power support for X-, Y-, Z-, A-, and C-axes further enhances its usability, offering a voltage input range of 100–240 VAC while consuming only 1 A and 5 VA. In particular, the kWh accuracy of the PA310 Smartmeter line is exceptional, boasting precision levels of less than 0.5% for unity power factor and maintaining accuracy below 1% for power factors between 0.5 and 1, exceeding the stringent requirements set by IEC 62053-21 standard [37]. With such comprehensive features and high-level accuracy, the PA310 Smartmeter line emerges as a dependable solution for a wide range of energy-monitoring applications, providing users with reliable data for efficient energy management and optimization strategies in their operations.
In other research, the implementation of PA-310 power meters also maintains better accuracy of 1% even under low-current conditions (<5 A); thus, it can still be used in a medium- to high-voltage system [38], and it was undertaken to systematically monitor the entirety of electricity consumption [39]. The power meters were positioned inside the machine panel box. Furthermore, the amount of power was recorded and collected every five seconds during the experiment. Figure 4 illustrates the installation of the system in the electrical panel, including four distribution boards (these are panels that distribute electrical power to various components in the CNC machine), three PA-310 power meters (they provide information about the current, voltage, power factor, and other electrical parameters), and a dedicated server (which could be responsible for data storage, processing, and possibly communication with other manufacturing systems).
At the beginning, the current transformer (CT) sensor was installed on the cable of the motor that would be monitored, and then the monitoring and data collection were conducted. It is noteworthy that each PA-310 power meter integrates three current transformers, enabling the concurrent monitoring of three circuits. This thoughtful design ensures comprehensive knowledge of the patterns of power use inside our experiment while simultaneously improving operating efficiency and facilitating targeted data collection.
2.2.2. Cutting Path and Parameters
While power consumption monitoring in CNC machining has indeed been explored by various researchers, the distinctive aspect of our study lies in the careful consideration given to the comprehensive monitoring of power consumption across multiple axes and the spindle motor. Rather than solely emphasizing the overall power consumption, our research delves into the nuanced power dynamics of individual axes and the spindle motor during real processes. This granularity allows us to uncover specific energy consumption patterns, offering a more detailed understanding of how power is utilized in the context of different machining operations. Our approach leverages the capabilities of a 3D model from NX simulation, allowing us to measure and analyze power consumption with respect to each parameter. In order to improve the accuracy of the observations, the simulation data are considered, offering better insight into the relationship between machining parameters and power usage. Therefore, it will provide a comprehensive perspective on the energy usage in CNC machining operations.
Furthermore, we varied the cutting parameters to study their impact on power consumption. We experimented with different widths of cut of 1–3 mm, depths of cut of 0.5–1.5 mm, and spindle speeds of 4000, 6000, and 8000 rpm during the cutting process, as shown in Figure 5. The top-right view allow us to observe how the tool engages with the workpiece along the patterns, which is essential for comprehending the power requirement, and these variations allowed us to analyze power consumption patterns under different cutting conditions. We designed a circular cutting path to involve the C-axis cutting. The cutting tool follows circular paths in the C-direction until the entire surface is completely cut. Throughout this process, the base of the turning table continuously rotates in the C-axis, allowing us to observe the power consumption in this axis. The obtained experimental results present the power consumption values of the X-, Y-, Z-, A-, and C-axes of the servo motor and the spindle motor and illuminate the specific energy requirements of each component during machining.
2.3. Materials and Equipment
The Hartford 5A-25R 5-axis Machining Center is a high-performance and versatile industrial machine designed for precision machining tasks [40]. With advanced features and specifications, this machine is engineered to meet the demands of modern manufacturing processes. The X- and Y-axes are equipped with 2.18 kW drive motors each, ensuring smooth and controlled movements along the longitudinal and cross-travel directions. The Z-axis features a powerful 3.5 kW drive motor for vertical movements, allowing efficient machining operations at varying depths. The detail specifications of the machine are shown in Table 2.
For the CNC 5-axis machine line adhering to Industry 4.0 principles, the Harford 5A-25R, depicted in Figure 5, is equipped with connectivity features enabling seamless communication with other manufacturing systems. This connectivity enhances automation capabilities, allowing seamless integration into smart manufacturing environments. Extensive scrutiny is applied to the integration of machine learning in CNC machine tools, with the aim of improving component production stability and minimizing the risk of unexpected failures. The optimization of cutting parameter settings in turning processes is accomplished by employing a response surface approach and machine learning technology. In end milling operations, a machine learning methodology, specifically the Nelder–Mead simplex method, has been developed to optimize the machining variables.
The Micro Grain Carbide End mill series of the CEXV30600 cutter tool manufactured by Hon Jan Cutting Tools Co., Ltd., Taichung, Taiwan with a diameter of 6 mm and 3 Flutes was used for the experiment, as shown in Table 3. With a well-designed cutting edge, this tool delivers efficient material removal and contributes high precision, performance, and efficiency for aluminum machining applications [41]. The aluminum alloy 6061-T6 manufactured by Crown Aluminum Co., Ltd., Kaohsiung, Taiwan with dimensions of 100 × 35 × 50 mm and properties as shown in Table 4 was used as the workpiece material [42,43,44,45]. With favorable characteristics like good thermal conductivity, moderate hardness, and excellent machinability, it allows for efficient material removal and precise machining operations on 5-axis CNC machines. The Erowa PowerChuck clamping system with model ER-045076 and uniholder ER-129071 were used in the experiment. Erowa PowerChuck ER-045076 has a diameter of 100 mm and a repeatability of 2 μm, and it is operated by air pneumatic; it was used to hold Erowa uniholder ER-129071. The aluminum workpiece was attached to the uniholder with the M8 threaded and then installed on the powerchuck, as shown in Figure 4b.
The choice of using aluminum alloy 6000 series in this research can be attributed to several key properties that make this alloy suitable for machining processes, especially in the context of CNC milling. Aluminum alloys like 6111 are commonly employed in the production of automotive exterior or body panels. Inner body panels utilize aluminum alloys, such as 5754 and 5083, whereas bonnets are crafted from 6111 [46]. It is relatively easy to cut, drill, and machine, making it suitable for CNC milling processes. This is essential in achieving precision and intricate shapes in the machining operations. The alloy 6000 series’ significant advantage lies in their high strength-to-weight ratio and their ease of fabrication, making them an excellent choice for replacing steel and cast-iron components [47,48]. It provides sufficient strength for structural applications while remaining lightweight. This characteristic is particularly important in industries like the aerospace and automotive industries, where reducing overall weight without compromising strength is crucial. It is also versatile, and it can be heat-treated to achieve varying levels of strength. This allows for tailoring the material properties to meet specific requirements in different applications The corrosion-resistant properties of aluminum alloys make them ideal for marine applications. They are used in boat construction, shipbuilding, and various marine components due to their durability in saltwater environments [49].
3. Results and Discussion
3.1. Energy Data Analysis
In this research, a deliberate selection has been made of four key factors carefully chosen to be the focus of the investigation ((1) spindle speed, (2) feed rate, (3) width of cut, and (4) depth of cut) as the focal points of the investigation, with each of these parameters explored across three distinct levels, as detailed in Table 5.
In the conventional experimental approach to measuring compressive strength, researchers typically consider four factors, each at three different levels. Using a full factorial design in this context would entail conducting a considerable 243 experiments. In the machine learning experiment, we use 243 datasheets divided into 162 datasets for training and 81 datasets for testing. This approach not only optimizes resource utilization but also ensures a comprehensive understanding of the factors affecting compressive strength. Extending beyond the experimental results, we applied various regression methods to predict power consumption for each axis and the spindle motor based on the cutting parameters. The subsequent step involves a thorough comparison between the predictions generated by each regression method and the actual power consumption observed during real milling processes. This comparative analysis aims to evaluate the accuracy and reliability of each regression method in predicting power consumption for different machine components. The ensuing discussion will delve into the strengths and limitations of each regression method, providing insights into their effectiveness in capturing the intricate relationships between cutting parameters and power consumption in CNC machining. This comprehensive approach not only contributes valuable empirical data but also enhances our understanding of the predictive capabilities of regression models in the realm of energy consumption monitoring in CNC machining.
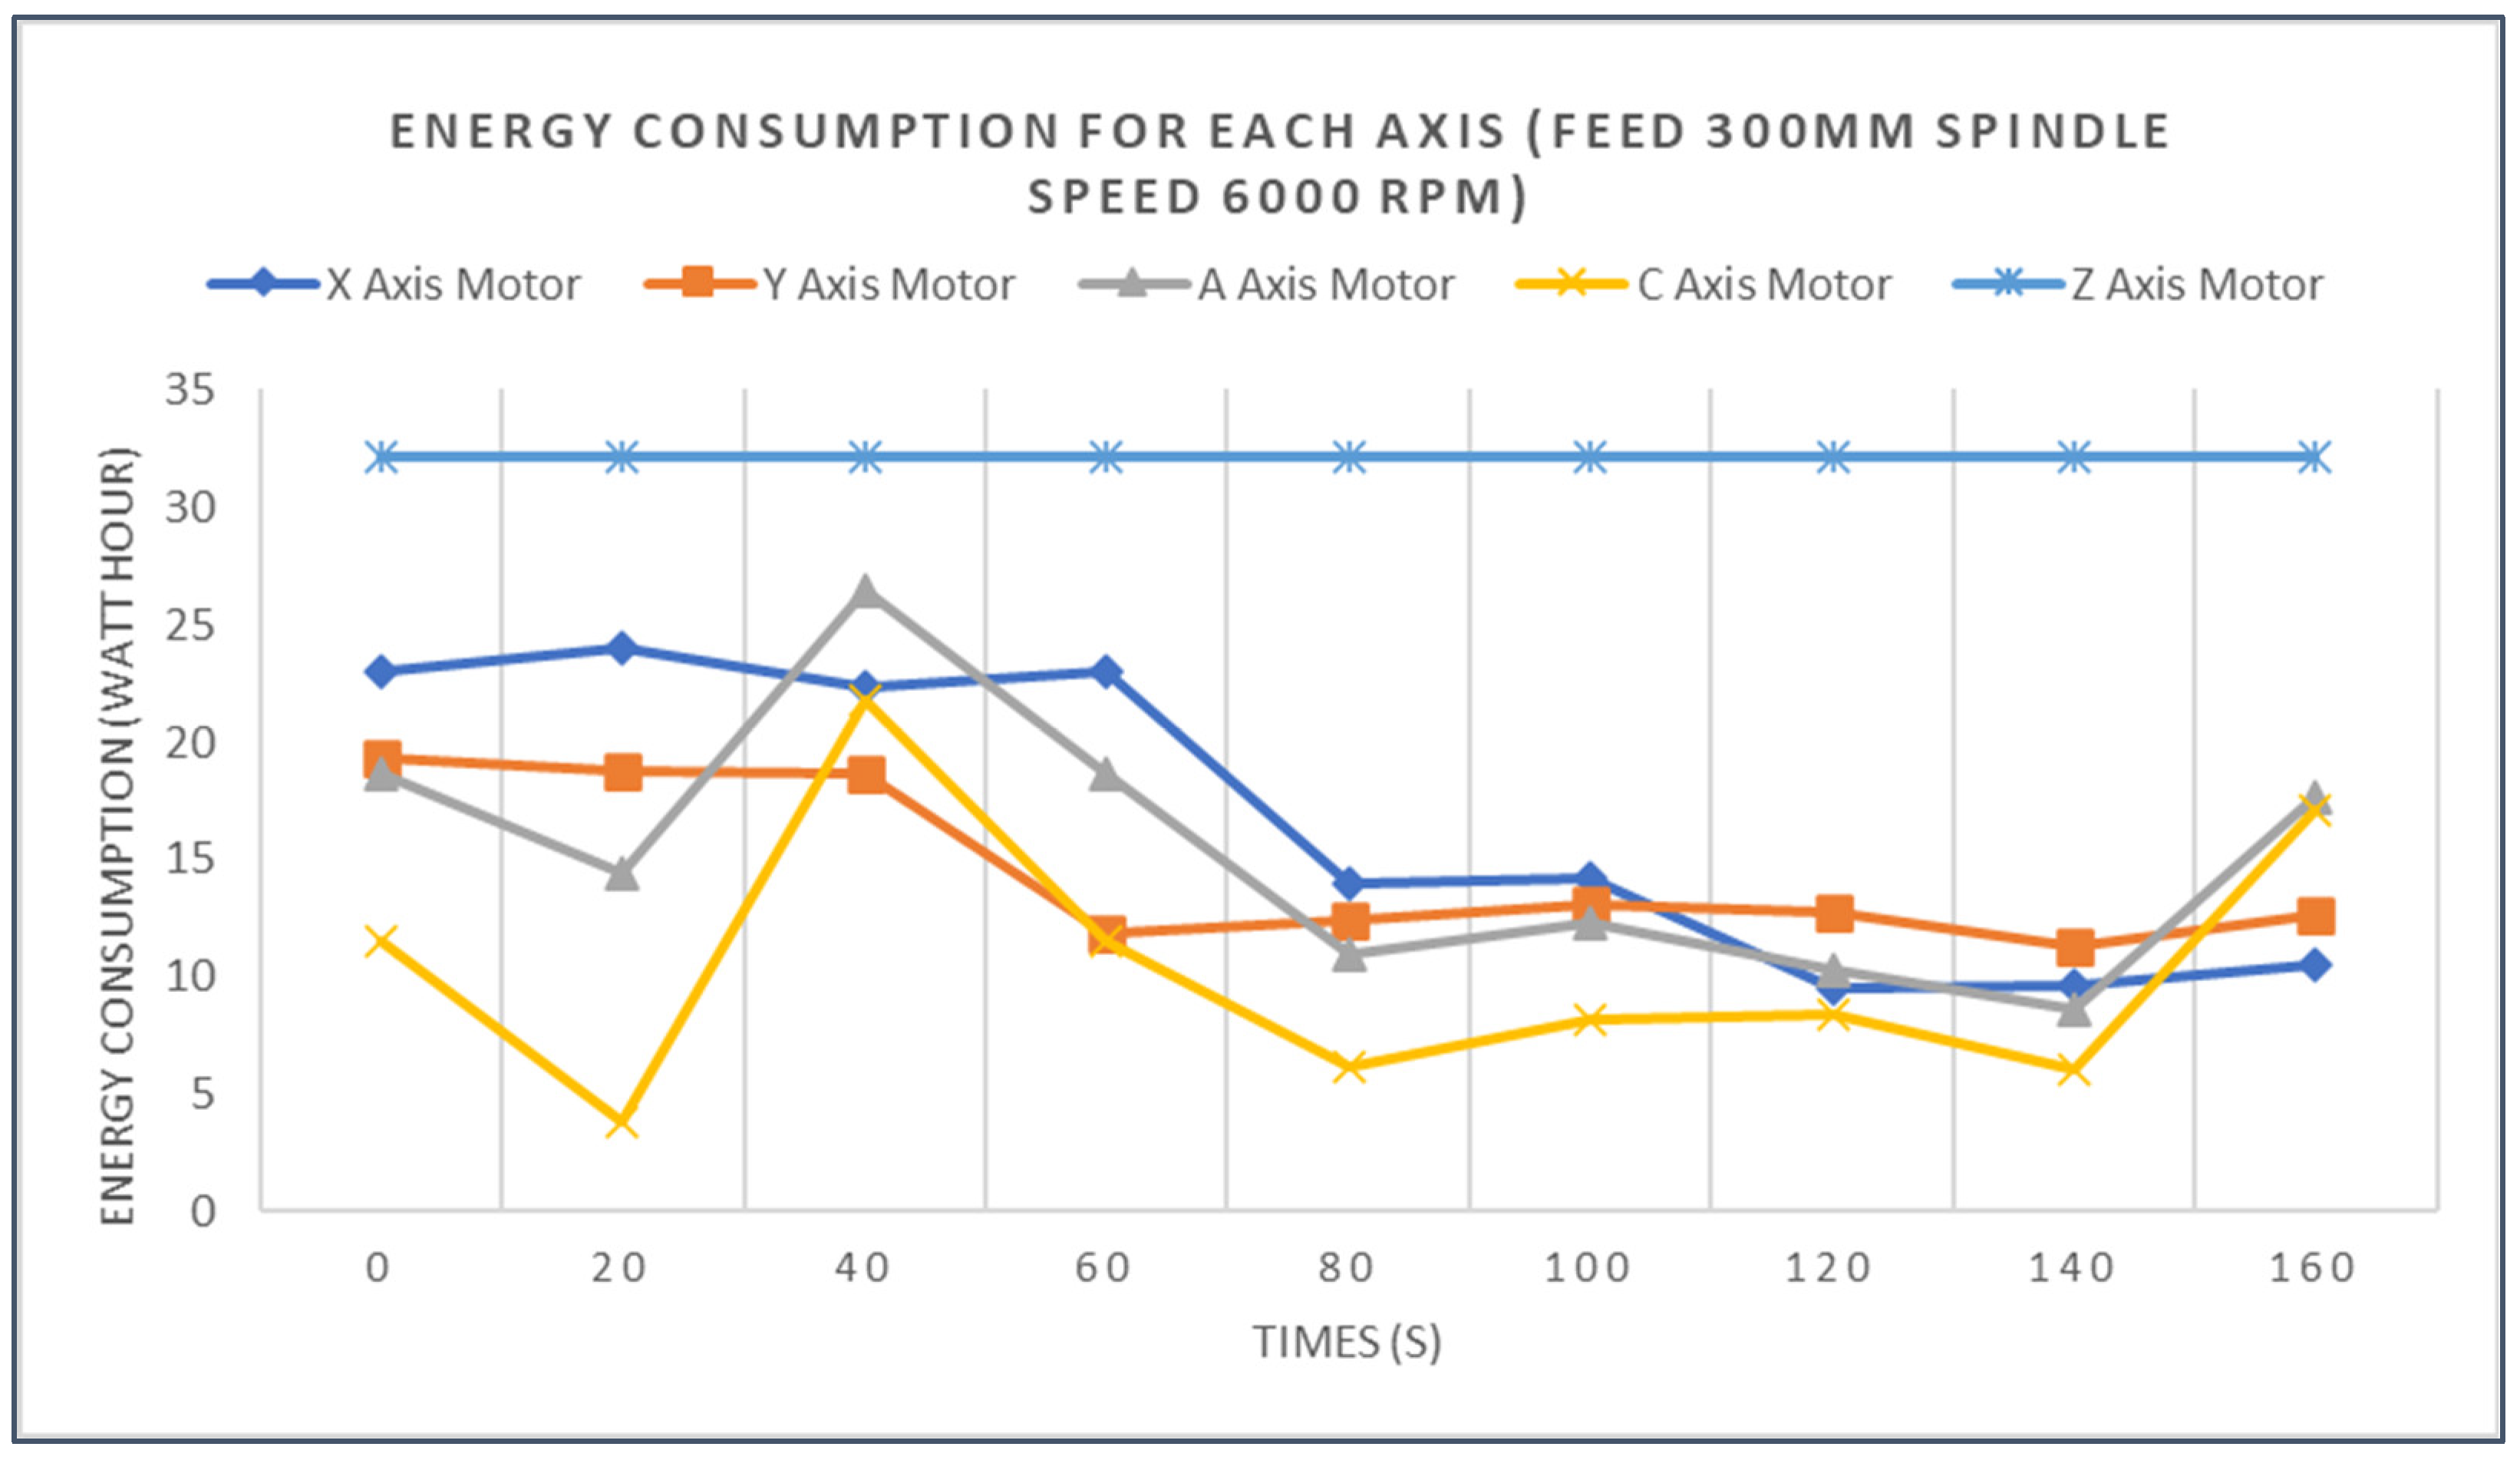
The provided data seem to represent the energy consumption (in Wh) and time (in seconds) associated with different machining configurations for the X-axis motor, Y-axis motor, A-axis motor, C-axis motor, and Z-axis motor under various feed rates. Each row corresponds to a specific machining scenario denoted by the tool type (X), the feed rate, and the specific configuration within that category (spindle speed 6000 rpm). The provided data appear, as shown in Figure 6, to be a tabular representation of various machining parameters and energy consumption values for different machining processes and tools. Upon analysis, it is evident that each row corresponds to a specific machining scenario, denoted by a code indicating the type of cut (e.g., A, C, X, Z), the specific tool used, and additional parameters, such as feed rate and time.
The time required for each machining scenario also varies. Longer machining times are generally associated with higher energy consumption, but this relationship is not strictly linear. The data indicate that energy consumption in machining is influenced by various factors, including the type of motor, feed rate, and specific machining configuration. Analyzing these patterns can contribute to efficient machining processes for overall performance.
The Lifecycle Assessment (LCA) conducted in this research extends its focus beyond immediate energy efficiency calculations, aiming to comprehensively evaluate the environmental implications across the entire lifespan of the machining system. This involves a thorough analysis of critical factors, such as material sourcing (6061-T6), production processes (cutting tools, cutting path), transportation, machine utilization (time), and end-of-life management. Aligned with the core objectives of LCA, this study underscores its commitment to sustainability, providing a robust framework for assessing the environmental impact of CNC machining operations. In future research endeavors, there is potential to leverage LCA methodologies in quantifying the complete lifecycle. This assessment can guide decisions towards more environmentally responsible practices in CNC machining processes. This research places emphasis on the material removal rate (MRR) during specific milling operations, recognizing its pivotal role in the overall environmental impact. The established correlations between electricity consumption, MRR, and environmental impact per functional unit contribute depth to the analysis.
One significant finding underscores the consistent contribution of the cutting tool, ranging from 98% to 99%, to the total environmental impact. This highlights the crucial role of the cutting tool in the environmental footprint of machining operations, prompting considerations for optimizing tool usage and understanding the factors influencing tool-related emissions. The detailed exploration of the electricity consumption and environmental impact mix further emphasizes the dominance of electricity-related greenhouse gas emissions in the milling process. The discussion of electricity-linked impacts reveals that milling accounts for 92.6%, with machine idling contributing 7.4%. This insight provides a fundamental understanding of the key contributors to environmental consequences in machining operations. Importantly, the research encourages informed decision making aimed at mitigating lifecycle analysis of CNC machining processes. By fostering more sustainable and environmentally conscious manufacturing practices, this study contributes to the broader goal of reducing the environmental impact associated with machining operations.
The exploration of impact contributions and environmental considerations extends to the comparison between solid cutting tools and inserted cutters, shedding light on potential avenues for emission reduction in machining processes. In a brief simulation using a 40 mm diameter tool equipped with six inserted cutters, each possessing four cutting edges and weighing 2 g, the environmental impact was assessed [50]. The tool, along with the inserted cutters, is constructed from tungsten carbide, aligning with the material used in the solid cutting tools. The total weight of the 40 mm tool with inserted cutters is 168 g. The simulated electricity consumption of this process with inserted cutters is reported to be 9.70 Wh, resulting in a calculated impact of 0.31 g (market-based) and 0.58 g (location-based) CO2-eq. Notably, the inserted cutters experience a marginal 0.22% reduction in tool life. The specific impact attributed to the inserted cutters is quantified at 0.36 g CO2-eq. In comparison to the experimental results obtained from the solid cutting tool, the total environmental impact is significantly lower at 0.67 g (market-based) and 0.94 g (location-based) CO2-eq.
3.2. Statistical Analysis
The data presented in Table 6 encapsulate the R-squared goodness-of-fit derived from a full factorial design based on data that we have mentioned before, involving a comprehensive dataset of 243 data points across various factors. The remarkable fit of 87.21% signifies the model’s proficiency in elucidating the variations in energy consumption (Y), the dependent variable in this context. A higher R-squared value, approaching 1 or 100%, attests the model’s robustness in capturing the nuanced relationship between the factors considered and energy consumption. Of particular significance is the statistically significant role of spindle speed within our Linear Regression analysis, evident from a p-value below 1 percent. This underscores the substantial impact of spindle speed on energy consumption, emphasizing its pivotal role in the model. For instance, an increase in spindle speed every 2000 rpm correlates with a noteworthy reduction in energy consumption by 12 Wh, as observed in experiment 1.
Additionally, variations in the width of cut and depth of cut by 1 mm and 0.5 mm result in reduced energy consumption by 0.92 Wh and 6.60 Wh, respectively. Furthermore, alterations in feed rate by 300 mm/min contribute to an increase in energy consumption by up to 3.90 Wh. Notably, the combined impact of the spindle speed (increased every 1000 rpm), feed rate (set at 300 mm/min), width of cut (increased by 1 mm), and depth of cut (increased by 0.5 mm) synergistically leads to a substantial reduction in energy consumption by 9.6 Wh. This comprehensive analysis provides valuable insights into the intricate dynamics of the factors influencing energy consumption within the experimental framework.
While the other factors show some influence on energy consumption, their effects are not statistically significant. Examining the graphical representation of the data reveals noticeable distinctions between trial 1 and trial 3. In particular, when assessing the relationship between residuals (predicted values) and percentages (true values), the proximity of data points to the regression line is indicative of the modeling regression’s quality. A close alignment between the dots and the regression line suggests a robust and accurate representation of the relationship between the factors and energy consumption. The findings underscore the importance of spindle speed in influencing energy consumption, emphasizing its significant role in the model.
In the Taguchi analysis, the consideration of “smaller is better” is informed by extensive literature review findings, which highlight that lower energy consumption correlates with reduced manufacturing costs. This design philosophy aligns with sustainability goals, making it imperative to minimize the environmental impact and economic expenses associated with energy usage in manufacturing processes. The concept of response noise, depicted in Figure 6, serves as a measure of robustness. Robustness is crucial in identifying control factor settings that mitigate the influence of external variability or noise on the response. This emphasis on robustness ensures that the designed system or process remains resilient and consistent in its performance, even in the presence of uncontrollable factors. The interpretation of Figure 7 involves assessing the main effects of control factors on the response. When the line is horizontal and parallel to the X-axis, it indicates the absence of a main effect. In this scenario, each level of the factor has a uniform impact on the response, and the mean response remains consistent across all factor levels. On the other hand, when the line deviates from horizontal, a main effect is present. Different levels of the factor exert varying influences on the response. The slope of the line provides insight into the magnitude of the main effect; a steeper slope signifies a more pronounced impact on the response variable.
In this research, built upon the current milling process data using a CNC five-axis machine, the correlation coefficients between the considered four factors are depicted in Figure 7. It is notable that for certain factors, such as the spindle speed, feed rate, width of cut, and depth of cut, positive correlations are represented by darker shades of blue and negative correlations are represented by lighter shades of blue to conduct a more comprehensive assessment of the performance of the machine learning models. The results of the correlation analysis show that two factors have a strong correlation: spindle speed and energy consumption.
3.3. Machine Learning Analysis
To conduct a more comprehensive assessment of the performance of the machine learning models, the results of the correlation analysis show that there is has strong correlation between spindle speed and energy consumption. Multiple regression analysis can be conducted due to the robust correlation of other factors with energy dissipation. The spindle speed should be given greater attention compared to other factors in the optimization of energy consumption calculations. This observation suggests that the variable we previously referred to as height variation significantly influences the predictive efficacy of machine learning models. We provide a graphical representation that aids in comprehending the interrelationships and dependencies among variables, offering valuable insights into the dataset’s structure and potential predictors, as shown in Figure 8.
The evaluation of various regression algorithms for predicting power consumption in the five-axis CNC machining process, as detailed in Table 7, highlights the dominant efficacy of the Decision Tree Regressor and the Random Forest Regressor. While linear models exhibit commendable performance, as seen in Table 7, the Mean Squared Error (MSE) of the Decision Tree and Random Forest models showed 17.97 and 18.28, almost half of the MSE values of Linear Regression, Lasso Regression, and Ridge Regression, which were 35.78, 39.78, and 35.91, respectively. Meanwhile, the Root Mean Square Error (RMSE) value also exhibited lower values for both Decision Tree and Random Forest Regression, which were 4.24 and 4.28, respectively. Regarding the Mean Absolute Error (MAE) values, the similar trend of lower values for Decision Tree and Random Forest models was also displayed. Consequently, the Decision Tree and Random Forest models produce better accuracy in prediction results. In addition to the lower RMSE, the MSE and MAE values implied higher accuracy of the regression model. However, the coefficient of determination (R-squared, Rsq) values that represent the proportion of the variance in the dependent variable were used for explaining how well the independent variable in the Linear Regression models explains the variability in the dependent variable. A higher value of R-squared is considered desirable. As shown in Table 7, the Decision Tree and Random Forest models exhibited 87%, which was higher than the values of Linear Regression (74%), Lasso Regression (72%), and Ridge Regression (74%). The higher R-squared value is evidence of their robustness in elucidating the variability in power consumption. This resilience to non-linear relationships is particularly crucial in the complex CNC machining process, where the Decision Tree and Random Forest models showcase a more profound understanding of the system’s complexities. Their practical applicability is further emphasized by their potential for accurate prediction in real-world scenarios, making them compelling choices for evaluating energy efficiency in five-axis CNC machining processes.
The performance comparison across different algorithms is visually represented in Figure 9. Each algorithm’s effectiveness in predicting outcomes is assessed by comparing the experiment data (depicted by the blue dots) against the predicted data (visualized as the black dashed line). As seen in Figure 9, the Random Forest and Decision Tree algorithms exhibit the most favorable results, indicating the lowest error between the actual and predicted data. The success of the Random Forest and Decision Tree methods in achieving optimal results can be attributed to their inherent strengths in capturing complex relationships within the dataset and handling non-linear patterns and intricate dependencies among variables. These models excel in situations where relationships between predictors and the dependent variable are dynamic and multifaceted, which is often encountered in real-world datasets. The selection of the algorithm depends on the nature of the dataset and the specific characteristics of the relationship between variables.
The broader comparison of machine learning regression and classification methods introduces a noteworthy observation—most classification approaches surpass expectations in regression and show lower errors. The subsequent exploration of Decision Tree and Random Forest classifiers in constructing predictive models for power consumption and its independent variables reveals their viability. In particular, the significance of spindle speed is underscored in Figure 10, which demonstrates a substantial deviation in its importance compared to other features. This implies that analyzing results solely based on spindle speed can provide valuable insights; however, the experiment emphasizes the imperative of a comprehensive examination of all features. This underscores the nuanced interplay between spindle speed, width of cut, feed rate, and depth of cut, reinforcing the importance of evaluating features’ importance comprehensively for a holistic understanding of their collective impact on overall information comprehensiveness. In essence, these analyses deepen our understanding of the intricacies involved in selecting and interpreting machine learning models and features, providing valuable insights for predictive accuracy in the context of energy consumption prediction in CNC machining processes.
4. Conclusions
In order to achieve sustainability as a whole, every aspect, from energy calculation to lifecycle analysis, is essential. This all-encompassing strategy seeks to improve industrial techniques that are more responsible and efficient while also helping the environment. Using machine learning to estimate energy consumption in machining operations seems to be a reliable and successful approach. The complicated and dynamic nature of machining operations can be better understood and predicted through advanced algorithms, contributing to more accurate estimations of energy usage. By employing machine learning, we can discern patterns, optimize parameters, and refine predictions, ultimately establishing a comprehensive and reliable method for energy consumption forecasting in machining. The comprehensive exploration of energy consumption in a five-axis CNC machining process has yielded profound insights into the intricate dynamics governing power usage. A meticulous measurement setup involving three power meters strategically positioned across the X-, Y-, Z-, A-, and C-axes provided a granular understanding of the energy profile during milling operations. The integration of clamp-on current sensors and direct voltage measurements exhibits a commitment to precision in capturing the nuances of current and voltage on each axis.
The emphasis on designing cutting paths for individual axes, particularly the A-axis, with its distinctive 20° curved surface milling, illuminated the machine’s working space limitations and the consequential impact on power consumption. The deliberate variation of cutting parameters, including the width of cut, depth of cut, and spindle speeds, served as a controlled experimentation ground. These variations unveiled discernible patterns in power consumption, establishing a foundational understanding of how these parameters influence energy dynamics. The conventional regression analysis, with a remarkable goodness-of-fit of 87.21%, underscored the significance of spindle speed as a pivotal factor influencing energy consumption. The linear relationship demonstrated a tangible reduction of 6 Wh for every 1000 rpm increase in spindle speed, providing a quantitative measure of its impact. Furthermore, the Taguchi analysis reinforced the importance of minimizing energy consumption, aligning with broader sustainability goals by acknowledging the environmental and economic implications of manufacturing processes. The correlation analysis unveiled a strong positive correlation between spindle speed and energy consumption, affirming its central role in the energy dynamics of the CNC machining process. The subsequent application of machine learning models, notably the Decision Tree Regressor and Random Forest Regressor, demonstrates their prowess in predicting power consumption with superior accuracy. This not only validated the findings from the regression analysis but also highlighted the potential of advanced computational approaches in energy efficiency.
The methodological breadth of this study, spanning energy calculation efficiency and lifecycle analysis, offers immediate practical applications for industry professionals. The meticulous measurement setups showcased provide a detailed overview of energy profiles during milling operations, thus enabling manufacturers to optimize machining precision and efficiency. The recognition of cutting path design impacts, particularly for axes with distinctive features, emphasizes the importance of thoughtful planning for refining paths, minimizing energy consumption, and enhancing operational efficiency. However, acknowledging the study’s limitations is crucial, with the controlled experimentation’s scope possibly not fully capturing real-world variations, prompting the need for broader scenarios in future research. Additionally, focusing on a specific five-axis CNC machine raises considerations of machine-specific factors, suggesting the incorporation of diverse machine models for a more comprehensive understanding. Future research directions involve a Lifecycle Assessment (LCA) for a holistic environmental view, comparative studies guiding sustainable decision making, and exploration of real-time monitoring systems for adaptive methods. These avenues aim to bridge research findings with practical applications, ensuring a holistic and sustainable approach to energy consumption in CNC machining processes.
Author Contributions
Conceptualization, H.G. and I.N.; methodology, H.G. and I.N.; validation, H.G. and I.N.; formal analysis, H.G. and I.N.; investigation, H.G. and I.N.; resources, H.-Y.C.; data curation, H.-Y.C.; writing—original draft preparation, I.N.; writing—review and editing, H.G. and I.N.; visualization, I.N.; supervision, H.G. All authors have read and agreed to the published version of the manuscript.
Funding
This research was funded by the Ministry of Science and Technology (MOST) of Taiwan under the grant number 110-2622-8-033-002-SB.
Institutional Review Board Statement
Not applicable.
Informed Consent Statement
Not applicable.
Data Availability Statement
Data are contained within the article.
Acknowledgments
We extend our heartfelt gratitude to Najmuddin Yahya for his instrumental contribution to the collection and analysis of electrical data. Thanks to Kevin Chen, another esteemed lab member, who played a crucial role in supporting the 3D model analysis.
Conflicts of Interest
The authors declare no conflicts of interest.
Nomenclature
| Error for the Decision Tree | E | Total energy consumed | |
| Count of incorrectly categorized data entries | Baseline or initial power consumption | ||
| Penalty complexity of the model | Specific milling energy for a given workpiece material | ||
| Total number of training records | Q | Material removal rate | |
| Number of nodes in the Decision Tree | Cutting time | ||
| Number of training records classified by node t | Dependent variable | ||
| Count data entries for node t | Parameter estimation for Linear Regression | ||
| takes values from 1 to (inclusive) | Independent variables | ||
| Fluctuations | Observed value of dependent variable | ||
| Unobserved random error for the i-th observation | i-th observation of the j-th predictor variable | ||
| Number of predictors | Sample size |
References
- Javaid, M.; Abid, H.; Pratap Singh, R.; Rab, S.; Suman, R. Upgrading the manufacturing sector via applications of Industrial Internet of Things (IIoT). Sens. Int. 2021, 2, 100129. [Google Scholar] [CrossRef]
- Karmakar, A.; Dey, N.; Baral, T.; Chowdhury, M.; Rehan, M. Industrial Internet of Things: A Review. In Proceedings of the 2019 International Conference on Opto-Electronics and Applied Optics (Optronix), Kolkata, India, 18–20 March 2019; pp. 1–6. [Google Scholar]
- Kashpruk, N.; Piskor-Ignatowicz, C.; Baranowski, J. Time Series Prediction in Industry 4.0: A Comprehensive Review and Prospects for Future Advancements. Appl. Sci. 2023, 13, 12374. [Google Scholar] [CrossRef]
- Xu, K.; Luo, M.; Tang, K. Machine based energy-saving tool path generation for five-axis end milling of freeform surfaces. J. Clean. Prod. 2016, 139, 1207–1223. [Google Scholar] [CrossRef]
- Hu, L.; Zha, J.; Kan, F.; Long, H.; Chen, Y. Research on a Five-Axis Machining Center Worktable with Bionic Honeycomb Lightweight Structure. Materials 2021, 14, 74. [Google Scholar] [CrossRef] [PubMed]
- Taye, M.M. Understanding of Machine Learning with Deep Learning: Architectures, Workflow, Applications and Future Directions. Computers 2023, 12, 91. [Google Scholar] [CrossRef]
- Elahi, M.; Afolaranmi, S.O.; Martinez Lastra, J.L.; Perez Garcia, J.A. A comprehensive literature review of the applications of AI techniques through the lifecycle of industrial equipment. Discov. Artif. Intell. 2023, 3, 43. [Google Scholar] [CrossRef]
- Sah, S.; Krishnan, M.; Elangovan, R. Optimization of energy consumption for indoor climate control using Taguchi technique and utility concept. Sci. Technol. Built Environ. 2021, 27, 1473–1491. [Google Scholar] [CrossRef]
- Yang, H.; Ran, M.; Feng, H. Improved Data-Driven Building Daily Energy Consumption Prediction Models Based on Balance Point Temperature. Buildings 2023, 13, 1423. [Google Scholar] [CrossRef]
- Ramos, D.; Faria, P.; Morais, A.; Vale, Z. Using decision tree to select forecasting algorithms in distinct electricity consumption context of an office building. Energy Rep. 2022, 8, 417–422. [Google Scholar] [CrossRef]
- Pan, J.; Li, C.; Tang, Y.; Li, W.; Li, X. Energy Consumption Prediction of a CNC Machining Process with Incomplete Data. IEEE/CAA J. Autom. Sin. 2021, 8, 987. [Google Scholar] [CrossRef]
- Brillinger, M.; Wuwer, M.; Abdul Hadi, M.; Haas, F. Energy prediction for CNC machining with machine learning. CIRP J. Manuf. Sci. Technol. 2021, 35, 715–723. [Google Scholar] [CrossRef]
- Cao, J.; Xia, X.; Wang, L.; Zhang, Z.; Liu, X. A Novel CNC Milling Energy Consumption Prediction Method Based on Program Parsing and Parallel Neural Network. Sustainability 2021, 13, 13918. [Google Scholar] [CrossRef]
- Tercan, H.; Meisen, T. Machine learning and deep learning based predictive quality in manufacturing: A systematic review. J. Intell. Manuf. 2022, 33, 1879–1905. [Google Scholar] [CrossRef]
- Sarker, I.H. Machine Learning: Algorithms, Real-World Applications and Research Directions. SN Comput. Sci. 2021, 2, 160. [Google Scholar] [CrossRef]
- Qin, J.; Hu, F.; Liu, Y.; Witherell, P.; Wang, C.C.L.; Rosen, D.W.; Simpson, T.W.; Lu, Y.; Tang, Q. Research and application of machine learning for additive manufacturing. Addit. Manuf. 2022, 52, 102691. [Google Scholar] [CrossRef]
- Lee, J.A.; Sagong, M.J.; Jung, J.; Kim, E.S.; Kim, H.S. Explainable machine learning for understanding and predicting geometry and defect types in Fe-Ni alloys fabricated by laser metal deposition additive manufacturing. J. Mater. Res. Technol. 2023, 22, 413–423. [Google Scholar] [CrossRef]
- Çınar, Z.M.; Abdussalam Nuhu, A.; Zeeshan, Q.; Korhan, O.; Asmael, M.; Safaei, B. Machine Learning in Predictive Maintenance towards Sustainable Smart Manufacturing in Industry 4.0. Sustainability 2020, 12, 8211. [Google Scholar] [CrossRef]
- Härdle, W.K.; Prastyo, D.D. Chapter 7—Embedded Predictor Selection for Default Risk Calculation: A Southeast Asian Industry Study. In Handbook of Asian Finance; Gregoriou, G.N., Chuen, D.L.K., Eds.; Academic Press: San Diego, CA, USA, 2014; pp. 131–148. [Google Scholar]
- Zou, H.; Hastie, T. Regularization and Variable Selection via the Elastic Net. J. R. Stat. Society. Ser. B 2005, 67, 301–320. [Google Scholar] [CrossRef]
- Andriopoulos, V.; Kornaros, M. LASSO Regression with Multiple Imputations for the Selection of Key Variables Affecting the Fatty Acid Profile of Nannochloropsis oculata. Mar Drugs 2023, 21, 483. [Google Scholar] [CrossRef]
- Schreiber-Gregory, D. Ridge Regression and Multicollinearity: An In-Depth Review. Model Assist. Stat. Appl. 2018, 13, 359–365. [Google Scholar] [CrossRef]
- Enwere, K.; Nduka, E.; Ogoke, U. Comparative Analysis of Ridge, Bridge and Lasso Regression Models in the Presence of Multicollinearity. IPS Intelligentsia Multidiscip. J. 2023, 3, 1–8. [Google Scholar] [CrossRef]
- Debeljak, M.; Džeroski, S. Decision Trees in Ecological Modelling. In Modelling Complex Ecological Dynamics; Springer: Berlin/Heidelberg, Germany, 2011; pp. 197–209. [Google Scholar]
- Camana, M.; Ahmed, S.; García, C.; Koo, I. Extremely Randomized Trees-Based Scheme for Stealthy Cyber-Attack Detection in Smart Grid Networks. IEEE Access 2020, 8, 19921–19933. [Google Scholar] [CrossRef]
- Lindner, C. Chapter 1—Automated Image Interpretation Using Statistical Shape Models. In Statistical Shape and Deformation Analysis; Zheng, G., Li, S., Székely, G., Eds.; Academic Press: Cambridge, MA, USA, 2017; pp. 3–32. [Google Scholar]
- Schonlau, M.; Zou, R. The random forest algorithm for statistical learning. Stata J. Promot. Commun. Stat. Stata 2020, 20, 3–29. [Google Scholar] [CrossRef]
- Sun, S.; Cao, Z.; Zhu, H.; Zhao, J. A Survey of Optimization Methods From a Machine Learning Perspective. IEEE Trans. Cybern. 2020, 50, 3668–3681. [Google Scholar] [CrossRef] [PubMed]
- Aminzadeh, M.; Mahmoodi, A.; Sabzehparvar, M. Optimal Motion-Cueing Algorithm Using Motion System Kinematics. Eur. J. Control 2012, 18, 363–375. [Google Scholar] [CrossRef]
- Sharma, N.; Chawla, V.; Chauhan, N. Comparison of machine learning algorithms for the automatic programming of computer numerical control machine. Int. J. Data Netw. Sci. 2020, 4, 1–14. [Google Scholar] [CrossRef]
- Dittrich, M.-A.; Uhlich, F.; Denkena, B. Self-optimizing tool path generation for 5-axis machining processes. CIRP J. Manuf. Sci. Technol. 2019, 24, 49–54. [Google Scholar] [CrossRef]
- Ghosh, T.; Martinsen, K. Generalized approach for multi-response machining process optimization using machine learning and evolutionary algorithms. Eng. Sci. Technol. Int. J. 2020, 23, 650–663. [Google Scholar] [CrossRef]
- Ahrens, A.; Hansen, C.B.; Schaffer, M.E. lassopack: Model selection and prediction with regularized regression in Stata. Stata J. 2020, 20, 176–235. [Google Scholar] [CrossRef]
- Awad, M.; Khanna, R. Machine Learning. In Efficient Learning Machines: Theories, Concepts, and Applications for Engineers and System Designers; Awad, M., Khanna, R., Eds.; Apress: Berkeley, CA, USA, 2015; pp. 1–18. [Google Scholar]
- Mehbodniya, A.; Khan, I.R.; Chakraborty, S.; Karthik, M.; Mehta, K.; Ali, L.; Nuagah, S.J. Data Mining in Employee Healthcare Detection Using Intelligence Techniques for Industry Development. J. Health Eng. 2022, 2022, 6462657. [Google Scholar] [CrossRef]
- Sarker, I.H.; Kayes, A.S.M.; Watters, P. Effectiveness analysis of machine learning classification models for predicting personalized context-aware smartphone usage. J. Big Data 2019, 6, 57. [Google Scholar] [CrossRef]
- IEC 62053-21; Electricity metering equipment–particular requirements–Part 21: Static meters for AC active energy (classes 0.5, 1 and 2). The International Electrotechnical Commission (IEC) Publication: Geneva, Switzerland, 2020.
- Arch Meter Corporation. PA310 Clip-on CT Power Meter. Available online: https://www.archmeter.com/en/product-303005/Clip-on-CT-Power-Meter-PA310.html (accessed on 26 November 2022).
- Rausser, G.; Strielkowski, W.; Streimikiene, D. Smart meters and household electricity consumption: A case study in Ireland. Energy Environ. 2017, 29, 131–146. [Google Scholar] [CrossRef]
- Harford 5 Axis AI Vertical Machining Center. Available online: https://www.hartford.com.tw/en/product/5A-40R (accessed on 25 December 2023).
- Precision Cutting Tools. S220 Carbide EX3 6*18C. Available online: http://www.cmtec.com.tw/admin/product_en/front/product.php?upid=4 (accessed on 20 January 2023).
- Li, S.; Sui, J.; Ding, F.; Wu, S.; Chen, W.; Wang, C. Optimization of Milling Aluminum Alloy 6061-T6 using Modified Johnson-Cook Model. Simul. Model. Pract. Theory 2021, 111, 102330. [Google Scholar] [CrossRef]
- Zaidi, S.R.; Ul Qadir, N.; Jaffery, S.H.; Khan, M.A.; Khan, M.; Petru, J. Statistical Analysis of Machining Parameters on Burr Formation, Surface Roughness and Energy Consumption during Milling of Aluminium Alloy Al 6061-T6. Materials 2022, 15, 8065. [Google Scholar] [CrossRef] [PubMed]
- Karakoç, E.; Çakır, O. Examination of surface roughness values of 6061-T6 aluminum material after machining and after anodizing process. Mater. Today Proc. 2023, 80, 32–39. [Google Scholar] [CrossRef]
- Ayuba, S.; Araoyinbo, A.; Elewa, R.; Biodun, M. Effect of Machining of Aluminium Alloys with Emphasis on Aluminium 6061 Alloy—A Review. IOP Conf. Ser. Mater. Sci. Eng. 2021, 1107, 012157. [Google Scholar]
- Poznak, A.; Freiberg, D.; Sanders, P. Automotive Wrought Aluminium Alloys. In Fundamentals of Aluminium Metallurgy; Woodhead Publishing: Sawston, UK, 2018; pp. 333–386. [Google Scholar]
- Shin, J.; Kim, T.; Kim, D.; Kim, D.; Kim, K. Castability and mechanical properties of new 7xxx aluminum alloys for automotive chassis/body applications. J. Alloys Compd. 2017, 698, 577–590. [Google Scholar] [CrossRef]
- Joseph, O.O.; Babaremu, K.O. Agricultural Waste as a Reinforcement Particulate for Aluminum Metal Matrix Composite (AMMCs): A Review. Fibers 2019, 7, 33. [Google Scholar] [CrossRef]
- Atif Wahid, M.; Siddiquee, A.; Khan, Z. Aluminum alloys in marine construction: Characteristics, application, and problems from a fabrication viewpoint. Mar. Syst. Ocean Technol. 2019, 15, 70–80. [Google Scholar] [CrossRef]
- Furberg, A.; Arvidsson, R.; Molander, S. Environmental life cycle assessment of cemented carbide (WC-Co) production. J. Clean. Prod. 2019, 209, 1126–1138. [Google Scholar] [CrossRef]
Figure 1.
Machine learning based on Data Mining from CNC 5-axis machine.

Figure 2.
Wiring diagram for (a) X-, Y-, Z-axis motor, (b) A- and C-axis motor, (c) spindle motor.

Figure 3.
(a) LCD display. (b) Smartmeter line, AC and DC record PA310 Clip-on CT Smart Power Meter.
Figure 3.
(a) LCD display. (b) Smartmeter line, AC and DC record PA310 Clip-on CT Smart Power Meter.

Figure 4.
(a) PA-310 power meter is installed to measure the current and voltage on the CNC 5-axis machine panel; each Smartmeter is dedicated to measuring the output of each axis motor, which are X, Y, Z, C, A, and the spindle speed motor; (b) Setup of workpiece on Erowa clamping system; (c) Hartford 5A-25R 5-axis Machining Center manufactured by SHE HONG INDUSTRIAL Co., Ltd., Taichung, Taiwan.

Figure 5.
NX 3D Siemens simulation cutting process from X-, Y-, Z-, C-, and A-axis with angle of 10 degrees. This level of granularity enables us to uncover specific energy consumption patterns, providing a detailed understanding of how power is utilized in the context of different machining operations.

Figure 6.
The measured power of the spindle X, Y, Z, A, and C motors.

Figure 7.
The interpretation involves assessing the main effects of control factors on the response.
Figure 7.
The interpretation involves assessing the main effects of control factors on the response.

Figure 8.
This graphical representation aids in understanding the interrelationships and dependencies among the variables, providing valuable insights into the dataset’s structure and potential predictors.
Figure 8.
This graphical representation aids in understanding the interrelationships and dependencies among the variables, providing valuable insights into the dataset’s structure and potential predictors.

Figure 9.
Performance comparison between true and predicted values among different algorithms.

Figure 10.
Comparative analysis of parameter significance for Decision Tree and Random Forest algorithms.
Figure 10.
Comparative analysis of parameter significance for Decision Tree and Random Forest algorithms.


Table 1.
Meter specifications of the PA-310 Smartmeter line.
| Subject | Detail Specification |
|---|---|
| Voltage input | 10–480 V |
| Current input | Internal CT: 5 A, Clip-on CT: CT Φ10 (10 mA~10 A or 30 mA~60 A), optional in CT Φ16 (50 mA~120 A) Φ24 (80 mA~200 A, Φ31.6 (0.5 A~400) Φ50.8 (1 A~1000 A) |
| AUX. Power (X/Y/Z/A/C) | 100–240 VAC, 1 A, 5 VA |
| kWh Accuracy | pf = 1, <0.5%, pf = 0.5, <1%, better than IEC 1036 |
Table 2.
Harford A-25R 5-axis Machining Center.
| Subject | Detail Specification |
|---|---|
| Electric Power Consumption | 20 kva |
| Machine Weight | 3300 kg |
| Motor Rated Output (X/Y/Z/A/C) | Spindle Drive Motor 7.5 kw X-, Y-, Z-, A-, C-Axis Drive Motor 2.18 kw/2.18 kw/3.5 kw/1.2 kw/1.7 kw |
| Stroke | X-axis (longitudinal travel): 350 mm Y-axis (cross-travel): 300 mm Z-axis (vertical travel): 250 mm A-axis (inclined): −120°~+30° C-axis (rotation): 360° |
| Feed (Rapid Traverse) (X/Y/Z/A/C) | 36,000 (OP: 40,000) mm/min |
| Spindle Speed | 12,000 rpm |
Table 3.
Tool specifications for CEXV30600.
| Subject | Value |
|---|---|
| Tool Type | Square |
| Diameter (mm) | 6 |
| Number Of Cutting Flutes | 3 |
| Shank Diameter (mm) | 6 |
| Cutting Length (mm) | 18 |
Table 4.
Workpiece material, aluminum alloy 6061-T6.
| Property | Value |
|---|---|
| Density (g/cc) | 2.7 |
| Hardness (Brinell) | 95 |
| Tensile Yield Strength (MPa) | 276 |
| Modulus of Elasticity (GPa) | 68.9 |
| Fatigue Strength (MPa) | 96.5 |
| Shear Modulus (GPa) | 26 |
| Shear Strength (MPa) | 207 |
| Thermal Conductivity (W/m-K) | 167 |
Table 5.
L9 orthogonal array for energy calculation.
| Spindle Speed (rpm) | Feed Rate (mm/min) | Width of Cut (mm) | Depth of Cuth (mm) | Machining Time (minutes) | Energy Cons (Wh) |
|---|---|---|---|---|---|
| 4000 | 300 | 1 | 0.5 | 15 | 50.46 |
| 4000 | 500 | 2 | 1.0 | 20 | 47.56 |
| 4000 | 700 | 3 | 1.5 | 25 | 40.62 |
| 6000 | 300 | 2 | 1.5 | 18 | 21.38 |
| 6000 | 500 | 3 | 0.5 | 22 | 47.57 |
| 6000 | 700 | 1 | 1.0 | 16 | 33.20 |
| 8000 | 300 | 3 | 1.0 | 12 | 12.74 |
| 8000 | 500 | 1 | 1.5 | 19 | 22.81 |
| 8000 | 700 | 2 | 0.5 | 14 | 26.39 |
Table 6.
Regression analysis of each factor with three repetitions.
| Term | Experiment 1 | Experiment 2 | Experiment 3 | |||
|---|---|---|---|---|---|---|
| Coef. | T-Value | Coef. | T-Value | Coef. | T-Value | |
| Constant | 80.5 | 5.87 * | 63.2 | 4.60 * | 76.5 | 4.38 * |
| Spindle Speed | −0.006 | −4.56 * | −0.004 | −3.55 * | −0.006 | −3.41 * |
| Feed Rate | 0.013 | 0.93 | 0.003 | 0.22 | 0.008 | 0.46 |
| Width of Cut | −0.920 | −0.33 | −0.280 | −0.10 | −3.400 | −0.95 |
| Depth of Cut | −13.20 | −2.35 ** | −6.020 | −1.07 | −4.600 | −0.64 |
| R-Square | 87.21% | 77.52% | 76.72% | |||
| R-Square (Adj) | 74.43% | 55.03% | 53.44% | |||
Note: *, ** indicate significance at the α levels of 1% and 10%.
Table 7.
Performance metrics with different algorithms.
| Model | RMSE | MSE | MAE | Rsq |
|---|---|---|---|---|
| Linear Regression | 5.98 | 35.78 | 4.71 | 0.74 |
| Lasso Regression | 6.31 | 39.78 | 5.03 | 0.72 |
| Ridge Regression | 5.99 | 35.91 | 4.72 | 0.74 |
| Decision Tree Regressor | 4.24 | 17.97 | 3.23 | 0.87 |
| Random Forest Regressor | 4.28 | 18.28 | 3.33 | 0.87 |
Disclaimer/Publisher’s Note: The statements, opinions and data contained in all publications are solely those of the individual author(s) and contributor(s) and not of MDPI and/or the editor(s). MDPI and/or the editor(s) disclaim responsibility for any injury to people or property resulting from any ideas, methods, instructions or products referred to in the content. |
© 2024 by the authors. Licensee MDPI, Basel, Switzerland. This article is an open access article distributed under the terms and conditions of the Creative Commons Attribution (CC BY) license (https://creativecommons.org/licenses/by/4.0/).
Share and Cite
MDPI and ACS Style
Nugrahanto, I.; Gunawan, H.; Chen, H.-Y. Innovative Approaches to Sustainable Computer Numeric Control Machining: A Machine Learning Perspective on Energy Efficiency. Sustainability 2024, 16, 3569. https://doi.org/10.3390/su16093569
AMA Style
Nugrahanto I, Gunawan H, Chen H-Y. Innovative Approaches to Sustainable Computer Numeric Control Machining: A Machine Learning Perspective on Energy Efficiency. Sustainability. 2024; 16(9):3569. https://doi.org/10.3390/su16093569
Chicago/Turabian StyleNugrahanto, Indrawan, Hariyanto Gunawan, and Hsing-Yu Chen. 2024. "Innovative Approaches to Sustainable Computer Numeric Control Machining: A Machine Learning Perspective on Energy Efficiency" Sustainability 16, no. 9: 3569. https://doi.org/10.3390/su16093569
Note that from the first issue of 2016, this journal uses article numbers instead of page numbers. See further details here.