
Prediction and Feed-In Tariffs of Municipal Solid Waste Generation in Beijing: Based on a GRA-BiLSTM Model

1
Tianjin Zhongxinde Metal Structure Co., Ltd., Tianjin 300380, China
2
School of Management, Tianjin University of Technology, Tianjin 300384, China
*
Author to whom correspondence should be addressed.
Sustainability 2024, 16(9), 3579; https://doi.org/10.3390/su16093579
Submission received: 19 March 2024
/
Revised: 8 April 2024
/
Accepted: 17 April 2024
/
Published: 24 April 2024
Abstract
:To cope with the increasing energy demand of people and solve the problem of a “Garbage Siege”, most cities have begun to adopt waste power generation (WTE). Compared to other WTE technologies, incineration has proven to be the most efficient technology for municipal solid waste (MSW) treatment. Therefore, to further explore the economic feasibility of MSW incineration plant construction, this study established a multi-factor prediction of MSW generation based on the GRA-BiLSTM model. By fully considering the relationship between the change in feed-in tariff (FIT) and the building of an incineration plant in Beijing, the economic feasibility of building an incineration plant is discussed based on the three scenarios set. The experimental results showed that (1) the combined model based on the GRA-BiLSTM showed good applicability for predicting MSW generation in Beijing, with MAE, MAPE, RMSE, and R2 values of 12.47, 5.97%, 18.5580, and 0.8950, respectively. (2) Based on the three scenarios set, the incineration power generation of Beijing MSW will show varying degrees of growth in 2022–2035. In order to meet future development, Beijing needs to build seven new incinerators, and the incineration rate should reach 100%. (3) According to setting different feed-in tariffs, based on the economic feasibility analysis, it is found that the feed-in tariff of MSW incineration for power generation in Beijing should be no less than $0.522/kWh. The government should encourage the construction of incineration plants and give policy support to enterprises that build incineration plants.
1. Introduction
With rapid economic development and urban population growth, the amount of municipal solid waste (MSW) in China has been rising [1], which has led to rising environmental pollution and a shortage of land resources [2]. Currently, the amount of MSW generated in China has reached 249 million tons, and two-thirds of the country’s cities are suffering from the plight of a “Garbage Siege” [3]. As a result of economic development and continuous growth in population density, China is the world’s largest MSW producer [4]. In recent years, Beijing, the capital of China, has been at the forefront of MSW generation in the country. For example, MSW generation in Beijing reached 7,842,200 tons in 2021, and the rising trend of MSW generation in recent years has put great pressure on the city’s environmental quality and sustainable development. Therefore, it is necessary to address the increasing MSW generation in Beijing and mitigate its impacts on the environment and resources.
Landfill, incineration, and composting are the three main MSW treatment methods in China today [5]. Landfills are the main form of MSW disposal in China due to their low economic costs and ease of operation, accounting for about 80% [6]. However, landfills produce about 3–4% of global anthropogenic greenhouse gas (GHG) emissions [7], which is a great threat to the environment. In contrast, the burning of MSW not only contributes directly to GHG emission reduction and economic growth [8], but the process of incineration can reduce the volume of MSW by 80–90% [9,10]. Therefore, since 2007, the Chinese government has started a policy of subsidizing MSW incineration and power generation technology to encourage the adoption of waste incineration technology for MSW treatment in various regions [11]. Figure 1 shows the completed MSW treatment plants by provinces in China in 2021. Overall, there are more MSW treatment plants in the eastern coastal regions of China than in the central and western regions. Provinces have started to build many new waste incineration plants based on national policy subsidies, but the number of existing waste incineration plants is still relatively small. In addition, few studies have considered whether it is profitable for companies to build incineration plants in terms of economic efficiency. Therefore, this study proposes a GRA-BiLSTM model to achieve accurate prediction of MSW generation by combining the advantages of grey correlation analysis and deep neural networks to deal with nonlinear data. The grey correlation analysis (GRA), as a multi-factor analysis method, can measure the degree of association between factors based on the similarity of development trends among them. And the deep neural network has good nonlinear mapping, self-learning and self-adaptive associative memory, and parallel information processing capabilities, which shows good applicability in dealing with time series data in different scenarios. In dealing with nonlinear time series prediction problems, deep neural networks effectively extract data features through multilayer nonlinear transformations to achieve accurate prediction of output variables [12]. Based on the GRA-BiLSTM model proposed above, this study measured the economic benefits generated by incineration treatment under different feed-in tariffs (FITs) through scenario setting, to suggest the FIT to be declared by enterprises.
The contributions of this study contain three main aspects: (1) Deep learning techniques are applied to MSW generation forecasting, and a multi-factor MSW generation forecasting model based on GRA-BiLSTM is established. (2) The future growth of each indicator is fully considered, and MSW generation in Beijing from 2021 to 2035 is predicted based on the baseline growth rate and, through the GRA-BiLSTM model, and it is pointed out whether the existing treatment capacity in Beijing can meet the treatment demands of MSW in the future, and the implications are suggested for the future construction of incineration plants in Beijing. (3) Based on the economic benefits generated by the MSW treatment situation under three different scenarios, suggestions are made, including the reasonable planning of future MSW incineration plant construction based on the predicted future MSW generation; given the future development trends in Beijing, enterprises should declare the FIT at no less than $0.522/kWh.
The structure of the paper is as follows: the second section addresses a literature review of indicators and methods for predicting municipal solid waste generation, and the economic benefits of municipal waste treatment. The third section introduces the research methodology and data sources of this study. The fourth section presents the results of predicting the amount of municipal solid waste generated in Beijing, and the study of the economic benefits of municipal solid waste incineration for power generation. The fifth part reviews the findings of the article and suggestions for future research.
2. Literature Review
The MSW generation prediction model has become an important tool for MSW management [13]. Many authors have used various models to predict MSW generation at different research scales [14]. The prediction models that have been developed have ranged from traditional methods such as regression analysis, which predicts future MSW by determining the correlation equation between MSW generation and certain variables [15]. The more sophisticated machine learning methods, including models such as support vector machines (SVMs) and neural networks, can handle very complex datasets [16]. Due to the complexity of MSW generation rules, nonlinear regression models show better accuracy than linear regression models, while predictions can be made by identifying patterns in the observed data without explicit programming [17]. Therefore, most of the current studies on MSW prediction use nonlinear regression models [18]. Among them, the deep learning models have a more comprehensive understanding of the trend of time series data [19], such as LSTM [20], bi-directional LSTM (Bi-LSTM) [18], etc. Compared with traditional statistical methods and general machine learning methods, the deep learning method solves the difficulty of dealing with nonlinear data in traditional statistics and makes up for the defect that machine learning can only achieve local optimization, which is widely used in many fields such as MSW and air quality [21]. Meanwhile, the BiLSTM model can effectively reduce the errors caused by data redundancy and random noise through the input function of the model being combined with a network structure consisting of multiple hidden layers to extract the hierarchical features of the data and improving the robustness of the model [22]. Therefore, the BiLSTM model was selected to predict the generation of MSW in this study.
The prediction results of MSW generation are generally influenced by the influencing factors chosen in the study [23]. Currently, scholars mainly consider the influence of three dimensions: demographic, economic, and social in their studies on predicting MSW [24]. Among them, the demographic dimension mostly uses influencing factors such as gender ratio, resident population [25], inbound tourism [26], and education level [27] The economic dimension includes influencing factors such as GDP, per capita consumption expenditure, per capita disposable income [28], and total retail sales of consumer goods [29]. The social dimension includes urban road area, citywide centralized heating area, urban green coverage [30], and other influencing factors. In addition, Zhang et al. considered demographic and educational factors as social dimensions and explored MSW generation in both social and economic dimensions using five machine tilting algorithms (LR, PR, SVM, RF, and XGBoost) and found that the key to MSW increase is mainly the increase in MSW per capita due to GDP [31]. The impact of the size of the population, the number of formally employed persons, unemployment rate, and family units on MSW generation in Johannesburg was analyzed by Ayeleru et al. using two predictive models, ANN and SVM, and the study found very strong correlations between population, number of households, and unemployment rate and with MSW generation [32]. Due to the variability of factors affecting MSW generation in different regions, Izquierdo-Horna et al. suggested that the screening of variables affecting MSW generation can be carried out dimensionally, depending on the actual case [33]. Therefore, the influencing factors regarding MSW generation used in this study were determined by the existing research results of scholars. Meanwhile, to reduce the errors caused by numerous factors in predicting MSW generation, GRA will be used to screen the factors influencing MSW generation to effectively reduce the impact of time series interference on prediction accuracy [34].
In addition, a large number of papers have explored MSW treatment technologies that are more suitable for future societies from the environmental, economic, and energy perspectives [35]. This includes Liu et al. comparing two Chinese cities with different levels of development (Leizhou and Shenzhen) through MSW gasification for power generation (MGPG) and MSW incineration for power generation (MIPG) technologies and finding that MSW incineration technology shows greater stability in resisting policy risks [10]. Rodrigues et al. analyzed the impact of both MSW gasification and incineration treatment in Brazilian cities from an economic and energy perspective and found that incineration is the option with the greatest power generation potential in MSW treatment [9]. Meanwhile, Zhou and Zhang analyzed the energy potential of MSW in the Greater Bay Area of China through MSW generation models with the IPCC default approach, and incineration was found to be more suitable for future development from both energy recovery and climate perspectives [4]. Based on current studies, MSW incineration has been extensively evaluated as more suitable for future society [36]. However, few studies have analyzed the impact of FITs on the construction of incineration plants. Therefore, this paper will analyze the impact of FITs on the economic benefits generated by MSW incineration.
3. Materials and Methods
The GRA-BiLSTM model is an intelligent network model that combines the advantages of GRA and BiLSTM for multi-factor prediction. The factors selected in this study that affect the generation of MSW in Beijing are screened by GRA and are later entered into the BiLSTM model for learning. The autonomous learning and fault tolerance capability of the neural network is fully utilized to improve the accuracy of prediction and the efficiency of deep learning. And, by setting the average growth scenario of the input indicators, the prediction of Beijing MSW generation from 2022 to 2035 is achieved to verify whether existing incineration plants can meet the demand of Beijing’s MSW treatment trends by 2035. Second, based on the current FITs, the economic benefits generated under different scenarios are evaluated and, based on the forecast results, recommendations are made for the construction of future MSW incineration plants in Beijing.
3.1. Data Collection and Study Area
3.1.1. Study Area
In this study, Beijing is selected as the object of study. Beijing, the capital of China, is located in the east of the country and is an important political, economic, and cultural center of China. By the end of 2021, the resident population numbered 21,886,000 people. This means that a large quantity of MSW will be generated and will cause a serious dilemma for Beijing’s limited land resources. As a result, Beijing has implemented a series of measures around energy conservation and emission reduction as well as MSW incineration and power generation. Currently, Beijing has built 43 waste treatment plants with a daily design capacity of 33,861 tons per day. Among them, the domestic waste incineration plant No. 12, has a design capacity of 17,650 tons/day.
As shown in Figure 2, the per capita annual MSW generation in Beijing has been much higher than the per capita annual MSW generation level in China. In particular, in 2021, the per capita MSW generation in China was 0.18 tons, while the per capita annual MSW generation in Beijing reached 0.36 tons. This means that Beijing MSW treatment will face a bigger crisis. Therefore, this study focuses on the case study of MSW in Beijing and also provides references for other provinces.
3.1.2. Impact Factor Selection
According to many scholars’ studies on MSW generation forecasting, this paper collected and integrated data on 15 selected forecasting indicators in Beijing from 1979 to 2021 from the Beijing Statistical Yearbook for the period from 1979 to 2022 (https://tjj.beijing.gov.cn/ (accessed on 6 July 2022)). Among them, the 15 influencing factors are per capita consumption expenditure, GDP, per capita disposable income, total retail sales of consumer goods, tertiary industry income, resident population, number of registered households, resident population density, number of inbound tourists, registered population, road cleaning and sanitation area, public transportation operating vehicles, centralized heating area in the city, public green space per capita, and urban road area.
To fully consider the Beijing government’s planning and future social development, this paper will study and forecast the future MSW generation in Beijing based on existing studies. By extrapolating the existing data for the past 5 years (2016–2020) and combining the different development characteristics of each stage in Beijing’s future development trends, MSW generation in Beijing for the next 15 years (2021–2035) is forecasted. Different growth scenarios are proposed for each of the selected influencing factors. The average growth rate of the annual data is used to represent the change in each input indicator in the scenario setting.
According to Beijing’s national economic and social development plan, Beijing’s per capita disposable income and per capita consumption expenditure will gradually tend to grow steadily in the future. Therefore, the distribution of the baseline scenario for Beijing’s per capita disposable income and per capita consumption expenditure are set at 7% and 6%. Due to the combined effects of the domestic and international COVID-19 economic conditions, and domestic economic growth trends, Beijing residents’ willingness to consume has decreased, and the baseline scenario for Beijing’s total retail sales of consumer goods is set at 5%, taking into account the study of Beijing’s future development trends and the historical data for the past five years. Taking into account Beijing’s energy development plan and historical data for the past five years, the baseline scenario for Beijing’s centralized heating area is set at 0.5%. With the continued “land constraint” in Beijing, the baseline scenarios for Beijing’s urban road area and road cleaning area are set at 1% and 2%, respectively, and the baseline scenarios for the number of households and household population in Beijing are set at 0.5% and 1%. Influenced by COVID-19 at home and abroad, Beijing’s inbound tourism market fell precipitously from the Spring Festival of 2020. The current orderly liberalization policy in China and the historical data of Beijing over the past 5 years are taken into account. The baseline scenario is set at 110% for the number of inbound tourists in Beijing in 2021–2023 and 2.5% for the number of inbound tourists in Beijing in 2024–2035.
3.2. Establishing the GRA-BILSTM Model
3.2.1. Grey Relation Analysis
The GRA was invented by Deng and has been successfully applied in many fields [37]. In this study, the GRA will be used to evaluate the relationship between MSW generation and the selected influences to identify predictors for the training model. The GRA, as a multi-factor analysis method, can measure the degree of association between factors based on the similarity of trends between them. If the trend consistency of changes among factors is stronger, the greater the grey correlation between them. Conversely, the smaller it is.
Set the reference set as , where n is the number of input data. Set the comparison set as , where m is the number of all indicators, each indicator is a reference set and the rest is the comparison set.
The m groups of indicators are normalized to eliminate the effect of dimensionality, as in Equation (1):
Calculate the grey correlation coefficient of and at time t as Equation (2):
In Equation (2), is the grey correlation coefficient, while the adjustment parameter with ρ can be used to enhance each coefficient, and the correlation coefficients between the two groups are as in Equation (3):
Each indicator is used as a reference set for the correlation coefficient matrix of all indicators calculated by Equation (3). As Equation (4):
The weights corresponding to each indicator are obtained by calculating the average of the correlation coefficients. In summary, the absolute value of the correlation coefficient corresponds to the strength of the correlation coefficient. The larger the value, the stronger the correlation, and vice versa [38].
3.2.2. Bidirectional Long Short-Term Memory
The BiLSTM model is a deformation structure of the LSTM model [39], and compared with the LSTM model that always passes training from front to back during training, the BiLSTM model adds back-to-forth passing training on this basis, which can fully consider contextual information and overcome the deficiency of data in the LSTM through a bidirectional recurrent neural network. As shown in Figure 3, the BiLSTM model can simultaneously perform bidirectional transfer when processing data with an independent presence in both directions and can capture past and future information in a specific time interval [40].
In addition, the two layers of the BiLSTM model need to save two values, and , and these two values need to be computed forward and backward, respectively. The final output value , obtained by combining the outputs of the forward and backward layers, can be obtained as Equations (5) and (6):
where, is the forward-layer LSTM network output and the backward-layer LSTM network output. The final output of the hidden layer is shown in Equation (7).
where, is the corresponding matrix of weight coefficients, which is applied iteratively in each time step.
3.3. Economic Benefits of MSW Incineration for Power Generation
3.3.1. Municipal Waste Incineration Potential
In this section, the power generation potential of MSW incineration is calculated by Equation (8) [41].
In Equation (8), is the generation potential (GWh) in the year . is the MSW (tons/yr) generated in year ; is the low heating value of MSW; is the conversion efficiency, which is set to 30% in this study. is the unit conversion factor . In addition, the range of measured data for the low calorific value (LCV) of MSW incineration in Beijing is . The middle value is taken in this study, so the low calorific value of MSW incineration in Beijing in this study is .
3.3.2. Economic Benefits of Incineration Power Stations
The total cost of an incineration facility includes capital cost and operating costs. Based on industry practice, it is assumed that the initial investment cost of building an incineration plant with a capacity of up to 3000 tons/day is USD4.7 million and the operating cost is USD40USD/ton of MSW/year [42]. In this case, the construction period of the incineration plant is 2 years and the profitability starts in the third year. The average life of an incineration plant is considered to be 30 years, and the plant and machinery will reach their full potential at the end of the concession period. Therefore, the residual value is negligible and set at zero.
The incineration plant receives additional revenue from the sale of electricity, which is calculated as follows [11]:
where e is the amount of electricity sold (kWh) and is the price per kWh sold. However, under China’s “competitive allocation” rules, companies may voluntarily lower the FIT declaration in a more competitive situation, and the FIT will be lower than the $0.65/kWh standard.
3.3.3. Scenario Design
Based on national policies and future development trends in Beijing, three scenarios were set up in this study (all based on data from the base year), with the base year set at 2021: the business-as-usual (BAU) scenario and two comparison scenarios.
Scenario 1 (BAU). In this scenario, it is assumed that Beijing’s future incineration market share remains constant, i.e., a 62.3% annual incineration treatment market share. Three more incineration plants will be built according to future demand.
Scenario 2. In this scenario, it is assumed that Beijing’s market share for MSW incineration treatment needs to reach 80% by 2035 based on national policy recommendations. The incineration share varies at an average growth rate between 2021 and 2035, i.e., the annual growth rate of the incineration share is 2.82%. Therefore, five more incineration plants need to be built to meet future demand.
Scenario 3. In this scenario, based on national policy recommendations and future development in Beijing, the incineration share of MSWs in Beijing is assumed to reach 100% in 2035, and the incineration share varies at an average growth rate between 2021 and 2035, i.e., the annual growth rate of the incineration share is 5.4%. Therefore, seven more incineration plants need to be built to meet future demand.
3.4. Accuracy Evaluation for the Model
To evaluate the performance of the GRA-BiLSTM model, this study uses mean absolute percentage error (MAPE), root mean square error (RMSE), and mean absolute error (MAE) to measure the difference between the simulated and actual data. Among them, the range of values is , and the value is larger when the error between the predicted and true values is greater. The predicted value is equal to 0 when it exactly matches the true value [43].
The MAPE is calculated by Equation (10).
The RMSE is calculated by Equation (11).
The MAE is calculated in Equation (12).
The R-Square is calculated in Equation (13).
where, is the predicted value, is the true value, and n is the number of indicator variables.
4. Results and Discussion
4.1. Accuracy Analysis of Prediction Model
4.1.1. Index Correlation Analysis
In this study, the factors influencing MSW generation in Beijing were analyzed by GRA. Based on the correlation results of the MSW generation data in Beijing with its 15 influencing factors, the three indicators with the highest correlation were selected from the social, economic, and demographic dimensions as the input indicators for the prediction model. Table 1 shows the correlation results obtained through GRA screening. For the relevance indicator of the impact factor, a range of 0.8–1 is considered a strong correlation, a range of 0.6–0.8 is considered a stronger correlation, and less than 0.6 can be considered a fair correlation. Among them, the fluctuation trends of nine influencing factors, namely per capita disposable income, per capita consumption expenditure, total retail sales of consumer goods, road cleaning area, urban centralized heating area, urban road area, number of households, household population, and inbound tourists, are more closely related to the amount of MSW generated in Beijing. Further experimental results show that selecting these nine influencing factors as input indicators for the model to predict MSW generation in Beijing can yield more accurate experimental results, ensuring the reliability of MSW generation data as a means of estimating the range of FITs in Beijing.
After screening the influencing factors through GRA, the influencing factor data screened through GRA are input into the BiLSTM model for prediction. In the training process of the BiLSTM model, the optimization of the model structure is first carried out. The optimal prediction model is found by setting one parameter differently and keeping other parameters the same. The optimization of the structural parameters of the BiLSTM model is mainly divided into two steps. We implemented the construction and testing of the predictive model using a Linux system and python 3.9 under GPU-accelerated computer hardware. The first step is to determine the number of model layers. Using the established parameters in the model, the number of model layers can be categorized into 1, 2, 3, and 4 layers. The optimal number of layers is derived by comparison. The second step is to determine the number of BiLSTM units. According to the determined BiLSTM model structure, 32, 64, and 128 BiLSTM units were set up in this study. According to the successive experiments, the parameters of the BiLSTM model structure in this study are an lr of 0.001, the number of BiLSTM layers being 2, and the number of BiLSTM units being 32.
4.1.2. Performances of MSW Prediction Models
To objectively reflect that the GRA-BiLSTM prediction model constructed in this study has the lowest error possible, we chose seven commonly used MSW prediction models for comparison. Namely, support vector regression (SVR), logistic regression (REG), combined grey correlation analysis with a support vector regression model (GRA-SVR), combined grey correlation analysis with a logistic regression model (GRA-REG), as well as the current widely used deep learning methods: LSTM, BiLSTM, and the GRA-LSTM combined model. The learning performance of each model is tested by the same proportion of the training set, and the predictive performance of the eight groups of models is compared with the results of MAE, MAPE, RMSE, and R2.
The experimental results are shown in Table 2 and all eight groups of prediction models can realize reasonable prediction. Among them, the traditional REG model has the highest prediction error with a MAPE value of 95.03%, and the GRA-REG model has the second highest prediction error after the traditional REG model with a MAPE value of 47.53%. Compared with the other seven models, the MAE, MAPE, and RMSE values of the GRA-BiLSTM model are 12.47, 18.56, and 5.97%, respectively, which are more accurate. In response to published papers on municipal solid waste (MSW) prediction, a growing number of studies have focused specifically on the predictive performance of models. Municipal solid waste prediction studies using prediction models such as ANN, SVM, and LSTM have model accuracies of MAPE = 16% [44], R2 = 0.71 [45], and MAPE = 14.36% [46]. In our study using the GRA-BiLSTM model, the prediction accuracy had a MAPE of 5.97% and an R2 of 0.895, and the prediction model possessed better prediction accuracy when compared to the results of existing studies.
In this study, the prediction of MSW generation by the GRA-BiLSTM model will show good applicability with a more precise result. Further analysis of the experimental results reveals that GRA screening of the influencing factors has a significant role in improving the accuracy of the prediction results. The error results of the combined model with GRA analysis were much smaller when compared to the model without GRA analysis, and the GRA analysis method improved the prediction accuracy of the experimental model. In subsequent MSW generation prediction studies, the addition of the GRA method can be considered to reduce the large errors generated in the prediction.
4.2. Forecasting of the Municipal Solid Waste Generation
Based on the GRA-BiLSTM model, this section will predict MSW generation in Beijing over the next fifteen years and analyze it. The growth of the input indicators is based on the historical average growth rate of each indicator, with reference to the control of the urban development plan of Beijing, which is 3% per year for economic indicators, 2% per year for social indicators, and 2% per year for population indicators. The growth trend of each influencing factor set in Section 3.1.2 was used as the input data for the GRA-BiLSTM model, and model learning was used to obtain the annual MSW generation data for Beijing from 2021 to 2035. The results of the projections are shown in Figure 4. In 2021, the MSW generation in Beijing was 7,842,200 tons and, in 2035, the MSW generation in Beijing will increase to 15,723,600 tons, which is almost twice as much as in 2021. Beijing’s MSW growth over the next fifteen years can be divided into two phases, the first from 2023 to 2028 and the second from 2029 to 2035. The first significant increase will be in 2023 to 11,313,200 tons, followed by relatively small upward and downward fluctuations over the next five years. There will be a second significant increase in 2029 to 13,890,300 tons, followed by steady, slow growth over the next six years. Based on the future growth trends of MSW in Beijing, the municipal government needs to improve the capacity of source-separated waste collection and develop a targeted plan for source-separated waste reduction in MSW in Beijing, to reduce MSW at the source.
According to the Urban and Rural Construction Statistical Yearbook (2021) of the Ministry of Housing and Urban-Rural Development of the People’s Republic of China (MOHURD), by 2021, Beijing’s annual MSW treatment capacity will reach 12,359,300 tons/year, and the incineration treatment capacity will reach 6,000,000 tons/year. However, according to the forecast results, MSW generation in Beijing will achieve 15,723,600 tons in 2035, and the existing treatment capacity cannot meet the expectation of incineration to reach more than 80% by 2035. Therefore, under the current economic environment and policy context, Beijing needs to build new MSW incineration plants to meet future MSW treatment demand and should be encouraged to overbuild incineration and treatment plants that meet the trend of MSW generation.
4.3. Results of Simulations for Each Scenario
Based on the three scenarios set up in Section 3.3.3, and in conjunction with the results of the forecast of MSW generation in Beijing for the next fifteen years, this section analyzes MSW incineration treatment in Beijing from the perspective of profitability of MSW incineration for power generation. A comparison of the three scenarios based on the simulation results of Beijing’s power generation potential is shown in Table 3. The power generation potential of MSW in Beijing is significantly related to both MSW generation and incineration ratio, and the power generation from MSW incineration in Beijing grows significantly as the incineration ratio increases. By 2035, Beijing’s MSW power generation will range from 5108.20 GWh/year to 7927.02 GWh/year, and Beijing’s future MSW incineration power generation potential is significant.
According to Section 4.2, it can be seen that the existing MSW incineration plants in Beijing will not be able to meet future development needs. To meet the future treatment demand for MSW generation in Beijing, this section assumes that three new incineration plants will be built in Beijing in Scenario 1, based on the results of the Beijing MSW generation projections in Section 4.2. This includes two new plants in 2027 and one new plant in 2029. In Scenario 2, Beijing will build five new incineration plants, including one in 2021, two in 2027, and two in 2030. In Scenario 3, Beijing would build seven new incineration plants, including two in 2022, four in 2027, and one in 2030. The economic feasibility of the selling price of electricity generated from MSW incineration was evaluated for all three scenarios.
The economic feasibility assessment based on the simulation results of MSW power generation in Beijing is shown in Table 3. By 2035, the revenues of the three scenarios will be $294.5 million, $158.6 million, and $198.6 million, respectively, and all three scenarios will be profitable. Therefore, all three scenarios are feasible in terms of economic viability. In Scenario 1, the profit gained in the short term is the largest due to the planning of the lowest number of new incineration plants. However, in the long-term, with the development of the trend of Scenario 1, the future incineration rate of MSW in Beijing will not be able to meet national demand and the reality of garbage surrounding the city will not be solved, and Scenario 1 is not suitable for the future development trend of Beijing. Scenario 2 has future development trends that meet China’s requirements for MSW incineration by 2035; however, it makes the least profit from powered generated from incineration of the three scenarios. In Scenario 3, due to more new incineration plants, the profit gained in the short term is less than that in Scenario 1. However, in the long-term perspective, according to the development trend of Scenario 3, the MSW treatment in Beijing is not only in line with future development but also can gain more profit. Therefore, Scenario 3 is more feasible than the other two options. By 2035, seven new incineration plants should be built in Beijing to achieve the MSW incineration rate of 100 percent.
The results in Figure 5 show that the construction of waste-to-energy facilities with power generation capacity contributes to economic development and is a worthwhile investment, and that the Beijing government should encourage the construction of new incineration plants on a moderate scale. On the one hand, it relieves the land pressure and environmental pollution caused by MSW generation in Beijing. On the other hand, it utilizes the resources of MSW. Meanwhile, the government should explore more efficient facilities to increase energy conversion efficiency and generate more value.
4.4. The Feed-In Tariff and Policy Suggestions
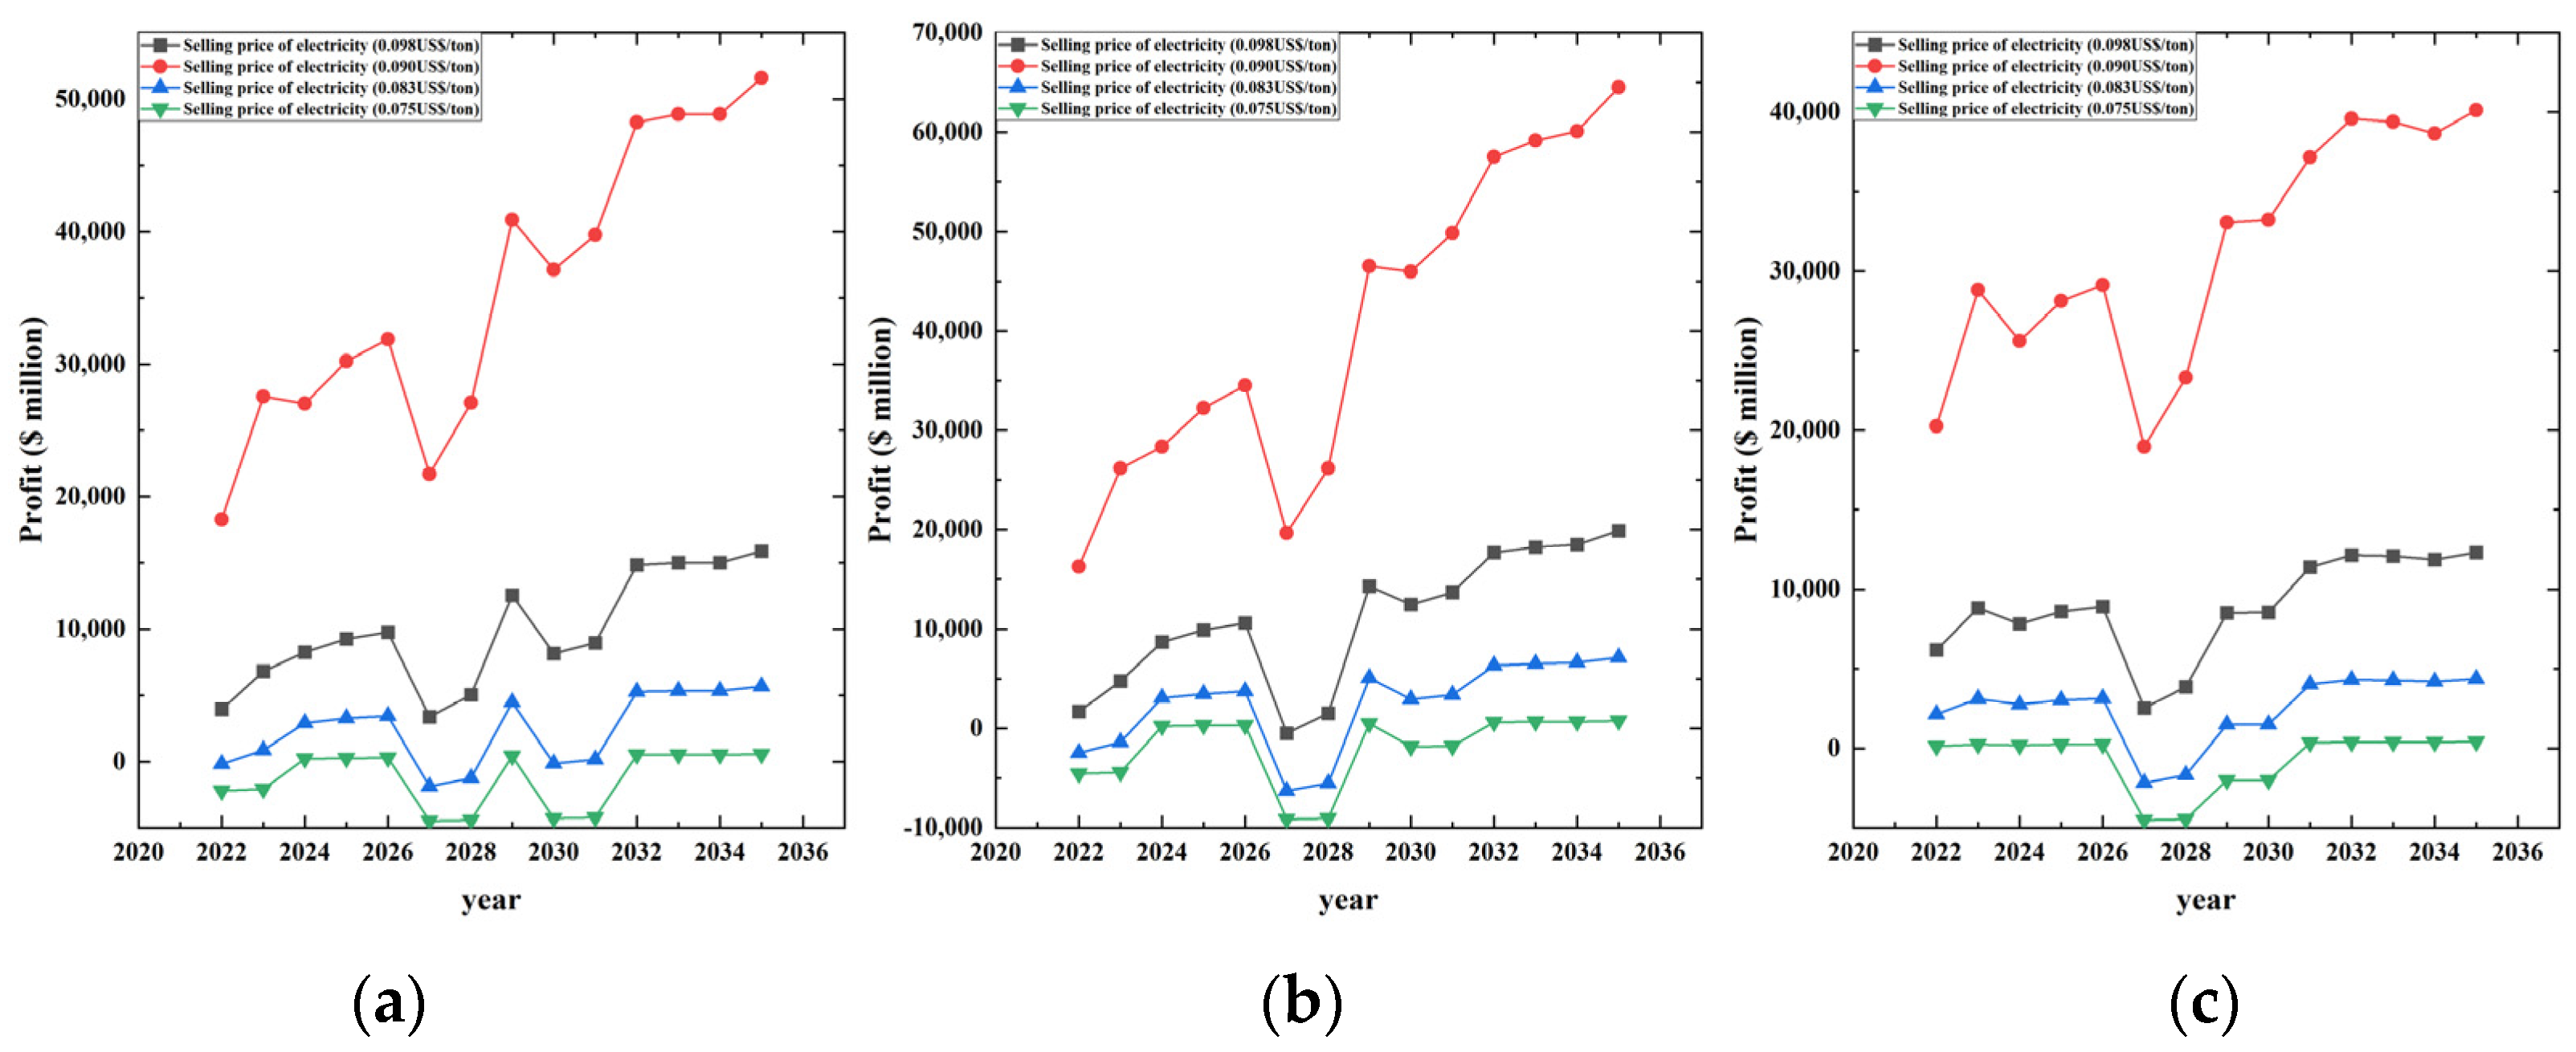
The FIT is a key determinant of whether an incineration plant is profitable or not. The impact of the electricity sales price (FIT) on the profitability of the incineration plant is shown in Figure 6. When the electricity sales price increases from $0.5/kWh to $0.65/kWh, the profitability of the incineration plant increases linearly for all three scenarios. When the electricity price is at $0.5/kWh, the incineration plant will operate at an economic loss under all three scenarios.
In Scenario 1, when the FIT is less than $0.511/kWh, the incineration plant is in a state of economic loss from 2021 cumulatively to 2035, and in a state of profitability when the FIT is not less than $0.511/kWh. In Scenario 2, when the FIT is less than $0.518/kW, the incineration plant is in a loss-making mode from 2021 cumulatively to 2035, and in a profitable state when the FIT is not less than $0.518/kW. In Scenario 3, when the FIT is less than $0.522/kW, the incineration plant is loss-making economically from 2021 cumulatively to 2035, and is in a profitable state when the FIT is not less than $0.511/kW. Based on the analysis of economic benefits of waste incineration power plants under the three scenarios, the construction of waste incineration power plants in the future will still bring significant economic benefits, worthy of investment. Meanwhile, considering the economic feasibility and the future development trends of MSW incineration in Beijing, the FIT in Beijing over the next fifteen years should be no less than $0.522/kWh.
5. Conclusions
Increasingly, MSW has become one of the obstacles to urbanization in China. As an inevitable choice for MSW management in China, MSW can not only solve the “garbage siege”, but can also help reduce greenhouse gas emissions. Accurate prediction of MSW generation, reasonable estimation of the number of future incineration plants and FITs for MSW incineration in the future can contribute to the economic viability of environmental health management departments and enterprises. In this study, the collected influencing factors were screened by GRA and later input as input variables into the GRA-BiLSTM model for predicting MSW generation in Beijing. Based on the development of Beijing, the current industry situation, and the calculation formula, future MSW incineration generation and the cost of new incineration plants in Beijing were estimated, and the FIT range of future MSW incineration in Beijing was estimated. The following conclusions were drawn from the experiments:
- (1)
- In this study, a GRA-BiLSTM multi-factor prediction model for MSW generation is proposed, and the GRA-BiLSTM shows good adaptability for MSW generation prediction in Beijing compared with simple machine learning and linear programming models. The MAE, MAPE, and RMSE of this combined prediction model are 12.47, 18.56, and 5.97%.
- (2)
- The projected generation of MSW in Beijing in 2035 is 15,723,570 tons, and the incineration plants in Beijing will be profitable in all three scenarios from 2022 to 2035. However, based on future development and national requirements, the best future development target for Beijing is 100% incineration share, according to the requirement of the construction of seven new incineration plants. At the same time, the FIT for MSW incineration in Beijing should be no less than $0.522/kWh by the year 3035 and, at the same time, the government should reduce its intervention in the declaration of FITs by enterprises and gradually reduce its subsidy policy for MSW power generation.
- (3)
- Based on the future growth trends of MSW in Beijing, the municipal government needs to improve waste separation and collection capacity at the source and establish a targeted plan for mandatory MSW source separation and reduction in Beijing to fundamentally reduce MSW. At the same time, the government should explore more efficient facilities to improve energy conversion efficiency and generate greater value. The municipal government should encourage the construction of incineration plants that match the growth of MSW generation appropriately and provide policy incentives to companies that build MSW incineration plants.
This study has completed the prediction of power generation from household waste incineration in Beijing, but there are still some limitations. This study analyzed the economic benefits of MSW incineration for power generation up to 2030, but did not comprehensively analyze other economic indicators such as cost, and also lacked the environmental benefit evaluation of the grid connections for power generation. In addition, due to the lack of more precise dimensions of data, it is not possible to accurately capture the potential for power generation and grid connection. Therefore, in future research, we will continue to focus on the economic and environmental impacts of urban household waste and improve the performance of the model.
Author Contributions
X.Z.: data curation, writing—original draft preparation writing—reviewing and editing, visualization, investigation. B.L.: conceptualization, methodology, software. All authors have read and agreed to the published version of the manuscript.
Funding
This work was supported by the National Key R&D Program of China (2019YFB1803701) and the Tianjin Transportation Science and Technology Development Plan Project (2022-25).
Institutional Review Board Statement
Not applicable.
Informed Consent Statement
Not applicable.
Data Availability Statement
The data utilized to support the findings are available in the above context or from the corresponding author.
Conflicts of Interest
The authors declare no competing interests.
References
- Ding, Y.; Zhao, J.; Liu, J.; Zhou, J.; Cheng, L.; Zhao, J.; Shao, Z.; Iris, Ç.; Pan, B.; Li, X.; et al. A review of China’s municipal solid waste (MSW) and comparison with international regions: Management and technologies in treatment and resource utilization. J. Clean. Prod. 2021, 293, 126144. [Google Scholar] [CrossRef]
- Cheng, S.; Ding, X.; Dong, X.; Zhang, M.; Tian, X.; Liu, Y.; Huang, Y.; Jin, B. Immigration, transformation, and emission control of sulfur and nitrogen during gasification of MSW: Fundamental and engineering review. Carbon. Resour. Convers. 2023, 6, 184–204. [Google Scholar] [CrossRef]
- Kosajan, V.; Wen, Z.; Zheng, K.; Fei, F.; Wang, Z.; Tian, H. Municipal solid waste (MSW) co-processing in cement kiln to relieve China’s Msw treatment capacity pressure. Resour. Conserv. Recycl. 2021, 167, 105384. [Google Scholar] [CrossRef]
- Zhou, Z.; Zhang, L. Sustainable waste management and waste to energy: Valuation of energy potential of MSW in the Greater Bay Area of China. Energy Policy 2022, 163, 112857. [Google Scholar] [CrossRef]
- Zhao, F.; Bian, R.; Zhang, T.; Fang, X.; Chai, X.; Xin, M.; Li, W.; Sun, Y.; Yuan, L.; Chen, J.; et al. Characteristics of polychlorinated dibenzodioxins/dibenzofurans from a full-scale municipal solid waste (MSW) incinerator in China by MSW classification. Process Saf. Environ. 2022, 161, 50–57. [Google Scholar] [CrossRef]
- Dang, Q.; Zhao, X.; Li, Y.; Xi, B. Revisiting the biological pathway for methanogenesis in landfill from metagenomic perspective—A case study of county-level sanitary landfill of domestic waste in North China Plain. Environ. Res. 2023, 222, 115185. [Google Scholar] [CrossRef] [PubMed]
- Toha, M.; Rahman, M.M. Estimation and prediction of methane gas generation from landfill sites in Dhaka city, Bangladesh. Case Stud. Chem. Environ. Eng. 2023, 7, 100302. [Google Scholar] [CrossRef]
- Xin, M.; Sun, Y.; Wu, Y.; Li, W.; Yin, J.; Long, Y.; Wang, X.; Wang, Y.; Huang, Y.; Wang, H. Stabilized MSW incineration fly ash co-landfilled with organic waste: Leaching pattern of heavy metals and related influencing factors. Process Saf. Environ. 2022, 165, 445–452. [Google Scholar] [CrossRef]
- Rodrigues, L.F.; Santos, I.F.S.D.; Santos, T.I.S.D.; Barros, R.M.; Tiago Filho, G.L. Energy and economic evaluation of MSW incineration and gasification in Brazil. Renew. Energy 2022, 188, 933–944. [Google Scholar] [CrossRef]
- Liu, Y.; Liao, C.; Tang, Y.; Tang, J.; Sun, Y.; Ma, X. Techno-environmental-economic evaluation of the small-scale municipal solid waste (MSW) gasification-based and incineration-based power generation plants. J. Taiwan. Inst. Chem. Eng. 2022, 141, 104594. [Google Scholar] [CrossRef]
- He, J.; Lin, B. Assessment of waste incineration power with considerations of subsidies and emissions in China. Energy Policy 2019, 126, 190–199. [Google Scholar] [CrossRef]
- Howlader, A.M.; Patel, D.; Gammariello, R. Data-driven approach for instantaneous vehicle emission predicting using integrated deep neural network. Transp. Res. Part. D Transp. Environ. 2023, 116, 103654. [Google Scholar] [CrossRef]
- Ajay, S.V.; Kanthappally, T.M.; Sooraj, E.V.; Prathish, K.P. Dioxin-like POPs emission trends as a decision support tool for developing sustainable MSW management scheme—An exploratory study. J. Environ. Manag. 2023, 328, 117004. [Google Scholar] [CrossRef] [PubMed]
- Khan, A.H.; López-Maldonado, E.A.; Khan, N.A.; Villarreal-Gómez, L.J.; Munshi, F.M.; Alsabhan, A.H.; Perveen, K. Current solid waste management strategies and energy recovery in developing countries—State of art review. Chemosphere 2022, 291, 133088. [Google Scholar] [CrossRef] [PubMed]
- Abdallah, M.; Abu Talib, M.; Feroz, S.; Nasir, Q.; Abdalla, H.; Mahfood, B. Artificial intelligence applications in solid waste management: A systematic research review. Waste Manag. 2020, 109, 231–246. [Google Scholar] [CrossRef]
- Alidoust, P.; Keramati, M.; Hamidian, P.; Amlashi, A.T.; Gharehveran, M.M.; Behnood, A. Prediction of the shear modulus of municipal solid waste (MSW): An application of machine learning techniques. J. Clean. Prod. 2021, 303, 127053. [Google Scholar] [CrossRef]
- He, R.; Sandoval-Reyes, M.; Scott, I.; Semeano, R.; Ferrão, P.; Matthews, S.; Small, M.J. Global knowledge base for municipal solid waste management: Framework development and application in waste generation prediction. J. Clean. Prod. 2022, 377, 134501. [Google Scholar] [CrossRef]
- Hoy, Z.X.; Woon, K.S.; Chin, W.C.; Hashim, H.; Fan, Y.V. Forecasting heterogeneous municipal solid waste generation via Bayesian-optimised neural network with ensemble learning for improved generalisation. Comput. Chem. Eng. 2022, 166, 107946. [Google Scholar] [CrossRef]
- Zhang, H.; Cao, H.; Zhou, Y.; Gu, C.; Li, D. Hybrid deep learning model for accurate classification of solid waste in the society. Urban. Clim. 2023, 49, 101485. [Google Scholar] [CrossRef]
- Lin, K.; Zhao, Y.; Kuo, J. Deep learning hybrid predictions for the amount of municipal solid waste: A case study in Shanghai. Chemosphere 2022, 307, 136119. [Google Scholar] [CrossRef]
- Abbasimehr, H.; Paki, R.; Bahrini, A. A novel XGBoost-based featurization approach to forecast renewable energy consumption with deep learning models. Sustain. Comput. Inform. Syst. 2023, 38, 100863. [Google Scholar] [CrossRef]
- Kim, C.H.; Ahn, S.; Chae, K.Y.; Hooker, J.; Rogachev, G.V. Noise signal identification in time projection chamber data using deep learning model. Nucl. Instrum. Methods Phys. Res. Sect. A Accel. Spectrometers Detect. Assoc. Equip. 2023, 1048, 168025. [Google Scholar] [CrossRef]
- Giampietro, M.; Mayumi, K. Unraveling the Complexity of the Jevons Paradox: The Link Between Innovation, Efficiency, and Sustainability. Front. Energy Res. 2018, 6, 26. [Google Scholar] [CrossRef]
- Du, X.; Niu, D.; Chen, Y.; Wang, X.; Bi, Z. City classification for municipal solid waste prediction in mainland China based on K-means clustering. Waste Manag. 2022, 144, 445–453. [Google Scholar] [CrossRef] [PubMed]
- Rybová, K.; Slavík, J.; Burcin, B.; Soukopová, J.; Kučera, T.; Černíková, A. Socio-demographic determinants of municipal waste generation: Case study of the Czech Republic. J. Mater. Cycles Waste 2018, 20, 1884–1891. [Google Scholar] [CrossRef]
- Shapiro-Bengtsen, S.; Andersen, F.M.; Münster, M.; Zou, L. Municipal solid waste available to the Chinese energy sector—Provincial projections to 2050. Waste Manag. 2020, 112, 52–65. [Google Scholar] [CrossRef] [PubMed]
- Halkos, G.; Petrou, K.N. The relationship between MSW and education: WKC evidence from 25 OECD countries. Waste Manag. 2020, 114, 240–252. [Google Scholar] [CrossRef] [PubMed]
- Wu, F.; Niu, D.; Dai, S.; Wu, B. New insights into regional differences of the predictions of municipal solid waste generation rates using artificial neural networks. Waste Manag. 2020, 107, 182–190. [Google Scholar] [CrossRef] [PubMed]
- Nguyen, X.C.; Nguyen, T.T.H.; La, D.D.; Kumar, G.; Rene, E.R.; Nguyen, D.D.; Chang, S.W.; Chung, W.J.; Nguyen, X.H.; Nguyen, V.K. Development of machine learning—based models to forecast solid waste generation in residential areas: A case study from Vietnam. Resour. Conserv. Recycl. 2021, 167, 105381. [Google Scholar] [CrossRef]
- Cubillos, M. Multi-site household waste generation forecasting using a deep learning approach. Waste Manag. 2020, 115, 8–14. [Google Scholar] [CrossRef]
- Zhang, C.; Dong, H.; Geng, Y.; Liang, H.; Liu, X. Machine learning based prediction for China’s municipal solid waste under the shared socioeconomic pathways. J. Environ. Manag. 2022, 312, 114918. [Google Scholar] [CrossRef]
- Ayeleru, O.O.; Fajimi, L.I.; Oboirien, B.O.; Olubambi, P.A. Forecasting municipal solid waste quantity using artificial neural network and supported vector machine techniques: A case study of Johannesburg, South Africa. J. Clean. Prod. 2021, 289, 125671. [Google Scholar] [CrossRef]
- Izquierdo-Horna, L.; Kahhat, R.; Vázquez-Rowe, I. Reviewing the influence of sociocultural, environmental and economic variables to forecast municipal solid waste (MSW) generation. Sustain. Prod. Consum. 2022, 33, 809–819. [Google Scholar] [CrossRef]
- Liu, B.; Zhang, L.; Wang, Q. Demand gap analysis of municipal solid waste landfill in Beijing: Based on the municipal solid waste generation. Waste Manag. 2021, 134, 42–51. [Google Scholar] [CrossRef]
- Kang, Y.; Yang, Q.; Wang, L.; Chen, Y.; Lin, G.; Huang, J.; Yang, H.; Chen, H. China’s changing city-level greenhouse gas emissions from municipal solid waste treatment and driving factors. Resour. Conserv. Recycl. 2022, 180, 106168. [Google Scholar] [CrossRef]
- Istrate, I.; Galvez-Martos, J.; Vázquez, D.; Guillén-Gosálbez, G.; Dufour, J. Prospective analysis of the optimal capacity, economics and carbon footprint of energy recovery from municipal solid waste incineration. Resour. Conserv. Recycl. 2023, 193, 106943. [Google Scholar] [CrossRef]
- Wankhede, S.; Pesode, P.; Pawar, S.; Lobo, R. Comparison Study Of GRA, COPRAS And MOORA For Ranking Of Phase Change Material For Cooling System. Mater. Today Proc. 2023. [Google Scholar] [CrossRef]
- de Almeida, I.D.P.; Hermogenes, L.R.D.S.; Costa, I.P.D.A.; Moreira, M.Â.L.; Gomes, C.F.S.; Dos Santos, M.; Costa, D.D.O.; Gomes, I.J.A. Structuring and mathematical modeling for investment choice: A multi-method approach from Value-Focused Thinking and CRITIC-GRA-3N method. Procedia Comput. Sci. 2022, 214, 469–477. [Google Scholar] [CrossRef]
- Ranawat, N.S.; Prakash, J.; Miglani, A.; Kankar, P.K. Performance evaluation of LSTM and Bi-LSTM using non-convolutional features for blockage detection in centrifugal pump. Eng. Appl. Artif. Intel. 2023, 122, 106092. [Google Scholar] [CrossRef]
- Xiong, J.; Peng, T.; Tao, Z.; Zhang, C.; Song, S.; Nazir, M.S. A dual-scale deep learning model based on ELM-BiLSTM and improved reptile search algorithm for wind power prediction. Energy 2023, 266, 126419. [Google Scholar] [CrossRef]
- Ayodele, T.R.; Ogunjuyigbe, A.S.O.; Alao, M.A. Life cycle assessment of waste-to-energy (WtE) technologies for electricity generation using municipal solid waste in Nigeria. Appl. Energy 2017, 201, 200–218. [Google Scholar] [CrossRef]
- Kumar, A.; Samadder, S.R. A review on technological options of waste to energy for effective management of municipal solid waste. Waste Manag. 2017, 69, 407–422. [Google Scholar] [CrossRef] [PubMed]
- Taki, M.; Rohani, A. Machine learning models for prediction the Higher Heating Value (HHV) of Municipal Solid Waste (MSW) for waste-to-energy evaluation. Case Stud. Therm. Eng. 2022, 31, 101823. [Google Scholar] [CrossRef]
- Kannangara, M.; Dua, R.; Ahmadi, L.; Bensebaa, F. Modeling and prediction of regional municipal solid waste generation and diversion in Canada using machine learning approaches. Waste Manag. 2018, 74, 3–15. [Google Scholar] [CrossRef] [PubMed]
- Abbasi, M.; El Hanandeh, A. Forecasting municipal solid waste generation using artificial intelligence modelling approaches. Waste Manag. 2016, 56, 13–22. [Google Scholar] [CrossRef]
- Niu, D.; Wu, F.; Dai, S.; He, S.; Wu, B. Detection of long-term effect in forecasting municipal solid waste using a long short-term memory neural network. J. Clean. Prod. 2021, 290, 125187. [Google Scholar] [CrossRef]
Figure 1.
Comparison of the number of municipal domestic waste incineration, sanitary daily treatment capacity, and treatment plants in 31 provinces in 2021.
Figure 1.
Comparison of the number of municipal domestic waste incineration, sanitary daily treatment capacity, and treatment plants in 31 provinces in 2021.

Figure 2.
The change in per capita municipal waste generation in China and Beijing (2011–2021).

Figure 3.
Bidirectional long short-term memory model structure.

Figure 4.
Generation of Municipal Solid Waste in Beijing (2021–2035).

Figure 5.
The cost, sale price, profit, and cumulative profit of municipal solid waste incineration in Beijing (2021–2035).
Figure 5.
The cost, sale price, profit, and cumulative profit of municipal solid waste incineration in Beijing (2021–2035).

Figure 6.
Impact of electricity sales tariff on three scenarios: (a) Scenario 1, (b) Scenario 2, (c) Scenario 3.
Figure 6.
Impact of electricity sales tariff on three scenarios: (a) Scenario 1, (b) Scenario 2, (c) Scenario 3.


Table 1.
Index correlation degree ranking.
| Economic Indicators | Social Indicators | Population Indicators | ||||||
| Indicator Name | Relevance | Sort | Indicator Name | Relevance | Sort | Indicator Name | Relevance | Sort |
| Per capita consumption expenditure | 0.8165 | 1 | Street sweeping area | 0.8001 | 1 | Household population | 0.8677 | 1 |
| Total retail sales of social consumer goods | 0.7843 | 2 | Citywide centralized heating area | 0.7929 | 2 | Number of household registration | 0.8136 | 2 |
| Per capita disposable Income | 0.777 | 3 | Urban road area | 0.7852 | 3 | Number of inbound tourists | 0.8064 | 3 |
| GDP | 0.777 | 4 | Green space per capita | 0.7686 | 4 | Resident population | 0.7961 | 4 |
| Tertiary industry | 0.7464 | 5 | Public transportation operating vehicles | 0.7685 | 5 | Resident population density | 0.7929 | 5 |
Table 2.
Performance comparison of eight prediction models.
| Model | MAE | RMSE | MAPE (%) | R2 |
| SVR | 89.46 | 110.45 | 23.41 | 0.6808 |
| REG | 266.77 | 332.92 | 95.03 | 0.4102 |
| LSTM | 77.37 | 83.46 | 21.24 | 0.6971 |
| BiLSTM | 32.58 | 57.38 | 14.36 | 0.8015 |
| GRA-SVR | 31.08 | 60.69 | 14.23 | 0.8101 |
| GRA-REG | 92.24 | 121.54 | 47.53 | 0.6054 |
| GRA-LSTM | 27.4 | 35.11 | 10.2 | 0.8668 |
| GRA-BiLSTM | 12.47 | 18.558 | 5.97 | 0.8950 |
Table 3.
Electricity generation potential (GWh/year) in Beijing from 2022 to 2035.
| Scenario 1 | Scenario 2 | Scenario 3 | ||||
| Year | Waste Incinerated (Million tons) | Electricity Generation (GWh/year) | Waste Incinerated (Million tons) | Electricity Generation (GWh/year) | Waste Incinerated (Million tons) | Electricity Generation (GWh/year) |
| 2022 | 488.57 | 2642.34 | 488.57 | 2642.34 | 488.57 | 2642.34 |
| 2023 | 496.44 | 2684.91 | 505.39 | 2733.30 | 513.51 | 2777.22 |
| 2024 | 704.81 | 3811.86 | 730.44 | 3950.48 | 754.11 | 4078.47 |
| 2025 | 626.39 | 3387.71 | 660.86 | 3574.17 | 693.24 | 3749.27 |
| 2026 | 687.72 | 3719.43 | 738.65 | 3994.86 | 787.29 | 4257.91 |
| 2027 | 712.21 | 3851.87 | 778.73 | 4211.66 | 843.35 | 4561.12 |
| 2028 | 579.54 | 3134.35 | 645.09 | 3488.88 | 709.85 | 3839.09 |
| 2029 | 685.17 | 3705.63 | 776.41 | 4199.10 | 868.08 | 4694.86 |
| 2030 | 865.37 | 4680.19 | 998.27 | 5399.00 | 1134.07 | 6133.44 |
| 2031 | 869.10 | 4700.37 | 1020.65 | 5520.00 | 1178.12 | 6371.67 |
| 2032 | 907.54 | 4908.26 | 1084.99 | 5868.00 | 1272.52 | 6882.22 |
| 2033 | 966.72 | 5228.34 | 1176.57 | 6363.31 | 1402.11 | 7583.07 |
| 2034 | 961.83 | 5201.90 | 1191.72 | 6445.22 | 1442.98 | 7804.10 |
| 2035 | 944.51 | 5108.20 | 1191.34 | 6443.18 | 1465.70 | 7927.02 |
Disclaimer/Publisher’s Note: The statements, opinions and data contained in all publications are solely those of the individual author(s) and contributor(s) and not of MDPI and/or the editor(s). MDPI and/or the editor(s) disclaim responsibility for any injury to people or property resulting from any ideas, methods, instructions or products referred to in the content. |
© 2024 by the authors. Licensee MDPI, Basel, Switzerland. This article is an open access article distributed under the terms and conditions of the Creative Commons Attribution (CC BY) license (https://creativecommons.org/licenses/by/4.0/).
Share and Cite
MDPI and ACS Style
Zhang, X.; Liu, B. Prediction and Feed-In Tariffs of Municipal Solid Waste Generation in Beijing: Based on a GRA-BiLSTM Model. Sustainability 2024, 16, 3579. https://doi.org/10.3390/su16093579
AMA Style
Zhang X, Liu B. Prediction and Feed-In Tariffs of Municipal Solid Waste Generation in Beijing: Based on a GRA-BiLSTM Model. Sustainability. 2024; 16(9):3579. https://doi.org/10.3390/su16093579
Chicago/Turabian StyleZhang, Xia, and Bingchun Liu. 2024. "Prediction and Feed-In Tariffs of Municipal Solid Waste Generation in Beijing: Based on a GRA-BiLSTM Model" Sustainability 16, no. 9: 3579. https://doi.org/10.3390/su16093579
Note that from the first issue of 2016, this journal uses article numbers instead of page numbers. See further details here.