Article

EDAR 4.0: Machine Learning and Visual Analytics for Wastewater Management

1
RID on Information Technologies and Communications Research Group (GIDITIC), Universidad EAFIT, Carrera 49 No. 7 Sur-50, Medellín 050022, Colombia
2
Industry, Materials and Energy Area, Universidad EAFIT, Carrera 49 No. 7 Sur-50, Medellín 050022, Colombia
3
Department of Data Intelligence for Energy and Industrial Processes, Vicomtech Foundation, Basque Research and Technology Alliance (BRTA), 20014 Donostia-San Sebastián, Spain
4
Department of Computer Science and Artificial Intelligence, University of Basque Country, Manuel Lardizabal Ibilbidea, 1, 20018 Donostia-San Sebastián, Spain
5
Department of R&D, Ibermática, Cercas Bajas, 7 int.-Office 2, 01001 Vitoria-Gasteiz, Spain
6
Department of R&D, Giroa-Veolia, Laida Bidea, Building 407, 48170 Zamudio, Spain
*
Author to whom correspondence should be addressed.
Sustainability 2024, 16(9), 3578; https://doi.org/10.3390/su16093578
Submission received: 4 March 2024 / Revised: 8 April 2024 / Accepted: 18 April 2024 / Published: 24 April 2024

Abstract

:
Wastewater treatment plant (WWTP) operations manage massive amounts of data that can be gathered with new Industry 4.0 technologies such as the Internet of Things and Big Data. These data are critical to allow the wastewater treatment industry to improve its operation, control, and maintenance. However, the data available need to be improved and enriched, partly due to their high dimensionality and low reliability, and the lack of appropriate data analysis and processing tools for such systems. This paper presents a visual analytics-based platform for WWTP that allows users to identify relationships among data through data inspection. The results show that the tool developed and implemented for a full-scale WWTP allows operators to construct machine learning (ML) models for water quality and other water treatment process variables. Consequently, analyzing and optimizing plant operation scenarios can enhance key variables, including energy, reagent consumption, and water quality. This improvement facilitates the development of a more sustainable WWTP, contributing to a beneficial environmental impact. Domain experts validated the variables influencing the created ML models and proved their appropriateness.

1. Introduction

Newly connected industry objects are generating vast amounts of data at an increasing rate, which must be stored, processed, and monitored in real time to make informed decisions that optimize production in Industry 4.0 factories. The challenge lies in effectively visualizing these newly generated data, including reducing their dimensionality and visualizing multivariate real-time data.
An advanced approach to data processing and visualization that can be implemented is visual analytics (VA). Keim et al. [1] defined VA as combining automated analysis techniques with interactive visualizations to enable adequate understanding, reasoning, and decision-making based on extensive and complex data sets. The focus of VA is to create new tools that allow users to (i) synthesize information and gain new insights from large and heterogeneous data sets, (ii) detect the current state of systems and discover potential new states, and (iii) provide real-time assessments and make informed actions based on these assessments.
Keim et al. [1] proposed six challenges for VA: (i) scalability with large data volumes and high dimensionality, (ii) graphical representation of data quality, (iii) visual representation of levels of detail, (iv) new display interfaces such as large-scale power walls, (v) evaluation frameworks for VA, and (vi) refreshing interactions in real time (e.g., with response times less than 100 ms). Many of these challenges remain unresolved to this day.
Diez-Olivan et al. [2] recently discovered that utilizing VA to enhance understandability in Industry 4.0 poses a new challenge. This limitation, acting as a barrier to the widespread adoption of data-based analysis, lies in the industrial plant operator’s assimilation of information. In data analysis, the information generated by deployed models cannot be readily processed by non-specialized personnel unless preprocessing strategies are devised, facilitating an improved and more intuitive understanding of the captured patterns.
A case study of VA is wastewater treatment plants (WWTPs). WWTPs can be managed by seeking optimal process conditions and identifying essential factors, features, or patterns for data-supported decision-making. Newhart et al. [3] highlighted that WWTP operators usually store a sufficiently large amount of historical data. In addition, recent advancements in data-driven process control and performance analysis and more substantial computation power “could provide the wastewater treatment industry with an opportunity to reduce costs and improve operations” [3]. One sustainability problem this research addresses concerns the requirement for more sustainable operations within WWTPs, focusing on the simulation and optimization of process variables such as energy and reagent consumption, and water quality enhancement. A more sustainable WWTP is environmentally beneficial and crucial for tackling significant environmental challenges associated with WWTP effluent water quality. When discharged into natural watercourses like rivers or seas, effluent containing high levels of nitrates can lead to increased eutrophication [4], posing severe ecological risks. This research highlights the importance of optimizing WWTP processes through data-supported decision-making to mitigate these environmental impacts. However, the limited investments in instrumentation, control, and automation of WWTPs and the need for a data-science background for WWTP professionals are limitations to making the best of the data.
A key challenge in the decision-making process during the Big Data era involves identifying relevant data and extracting meaningful insights from them. To address this problem in the context of WWTPs, project Estación Depuradora de Aguas Residuales (EDAR 4.0) aims to develop a set of WWTP operation and management systems by combining (i) cloud computing, (ii) data intelligence, and (iii) visual analytics. EDAR 4.0 aims to provide greater data storage, processing, computation, and decision-making capabilities for WWTP operation [5]. EDAR 4.0’s results were tested and validated in a full-scale municipal WWTP: La Cartuja (Zaragoza, Spain), operated by Veolia.
Five variables related to WWTP’s operation and management were analyzed in EDAR 4.0: biological oxygen demand-5 ( B O D 5 ), total chemical oxygen demand ( T C O D ), total Kjeldahl nitrogen ( T K N ), total phosphorous ( T P ), and total suspended solids ( T S S ), which are considered as contaminants. These variables are not selected randomly but are the variables that European Directive 91/271/EEC [6] establishes as quality requirements to be fulfilled in the effluent of a WWTP. Likewise, in the case that applies, as the WWTP is located in a region (Aragon, Spain) declared as an area sensitive to eutrophication, specific values for total phosphorus and total nitrogen are applied. Table 1 shows the quality requirements taken as a reference in this project based on the previously mentioned European Directive, where columns Absolute Values and Performances represent the maximum concentration of contaminants permitted and the minimum contaminants removal demanded, respectively, by the European Directive mentioned above. It can be noted that this directive allows the WWTP to comply with absolute values or performances for each contaminant.
This paper introduces a platform designed to facilitate the creation of data-driven models for simulating, predicting, and optimizing WWTPs. Two modules comprise this platform: (i) a module dedicated to the monitoring and prediction of water quality, ensuring compliance with environmental standards and enhancing the sustainability of water resources, and (ii) a module focused on the development of ML models for water quality and energy management. This enables the efficient analysis of future scenarios and the optimization of WWTP operations. By significantly reducing energy and reagent consumption and improving water quality, this platform contributes to the environmental sustainability of WWTPs, thereby minimizing their ecological footprint and promoting a positive environmental impact.
In what follows, a brief state of the art is presented in Section 2. Then, the methodology is shown in Section 3, results in Section 4, and a discussion in Section 5. Finally, conclusions and future work directions are proposed in Section 6.

2. State of the Art

The state of the art is divided into three parts. The first part summarizes different works on VA. The second part presents research on model-based wastewater management. Finally, the last part explains research on data-based wastewater management.

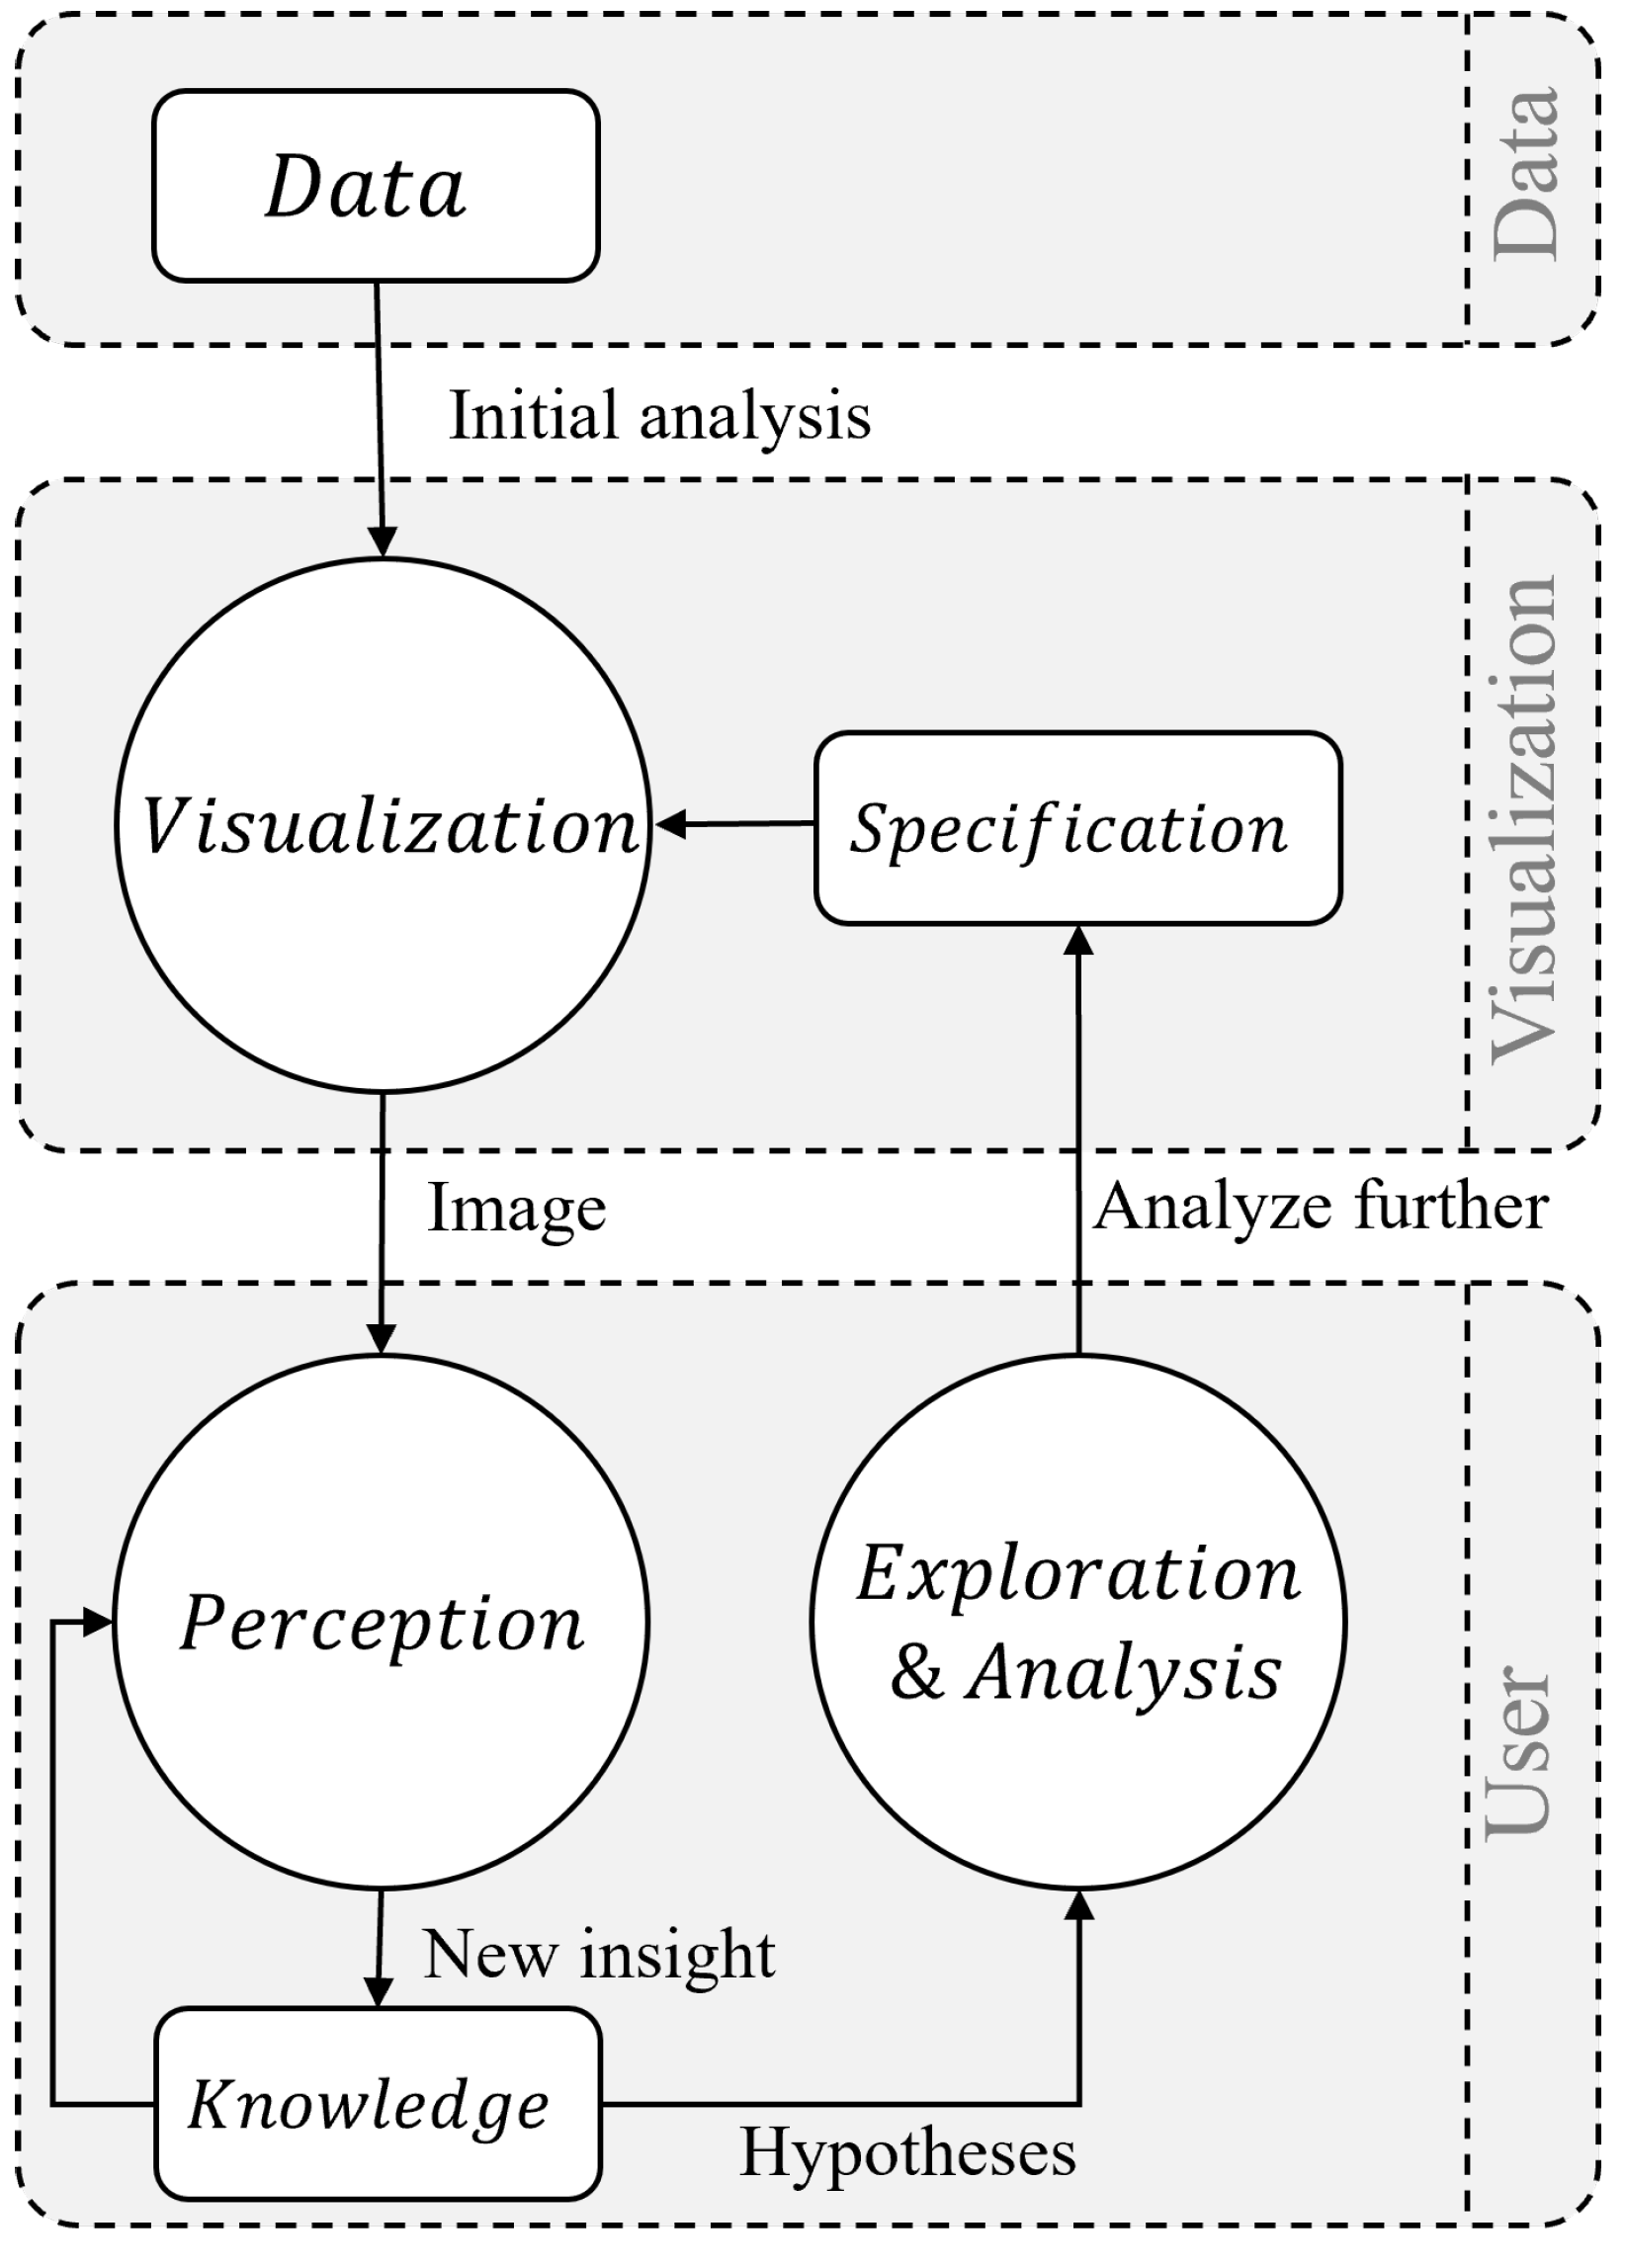
2.1. Visual Analytics

VA combines interactive visualizations with data analysis and machine learning (ML) to empower people to analyze, explore, and understand extensive data [7]. The framework proposed by [8] can generalize the VA process (see Figure 1). The first step is acquiring data stored in a database or from a data stream. These data are then analyzed and processed to extract the most critical features in the visualization stage. An image is generated during the visualization stage, representing these processed and selected data, or by the user’s specifications. Subsequently, the user observes and comprehends the image, deriving insights and knowledge. This stage may be repeated as long as the user looks through the image. Finally, the user may generate hypotheses, which will be detailed through an exploration and analysis stage. Furthermore, a new analysis may be required, translating into a specification stage, where the user can interact with the current visualization to generate new knowledge.
According to Diez-Olivan et al. [2], VA has emerged as a promising discipline to visually adapt the discovered insights and optimally present results to different human profiles. These aspects are essential in real-use cases to deploy models for data analysis in industrial plants with minimum usability and practical utility guarantee.
As an example of VA, Li, and Ma [9] proposed P6, a declarative language for rapidly specifying the design of VA systems that integrate ML and visualization methods for interactive visual analysis. P6 was motivated by three goals: interactive ML and visualization (to facilitate automated analysis), interactive and scalable systems (to process and visualize large data sets), and declarative VA (to create interactive visualization applications). In P6, the specification’s basic unit is a pipeline composed of the following specifications: data, analysis, view layout, visualizations, and interactions.
Kalinin et al. [10] presents a web-based visual analytics framework, enabling easy integration of different components for data management, analysis, and visualization. The platform incorporates various tools for importing data, displaying information, storing data, interactive visualization, statistical analysis, and ML.
Nawaz et al. [11] developed an intelligent human–machine interface (HMI) called ANKSyst that allows operation and decision support for the anaerobic ammonium oxidation (ANAMMOX) process in WWTPs. This tool integrates soft sensing, decision-making, and model simulation for supervisory control, which consists of an artificial neural network, a Kalman filter, and a principal component analysis algorithm.
Additionally, Li and Ma [9] proposed that the declarative specification for VA allows non-specialists to develop advanced data analytics and communication solutions that combine the best of human and artificial intelligence. According to Endert et al. [12], VA systems combine ML (or other analytic techniques) with interactive data visualization to facilitate insight and analytical reasoning. Endert described three categories of models and frameworks: (i) models meant to describe people’s cognitive stages for analyzing data; (ii) models and frameworks that describe interaction and information design of visual analytic applications; and (iii) ML frameworks that emphasize the importance of training data and ground truth to generate accurate and effective computational models. Keim et al. [13] mentioned that the most common ML algorithms used with VA are (i) dimension reduction, (ii) clustering, (iii) classification, and (iv) regression.
As stated by Liu et al. [14], “interactive model analysis, the process of understanding, diagnosing, and refining an ML model with the help of interactive visualization, is very important for users to solve real-world artificial intelligence and data mining problems efficiently”. Liu et al.’s paper presents a classification of relevant work in VA into three categories: (i) understanding, (ii) diagnosis, and (iii) refinement. Liu highlights that many techniques generate static images to indicate which parts of an image are most important to the classification. However, interactive visualization plays a critical role in model understanding and analysis to help people gain insight into various ML models. Therefore, our proposal addresses the dynamic creation of demand-driven models, such as a water-quality model, and how their responses contribute to the comprehension of specific variables.
Massive data sets and complex, long-running analytics are common in various domains. Stolper et al. [15] introduced the progressive visual analytics (PVA) concept. PVA is a workflow that provides the user with meaningful intermediate results if the final result’s computation is too costly. Based on these intermediate results, the user can visualize, analyze, and interpret partial results before obtaining the complete results.
VA, in the industrial context, has been used widely. Sun et al. [16] proposed PlanningVis, a VA system to support the exploration and comparison of production plans with three levels of details: a plan overview presenting the overall difference between plans, a product view visualizing various properties of individual products, and a production detail view displaying the product dependency and the daily production details in related factories. Finally, Wu et al. [17] reported the design and implementation of an interactive VA system, which helps managers and operators at manufacturing sites leverage their domain knowledge and apply substantial human judgments to guide the automated analytical approaches, thus generating understandable and trustable results for real-world applications. Our system integrates advanced analytical algorithms (e.g., Gaussian mixture model with a Bayesian framework) and intuitive visualization designs to provide a comprehensive and adaptive semi-supervised solution to equipment condition monitoring.

2.2. Model-Based Wastewater Management

A brief state-of-the-art wastewater treatment plant modeling based on ordinary differential equations (ODEs) is presented in what follows.
The most common approach to optimize the process operation against fluctuating influent water quality is to apply process control and simulation to derive the optimal operation method. ODEs have been widely used for process simulation. To simulate WWTPs using ODEs, it is essential to first model the process’s steady state under a given set of disturbances and operating conditions. However, a disadvantage is that the calculation time is extended when analyzing the ODEs. Jongrack et al. [18] proposed an improved Newton–Raphson method to shorten the computation time. The above shows that there is still active research on the simulation of wastewater treatment plants using ODEs.
In another work, Flores-Alsina et al. [19] developed a plant-wide aqueous phase chemistry model describing pH variations interfaced with industry-standard models. Flores-Alsina et al. formulated the general equilibria as a set of differential-algebraic equations (DAEs) instead of ODEs to enhance simulation speed. Additionally, Flores-Alsina et al. applied a multidimensional version of the Newton–Raphson algorithm to handle multiple algebraic interdependencies.
It is important to mention that the International Water Association (IWA) benchmark simulation model has been available for several years to create platforms for control strategy benchmarking of activated sludge processes. Jeppsson et al. [20] extended the IWA benchmark to facilitate control-strategy development and performance evaluation at a plant-wide level and, consequently, it includes both pre-treatment of wastewater and the processes describing sludge treatment.
Finally, the work by Li et al. [21] did not involve WWTPs but is worth mentioning because it presents a combination of ODEs with ML. Their paper presents a Fourier neural operator for modeling turbulent flows with zero-shot super-resolution. This work showed higher speed and better accuracy compared with classical solvers.

2.3. Data-Based Wastewater Management

In WWTPs, VA facilitates rapid and interactive exploration of multiple views of the same high-dimensional data. It is possible to have a global view of data behavior through different colors, orientations, and data. Interactive visualization of trade-offs in multiple dimensions is well-suited for situations where stakeholders have diverse interests [22].
Kim et al. [23] proposed an operator decision support system (ODSS) to support WWTP operators in making appropriate decisions. Kim et al.’s system accounts for water-quality variations in the WWTP and comprises two diagnosis modules, three prediction modules, and a scenario-based supporting module. The prediction modules are based on the k-nearest neighbors (k-NN) method to forecast water quality three days in advance. Similarly, Heo et al. [24] proposed a hybrid influent forecasting model based on multimodal and ensemble-based deep learning. This tool predicts a WWTP’s long-term (daily) and short-term (hourly) influent load.
Jafar et al. [25] explored the efficacy of artificial neural networks (ANNs) and ML models, including feed-forward neural network (FFNN), random forest (RF), convolutional neural network (CNN), recurrent neural network (RNN), and pre-trained stacked auto-encoder (SAE), for predicting WWTP performance. By analyzing data on pollution variables over three years, the study reveals that simple neural networks and RF can accurately model WWTP processes for WWTP management, demonstrating high correlation coefficients in predictions of effluent quality, despite the limitations of deep neural networks (DNNs) due to small data set sizes. Shao et al. [26] explored nine machine learning algorithms to predict sludge production, with extreme gradient boosting tree (XGBoost) and random forest models showing the highest accuracy. These models identified real-world influent volume, water temperature, and wastewater quality as significant factors affecting sludge production in wastewater treatment plants.
Piao et al. [27] applied mathematical modeling in their research to devise six strategic improvement plans to minimize electric power consumption in wastewater treatment plants. Their approach, which intricately utilized artificial neural networks, not only estimated the electric power savings from the proposed plans but also underscored the significant potential for enhancing sustainability and reducing environmental impacts. By optimizing power usage, the study contributes valuable insights into achieving more eco-friendly operations, demonstrating a pivotal step towards mitigating the ecological footprint of wastewater treatment processes.

3. Methodology

The methodology followed in this article is inspired by the proposal of AvRuskin et al. [28]. This methodology follows exploratory data analysis (EDA) [29] steps, as explained below:
  • Data collection and acquisition. It is the process of gathering and measuring information on targeted variables; it is divided into the following activities:
    (a)
    Analysis of data origin and frequency.
    (b)
    Quantification of data uncertainty.
    (c)
    Compilation of data from various sources.
  • Data management and data validation. It checks source data’s accuracy and quality before using, importing, or otherwise processing them. It is composed of the following activities:
    (a)
    Identification of the data distribution.
    (b)
    Detection of missing values.
    (c)
    Definition of erroneous data.
    (d)
    Detection and removal of outliers based on the variable analysis.
    (e)
    Detection of outliers based on physical processes.
  • Data visualization. It is the graphical representation of information and data; its main activities are:
    (a)
    Exploration and visualization of data.
    (b)
    Development of intuitive, powerful visualizations.
    (c)
    Development of algorithms for the prediction of future conditions.
AvRuskin et al. [28] state that “due to the physical nature of wastewater process data, it is recommended that laboratory, operations, and engineering staff be consulted at all points in the process to confirm assumptions”. According to Anderberg [30], cluster analysis can be used to develop inductive generalizations. Clustering analysis has been used in the domain of water quality to (i) investigate the spatiotemporal structure of determinants in a set of 21 Scottish lakes [31], (ii) evaluate the water quality of three different cross-sections of the Fen River [32], and (iii) evaluate the quality of underground water [33].
Radar plots are a useful way to present multivariate data. According to Saary [34], “radar plots have great utility in situations in which there are large numbers of independent variables, possibly with different measurement scales”. In addition, Joan Saary found that “radar plots have a particular relevance for researchers who wish to illustrate the degree of multiple group similarity/consensus or group differences on multiple variables in a single graphical display” [34].

4. Proposed EDAR 4.0 Tool

EDAR 4.0’s architecture has the WWTP process as the base, which includes factory-level data acquisition of all the processes that make up a WWTP. This process can be classified into three main standard subprocesses. First, the influent represents the entry of the incoming water and its preliminary and primary treatment, usually performed in a primary settling or sedimentation tank. Second, the biological treatment process is the central part of the so-called secondary treatment. It represents the biological wastewater treatment process of different types of bacteria and protozoa, which can be complemented by additional chemical treatments. Third, the effluent process represents the wastewater treatment plant output. This output receives directly treated water or water that goes through a secondary decantation or sedimentation tank, which can also be considered part of the plant’s secondary treatment.
The processes and subprocesses of a WWTP are generally controlled by one or more programmable logic controllers (PLCs) integrated with different sensors and actuators. All control information is displayed locally via human–machine interfaces (HMIs), usually integrated into a SCADA (supervisory control and data acquisition) system. All the information on the system is generally shared on a local network (LAN) based on an industrial protocol. In EDAR 4.0, this is extended to a Fourth Industrial Revolution (4IR) system architecture by establishing an additional cloud-based Internet of Things (IoT) infrastructure that can be reached via the Internet, so the overall WWTP and its information and communication technology (ICT) infrastructure must have secure access. In this cloud, various services are integrated, such as WWTP monitoring, cloud-based IoT data acquisition and storage, information visualization, data analysis, and related services, such as visual analysis and scenario analysis for plant operation optimization through machine learning models.
An example of accessing the above IoT cloud infrastructure and related services is via the HTTP REST protocol. An example of a data analytics service is to classify different types of water quality and predict (forecast) how water quality will change over time. Finally, with the above IoT cloud platform running, the data from the sewage treatment plant can be displayed on a webpage where remote users can execute water quality analysis and other plant monitoring functionalities. Figure 2 details a view of the EDAR 4.0, 4IR system architecture [35]. This figure also explains the software tools used for the IoT cloud components. The Python-based Flask library’s API was used in this work. A PostgreSQL v9.6 database was used for data storage. RapidMiner v9.3 was used for data analytics and ML-based model construction. Finally, the Bokeh v1.4 library was used for the visualization part. The following subsections detail each of the ML modules developed.

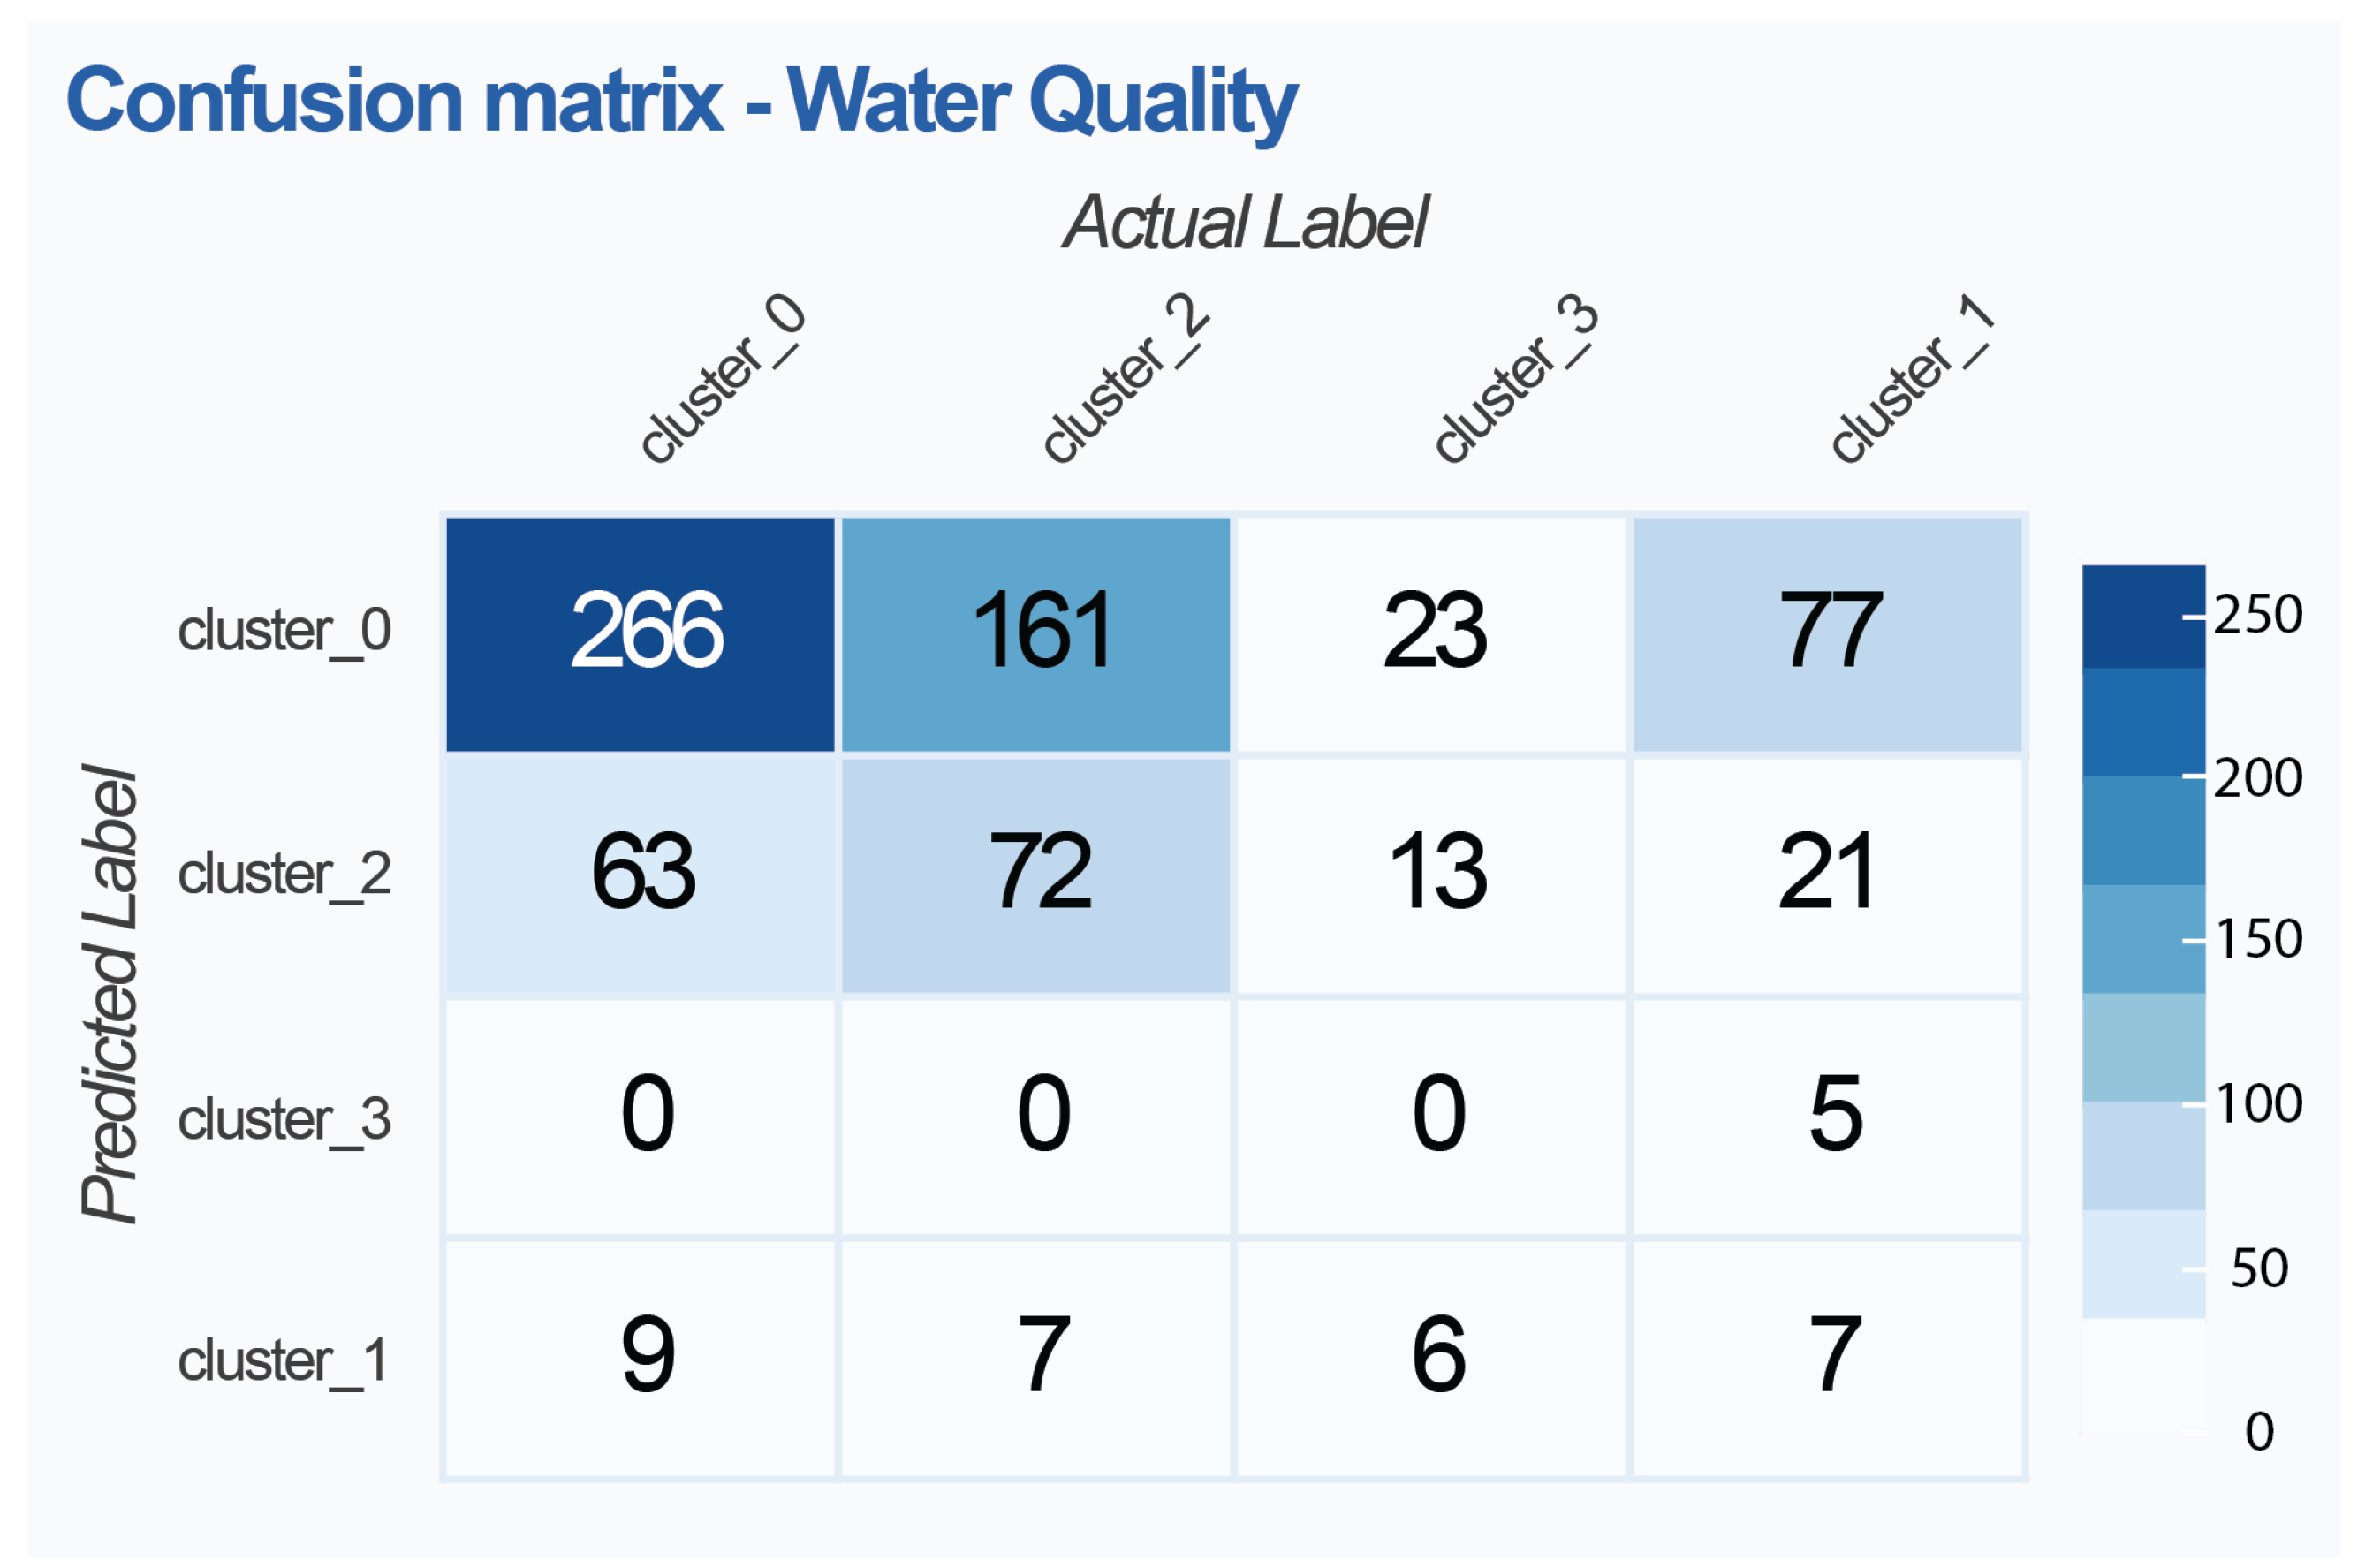
4.1. Water-Quality Monitoring

The data set obtained from the “La Cartuja” WWTP SCADA system was subjected to a series of steps to preprocess it and leave it ready for the data cleaning process. Once the data have been cleaned, a principal component analysis (PCA) is applied to extract the two main components that define the data set. Furthermore, a clustering process is executed using the K-means algorithm with k = 4, where each group the algorithm identifies belongs to a water quality cluster.
The platform allows the user to adjust if the water quality monitoring is displayed on the frontend according to the water treatment’s contaminants removal performance or effluent’s absolute water quality values. The WWTP operation period is another parameter the user can set from the platform. The above was implemented because the “La Cartuja” wastewater treatment plant had a plant design and equipment improvement over time, so it was essential to monitor and separate these two periods. Water quality profiles (or clusters) are plotted using a line profile chart and a spider chart. Figure 3 displays the monitoring module of the EDAR 4.0 platform. In Figure 3b–d,f it can be seen that the blue cluster (Cluster 0) has the worst water quality, whereas the red one is the best (Cluster 3). In addition, it can be noted that the WWTP should improve the treatment of the NTK chemical variable. Additionally, Figure 3a displays the menu bar of the platform with two selectors: one for the time period selection of the WWTP data and the other one for changing the visualization mode (performance or absolute values). Figure 3b,c shows the water quality profile in clusters for both performance and absolute values. The y-axis corresponds to a normalized (scaled) value of the variable’s water quality requirements from European Directive 91/271/EEC (Table 1), where the red dotted horizontal line denotes the limit set by the same European standard. For example, if the variable B O D 5 in absolute values is calculated by the clustering at 25 mgO 2 / L , it will be represented with a value on the y-axis of 1. If it is twice this value (50 mgO 2 / L ), it will be represented with a value on the y-axis of 2, showing that this variable does not comply with the water quality standard. As another example for the case of performance values, if the variable B O D 5 is calculated by clustering at a performance of 70 % , it will be represented on the y-axis with a value of 1. However, if it is twice this value ( 140 % ), it will be represented with a value on the y-axis of 2, showing that the variable complies, as it has a performance twice higher than what is required by the water quality standard. Figure 3d,e shows the same water quality profile (clusters) but using a spider plot representation for both performance and absolute values. Figure 3f,g displays the variable importance plot for performance and absolute values. For instance, the variables “effluent TSS perf” and “effluent TSS conc” were the most significant variables to compute the water quality profiling.

4.2. Water Quality Prediction

The water-quality prediction tool predicts the number of days the WWTP could have each water quality cluster in a month. For that, the backend implements Holt–Winters time-series forecasting. Two plots are displayed in the frontend: (i) the time-series cluster prediction plot, and (ii) the outlier probability plot. These plots can be seen in Figure 4. By way of explanation, Figure 4a presents in a specific month the total count (y-axis) of days the water quality was categorized into a specific cluster (red, green, yellow, or blue cluster), with each cluster representing a different water quality. The total count for a specific month for each cluster should sum up to the number of days in that month. Figure 4b corresponds to an outlier plot, a graphical representation that identifies and visualizes the outliers of a data set in different clusters over time. In cluster analysis, this outlier plot explicitly helps identify data points in each cluster that deviate significantly from the typical patterns observed within those groups. In both plots, the data after December 2014 correspond to the prediction data. In this graph, WWTP operators should ideally see that the highest prediction count is in the best water quality, the red cluster (Cluster 3), and the lowest in the worst water quality, the blue cluster (Cluster 0).

4.3. WWTP Model Creation & Simulation

At this stage, it is possible to create a data-based model for any WWTP process variable, including energy, water quality, process operation, and control-related variables of the wastewater treatment process. The model created in the platform by default is a water quality model. However, other process variables, such as energy consumption (kilowatts per day), can be modeled as a function of other process variables. In the backend, the machine learning system implemented can detect the most relevant variables for the models to be developed based on information such as a process variable’s correlation matrix. The method selected for the creation of models is based on decision trees. Once the model is created, it is possible to interact with the platform’s variables relevant to that model. Once the values are selected, a prediction of the modeled variables’ range of values can be performed with those values with which the model is simulated. This process is shown in Figure 5, which is based on an example of modeling electricity consumption; a set of values is given for the relevant variables, and, after running the simulation, the platform predicts that the WWTP will be in a range1 ( to 59,816 kW) of energy consumption, and the lower and upper limits of the intervals are computed automatically by RapidMiner. Thus, it includes the range from to + .
The confusion matrix can visualize the model’s performance in Figure 6, which shows how many of the values predicted by the model were correct according to the labels (real data).
In addition, the developed platform shows the relevance of the variables of the created model to the operator, as seen in Figure 7.
Finally, the dashboard presents the decision tree created for a specific variable (model), as seen in Figure 8.

4.4. WWTP Model Optimization

This platform component complements the simulator, where a target interval (range) is set for the modeled variable, and restrictions are placed on the variables that influence it. Once this has been done, optimal values can be obtained for each influential variable to guarantee the modeled variable’s target with the given restrictions. The algorithm used by RapidMiner is evolutionary optimization [36]. For example, Figure 9 shows which values of the chemical concentrations must be used to obtain the lowest possible range of energy consumption for the WWTP. The selector “Condition 1” allows the use of the range selected in the “Value 1” selector, where the “-” indicates that this variable will not be constrained, and the “=” restricts the variable to the specified range in the “Value 1” selector. All the ranges are restricted to five possible options.

5. Discussion

The end user validated the operational improvement provided by the developed tools. This improvement comprises the following aspects concerning the existing tools:
  • Observability: it allows monitoring of water quality through a visualization based on clustering.
  • Predictability: operators can forecast how their WWTP will go.
  • Risk-free evaluation: operators can validate how their system will perform if specific parameters change through simulation and optimization. it represents an essential advantage because, currently, operators are required to test their actual WWTP, which could lead to damage if their operating variables are not correctly manipulated.
  • Interpretability: The decision trees and variable importance graphs help the operators better understand their WWTP behavior.
The end user concluded that adequately trained and skilled staff could obtain the above benefits. Although initially this aspect might be interpreted as limiting, in the sense that, if the plant management staff does not have the appropriate training, obtaining the benefits from the developed tools could be a complex, time-consuming, and complicated task, in the end, it is considered as a favorable situation by the end users, as continuous education and training are part of worker’s rights and company’s obligation. Therefore, it is not seen as a limitation but as an opportunity to advance in innovation and continuous improvement. Thus, incorporating new 4IR technology is suitable for the company and its operators, and the economic benefits from implementing the improvements that the user can identify through these tools are clear. Furthermore, WWTP process simulation and optimization of variables, such as minimizing energy and reagents consumption and improving water quality, enables a more sustainable and environmentally friendly WWTP.
Finally, in addition to this qualitative and general validation, the end user could perform a quantitative validation of the performance of the developed ML models. On the one hand, Figure 10 shows the confusion matrix of the water quality model, a tool for validating the model’s predictive performance.
On the other hand, the predictor importance graph is shown in Figure 11, which gives very valuable information about the variables that, according to the models constructed, have the greatest influence on the operation of the WWTP; the end user has confirmed these variables as those that greatly influence the quality of the effluent water, which is the best proof of validation of the obtained results.

6. Conclusions

This paper introduces EDAR 4.0, a visual analytics-based platform developed for WWTPs that underscores the importance of sustainability in WWTP operations. By leveraging intuitive visualizations, the platform significantly enhances decision-making capabilities during the operation and management phases of WWTPs. It enables users to discern complex relationships between key process variables through advanced data inspection techniques. Furthermore, the tool empowers WWTP operators to conduct simulations and optimizations in a risk-free environment, facilitating energy-efficient practices and water quality improvements. These enhancements are pivotal for promoting sustainable WWTP operations, reducing environmental impact and conserving resources. The tool’s efficacy and potential as a vital resource for daily and strategic decision-making in WWTPs have been corroborated by domain experts, attesting to its role in advancing the sustainability of wastewater treatment processes.
As future work for consolidating the use of the developed tools for the management of WWTPs, several possibilities are foreseen: (i) firstly, it is proposed to scale up the tool for a multi-plant implementation approach; (ii) secondly, the development of a dynamic ammonium controller through the scenario analysis and optimization functionalities provided by the developed tools is proposed, which would be an important novelty for WWTPs; (iii) thirdly, it is also proposed to carry out an in-depth study concerning usability; and (iv) finally, the use of open-source Python libraries instead of RapidMiner v9.3 (commercial software) is proposed for data analysis and model construction tasks to reduce costs and improve scalability.

Author Contributions

Conceptualisation and investigation, D.V., A.M. and M.M.; supervision, M.M., B.S. and M.T.; validation and methodology, P.V., M.G., G.N. and J.O. All authors contributed to the writing and reviewing of the present manuscript. All authors read and agreed to the published version of the manuscript.

Funding

Universidad EAFIT and the Vicomtech Foundation, under the project EDAR 4.0, partly funded this research.

Institutional Review Board Statement

Not applicable.

Informed Consent Statement

Not applicable.

Data Availability Statement

The original data used for this study are the property of Giroa-Veolia and are therefore confidential.

Acknowledgments

The authors would like to thank the Basque Government for supporting project “EDAR 4.0”, project partners Mapner, Guascor Power, MaserMic, LKS Consultoría Tecnológica, Ibermática, IK4-Tekniker, Guascor Power I+D, and Instituto Ibermática de Innovación (i3B) for their contribution, and WWTP operators Utedeza and Consorcio de Aguas de Gipuzkoa for their collaboration. The authors from Universidad EAFIT would also like to thank Vice-Rectory for Discovery and Creation from Universidad EAFIT for partially supporting this research.

Conflicts of Interest

The authors declare no conflicts of interest.

Abbreviations

The following abbreviations are used in this manuscript:
4IRFourth Industrial Revolution
DAEDifferential algebraic equation
EDAExploratory data analysis
HMIHuman–machine interface
ICTInformation and communication technology
IWAInternational Water Association
IoTInternet of Things
LANLocal area network
MLMachine learning
ODEOrdinary differential equation
PCAPrincipal component analysis
PLCProgrammable logic controller
PVAProgressive visual analytics
SCADASupervisory control and data acquisition
VAVisual analytics
WWTPWastewater treatment plant

References

  1. Keim, D.; Andrienko, G.; Fekete, J.D.; Görg, C.; Kohlhammer, J.; Melançon, G. Visual Analytics: Definition, Process, and Challenges. In Information Visualization: Human-Centered Issues and Perspectives; Springer: Berlin/Heidelberg, Germany, 2008; pp. 154–175. [Google Scholar]
  2. Diez-Olivan, A.; Del Ser, J.; Galar, D.; Sierra, B. Data fusion and machine learning for industrial prognosis: Trends and perspectives towards Industry 4.0. Inf. Fusion 2019, 50, 92–111. [Google Scholar] [CrossRef]
  3. Newhart, K.B.; Holloway, R.W.; Hering, A.S.; Cath, T.Y. Data-driven performance analyses of wastewater treatment plants: A review. Water Res. 2019, 157, 498–513. [Google Scholar] [CrossRef] [PubMed]
  4. Luo, L.; Duan, N.; Wang, X.C.; Guo, W.; Ngo, H.H. New thermodynamic entropy calculation based approach towards quantifying the impact of eutrophication on water environment. Sci. Total Environ. 2017, 603, 86–93. [Google Scholar] [CrossRef] [PubMed]
  5. Maiza, M.; Odriozola, J.; Gil, A.; Naveran, G.; Basagoiti, R.; Lecuona, I.; Zurutuza, U.; Urchegi, G.; Mañas, A. Visual Analytics for supporting the Management of WWTPs. In Proceedings of the Young Water Professionals (YWP) Conference, 2017, Bilbao, Spain, 16–18 November 2017. [Google Scholar]
  6. European Directive 91/271/EEC; Council Directive 91/271/EEC of 21 May 1991 Concerning Urban Waste-Water Treatment. European Union Law: Brussels, Belgium, 1991.
  7. Cook, K.A.; Thomas, J.J. Illuminating the Path: The Research and Development Agenda for Visual Analytics; Technical Report; Pacific Northwest National Lab. (PNNL): Richland, WA, USA, 2005. [Google Scholar]
  8. Van Wijk, J. The value of visualization. In Proceedings of the VIS 05. IEEE Visualization, 2005, Minneapolis, MN, USA, 23–28 October 2005; pp. 79–86. [Google Scholar]
  9. Li, J.K.; Ma, K.L. P6: A declarative language for integrating machine learning in visual analytics. IEEE Trans. Vis. Comput. Graph. 2020, 27, 380–389. [Google Scholar] [CrossRef] [PubMed]
  10. Kalinin, A.A.; Palanimalai, S.; Zhu, J.; Wu, W.; Devraj, N.; Ye, C.; Ponarul, N.; Husain, S.S.; Dinov, I.D. SOCRAT: A Dynamic Web Toolbox for Interactive Data Processing, Analysis and Visualization. Information 2022, 13, 547. [Google Scholar] [CrossRef] [PubMed]
  11. Nawaz, A.; Arora, A.S.; Ali, W.; Saxena, N.; Khan, M.S.; Yun, C.M.; Lee, M. Intelligent Human–Machine Interface: An Agile Operation and Decision Support for an ANAMMOX SBR System at a Pilot-Scale Wastewater Treatment Plant. IEEE Trans. Ind. Inform. 2022, 18, 6224–6232. [Google Scholar] [CrossRef]
  12. Endert, A.; Ribarsky, W.; Turkay, C.; Wong, B.W.; Nabney, I.; Blanco, I.D.; Rossi, F. The state of the art in integrating machine learning into visual analytics. In Proceedings of the Computer Graphics Forum; Wiley Online Library: Hoboken, NJ, USA, 2017; Volume 36, pp. 458–486. [Google Scholar]
  13. Keim, D.A.; Munzner, T.; Rossi, F.; Verleysen, M. Bridging information visualization with machine learning (Dagstuhl Seminar 15101). In Dagstuhl Reports; Schloss Dagstuhl-Leibniz-Zentrum fuer Informatik: Wadern, Germany, 2015; Volume 5. [Google Scholar]
  14. Liu, S.; Wang, X.; Liu, M.; Zhu, J. Towards better analysis of machine learning models: A visual analytics perspective. Vis. Inform. 2017, 1, 48–56. [Google Scholar] [CrossRef]
  15. Stolper, C.D.; Perer, A.; Gotz, D. Progressive visual analytics: User-driven visual exploration of in-progress analytics. IEEE Trans. Vis. Comput. Graph. 2014, 20, 1653–1662. [Google Scholar] [CrossRef] [PubMed]
  16. Sun, D.; Huang, R.; Chen, Y.; Wang, Y.; Zeng, J.; Yuan, M.; Pong, T.C.; Qu, H. PlanningVis: A visual analytics approach to production planning in smart factories. IEEE Trans. Vis. Comput. Graph. 2019, 26, 579–589. [Google Scholar] [CrossRef] [PubMed]
  17. Wu, W.; Zheng, Y.; Chen, K.; Wang, X.; Cao, N. A visual analytics approach for equipment condition monitoring in smart factories of process industry. In Proceedings of the 2018 IEEE Pacific Visualization Symposium (PacificVis), Kobe, Japan, 10–13 April 2018; pp. 140–149. [Google Scholar]
  18. Jongrack, K.; Kwangtae, Y.; Wenhua, P.; Yejin, K. Modified Newton-Raphson Method to Minimize Calculation Time for Wastewater Treatment Plant Simulation. J. Korean Soc. Hazard Mitig. 2018, 18, 319–326. [Google Scholar]
  19. Flores-Alsina, X.; Kazadi Mbamba, C.; Solon, K.; Vrecko, D.; Tait, S.; Batstone, D.J.; Jeppsson, U.; Gernaey, K.V. A plant-wide aqueous phase chemistry module describing pH variations and ion speciation/pairing in wastewater treatment process models. Water Res. 2015, 85, 255–265. [Google Scholar] [CrossRef] [PubMed]
  20. Jeppsson, U.; Rosen, C.; Alex, J.; Copp, J.; Gernaey, K.V.; Pons, M.N.; Vanrolleghem, P.A. Towards a benchmark simulation model for plant-wide control strategy performance evaluation of WWTPs. Water Sci. Technol. 2006, 53, 287–295. [Google Scholar] [CrossRef] [PubMed]
  21. Li, Z.; Kovachki, N.; Azizzadenesheli, K.; Liu, B.; Bhattacharya, K.; Stuart, A.; Anandkumar, A. Fourier Neural Operator for Parametric Partial Differential Equations. arXiv 2020, arXiv:2010.08895. [Google Scholar]
  22. Matrosov, E.S.; Huskova, I.; Kasprzyk, J.R.; Harou, J.J.; Lambert, C.; Reed, P.M. Many-objective optimization and visual analytics reveal key trade-offs for London’s water supply. J. Hydrol. 2015, 531, 1040–1053. [Google Scholar] [CrossRef]
  23. Kim, M.; Kim, Y.; Kim, H.; Piao, W.; Kim, C. Operator decision support system for integrated wastewater management including wastewater treatment plants and receiving water bodies. Environ. Sci. Pollut. Res. Int. 2016, 23, 10785–10798. [Google Scholar] [CrossRef] [PubMed]
  24. Heo, S.; Nam, K.; Loy-Benitez, J.; Yoo, C. Data-Driven Hybrid Model for Forecasting Wastewater Influent Loads Based on Multimodal and Ensemble Deep Learning. IEEE Trans. Ind. Inform. 2021, 17, 6925–6934. [Google Scholar] [CrossRef]
  25. Jafar, R.; Awad, A.; Jafar, K.; Shahrour, I. Predicting Effluent Quality in Full-Scale Wastewater Treatment Plants Using Shallow and Deep Artificial Neural Networks. Sustainability 2022, 14, 15598. [Google Scholar] [CrossRef]
  26. Shao, S.; Fu, D.; Yang, T.; Mu, H.; Gao, Q.; Zhang, Y. Analysis of Machine Learning Models for Wastewater Treatment Plant Sludge Output Prediction. Sustainability 2023, 15, 13380. [Google Scholar] [CrossRef]
  27. Piao, W.; Kim, C.; Cho, S.; Kim, H.; Kim, M.; Kim, Y. Development of a protocol to optimize electric power consumption and life cycle environmental impacts for operation of wastewater treatment plant. Environ. Sci. Pollut. Res. Int. 2016, 23, 25451–25466. [Google Scholar] [CrossRef] [PubMed]
  28. AvRuskin, G.A.; Jacquez, G.M.; Meliker, J.R.; Slotnick, M.J.; Kaufmann, A.M.; Nriagu, J.O. Visualization and exploratory analysis of epidemiologic data using a novel space time information system. Int. J. Health Geogr. 2004, 3, 26. [Google Scholar] [CrossRef] [PubMed]
  29. Ghosh, A.; Nashaat, M.; Miller, J.; Quader, S.; Marston, C. A comprehensive review of tools for exploratory analysis of tabular industrial datasets. Vis. Inform. 2018, 2, 235–253. [Google Scholar] [CrossRef]
  30. Anderberg, M. Cluster Analysis for Applications: Probability and Mathematical Statistics: A Series of Monographs and Textbooks; Probability and Mathematical Statistics; Elsevier Science: Amsterdam, The Netherlands, 2014. [Google Scholar]
  31. Haggarty, R.; Miller, C.; Scott, E.; Wyllie, F.; Smith, M. Functional clustering of water quality data in Scotland. Environmetrics 2012, 23, 685–695. [Google Scholar] [CrossRef]
  32. Wong, H.; Hu, B. Application of interval clustering approach to water quality evaluation. J. Hydrol. 2013, 491, 1–12. [Google Scholar] [CrossRef]
  33. Vo-Van, T.; Nguyen-Hai, A.; Tat-Hong, M.V.; Nguyen-Trang, T. A New Clustering Algorithm and Its Application in Assessing the Quality of Underground Water. Sci. Program. 2020, 2020, 6458576. [Google Scholar] [CrossRef]
  34. Saary, M.J. Radar plots: A useful way for presenting multivariate health care data. J. Clin. Epidemiol. 2008, 61, 311–317. [Google Scholar] [CrossRef]
  35. Velasquez, D.; Toro, M.; Bruse, J.L.; Oregui, X.; Maiza, M.; Sierra, B. A Novel Architecture Definition for AI-Driven Industry 4.0 Applications. In Proceedings of the 2023 International Conference on Intelligent Computing and Control (IC&C), Wuhan, China, 24–26 February 2023; pp. 25–31. [Google Scholar]
  36. Fortuna, L.; Rizzotto, G.; Lavorgna, M.; Nunnari, G.; Xibilia, M.G.; Caponetto, R. Evolutionary Optimization Algorithms. In Soft Computing: New Trends and Applications; Springer: London, UK, 2001; pp. 97–116. [Google Scholar]
Figure 1. Visual analytics process framework adapted from [8].
Sustainability 16 03578 g001
Figure 2. EDAR architecture [35].
Sustainability 16 03578 g002
Figure 3. Visual analytics water quality monitoring platform. (a) Monitoring configuration parameters. (b) Water quality line chart (performance). (c) Water quality line chart (absolute). (d) Water quality spider chart (performance). (e) Water quality spider chart (absolute). (f) Water quality variable importance (performance). (g) Water quality variable importance (absolute).
Sustainability 16 03578 g003
Figure 4. Visual analytics water quality prediction platform. (a) Water quality forecast. (b) Water quality forecast outlier probability plot.
Sustainability 16 03578 g004
Figure 5. Energy consumption model simulation.
Sustainability 16 03578 g005
Figure 6. Confusion matrix for the electric model.
Sustainability 16 03578 g006
Figure 7. Variable influence for the electric model.
Sustainability 16 03578 g007
Figure 8. Decision tree for the electric model.
Sustainability 16 03578 g008
Figure 9. Energy consumption model optimization.
Sustainability 16 03578 g009
Figure 10. Confusion matrix for water quality model.
Sustainability 16 03578 g010
Figure 11. Variable importance for water quality model.
Sustainability 16 03578 g011
Table 1. Water quality requirements from European Directive 91/271/EEC.
VariableAbsolute ValuesPerformances
B O D 5 25 mg O 2 /L70%
T C O D 125 mg O 2 /L75%
T K N 10 mg/L90%
T P 1 mg/L80%
T S S 35 mg/L70%
Disclaimer/Publisher’s Note: The statements, opinions and data contained in all publications are solely those of the individual author(s) and contributor(s) and not of MDPI and/or the editor(s). MDPI and/or the editor(s) disclaim responsibility for any injury to people or property resulting from any ideas, methods, instructions or products referred to in the content.

