

Socioeconomic Determinants of Poverty Reduction among Irrigating Farmers in Mberengwa District, Zimbabwe

1
Department of Agricultural Economics and Development, Midlands State University, Gweru P.O. Box 9055, Zimbabwe
2
Gordon Institute of Business Science, University of Pretoria, Lynnwood Rd, Hatfield, Pretoria 0002, South Africa
3
Department of Lands and Water Resources Management, Midlands State University, Gweru P.O. Box 9055, Zimbabwe
4
School of Agriculture, Earth and Environmental Sciences, University of KwaZulu-Natal, Pietermaritzburg 3201, South Africa
*
Authors to whom correspondence should be addressed.
Sustainability 2024, 16(9), 3580; https://doi.org/10.3390/su16093580
Submission received: 23 January 2024
/
Revised: 25 March 2024
/
Accepted: 17 April 2024
/
Published: 24 April 2024
Abstract
:Sustainable Development Goal 1 aims to end extreme poverty everywhere by the year 2030. Smallholder irrigation development is arguably a vital strategy to reduce rural poverty. The authors assessed the socioeconomic determinants of poverty reduction in Mberengwa district, Zimbabwe. Data were collected from 444 randomly selected households. Data were analyzed using SPSS version 27 and Microsoft Excel 2019 software packages. Chi-square tests, t-tests, and Foster–Greer–Thorbecke (FGT) poverty index and binary logistic regression model tests were performed. The chi-square test results show an association between access to irrigation and farmer’s level of education (p < 0.01). The t-test results show significant differences between irrigators and non-irrigators for household size (p < 0.01), household labor (p < 0.05), and rainfed plot size (p < 0.05). FGT indices show that the poverty incidence, depth, and severity were lesser for irrigators than non-irrigators. The binary logistic regression model results show that age, household size, access to irrigation and household income significantly influence household poverty status. In conclusion, access to irrigation reduces poverty in rural areas. However, access to irrigation is not a panacea for poverty reduction in rural areas. Smallholder irrigation development policies should consider socioeconomic determinants of poverty reduction to properly target and tailor interventions, and increase the relevance and effectiveness of poverty reduction efforts.
1. Introduction
Poverty reduction has remained a common goal and priority for most countries worldwide. Sustainable Development Goal 1 (SDG1) aims to end extreme poverty worldwide by 2030 [1]. Extreme poverty refers to living on less than USD 2.15 per person daily in 2017 purchasing power parity (PPP) [1]. Using this threshold, in the year 2022, about 670 million people (8.4%) worldwide were impoverished, and 62% of the extremely poor people were located in Sub-Saharan Africa (SSA) [1].
The Word Bank [2] reports that extreme poverty decreased across the world from 36.2% (approximately 1.9 billion people) in 1990 to 9.2% (approximately 650 million people) in 2015. In 1990, poverty was more concentrated in Asia, with China and India having more than 52% (1 billion people) of the poor people in the world [3]. The decrease in global poverty was mostly attributed to the economic growth and development in China and India between 1990 and 2015 [2]. The other regions of the world also experienced a reduction in poverty during the same period, except for SSA [3]. Poverty is more concentrated in SSA, with a poverty rate of 41% in 2018 (about 413 million people) from 15% in 1990 [3]. This compares to poverty rates of 12.4% for South Asia, 4.1% for the Caribbean and Latin America, 2.7% for the Middle East and North-Africa, 2.3% for East Asia and the Pacific, and 1.5% for Europe and Central Asia [3]. The higher poverty rates in SSA are reported to be more prevalent in countries with high population growth rates, as well as conflict-affected ones, such as Chad, Central African Republic, Cote d’Ívoire, Democratic Republic of Congo, Liberia, Somalia, South Sudan, Togo, and Zimbabwe [4,5].
The World Bank [1] predicts that if economic growth continues on the current trajectory, about 7% of the world population (575 million people) could be extremely poor by the year 2030 and 87% of the poorest people in the world will be living in Africa. The poverty situation was worsened by the advent of the COVID-19 pandemic, which shut down most socio-economic activities across the globe [3]. Over 80% of the impoverished people in Africa are farmers who stay in rural areas [6,7,8,9,10]. Hence, efforts to reduce poverty in Africa are more effective if directed towards the agricultural sector in rural areas.
In Zimbabwe, approximately 10 million people (71% of the population) are poor, with individual consumption levels below the country’s Total Consumption Poverty Line (TCPL) of USD 2.31 per day [7,11,12]. Poverty is mainly a rural challenge in the country, with approximately 90% of impoverished people staying in rural areas [13]. Nearly 70% of the poorest people in Zimbabwe earn a living from farming [7,14]. This implies that poverty reduction efforts should be mainly targeted and tailored to the needs of the rural poor people. Smallholder irrigation, in particular, holds a unique place within the water and poverty debate [15,16,17]. Many scholars contend that investments in smallholder irrigation are essential for increasing crop productivity and food security, and ultimately reducing poverty in agro-based economies [11,18,19,20].
The government of Zimbabwe (GoZ) acknowledges that the agriculture sector can promote pro-poor economic growth and sustainable development [21]. The GoZ’s national economic blueprint, the National Development Strategy (NDS) 1, proposes to improve agriculture production and productivity by increasing the irrigated land area from 180,000 hectares (ha) to more than 350,000 ha from 2021 to 2025 [21]. It will be achieved through investments in water harvesting, dam building, borehole drilling, new irrigation development, and infrastructure rehabilitation [21]. The increase in agriculture production and productivity will enhance income, warrant food and nutrition security, increase opportunities for value addition, and enhance the development of agribusiness value chains in the country [21]. However, few studies have assessed the viability and impact of smallholder irrigation development investments on poverty reduction [22,23,24].
Previous studies on poverty reduction and smallholder irrigation have yielded inconsistent findings [9,23,25,26,27,28]. For example, Haji et al. [25] studied the impact of Mede Telila small-scale irrigation on poverty reduction in the Gorogutu district of Ethiopia. The results show that irrigation significantly impacted poverty alleviation. In addition, Sinyolo [26] assessed the contribution of smallholder irrigation to the welfare of households in South Africa, and found that irrigating households had better welfare indicators than non-irrigators. However, on the contrary, a study conducted by Fanadzo [27] in South Africa revealed that smallholder irrigation schemes have performed poorly and failed to reduce poverty. Research conducted by Mutambara, Darkoh and Atlhopheng [9] argued that most smallholder irrigation projects in Africa failed, except for a few cases in North African countries such as Tunisia and Morocco. Chivizhe [23] carried out a study in Zimbabwe to assess agricultural productivity and poverty reduction in smallholder irrigation schemes, and found that poverty was significantly high among the irrigators. In addition, the study argued that smallholder irrigation schemes should remain a development model for rural communities. Furthermore, a systematic review by Mupaso et al. [28] concluded that investments in smallholder irrigation are essential to improving crop productivity, household food security and livelihoods.
The mentioned studies provide evidence that helps us to understand the contribution of irrigation to poverty reduction in rural communities. The mixed views on the influence of smallholder irrigation to poverty reduction show that the context and socioeconomic conditions of the irrigators are crucial to understanding the irrigation and poverty reduction nexus. Socioeconomic factors are integral to achieving SDG 1, as they provide a holistic understanding of poverty by considering the interplay between economic conditions, social structures, and individual capabilities. Excavating the determinants of poverty is especially relevant for SSA in general, and in Zimbabwe in particular, where stubborn pockets of poverty still exist, particularly among smallholder farmers [21]. Understanding the socioeconomic factors influencing poverty reduction is crucial for formulating effective policy interventions by focusing on the root causes of poverty rather than merely addressing the symptoms. Socioeconomic characteristics provide insights into which groups are most susceptible to poverty. Factors such as income levels, education, occupation, gender, age, and geographical location can help identify populations that are at a higher risk of poverty [6]. Understanding these characteristics allows policymakers and development practitioners to properly design and target interventions towards specific groups of people in the community that require the most support and resources. This enhances the effectiveness of poverty reduction policies and programs. However, studies have over-looked the socioeconomic determinants of poverty reduction in Zimbabwe. This study addresses this dearth in the literature by investigating the socioeconomic determinants of poverty reduction among irrigating households in Zimbabwe.
2. Materials and Methods
2.1. Study Site
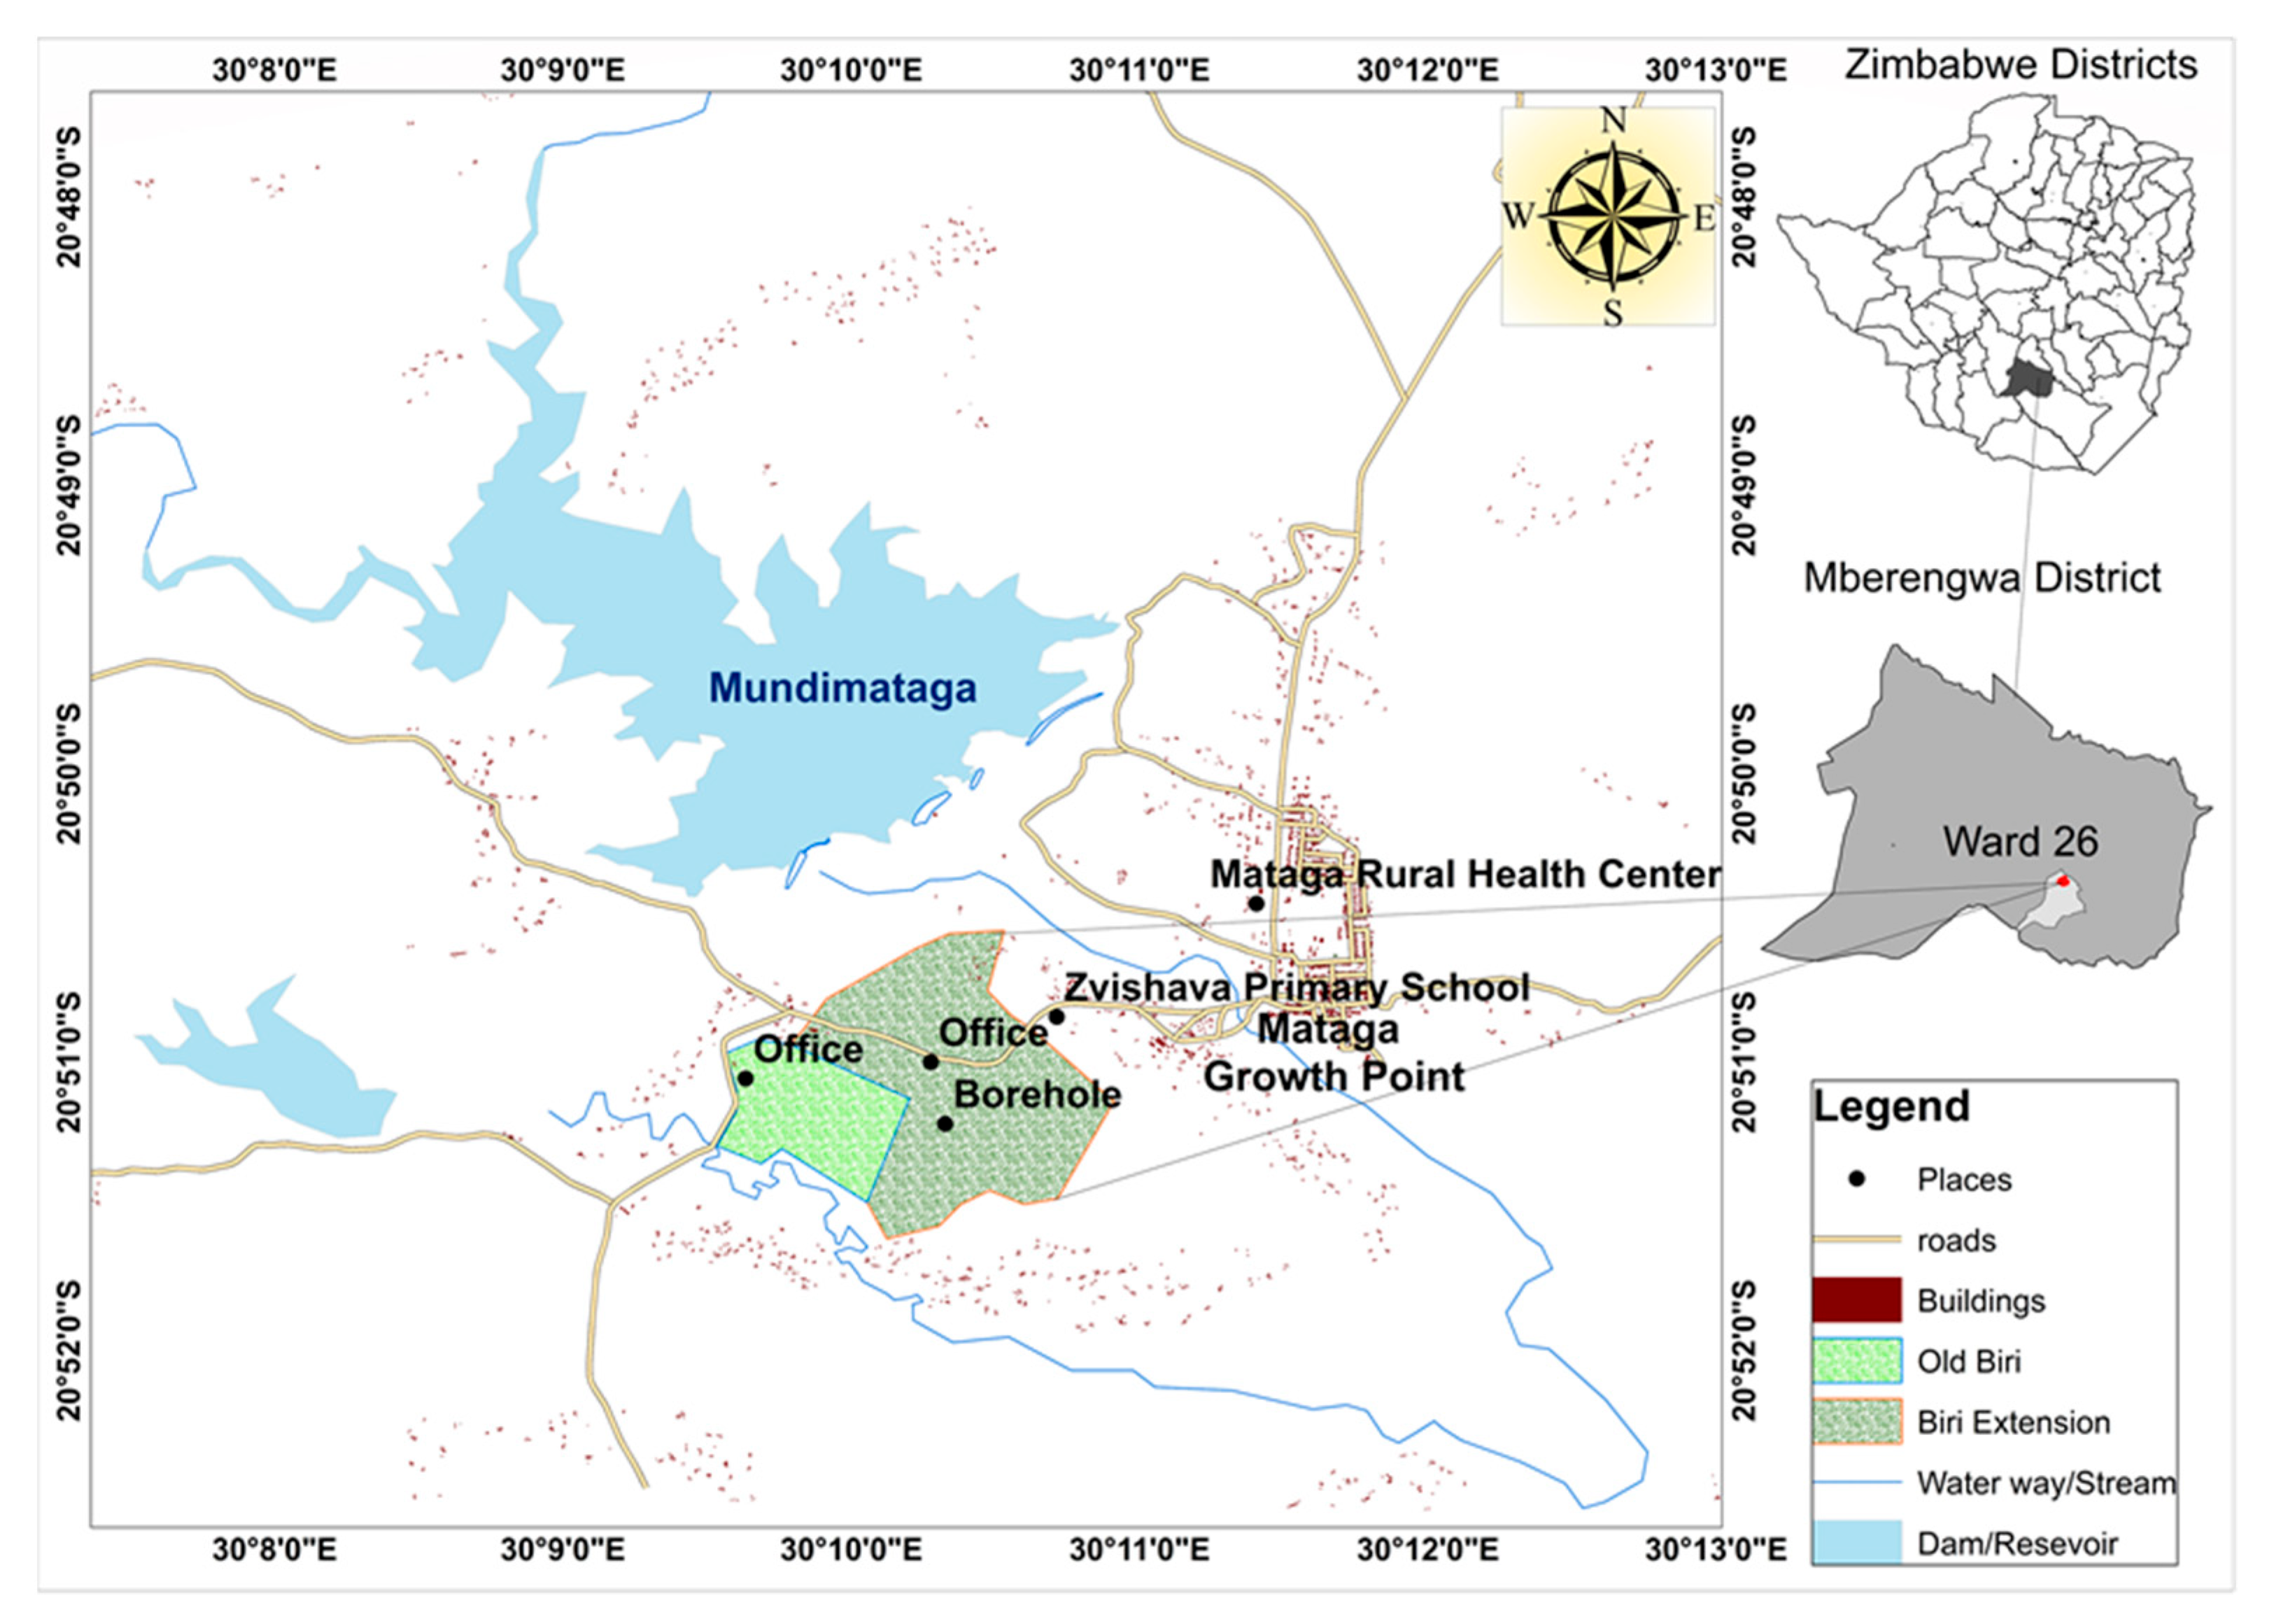
The study was conducted in the Mberengwa district of the Midlands Province in Zimbabwe (Figure 1). Mberengwa is a semi-arid area that receives an annual rainfall of 450–600 mm [29,30]. The rainfall is insufficient for meaningful rainfed crop production; thus, irrigation contributes significantly to food production in the area [30,31]. The researcher purposively selected Mberengwa district because it has a high prevalence of poverty, estimated to be 31.6% [12]. The study sites were the Old-Biri and Biri-Extension irrigation schemes, and the surrounding villages. The irrigation schemes are located adjacent to each other and separated by a road. Both schemes form what Agritex, the county’s agricultural extension system, refers to as a Mataga cluster scheme.
The Old-Biri irrigation scheme was commissioned in 1988 to irrigate 40.2 ha using a surface irrigation system, and has 71 beneficiaries comprising 22 females and 49 males [32]. The scheme is in Shoshera village under Ward 26 (20.850580° E, 30.161120° S). The beneficiaries of the scheme mainly come from Shoshera and Dzingai villages. The scheme draws water from the Biri dam located on the Biri River, a tributary of the Mundi Mataga River. The beneficiaries own an average of 0.5 ha plots. The Biri-Extension irrigation scheme was commissioned in 2005 to irrigate 117 ha using the surface irrigation system, with the potential to extend to 131 ha [32]. The irrigation scheme draws water from the Mundi Mataga Dam. It has 280 beneficiaries comprising 134 females and 146 males from eight villages. Beneficiaries own an average of 0.5 ha plots. The main crops grown at both schemes are maize (Zea mays), groundnuts (Arachis hypogaea) and sugar beans (Phaseolus vulgaris) in summer and wheat (Triticum aestivum), green mealies, and a variety of green vegetables during the winter season. The farmers also practice livestock production, rearing cattle, goats, sheep, donkeys, and poultry. Cattle and donkeys are sources of draught power. The irrigation schemes have constitutions managed by Irrigation Management Committees (IMC) chosen by irrigators.
2.2. Sample Selection
There are several approaches to obtaining the appropriate sample size for a study, such as conducting a census, adopting the sample sizes of similar studies, and utilizing published tables and formulas to calculate the sample size [33]. This study used Slovin’s formula suggested by Israel [33] to compute the appropriate sample size because the researcher was not aware of the population’s behavior (see Equation (1)).
where n = sample size, N = population size, and e = level of precision.
The study assumed a 95% confidence level, a precision level of 5%, and a population of 5000 smallholder irrigators. The study population comprised all the irrigators in communal irrigation schemes located in agroecological regions IV and V of Zimbabwe, where irrigated farming plays a significant role [29,30,31]. Substituting these variables into Equation (1) makes the required sample size 370 irrigators (Equation (2)).
The statistically representative sample size was 370 irrigators. The total number of irrigators at the selected irrigation schemes was 351 (consisting of 280 from the Biri-Extension irrigation scheme and 71 from the Old-Biri irrigation scheme). As a result, all the irrigators under both irrigation schemes participated in the study.
In addition, a control group of non-irrigators from areas adjacent to the irrigation schemes participated in the study. A sample of 100 non-irrigators from villages surrounding the Old-Biri and Biri-Extension irrigation schemes were selected to represent the rainfed farming system. According to Israel [33], reviewing the literature in a discipline can guide the identification of “typical” sample sizes appropriate for a study. Hence, following Israel [33], the sample size for non-irrigators was derived based on sample sizes from similar studies, such as Sinyolo [26], Haji et al. [25], and Bacha et al. [34]. The non-irrigators were randomly selected using the registers obtained from village heads adjacent to the irrigation schemes.
2.3. Data Collection
Primary data were gathered from the irrigators and non-irrigators using a structured questionnaire in October 2022. The questionnaire was pre-tested with seven farmers from the Biri-Extension scheme. The pre-test was conducted to improve the validity of the instrument and the reliability of information collected [35]. The questionnaire was adjusted based on the feedback from the pre-testing exercise. Four trained enumerators who speak the local languages (Shona and Ndebele) assisted the researcher with data collection. The questionnaire captured household demographic information. Crop production information such as irrigated plot size, number of irrigated plots, the area under food crop in the last season, crops grown, area planted total yield, quantity sold, produce marketplace, winter and summer crop production costs, and access to extension were collected. Information on asset endowment, such as quantities of livestock owned, farm implements owned and household assets owned, was also gathered. Data collected from the control (rainfed sample) included those on age, marital status, gender, household size, full-time occupation, number of dependents, farming experience, household labor, religion, farm size, crops grown, area planted, total yield, quantity sold, produce marketplace, crop production costs, access to extension, household income, household expenditure, livestock owned, farm implements owned, and household assets owned.
2.4. Data Analysis
- i.
- Socioeconomic Characteristics
The Statistical Package for Social Sciences (SPSS) version 27 and Microsoft Excel 2019 software packages were used to analyze the data. The socioeconomic characteristics of respondents were analyzed using descriptive statistics. Frequencies, means, and standard deviation were among the measurements used. The t-tests were used to check if the observed differences in means for selected continuous variables were significant. Chi-square tests were performed to measure associations between selected categorical variables. The findings are presented using tables.
- ii.
- Poverty Estimation
- (a)
- Poverty linePoverty was estimated using the household daily income per adult equivalent and comparing it with the poverty line [6,36]. The international poverty line was used to classify respondents as poor or nonpoor. Respondents were considered poor if their daily income per adult equivalent was lower than the international poverty line of USD 2.15 and not poor if it was equal to or greater than the poverty line [1].
- (b)
- Foster–Greer–Thorbecke class of poverty measures
The Foster–Greer–Thorbecke (FGT) class of poverty measures is widely used in empirical studies to estimate poverty due to its simplicity [37]. The indices within FGT measures are computed by substituting different values of the parameter α into Equation (3) [37]:
where z = poverty line, N = sample size, H = number of poor, and yi = income of each ith individual [37].
If α is small, then the FGT measure assigns the same weight to every person whose income is less than z. The greater the value of α, the larger the weight put on the poorest individuals [37]. The greater the FGT statistic, the higher the poverty levels in a community. When α = 0, the FGT formula reduces to the headcount index (Equation (4)), which measures the percentage of the population that is poor. The headcount poverty index is the proportion of the population that lives in a household with per capita income less than the poverty line [37].
When α = 1, the formula reduces to the poverty gap index (Equation (5)). The poverty gap index measures the proportion of the population that lives below the poverty line. The minimum cost of ending poverty is determined by summing the poverty gaps [37].
When α = 2, the formula reduces to the squared poverty gap index (Equation (6)). The squared poverty gap index averages the squares of the poverty gaps relative to the poverty line [37]. This measure reflects the severity of poverty.
- iii.
- Determinants of Poverty
The study employed binary logistic regression analysis to identify the socioeconomic variables affecting the farmers’ poverty status. Binary logistic regression is employed when the dependent variable is binary [38]. The dependent variable was the poverty status of the farmer, measured as PVi = 1 indicating not poor based on daily income and PVi = 0 indicating otherwise [6]. The probability of a farmer i being poor or not poor (PVi) is a function of socioeconomic characteristics (Xi) such as irrigation access, gender, education, age, household size, farm size, livestock holding, household income, and household expenditure, as indicated in Equation (7).
The degree of poverty can be expressed as an underlying unobserved or latent variable (PVi*) where the unobservable variable is linked to the farmer’s characteristics Xi [6]. Therefore,
where is the estimated vector of parameters and is the error term that accounts for unobserved variations in the farmers’ poverty status [6]. This is stated as
If the residuals are independent and identically distributed with a cumulative distribution function given as and whose probability density function is , an analytical solution exists [6], and the probability of a given alternative choice for the ith farmer is given as
where Prob (Not poor = 1) is the probability that farmer i is not poor, Xi is a vector of the farmer’s characteristics, and are the parameters of the estimated exogenous variables [6].
The study used the maximum likelihood method to estimate the parameters. The binary logistic regression produces odds ratios or marginal coefficients [6]. According to Kibet et al. [6], the odds ratio indicates that a change of one unit in an exogenous variable causes a change of exp β in the likelihood that the farmer is not poor (Prob (Not poor = 1)). Marginal coefficients show how each external variable affects the probability of farmers being poor [39]. The slope of a logistic regression function indicates how changes in the explanatory variables affect the log odds ratio of being not poor [6]. For example, given that Prob (Not poor = 1) is the probability of being not poor, then [1 − Prob (Not poor = 1)] represents the probability of being poor [6]. This is given as:
The odds ratio formula is as follows:
The empirical specification of the model is shown in Equation (13), as
where is the slope, are the coefficients and are the independent variables. Table 1 shows a description of the independent variables. A review of similar studies was used to determine the choice of independent variables (see [40,41,42]).
According to Kibet et al. [6], the following assumptions are necessary for the estimation of a binary logistic regression model. First, the dependent variable should be ordinal. Second, there ought to be a linear relationship between independent and dependent variables [6]. Third, the errors should not be correlated. Fourth, there should not be multicollinearity [6].
3. Results and Discussion
3.1. Socioeconomic Characteristics
Table 2 shows the distribution of the respondents by gender and level of education. The results show that most of the respondents were male (56.4% for irrigators and 51% for non-irrigators). However, the chi-square test result shows that p = 0.340, which is greater than 0.05, meaning that the gender of the farmer and irrigation access are not significantly associated. However, understanding gender roles within given farming systems and communities helps policymakers and development practitioners to design and target policies and programs that enhance agricultural productivity [44]. The gendered approach to farming recognises that women and men often have different roles, challenges, and needs that might affect their agricultural performance and poverty status [40].
An analysis of the education level of the farmer was also conducted (Table 2). Education improves farmers’ ability to access information and resources. Most farmers reported to have attained a secondary education level (72.1% for irrigators and 68% for non-irrigators). The chi-square test results show that p = 0.001, which is less than 0.05, meaning that the farmer’s education level and access to irrigation are significantly associated. Irrigators were found to be more educated than non-irrigators. Irrigation is a complex and technical process that requires a certain level of education and training to be successful. Educated farmers are more likely to adopt new technologies introduced to improve a farming system [45]. Higher education levels are associated with increased knowledge of agricultural techniques, technology, and management practices, which may lead to improved yields and profitability [45].
Table 3 shows the t-test results regarding differences in means for selected continuous variables. The t-test was performed to determine if there were any significant differences between irrigators and non-irrigators. The findings of the t-test indicate that there were significant differences in household size (p < 0.01), household labor (p < 0.05), and rainfed plot size (p < 0.05) between irrigators and non-irrigators.
The household size is a proxy for household labor as it influences the availability and allocation of labor, which also affects the types of crops that can be grown and the yields [46]. Table 3 shows that the average household size is 4.9 for irrigators and 4.3 for non-irrigators. In addition, the average household labor is 2.8 for irrigators and 2.5 for non-irrigators. Irrigation farming is labor-intensive compared to rainfed farming as crops are grown yearly. The land holding of a farmer is a crucial variable in farming. The land is a factor of production that is finite. Table 3 shows that the average rainfed plot size was 1.1 ha for irrigators and 2.6 ha for non-irrigators. The size and quality of farmland determine the scale of production and the types of crops or livestock that can be grown. The land also affects the ability of a farmer to implement sustainable farming practices such as conservation farming and organic farming [47].
3.2. Poverty Estimation
The three most commonly used poverty measures in economic analysis are poverty incidence, gap, and severity. The measures indicate the scale and nature of poverty within a specific population. The headcount index, poverty gap, and poverty severity index for irrigators and non-irrigators are shown in Table 4. Poverty was more prevalent among the non-irrigators (70%). About 32% of the irrigators were found to be living in poverty. This implies that the incidence of poverty on rainfed farms is 38% higher than on irrigated farms. The findings are consistent with those of studies by Hussain, Hussain and Ashfaq [18] and Zemarku et al. [42]. However, if not managed well, irrigation water can also cause poverty [47], which might also explain why 32% of the irrigators are poor. The mismanagement of irrigation water can lead to waterlogging, salinization, and decreased crop yields, which lead to increased poverty levels [47].
The poverty gap refers to the difference between the poverty line and the average income of the poor [37], whereas the poverty severity index refers to how far below the poverty line the poorest of the poor are [37]. The poverty gap was 0.09 for irrigators and 0.38 for non-irrigators. This suggests that irrigators are not as impoverished as non-irrigators. Hence, it means that to move out of poverty, non-irrigators should increase their current income level by 38%, while poor irrigators have to increase their income level by 9%. The poverty severity index for irrigators was 0.03 and it was 0.25 for non-irrigators. This implies that there is more poverty inequality among non-irrigators. The poverty gap and severity indices suggest that poverty is more severe and widespread for non-irrigators than for irrigators.
3.3. Determinants of Poverty
The determinants of poverty were measured using the binary logistic regression model. The presence of multicollinearity was tested using the Variance Inflation Factor (VIF) and contingency coefficients for continuous and categorical variables, respectively. The VIF values were below 10 and the values of the contingency coefficient were less than 0.7; hence, the results show that there is no multicollinearity [48]. The binary logistic regression model’s findings are presented in Table 5. The Nagelkerke R-Square result shows that the model managed to correctly predict 72.9% of the responses. The chi-square statistic for Hosmer and Lemeshow test was 6.146 and the model was not significant, p = 0.631, indicating that the model adequately fits the data. The binary logistic regression results show that most of the independent variables had expected signs, except for the education of household heads and livestock holding. The dependent variable was found to have a significant association with variables such as age, gender, household size, access to irrigation and income.
The age of the head of household has a negative and significant correlation with the likelihood of being not poor (p = 0.079, which is less than 0.1). This suggests that an increase in age by one year increases the likelihood of being poor by a factor of 0.97. The likelihood of being poor increases with age, since older people tend to have limited work opportunities and lower wages than younger people, and also assets tend to deplete with age [41,42]. These results are similar to those of studies conducted by Eneyew et al. [41] and Awazi, Tchamba and Avana [40], which found that older people have a greater likelihood of being poor than young people. Thus, policies and programs aimed at reducing poverty should be targeted towards the elderly in the communities, as they are more vulnerable to poverty than young people and require more support and resources.
The household size has a negative and significant correlation with the likelihood of being not poor (p = 0.000 which is less than 0.01). This means that as household size increases by an additional member, the likelihood of being poor increases by a factor of 0.46. The results concur with the a priori expectation that as the household size increases, the family’s welfare decreases due to the increased dependency ratio. Large households are expected to be more likely to be poor than small households [42]. The results concur with a study by Bacha et al. [34] that found a negative correlation between family size and poverty. Hence, interventions to reduce poverty in rural areas should be tailored to meet the needs of large households and allow for a strategic allocation of resources where they are most needed and can have the greatest impact.
Access to irrigation has a positive and significant correlation with the likelihood of being not poor (p = 0.030 which is less than 0.05). Thus, a 1% increase in access to irrigation reduces poverty by 4.72%. The results are similar to the a priori expectation that access to irrigation reduces poverty. The results are similar to those of Eneyew et al. [41]. The results affirm that smallholder irrigation reduces poverty in rural areas [11,18,19,20]. Access to irrigation reduces poverty through increased crop production, increased income, reduced vulnerability to hunger and food insecurity, and job creation [11]. Access to irrigation is a necessary, though not sufficient, condition to reduce poverty in rural areas. It is important to assess the impact of irrigation development before implementation to ensure that resources are allocated efficiently and effectively. This approach improves the chances of success and minimizes the risk of unintended consequences. For instance, if mismanaged, access to irrigation water can result in an increase in poverty due to waterborne diseases, waterlogging, salinization, and decreased crop yields [47]. Hence, policies and programs aimed at irrigation development to reduce poverty should be evidence-based and tailored to local contexts.
Table 5 shows that household income has a positive and significant correlation with the likelihood of being not poor (p = 0.000 which is less than 0.01). This means that if household income increases by one dollar, the likelihood of being poor reduces by a factor of 1.03. The results concur with the a priori expectation that households with higher income per capita have a low likelihood of being poor [43]. The results are also similar to those of research carried out by Zemarku et al. [42], which found that households with higher incomes are likely to have more resources to meet their basic needs, and maintain a good standard of living, which helps them to reduce poverty. Limited resources are often a constraint when implementing poverty reduction interventions. Understanding the household incomes of the targeted communities helps in prioritizing resource allocation based on the severity of poverty and the potential impact of the intervention. For example, impoverished rural communities may require interventions focused on agricultural development, access to markets, skills training, and job creation to boost their incomes. Such tailored interventions increase the relevance and effectiveness of poverty reduction efforts.
4. Conclusions
The study provided a basis for understanding the determinants of poverty reduction among irrigating farmers in Zimbabwe. Irrigation development is cited as one of the main priorities under NDS1 to improve food production and food security, and reduce poverty in the country. However, contemporary studies have overlooked the importance of understanding socioeconomic factors influencing poverty reduction among irrigating households in the country. The study performed chi-square tests to determine if access to irrigation was associated with the socioeconomic characteristics of the farmer. Irrigation access had a significant association with level of education (p = 0.001). Furthermore, t-test results show that there were significant differences between irrigators and non-irrigators for variables such as household labor (p < 0.05), household size (p < 0.01), and rainfed plot size (p < 0.05). The FGT indices show that 32% of the irrigators and 70% of non-irrigators were poor. The lower prevalence of poverty among irrigating households shows that access to irrigation reduces poverty. The binary logistic regression model results show that access to smallholder irrigation has a positive and significant correlation with poverty reduction (p = 0.030). In addition, the likelihood of being not poor was significant and positively correlated with household size and household income (p = 0.00). Based on these findings, the researchers conclude that access to smallholder irrigation helps to reduce poverty at the household level. Despite its potential to reduce poverty, access to smallholder irrigation is not a panacea for poverty reduction because some irrigators are poor. If mismanaged, irrigation water can cause poverty due to waterlogging, salinization, and decreased crop yields. Hence, access to irrigation is a necessary but not sufficient condition to reduce poverty in rural areas. Smallholder irrigation development policies should consider socioeconomic determinants of poverty reduction. Understanding socioeconomic characteristics helps in targeting and tailoring interventions to specific community needs. The socioeconomic characteristics provide insights into the root causes of poverty within communities. By understanding the underlying causes, interventions can be designed to address the root issues and break the cycle of poverty. Different socioeconomic groups face distinct challenges and barriers to escaping poverty. Hence, understanding these characteristics helps in tailoring interventions to address the specific needs and increase the relevance and effectiveness of poverty reduction efforts. The extent to which irrigation reduces poverty depends on the context and is site-specific. Thus, for investments in irrigation to contribute significantly to poverty reduction, there is a need for supportive institutional and economic environments. Hence, there is a need to conduct further studies to assess the influence of the current institutional and economic environments on the potential of smallholder irrigation schemes to reduce poverty.
Author Contributions
All authors made significant contributions to the development and writing of this article. N.M.: conceptualization, data curation, formal analysis, investigation, methodology, software, visualization, writing original draft, writing review and editing. G.M. and R.M.: project administration, supervision, validation, visualization, and writing review and editing. P.L.M.: funding acquisition, project administration, resources, validation, and visualization. All authors have read and agreed to the published version of the manuscript.
Funding
This research received no external funding from any organizations.
Institutional Review Board Statement
The study was approved by the Midlands State University Research Board Committee (20 September 2021).
Informed Consent Statement
Informed consent was obtained from all subjects involved in the study.
Data Availability Statement
Data available on request due to restrictions.
Acknowledgments
This research is part of a Doctoral study by the first author, supported by the Midlands State University. The National Research Foundation of South Africa, through the Department of Agronomy and Rural Development (grant 86893), University of KwaZulu Natal, provided funding for the publication of this paper. The authors are grateful to the enumerators who assisted during the data collection process. We also express gratitude to the farmers who participated in the survey.
Conflicts of Interest
The authors declare no conflicts of interest.
References
- World Bank. Africa Overview: Development News, Research, Data; World Bank: Washington, DC, USA, 2023; Available online: https://www.worldbank.org/en/region/afr/overview (accessed on 17 December 2023).
- World Bank. The World Bank Annual Report 2019: Ending Poverty, Investing in Opportunity; World Bank: Washington, DC, USA, 2019; Available online: https://openknowledge.worldbank.org/handle/10986/32333 (accessed on 15 June 2022).
- World Bank. Poverty and Shared Prosperity 2020: Reversals of Fortune; World Bank: Washington, DC, USA, 2020; Available online: https://openknowledge.worldbank.org/handle/10986/34496 (accessed on 8 August 2023).
- Corral, P.; Irwin, A.; Krishnan, N.; Mahler, D.G. Fragility and Conflict: On the Front Lines of the Fight against Poverty; World Bank Publications: Washington, DC, USA, 2020. [Google Scholar]
- World Bank. Monitoring Global Poverty: Report of the Commission on Global Poverty; World Bank Group: Washington, DC, USA, 2017. [Google Scholar]
- Kibet, N.; Lagat, J.; Obare, G. Logistic regression analysis on factors influencing income-poverty among smallholder French bean farmers in Kirinyaga County, Kenya. J. Dev. Agric. Econ. 2019, 11, 272–285. [Google Scholar]
- World Bank. Zimbabwe Economic Update: The State of the Economy; World Bank Group: Washington, DC, USA, 2017. [Google Scholar]
- Asitik, A.J. Entrepreneurship: A Means to Poverty Reduction in Rural Northern Ghana? Ph.D. Thesis, University of Central Lancashire, Preston, UK, 2016. [Google Scholar]
- Mutambara, S.; Darkoh, M.B.; Atlhopheng, J.R. A comparative review of water management sustainability challenges in smallholder irrigation schemes in Africa and Asia. Agric. Water Manag. 2016, 171, 63–72. [Google Scholar] [CrossRef]
- Rohwerder, B. Poverty and Inequality: Topic Guide; GSDRC, University of Birmingham: Birmingham, UK, 2016. [Google Scholar]
- Mosello, B.; Oates, N.; Jobbins, G. Pathways for Irrigation Development: Policies and Irrigation Performance in Zimbabwe; FANRPAN: Pretoria, South Africa, 2017. [Google Scholar]
- Zimbabwe National Statistics Agency. Zimbabwe Poverty Report 2017; ZIMSTAT: Harare, Zimbabwe, 2019. [Google Scholar]
- World Food Program. WFP Zimbabwe Country Brief; WFP: Harare, Zimbabwe, 2017. [Google Scholar]
- Burney, J.A.; Naylor, R.L. Smallholder irrigation as a poverty alleviation tool in sub-Saharan Africa. World Dev. 2012, 40, 110–123. [Google Scholar] [CrossRef]
- FAO. The Role of Agricultural Growth in Economic Growth, and Poverty and Hunger Reduction; FAO: Rome, Italy, 2012. [Google Scholar]
- Huang, Q.; Rozelle, S.; Lohmar, B.; Huang, J.; Wang, J. Irrigation, agricultural performance and poverty reduction in China. Food Policy 2006, 31, 30–52. [Google Scholar] [CrossRef]
- Hussain, I.; Hanjra, M.A. Irrigation and poverty alleviation: Review of the empirical evidence. Irrig. Drain. 2004, 53, 1–15. [Google Scholar] [CrossRef]
- Hussain, M.; Hussain, Z.; Ashfaq, M. Impact of small scale irrigation schemes on poverty alleviation in marginal areas of Punjab, Pakistan. Int. Res. J. Financ. Econ. 2006, 6, 6. [Google Scholar]
- Mudhara, M. Post-Independence Land Reform in Zimbabwe: Controversies and Impact on the Economy. In Impact of Land Redistribution on Large Scale Commercial Agriculture; Institute of Development Studies, University of Zimbabwe: Harare, Zimbabwe, 2004. [Google Scholar]
- Tsur, Y.; Roe, T.; Doukkali, R.; Dinar, A. Pricing Irrigation Water: Efficiency, Implementation Cost, and Equity; Resources for the Future Press: Washington, DC, USA, 2004. [Google Scholar]
- Government of Zimbabwe. National Development Strategy 1. January 2021–December 2025; Government of Zimbabwe: Harare, Zimbabwe, 2020. [Google Scholar]
- Mhembwe, S.; Chiunya, N.; Dube, E. The contribution of small-scale rural irrigation schemes towards food security of smallholder farmers in Zimbabwe. Jàmbá J. Disaster Risk Stud. 2019, 11, 1–11. [Google Scholar] [CrossRef] [PubMed]
- Chivizhe, J.B. Agricultural Productivity and Poverty in Smallholder Irrigation Schemes: The Case of Midlands Province in Zimbabwe. Ph.D. Thesis, Midlands State University, Gweru, Zimbabwe, 2018. [Google Scholar]
- Chitongo, L.; Munyati, R.G. Irrigation schemes and poverty reduction in Zimbabwe the case of Musena irrigation in Chirumanzu District, Zimbabwe. Int. J. Humanit. Soc. Stud. 2017, 5, 17. [Google Scholar]
- Haji, J.; Aman, M.; Hailu, T. Impact analysis of Mede Telila small scale irrigation scheme on house poverty alleviation: Case of Gorogutu district in eastern Haratghe Oromia national regional state Ethiopia. Int. J. Dev. Econ. Sustain. 2013, 1, 15–30. [Google Scholar]
- Sinyolo, S. The Impact of Smallholder Irrigation and Water Security on Household Welfare: The Case of Tugela Ferry Irrigation Scheme in KwaZulu-Natal, South Africa. Ph.D. Thesis, University of KwaZulu-Natal, Pietermaritzburg, South Africa, 2013. [Google Scholar]
- Fanadzo, M. Revitalisation of smallholder irrigation schemes for poverty alleviation and household food security in South Africa: A review. Afr. J. Agric. Res. 2012, 7, 1956–1969. [Google Scholar] [CrossRef]
- Mupaso, N.; Makombe, G.; Mugandani, R. Smallholder irrigation and poverty reduction in developing countries: A review. Heliyon 2023, 9, e13341. [Google Scholar] [CrossRef] [PubMed]
- Manatsa, D.; Mushore, T.D.; Gwitira, T.; Wuta, M.; Chemura, A.; Shekede, M.; Mugandani, R.; Sakala, L.C.; Ali, L.H.; Muzira, N.; et al. Report on Revised Agroecological Zones of Zimbabwe; Bindura University: Bindura, Zimbabwe, 2020. [Google Scholar]
- Gumbo, D. Working together to respond to climate change. In Annex I Expert Group Seminar in Conjunction with the OECD Global Forum on Sustainable Development Zimbabwe Country Case Study on Domestic Policy Frameworks for Adaptation in the Water Sector; WWF-Southern Africa: Cape Town, South Africa, 2006. [Google Scholar]
- Makuvaro, V.; Walker, S.; Munodawafa, A.; Masere, T.P.; Murewi, C.; Chagonda, I. An overview of current agronomic practices of smallholder farmers in semi-arid Central and Western Zimbabwe. Afr. J. Agric. Res. 2014, 9, 2710–2720. [Google Scholar] [CrossRef]
- Ministry of Agriculture, Mechanisation and Irrigation Development. Irrigation Schemes Report, Midlands Province; MAMID: Harare, Zimbabwe, 2020. [Google Scholar]
- Israel, G.D. Determining sample size. In Institute of Food and Agriculture Sciences; University of Florida Cooperative Extension Service: Tavares, FA, USA, 1992; pp. 1–5. [Google Scholar]
- Bacha, D.; Namara, R.; Bogale, A.; Tesfaye, A. Impact of small-scale irrigation on household poverty: Empirical evidence from the Ambo district in Ethiopia. Irrig. Drain. 2011, 60, 1–10. [Google Scholar] [CrossRef]
- Cohen, L.; Manion, L.; Morrison, K. Research Methods in Education, 6th ed.; Taylor and Francis e-Library: London, UK; New York, NY, USA, 2007; ISBN 0-203-02905-4. [Google Scholar]
- Kirimi, L.; Gitau, R.; Olunga, M. Household Food Security and Commercialization among Smallholder Farmers in Kenya. In Proceedings of the 2013 Fourth International Conference, Hammamet, Tunisia, 22–25 September 2013. [Google Scholar]
- Haughton, J.; Khandker, S.R. Handbook on Poverty + Inequality; World Bank Publications: Washington, DC, USA, 2009. [Google Scholar]
- Sperandei, S. Understanding logistic regression analysis. Biochem. Med. 2014, 24, 12–18. [Google Scholar] [CrossRef] [PubMed]
- Huot, S.; Jensen, L.; Bates, R.; Ader, D. Barriers of Women in Acquiring Leadership Positions in Agricultural Cooperatives: The Case of Cambodia. Rural Sociol. 2023, 88, 708–730. [Google Scholar] [CrossRef]
- Awazi, N.P.; Tchamba, M.N.; Avana, T.M.L. Climate change resiliency choices of small-scale farmers in Cameroon: Determinants and policy implications. J. Environ. Manag. 2019, 250, 109560. [Google Scholar] [CrossRef] [PubMed]
- Eneyew, A.; Alemu, E.; Ayana, M.; Dananto, M. The role of small scale irrigation in poverty reduction. J. Dev. Agric. Econ. 2014, 6, 12–21. [Google Scholar]
- Zemarku, Z.; Abrham, M.; Bojago, E.; Dado, T.B. Determinants of small-scale irrigation use for poverty reduction: The case of offa woreda, Wolaita zone, Southern Ethiopia. Adv. Agric. 2022, 2022, 4049868. [Google Scholar] [CrossRef]
- Bryan, E.; Ringler, C.; Meinzen-Dick, R. Gender, Resilience, and Food Systems. In Resilience and Food Security in a Food Systems Context; Springer International Publishing: Cham, Switzerland, 2023; pp. 239–280. [Google Scholar]
- Achichi, C.; Sennuga, S.O.; Osho-Lagunju, B.; Alabuja, F.O. Effect of Farmers’ Socioeconomic Characteristics on Access to Agricultural Information in Gwagwalada Area Council, Abuja. Discov. Agric. Food Sci. 2023, 10, 28–47. [Google Scholar]
- Hagos, A.; Dibaba, R.; Bekele, A.; Alemu, D. Determinants of market participation among smallholder mango producers in Assosa Zone of Benishangul Gumuz Region in Ethiopia. Int. J. Fruit Sci. 2020, 20, 323–349. [Google Scholar] [CrossRef]
- Oyetunde-Usman, Z.; Olagunju, K.O.; Ogunpaimo, O.R. Determinants of adoption of multiple sustainable agricultural practices among smallholder farmers in Nigeria. Int. Soil Water Conserv. Res. 2021, 9, 241–248. [Google Scholar] [CrossRef]
- Hussain, I.; Wijerathna, D. Irrigation and Income-Poverty Alleviation: A Comparative Analysis of Irrigation Systems in Developing Asia; International Water Management Institute (IWMI): Columbo, Sri Lanka, 2004. [Google Scholar]
- Gujarati, D.N. Basic Econometrics, African ed.; Tata McGraw Hill Edition: New Delhi, India, 2013. [Google Scholar]
Figure 1.
Map of study area.

Table 1.
Justification of independent variables.
| Description of Variable | Unit/Code | Expected Sign | Justification |
|---|---|---|---|
| Gender of household head | Female = 0 Male = 1 | + | The gender of household head was captured as a dummy variable. It is anticipated that male-headed households are less likely to be impoverished than households headed by women. Men and women often have different roles, challenges, and needs in agriculture, which might imply their agricultural performance and poverty status [40]. |
| Age of household head | Years | − | The agewas measured as a continuous variable. Older people are expected to be less economically active and have a higher probability of being poor than young people [41,42]. |
| Education of household head | Years | + | The education level was captured as a continuous variable. Households with heads that have spent more years at school are expected to have a low likelihood of being poor [42]. |
| Household size | Number | − | Household size was measured as a continuous variable. It refers to the number of individuals who share a residence, cook meals, and care for the house together [43]. Large households are more likely to be poor than small ones [44]. |
| Irrigation access | Non-irrigator = 0 Irrigator = 1 | + | Access to irrigation was captured as a dummy variable. It is anticipated that having access to irrigation will lessen the chance of poverty in a household [43]. |
| Farm size | Hectares | + | Farm size was captured as a continuous variable. The larger the farm’s size, the higher the food production and income [42]. Households with more farmland are expected to have a low likelihood of being poor. |
| Livestock holding (TLU) | Number | + | Livestock holding was captured as a continuous variable. Households with more livestock are expected to have a low likelihood of being poor [42,43]. |
| Household income | USD | + | Household income was captured as a continuous variable. Households with higher income per capita are expected to have a low likelihood of being poor [43]. |
+ means positive, and − means negative.
Table 2.
Association between access to irrigation and gender and education level.
| Variable Definition | Categories | Irrigators (%) | Non-Irrigators (%) | Chi-Square Test (p-Value) |
|---|---|---|---|---|
| Gender of the household head | Male | 56.4 | 51 | 0.912 (0.340) |
| Female | 43.6 | 49 | ||
| Education level of the farmer | No formal education | 6.7 | 19 | 16.150 *** (0.001) |
| Primary level | 19.5 | 13 | ||
| Secondary level | 72.1 | 68 | ||
| Tertiary level | 1.7 | 0 |
*** Significant at 5% level.
Table 3.
T-test results.
| Variable | Measure | Farmer Type | t-Value | |
|---|---|---|---|---|
| Irrigators | Non-Irrigators | |||
| Age (years) | Mean | 51.9 | 51.6 | −0.324 |
| (Standard dev) | (10.6) | (8.4) | ||
| Min/Max | 25/86 | 36/73 | ||
| Household size | Mean | 4.9 | 4.3 | −3.995 *** |
| (Standard dev) | (1.3) | (0.9) | ||
| Min/Max | 3/9 | 3/8 | ||
| Household labour | Mean | 2.8 | 2.5 | −2.405 ** |
| (Standard dev) | (1.1) | (0.7) | ||
| Min/Max | 1/8 | 2/6 | ||
| Irrigated plot size (ha) | Mean | 0.4 | 0 | n/a |
| (Standard dev) | (0.1) | (0) | ||
| Min/Max | 0.25/0.5 | 0 | ||
| Rainfed plot size (ha) | Mean | 1.1 | 2.6 | 5.587 *** |
| (Standard dev) | (1.2) | (1.4) | ||
| Min/Max | 0.1/5 | 1/5 | ||
*** Significant at 1% level, ** significant at 5% level, n/a means not applicable.
Table 4.
Poverty indices by access to irrigation.
| Poverty Indices | Irrigators | Non-Irrigators |
|---|---|---|
| Headcount index | 0.32 | 0.70 |
| Poverty gap | 0.09 | 0.38 |
| Poverty severity index | 0.03 | 0.25 |
Table 5.
Binary logistic regression results.
| Explanatory Variables | B | Wald | Sig. | Exp (B) |
|---|---|---|---|---|
| Gender of household head | 0.497 | 2.384 | 0.123 | 1.643 |
| Age of household head | −0.031 | 3.092 | 0.079 * | 0.969 |
| Education of household head | −0.076 | 1.853 | 0.173 | 0.927 |
| Household size | −0.782 | 27.673 | 0.000 *** | 0.458 |
| Irrigation access | 1.552 | 4.728 | 0.030 ** | 4.720 |
| Farm size | 0.346 | 2.462 | 0.117 | 1.413 |
| Livestock holding (TLU) | −0.005 | 0.007 | 0.934 | 0.995 |
| Household income | 0.028 | 89.451 | 0.000 *** | 1.028 |
| Constant | −2.239 | 2.281 | 0.131 | 0.107 |
| Pearson χ2 | 6.146 | |||
| Hosmer and Lemeshow Test | 0.631 | |||
| Nagelkerke R-Square | 0.729 | |||
| N | 444 | |||
| N with access to irrigation | 344 |
*** Significant at 1% level, ** significant at 5% level, * significant at 10% level.
Disclaimer/Publisher’s Note: The statements, opinions and data contained in all publications are solely those of the individual author(s) and contributor(s) and not of MDPI and/or the editor(s). MDPI and/or the editor(s) disclaim responsibility for any injury to people or property resulting from any ideas, methods, instructions or products referred to in the content. |
© 2024 by the authors. Licensee MDPI, Basel, Switzerland. This article is an open access article distributed under the terms and conditions of the Creative Commons Attribution (CC BY) license (https://creativecommons.org/licenses/by/4.0/).
Share and Cite
MDPI and ACS Style
Mupaso, N.; Makombe, G.; Mugandani, R.; Mafongoya, P.L. Socioeconomic Determinants of Poverty Reduction among Irrigating Farmers in Mberengwa District, Zimbabwe. Sustainability 2024, 16, 3580. https://doi.org/10.3390/su16093580
AMA Style
Mupaso N, Makombe G, Mugandani R, Mafongoya PL. Socioeconomic Determinants of Poverty Reduction among Irrigating Farmers in Mberengwa District, Zimbabwe. Sustainability. 2024; 16(9):3580. https://doi.org/10.3390/su16093580
Chicago/Turabian StyleMupaso, Norman, Godswill Makombe, Raymond Mugandani, and Paramu L. Mafongoya. 2024. "Socioeconomic Determinants of Poverty Reduction among Irrigating Farmers in Mberengwa District, Zimbabwe" Sustainability 16, no. 9: 3580. https://doi.org/10.3390/su16093580
Note that from the first issue of 2016, this journal uses article numbers instead of page numbers. See further details here.