Optimization of a Hybrid Solar–Wind Microgrid for Sustainable Development: A Case Study in Antofagasta, Chile


1
Instituto Superior Técnico, University of Lisbon, Av. Rovisco Pais, 1049-001 Lisbon, Portugal
2
INESC-ID/IST, University of Lisbon, Rua Alves Redol, 9, 1000-029 Lisbon, Portugal
*
Author to whom correspondence should be addressed.
Sustainability 2024, 16(9), 3668; https://doi.org/10.3390/su16093668
Submission received: 28 March 2024
/
Revised: 24 April 2024
/
Accepted: 25 April 2024
/
Published: 27 April 2024
Abstract
:This paper introduces a genetic algorithm designed to optimize the sizing of a hybrid solar–wind microgrid connected to the main electric grid in Chile, serving a simulated town of 2000 houses. The goal is to promote sustainable development by using renewable energy sources (RES) to supply a small village. The model, considering local meteorological conditions, aggregated load, and Chilean electrical regulations, establishes the optimal number of photovoltaic modules and wind turbine generators and allows for the monitoring of the microgrid’s operation, whose operating strategy is proposed herein. Adhering to Chilean regulations, a maximum exporting power of 9 MW is analyzed, with no restrictions on importing power, which is needed when the renewable resources are not enough to meet the demand. The optimization algorithm, aimed at sizing the RES supply, identified an optimal solution composed of 5 photovoltaic modules of 500 Wp each (2.5 kWp in total) and 123 wind turbines of 100 kW each (total of 12,300 kW), meeting around 85% of the demand through renewable generation. Due to time mismatches between generation and load patterns, the remaining energy was imported. The project’s net present value is approximately EUR 25 M, with a levelized cost of energy at 37 EUR/MWh. A comparison with HOMER grid simulations validates the efficacy of the developed model.
1. Introduction
Renewable power is evolving rapidly and positively in Chilean territory. In the year 2000, the share of installed capacity was composed of 58.3% thermal fossil-fuel power, 28.4% hydropower with reservoir and 13.3% run-of-river hydropower, without the presence of other renewables. By approximately 2009, the first megawatts (MW) of renewable power had begun to appear, mainly composed of wind power (82 MW) and other renewables (105 MW). In 2016, solar and wind power reached 1594 and 1406 MW, respectively, 7% and 6.16% of the entire power generation system. In 2020, both increased again to 5935 MW of solar and 3425 MW of wind power. At the end of 2022, solar and wind power accounted for 24.13% and 13.02% of the entire power system, respectively. Meanwhile, thermal power decreased to 38% and hydropower to 22.3%, while the remainder was formed by the category of other renewables (biomass, geothermal and others). This rapid evolution of the generation system towards decarbonization has been influenced mainly by regulatory incentives and meteorologically favorable conditions of the national territory.
An electrical system that was originally designed for centralized power generation is currently grappling with several challenges that must be addressed in order to facilitate a shift towards a decentralized and distributed system, characterized by intermittent generation from renewable resources. The effective management of generation facilities in a decentralized manner, in a way that aligns with demand centers, can offer significant operational advantages and create lucrative business opportunities. If intelligently integrated into the electrical network, this approach has the potential to reshape the current structure of our electrical systems.
Renewable energy generation projects in Chile are emerging as promising opportunities, driven by regulations that incentivize the construction and development of distributed power generation initiatives. Furthermore, projects injecting up to 9 MW of power benefit from enhanced financial certainty. This is attributed to the fixed sale prices of energy for such projects over extended periods, ensuring a stable and predictable revenue stream. This stability significantly enhances confidence in the profitability of investment projects, as the sale price remains immune to fluctuations.
The objective of this paper is to present a genetic algorithm-based model that produces the optimal sizing for a hybrid microgrid. This microgrid comprises solar photovoltaic (PV) and wind turbine generators (WTG), catering to an electrical load representative of a small village with 2000 houses. The microgrid is interconnected with the main grid, enabling a bidirectional exchange of power. The project operates within the framework of the Chilean regulatory agenda, which actively promotes the integration of renewable energy sources (RES) into the grid. The paper also proposes an operational strategy to effectively manage the microgrid and allows for the monitoring of the operation throughout a typical meteorological year. This solution promotes the sustainable development of a region in Chile because RES is used to primarily supply the electrical consumption of the village. An RES-based microgrid plays a pivotal role in fostering sustainable development across Chile. By harnessing the abundant renewable resources of wind and solar power, microgrids offer a decentralized energy solution that mitigates reliance on fossil fuels while bolstering energy security and resilience.
The main contributions of the paper may be outlined as follows:
- Development of a genetic algorithm-based model for the optimal sizing of a hybrid (PV and WTG) microgrid to supply 2000 houses, interconnected with the main grid and allowing bidirectional power exchange.
- Proposal of an operational strategy for effective microgrid management, allowing the monitoring of microgrid operation throughout a typical meteorological year.
The paper is structured as follows. In Section 2, a literature review on the operation of microgrids is elucidated, in which the authors explain the importance of having robust management of the microgrid, according to needs and to legislation. Section 3 presents the regulations and opportunities for renewable generation projects in Chile. The PV and WTG models and the general operation strategy of the microgrid are the objects of Section 4, in which the optimization problem is formulated, the decision variables and constraints are defined, and the genetic algorithm is introduced. In Section 5, the defined case of the study is presented, namely the data acquisition, aggregation and organization. Section 6 presents the results of the simulations along with a general discussion of the findings. Finally, the main conclusions are drawn in the last section.
2. Literature Review
Microgrids have been defined by many authors. The definition offered by Smith and Ton [1] was retained and is as follows: “A microgrid is a group of interconnected loads and distributed energy resources within clearly defined electrical boundaries that acts as a single controllable entity with respect to the grid. A microgrid can connect and disconnect from the grid to enable it to operate in both grid-connected or island mode.
Many benefits can be achieved from the implementation of a micro-grid, including the following:
- The enhancement of grid modernization by the integration of diverse smart grid technologies that adjust to demand.
- The promotion of the implementation of distributed energy generation projects. Moreover, a drive to renewable generation penetration in order to reduce the peak loads and losses that result from generation near the demand location.
- Achievement of end-user requirements, control of power quality, and improvement of grid reliability at the local level for isolated communities.
- Promotion of end-user participation through demand-side management, enhancing new business opportunities as energy communities.
- Ability to operate in islanded mode when the main grid is idle providing grid forming mode.
Moreover, the generation facilities connected to a microgrid are symbiotically controlled and coordinated between each other rather than with distant resources, as in the main grid, and can function as stand-alone systems or connected to the main electric system [2]. By comparing the functioning of a microgrid to a standard electric grid, generation, transmission and distribution costs can be drastically reduced while increasing the overall efficiency, thereby delivering higher reliability and increasing the voltage and frequency stability of an electric grid [3].
Many business opportunities can emerge due to the integration of microgrids connected to the main electric grid or in islanded mode, depending on the respective regulations and electric markets of each country. For example, the EU “More Microgrids” project established four different market structures for microgrids connected to the main electric grid [2]:
- Ownership of the distribution system operator (DSO).
- Ownership by the end consumer or consortium of prosumers (importers and exporters of electricity).
- Ownership by an independent power producer.
- Ownership by an energy supplier in a free market arrangement.
In the context of Chilean legislation, particularly under the framework of small means of distributed generation (SMDG), there exists a significant opportunity for prosumers to embark on microgrid projects connected to the grid. In this scenario, the entire amount of energy that is generated can be seamlessly injected into the main electric grid. Notably, tariff stability for a duration of six months helps mitigate revenue uncertainties. Additionally, existing distribution grids can serve as infrastructure, provided the necessary investments are made to ensure safe operation. Furthermore, DSOs stand to benefit from these investment projects, particularly in sizing generation and distribution systems. Microgrids, tailored to the specific load and available resources, have the potential to offer a more cost-effective means of delivering energy to end-users by circumventing the aggregated costs associated with the generation, transmission, and distribution sectors.
Many optimization models have been developed to size the optimum combination of generation technologies for microgrids, even for islanded modes in which energy storage plays a major role.
A mixed integer linear programming (MILP) optimization approach was employed to optimize a hybrid PV–wind–grid-connected system in Saudi Arabia, as outlined in [4]. The optimization focused on meeting the demand of a single industrial facility, with calculations performed at an hourly time step. The study considered the unique solar, wind, and temperature conditions of the selected location, coupled with the consumption profile of the facility. The obtained results underscore the efficacy of the optimized microgrid. Given the microgrid’s capability to inject excess energy into the grid, this led to a reduction in the price paid by consumers, making it a more cost-effective solution. Additionally, the authors conducted a comparative analysis with an off-grid system incorporating batteries. In this comparison, the price paid by consumers was found to be higher, emphasizing the advantages of a system that can inject energy into the grid and receive an economic reward. This approach is particularly favorable considering the high costs associated with battery investment and replacement.
The research in [5] delved into an optimization problem concerning an isolated microgrid system comprising PV, wind, and biomass gasifier technologies alongside electrochemical storage. The study utilized artificial bee colony (ABC), particle swarm optimization (PSO), and HOMER software. Conducted for a small village in Patiala, Punjab, India, the primary objective of the system is the cost-effective generation of energy from renewables, coupled with the storage of excess energy in batteries. In the context of this system, with due consideration to the capital investment costs associated with batteries, the biomass gasifier emerges as a viable alternative and serves as an economically sound option by which to meet energy demands when production and storage alone prove insufficient.
The operational strategy of a microgrid demands careful analysis, ensuring adherence to the constraints imposed by the maximum power capacity of the electric lines. Key considerations include the generation of sufficient energy to meet demand during island mode operation; the reduction of renewable generation output when there is surplus energy that cannot be exported, stored, or utilized elsewhere; and, where feasible, engaging in electric markets to capitalize on overproduction for profitability. Special attention should be given to monitoring the state of charge (SoC) when batteries are in use. Additionally, leveraging weather predictions for near-future conditions proves advantageous for effective coordination and planning in the operation of renewable technologies.
The autonomous management of a hybrid solar–wind–diesel and storage microgrid, in which connection to the grid was trained using predictive models of meteorological conditions, was demonstrated in [6]. The work shows how including prediction for the next three hours, would determine the optimal operation mode of the microgrid. A good operational strategy for a microgrid is pivotal to maximizing the economic and technical benefits.
The article in [7] presents an innovative approach to the optimization of hybrid microgrids with wind, tidal, and solar units. This approach employs both AC and DC formulations, which collaborate to reduce costs and ensure reliable load supply. A stochastic structure, using a new point estimate method, addresses uncertainties from forecasting tidal, wind, and solar units, market prices, and total load demand. The proposed bat algorithm effectively handles the problem’s nonlinear nature, with a modification approach that enhances search capabilities.
An efficient energy management system for a small-scale hybrid wind–solar–battery microgrid is proposed in [8]. This integrates energy conversion systems, battery storage, power electronic converters, and control algorithms, ensuring power balance amid variable renewable energy generation and load demands.
The authors of [9] explore the local complementarity among three renewable energy sources—solar, wind, and tidal—addressing the intermittent nature of non-conventional renewables. They emphasize the challenges posed by factors like varying wind speed and cloud cover affecting wind and solar energy while highlighting tidal energy’s predictability. The study suggests leveraging the complementary features of these sources to enhance the firm power of isolated microgrids, offering operational benefits.
Ref. [10] focuses on the optimal design of a stand-alone microgrid system (PV/wind/battery/diesel) for meeting the energy demands of a small residential area in Kasuga City, Japan. The simulation assesses electrical power generation considering variable weather parameters. Employing the particle swarm optimization (PSO) method from a least-cost perspective, the study aims to identify the optimal configuration for the proposed system.
Integrating WTG, solar, fuel cell FC, and batteries, the study in [11] emphasizes the crucial role of power electronic converters in optimizing control and energy management. Utilizing single input fuzzy logic (SIFL) and speed controllers for wind and solar subsystems respectively ensures effective maximum power point tracking (MPPT). An energy management strategy based on battery SoC contributes to system balance, while AC output voltage regulation is achieved using a proportional integral (PI) controller.
The optimal design of a PV/wind/diesel hybrid microgrid system for residential use in Yanbu, Saudi Arabia, accounting for load uncertainty, is addressed in [12]. Adopting a multiobjective approach, the study utilizes the decomposition-based multiobjective evolutionary algorithm (MOEA/D) to address the complexity of simultaneously optimizing renewable and non-renewable sources, storage devices, converters, and loads. Objectives include minimizing loss of power supply probability (LPSP) and cost of electricity (COE).
In [13], Li et al., address a different type of microgrid, by studying the robust operation of a hybrid AC/DC multi-energy ship microgrid. Apart from the diesel generators and battery storage, the PV system, combined cooling heat and power (CCHP) unit, thermal storage and power-to-thermal conversion unit are also included. To guarantee a safe and reliable voyage, the diverse uncertainties from renewable energies, onboard power loads and outdoor temperature are addressed by a robust coordination method. In this regard, the ship’s operating cost is minimized under the worst case of uncertainties while, at the same time, all of the operational constraints are fully satisfied.
The subject of microgrids in ships is also explored by Fang et al. [14], who propose an optimal sizing method for shipboard carbon capture systems (CCS) to mitigate greenhouse gas (GHG) emissions in the shipping industry. Their method addresses strict energy efficiency operating index constraints through a two-stage planning approach. In the first stage, the capacity of CCS and energy storage systems is determined in order to sustain CCS operation. In the second stage, a joint shipboard generation and demand-side management model is implemented to alleviate power shortage issues arising from CCS integration.
Ref. [15] presents a coordinated restoration framework for a microgrid composed of coupled power and water systems used to enhance resilience to disruptions. The framework integrates water desalination/treatment plants, pump stations, small pumped-hydro storage (PHS), rooftop renewables, and distributed generators. The interdependencies between these components are modeled across production, distribution, and consumption phases. The performance metric, aggregate service loss, is minimized through network reconfiguration, energy/water dispatching, load curtailment, and operation management.
Overall, the studies underscore the importance of efficient optimization, effective operational strategies, and the integration of RES to promote sustainable and cost-effective energy solutions in various geographic contexts. The main conclusions that may be taken from the reviewed literature are as follows:
- Various optimization methods and energy management strategies, such as predictive models of meteorological conditions and efficient energy management systems, were explored across different studies and for different types of microgrids, e.g., in ships. These approaches aim to maximize economic and technical benefits while ensuring a reliable load supply.
- The use of optimization methods in hybrid microgrids also demonstrated their efficacy in promoting the demand needs. The optimized microgrid reduced the price paid by consumers, highlighting its cost-effectiveness when compared with, for instance, off-grid systems with batteries.
- The operational strategy of a microgrid requires careful analysis, including adherence to maximum power capacity constraints and effective management of surplus energy. Engaging in electric markets and leveraging weather predictions for near-future conditions are advised for profitability and effective coordination.
- The exploration of local complementarity among solar, wind, and, for instance, tidal energy sources highlights the operational benefits of leveraging the complementary features of these sources to enhance the firm power of isolated microgrids.
3. Chilean Regulation Framework and Business Opportunity
The Chilean electric system has followed a private investment model since the second half of the 1970s. Public entities do not engage as traders but solely as regulators in the electric market or system. A significant modification to the law governing the entire electric system, known as “The Law”, was promulgated in 1982 by the Ministry of Mining in Chile. This modification, particularly the separation of production, transmission, and distribution segments, fostered fair competition and significantly enhanced the operational efficiency of the system [16]. In 2007, another reform targeted the promotion of non-conventional renewable energies (NCRE) for the main electric grid, establishing a mandate that 10% of the energy used must come from NCRE sources. Furthermore, the creation of the Energy Ministry in 2010 led to policy adjustments that focused on increasing the share of renewable energy penetration. This included modifying the auction system to offer more attractive business opportunities, given the intermittent nature of renewable resources. A subsequent amendment to The Law in 2013 set a target of 20% energy from NCRE by 2025.
To further promote the development of distributed generation, the government issued specific legislation. It is stated that RES with an installed capacity of less than 9 MW and connected to the distribution grid may be declared as SMDG; if not declared as SMDG, the RES installation will participate in the electricity market, as a form like any other generation installation. These facilities are self-dispatched, i.e., they decide when and how much power to inject into the distribution grid and whether they participate in the electric market. Moreover, SMDGs can choose to sell the energy at the market marginal cost or at a pre-established price, defined every six months by the competent authorities.
Recently (2019), the setting of this pre-established price was subject to some changes. Six time intervals, each one with a different price, were defined. The determination of each price depends on the average marginal cost of the energy at each time interval of the spot market. Thus, in sunny hours, with high PV penetration, the price is lower, whereas in hours with a high share of fossil fuel plants, the price is higher, therefore encouraging the integration of BESS in hours of high penetration of thermal generation. This change somehow negatively affected renewable generation, mainly PV, but at the same time, it is still an opportunity for SMDG to sell the energy at fixed prices, therefore diminishing the uncertainty and variability of the electric markets and providing more stable investment opportunities.
4. System Modelling
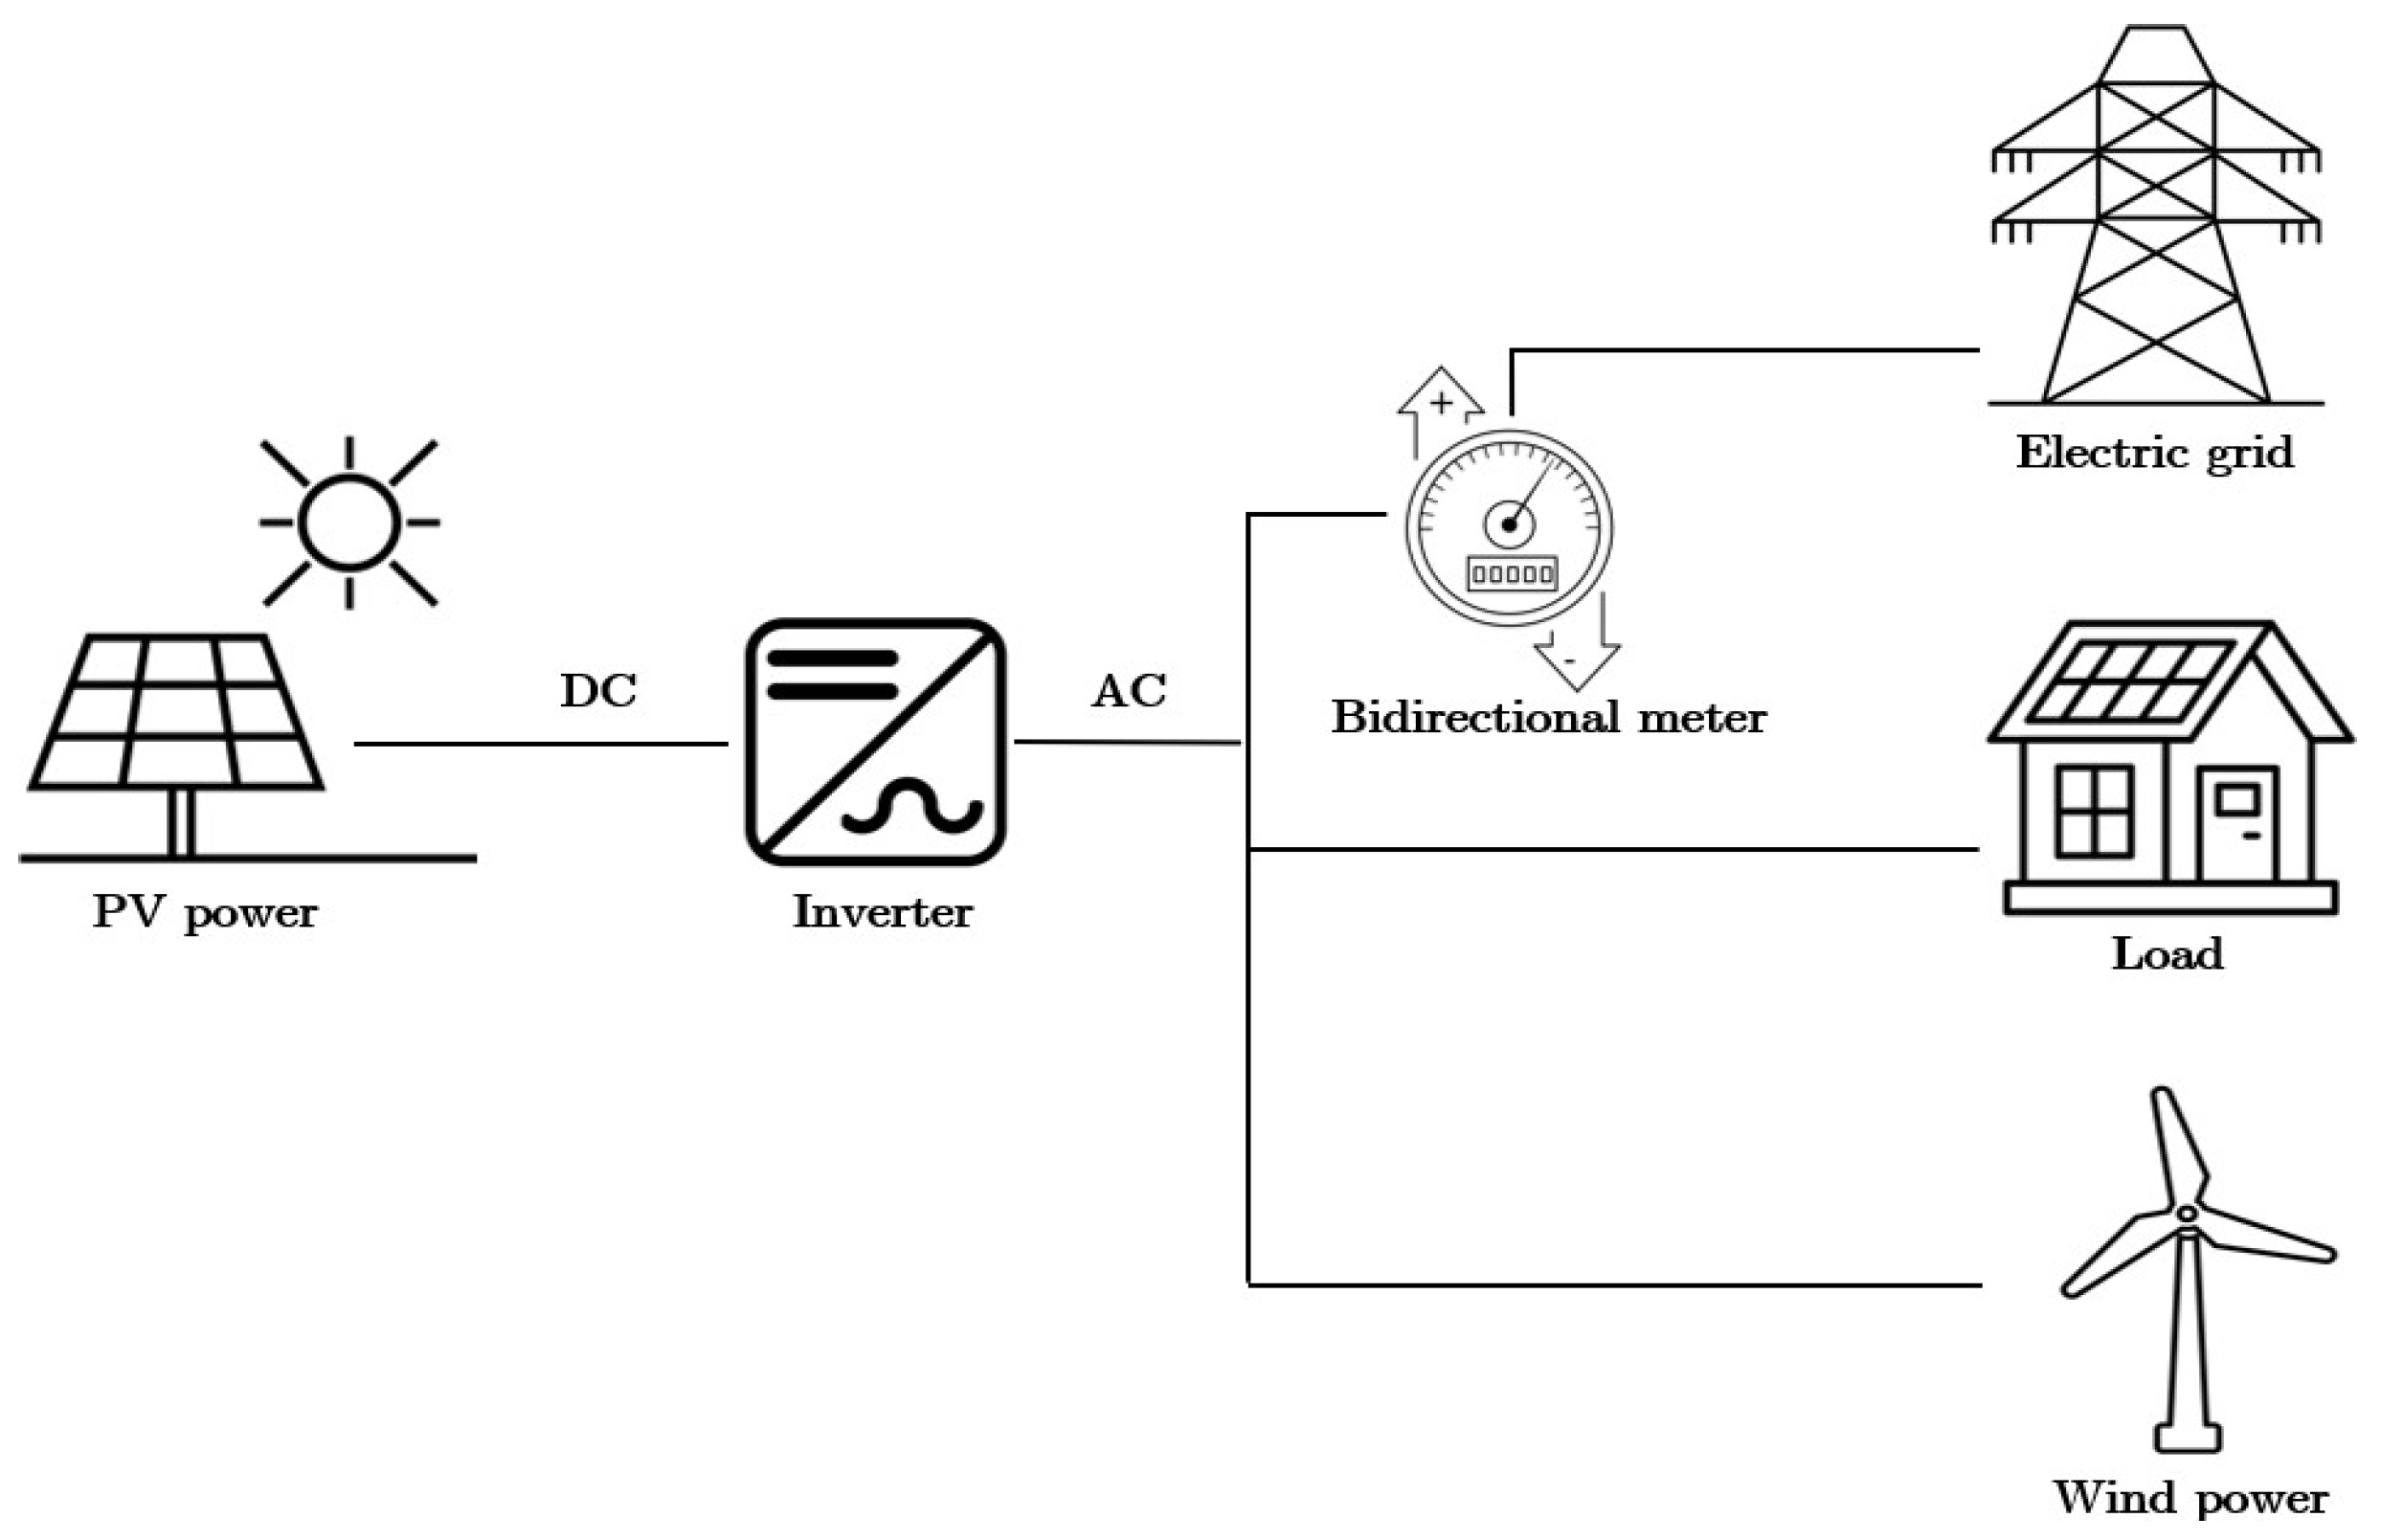
The proposed system consists of a combination of PV and WTG, providing power to a small village composed of 2000 houses. Whenever an excess or shortage of electricity occurs, power can be exported or imported from the main grid, respectively. Additionally, the system design is planned to be under the SMDG denomination, so the maximum power exported at every time is set to 9 MW. Figure 1 illustrates the configuration of the proposed system.
4.1. PV System Modelling
To compute the power output, , of each PV module, at each time interval, , the 1 diode and 3 parameters model is used as per [17]:
where is the maximum power voltage, iteratively computed by Equation (2) and is the maximum power current, computed after Equation (3).
In Equation (2), and are the time-dependent irradiance and temperature, respectively; is the iteration number (Gauss method); is the diode’s ideality factor, assumed constant for any irradiance and temperature; is the temperature dependent thermal voltage; is the irradiance-dependent short circuit current; and is the temperature-dependent diode’s inverse saturation current. The three parameters of the model, at standard test conditions (STCs) can be computed based solely on datasheet information. STCs are defined as W/m2 and K. For the simulated PV module, the manufacturer’s datasheet was made available.
The maximum power current is determined using the following equation:
where the temperature, , is the module temperature, which is determined after the available ambient temperature, , by:
where NOCT is the normal operating conditions (NOCs) temperature, given in the manufacturer’s datasheet. NOCs are defined as W/m2 and K.
The annual energy from the PV system is computed from the following equation:
where is the time interval, is the number of time intervals and is the global efficiency of the DC to AC conversion.
4.2. WTG System Modelling
The power output of each WTG, , is computed as follows:
where is the time-dependent wind speed at hub height; is the power coefficient of the WTG, i.e., its wind speed-dependent efficiency; kg/m3 is the air density; and is the WTG rotor diameter. For the simulated WTG, the variation of the power coefficient with the wind speed was known.
Available data include wind speed at a reference height different from the hub height. To make the conversion, Prandtl’s law is used:
where is the available wind speed at reference height, is the hub height, is the reference height and is a parameter that defines the roughness equivalent length of the terrain.
As in the case of the PV modules, the annual energy from the WTG is computed from:
4.3. Operation Strategy
The operation strategy of the hybrid microgrid was devised to ensure that the demand was always supplied either by renewable power from the PV and WTG systems or by grid imports. Moreover, to be considered an SMDG, the exports to the grid must be kept within the range of 0 to 9 MW.
4.3.1. Strategy for Exporting Power to the Grid
Two situations are possible. In the first, derating renewable generation is needed if the total excess power to be exported exceeds 9 MW, as shown in Table 1.
The second situation is that in which the excess power to be exported is less than 9 MW and can be totally exported, as seen in Table 2.
The annual energy exported to the grid is given by:
4.3.2. Strategy for Importing Power from the Grid
The operation was designed so that power was imported from the main electric grid whenever the generated renewable power (measured in AC) was not enough to satisfy the power demanded. Then, the imported power from the grid, , was modeled as follows:
The annual energy imported from the grid is given by:
4.3.3. Overall Operation Strategy
The flowchart in Figure 2 shows the overall operation strategy of the hybrid microgrid.
4.4. Optimization Problem Formulation
An optimization problem is formulated and solved in order to determine the optimal number of PV modules, , and WTG, , (decision variables) that maximize the net present value (NPV) of the project. The objective function is formulated as follows:
where and are the net present cost of each unit of solar and wind technologies, respectively, including the investment cost and the operation and maintenance (O&M) cost; is the net present cost of importing energy from the grid and accounts for the net present revenues from exporting energy to the grid. All of the values are computed over a year of operation and considered to be constant during the lifetime of the project, except for the investment cost that is only present at the beginning of the project evaluation timeline. O&M costs include, but are not limited to, replacement costs, land lease, salvage value and legal, administrative and environmental permission costs.
The parcels of Equation (12) are computed as follows:
where , are the investment costs of PV and WTG, respectively; and are the O&M annual costs of PV and WTG, respectively; and are the time-varying unit prices of the imported and exported energy, respectively; and is the discount factor computed by the following:
where is the discount rate and is the project lifetime.
The constraints of the optimization problem are:
Regarding Equations (20) and (21), and are the PV module peak power and WTG rated power, respectively. As the maximum power injected into the grid is set as 9 MW, it was decided that the maximum installed capacity of each technology be restricted to 15 MW.
4.5. Genetic Algorithms
The optimization problem was addressed using genetic algorithms, an evolutionary model operating with populations (sets of solutions). Each individual within a population represents a specific solution, characterized by a unique set of genes (decision variables). The algorithm initiates by randomly selecting individuals, which then stochastically exchange genes, generating new individuals termed “offsprings”. Subsequently, both individuals and offspring undergo evaluation in the objective or fitness function, with only the fittest (better solutions) retained to form the subsequent generation.
Given the stochastic nature of this process, there is no assurance of discovering the global optimum solution, as local optima may often lead to algorithm termination. To address this, mutation is introduced, allowing for a random variation of genes within defined limits, with a stochastic probability of mutation. This introduces variability, facilitating exploration and preventing the algorithm from becoming trapped in local optima. However, as the algorithm remains stochastic, it does not guarantee that the global optimum will be located. Additionally, elitism—transferring the best solutions from one generation to the next—can be incorporated to enhance convergence.
A Python code was developed to carry out the optimization using the library “geneticalgorithm” [18], and the selected parameters are discussed below.
- Number of generations—A total of 50 generations were selected as the number of iterations for the optimization algorithm.
- Population size—A total of 100 individuals was selected to complete the population.
- Crossover—Crossover was performed using the uniform distribution to select the genes of each parent to be passed on to each offspring. Additionally, the crossover probability was set to 100%, meaning all individuals of the generation will have offspring.
- Mutation—Once the crossover was completed, a probability of 20% was selected as a chance to mutate each gene on each offspring. The mutation respects the limits of the maximum number of PV modules and WTG (Equations (20) and (21)).
- Elitism—A ratio of 5% was chosen as elitism, meaning that, at the beginning of each generation, the best 5% of the population would be selected to be passed to the next generation.
5. Case Study Definition
5.1. Site Selection
The location selected for this project was Chile, in the region of Antofagasta, at latitude −22°3′56.637″ and longitude −69°22′19.2936″. For this location, data concerning solar irradiance, , ambient temperature, [19] and wind speed at reference height, [20] were recorded by several nearby meteorological stations, made available since 2013 and 2018, respectively, and subsequently used in this study.
The three data sets were available at time intervals of 10 min; therefore, 10 min was selected as the Δt for performing the computations. Each dataset was reorganized in one calendar year by computing the averages of the entire data frame. Figure 3 shows the irradiance, ambient temperature, and wind speed at hub height for the considered average year.
5.2. Load Demand
A small town was simulated to compose the total load demand, . A total of 2000 houses were assumed with 16 different electric power consumption profiles taken from [18]. The profiles differ in the amount of people per house and occupations of the inhabitants, as shown in Table 3.
Examples of individual consumption profiles are given in Figure 4.
All of the consumption profiles were randomly distributed among the 2000 houses, creating the aggregated annual load demand curve shown in Figure 5.
5.3. Energy Exporting Price
Due to the regulation of SMDGs, projects with up to 9 MW of exporting power to the grid are eligible under the mechanism of stabilized energy prices. This regulation had the purpose of encouraging the deployment of distributed generation projects, allowing them to be self-dispatchable. Moreover, the National Energy Commission of Chile establishes fixed prices for exporting energy for six months [22]. During the day, there are six defined periods, each with their respective prices, as shown in Table 4.
5.4. Energy Importing Price
The Chilean electric distribution grid is operated by private companies. The location selected for the simulation of the hybrid microgrid is in the concession area of the distribution company Compañía General de Electricidad Chile (CGE). Because the considered town was built upon residential power consumption only, the CGE basic tariff for residential energy supply BT1 [23] equal to 0.14 EUR/kWh was considered, which was assumed to be constant during the period of evaluation.
5.5. Technology, Costs and Economic Parameters
The main parameters used in the simulation are shown in Table 5.
The power coefficient versus wind speed curve of the selected WTG is displayed in Figure 6.
6. Results and Discussion
The genetic algorithm (GA) found the optimum combination of the number of PV modules and WTG as 5 and 123, respectively, with a PV peak power of 2.5 kWp and installed wind power of 12,300 kW.
With the configuration delivered by the GA, the total renewable energy production per year was 45,261 MWh, of which 87% was exported to the main electric grid, while the rest was delivered to the load. A shortage of 1081 MWh was imported from the grid due to a timing mismatch between the generation and the consumption. The total energy demand over a year was 7064 MWh, of which 85% was produced by renewable sources, and the remainder was imported from the grid.
Figure 7 shows the daily microgrid operation for six different days, representing the renewable power (solid blue), demand power (solid orange), exported power (dotted green) and imported power (dotted yellow) over the considered days. It is possible to see that the maximum power exported to the grid is limited to 9 MW. Additionally, the exports to the grid resulting from renewable production are notably higher than the demand. At night, the imports are visible.
The NPV of the project given by the GA model was found to be EUR 24,306 k. Additionally, the levelized cost of energy (LCOE) was computed as follows:
The obtained LCOE was 0.037 EUR/kWh, which is lower than the cost of importing energy from the grid and proves the viability of the project.
To confirm our results, this microgrid was also simulated using a commercial software, HOMER Grid [24]. This software was designed to model the operation of microgrids and perform economic analysis by using optimization algorithms, such as GA or mixed integer linear programming (MILP).
In the current study, simulations were executed utilizing software crafted by the authors, with HOMER serving solely as a validation tool for the findings. This approach was chosen in order to uphold the scientific integrity and robustness of the research. While commercial software like HOMER offers convenience and established methodologies, the utilization of software developed in-house allows for a deeper level of customization and fine-tuning tailored to the specific nuances of the study. By leveraging our own software, we maintain full visibility and control over every aspect of the simulation process, thereby enhancing the reproducibility and trustworthiness of the results.
The same technical and economical values used in this project were input as parameters for the simulation in HOMER Grid. HOMER Grid output an optimal NPV equal to EUR 25,700 k versus EUR 24,306 k of the model presented in this study. This shows the effectiveness of the proposed model to simulate the operation of a microgrid and optimize its performance.
7. Conclusions
In the present work, a management strategy for a solar–wind-powered microgrid was developed. It was assumed that the microgrid is located in the region of Antofagasta, Chile, and operates under the Chilean regulation framework aimed at promoting the development of renewable energy sources. In this way, the microgrid is connected to the grid, making it possible either to export the excess energy to the grid or import the deficit from the grid. This bi-directional power flow is needed because the renewable generation pattern does not match the demand pattern and no storage was foreseen. An optimization model, using genetic algorithms, was included in the model in order to establish the optimal sizing of the hybrid solar–wind-power microgrid.
Irradiance, temperature and wind speed data were gathered from nearby meteorological stations to feed the solar PV and wind turbine generating systems. The demand to be supplied by the microgrid is composed of 2000 houses. Several domestic consumption profiles were considered in order to establish the load demand. Moreover, the Chilean regulations, concerning both the prices of exporting and importing energy from and to the grid were considered.
The genetic algorithm optimization model output the optimal number of PV modules and wind turbines that maximize the net present value of the project. The developed model allowed for the monitoring of the operation of the microgrid throughout a typical meteorological year, computing the renewable production, the demand, and the exported and imported energy from and to the grid.
The findings indicate that the project was economically viable under the defined assumptions, the selected location, together with the simulated aggregated demand. The algorithm found an interesting investment opportunity, resulting in a significant positive NPV and a highly renewable penetration, which can provide a generation system almost free of greenhouse gases. Moreover, the model was validated against a commercially available software, HOMER Grid, which provided similar results. However, the model in this study is more versatile and can be easily adapted to changing conditions.
In Chile, where vast renewable energy potential exists, RES-based microgrids empower local communities and industries to transition towards cleaner energy sources. The scalability and modularity of microgrid systems allow for tailored solutions to diverse energy needs, whether for rural electrification, industrial applications, or urban settings. This flexibility fosters innovation and economic growth by attracting investment in renewable energy infrastructure and creating job opportunities in the burgeoning green economy. RES-based microgrids contribute to the mitigation of climate change by reducing the greenhouse gas emissions associated with traditional fossil-fuel-based power generation. As Chile strives to meet its commitments under the Paris Agreement and transition towards a carbon-neutral future, microgrids have emerged as a cornerstone of the nation’s sustainable development strategy.
Several areas in this model could benefit from upgrades. Specifically, in the generation technologies section, more precise models could be implemented. For instance, utilizing the one diode and five parameters model could enhance the accuracy of PV power production estimations. Additionally, incorporating irradiance models such as the isotropic sky and a mean albedo, or the Perez model, would improve the accuracy of irradiance input used in the PV models. Furthermore, integrating tracking systems could further enhance PV production. Another potential improvement is the addition of meteorological condition forecasting, which would provide more flexibility to the system and enable the microgrid management system to consider participating in energy bidding markets. Moreover, including a database with various wind turbines and PV modules could offer more flexibility to each system, allowing for a more tailored solution to different consumption demands.
Author Contributions
Conceptualization, C.M.; methodology, C.M. and R.C.; software, C.M.; validation, R.C.; formal analysis, R.C.; investigation, C.M.; resources, C.M. and R.C.; data curation, C.M.; writing—original draft preparation, C.M.; writing—review and editing, R.C.; visualization, R.C.; supervision, R.C.; project administration, R.C.; funding acquisition, R.C. All authors have read and agreed to the published version of the manuscript.
Funding
This work was supported by national funds through FCT, Fundação para a Ciência e a Tecnologia, under project UIDB/50021/2020 (DOI: 10.54499/UIDB/50021/2020).
Institutional Review Board Statement
Not Applicable.
Informed Consent Statement
Not Applicable.
Data Availability Statement
Data are unavailable due to privacy restrictions.
Acknowledgments
Some parts of the text were produced with the help of AI language models, namely ChatGPT, which was used solely to improve the readability and language of the work and not to replace key authoring tasks such as producing scientific or pedagogic insights, or drawing scientific conclusions.
Conflicts of Interest
The authors declare no conflicts of interest.
References
- Smith, M.A.; Ton, D.T. The U.S. Department of Energy’s Microgrid Initiative. Electr. J. 2012, 25, 84–94. [Google Scholar] [CrossRef]
- Hirsch, A.; Parag, Y.; Guerrero, J. Microgrids: A review of technologies, key drivers, and outstanding issues. Renew. Sustain. Energy Rev. 2018, 90, 402–411. [Google Scholar] [CrossRef]
- Cabana-Jiménez, K.; Candelo-Becerra, J.E.; Sousa Santos, V. Comprehensive Analysis of Microgrids Configurations and Topologies. Sustainability 2022, 14, 1056. [Google Scholar] [CrossRef]
- Ghaithan, A.M.; Mohammed, A. An Optimization Model for Sizing a Hybrid Photovoltaic-Wind-Grid-Connected System in Saudi Arabia. Process Integr. Optim. Sustain. 2022, 6, 1027–1042. [Google Scholar] [CrossRef]
- Singh, S.; Singh, M.; Subhash, C.K. Feasibility study of an islanded microgrid in a rural area consisting of PV, wind, biomass and battery energy storage system. Energy Convers. Manag. 2016, 128, 178–190. [Google Scholar] [CrossRef]
- Anderson, B.; Rane, J.; Khan, R. Distributed wind-hybrid microgrids with autonomous controls and forecasting. Appl. Energy 2023, 333, 120557. [Google Scholar] [CrossRef]
- Esapour, K.; Abbasian, M.; Saghafi, H. Intelligent energy management in hybrid microgrids considering tidal, wind, solar and battery. Int. J. Electr. Power Energy Syst. 2021, 127, 106615. [Google Scholar] [CrossRef]
- Kumar, P.S.; Chandrasena RP, S.; Ramu, V.; Srinivas, G.N.; Babu, K.V.S.M. Energy management system for small scale hybrid wind solar battery based microgrid. IEEE Access 2020, 8, 8336–8345. [Google Scholar] [CrossRef]
- Neto PB, L.; Saavedra, O.R.; Oliveira, D.Q. The effect of complementarity between solar, wind and tidal energy in isolated hybrid microgrids. Renew. Energy 2020, 147, 339–355. [Google Scholar] [CrossRef]
- Yoshida, Y.; Farzaneh, H. Optimal design of a stand-alone residential hybrid microgrid system for enhancing renewable energy deployment in Japan. Energies 2020, 13, 1737. [Google Scholar] [CrossRef]
- Benlahbib, B.; Bouarroudj, N.; Mekhilef, S.; Abdeldjalil, D.; Abdelkrim, T.; Bouchafaa, F. Experimental investigation of power management and control of a PV/wind/fuel cell/battery hybrid energy system microgrid. Int. J. Hydrogen Energy 2020, 45, 29110–29122. [Google Scholar] [CrossRef]
- Bouchekara, H.R.E.H.; Javaid, M.S.; Shaaban, Y.A.; Shahriar, M.S.; Ramli MA, M.; Latreche, Y. Decomposition based multiobjective evolutionary algorithm for PV/Wind/Diesel Hybrid Microgrid System design considering load uncertainty. Energy Rep. 2021, 7, 52–69. [Google Scholar] [CrossRef]
- Li, Z.; Xu, Y.; Fang, S.; Zheng, X.; Feng, X. Robust Coordination of a Hybrid AC/DC Multi-Energy Ship Microgrid with Flexible Voyage and Thermal Loads. IEEE Trans. Smart Grid 2020, 11, 2782–2793. [Google Scholar] [CrossRef]
- Fang, S.; Xu, Y.; Li, Z.; Ding, Z.; Liu, L.; Wang, H. Optimal Sizing of Shipboard Carbon Capture System for Maritime Greenhouse Emission Control. IEEE Trans. Ind. Appl. 2019, 55, 5543–5553. [Google Scholar] [CrossRef]
- Yang, Y.; Li, Z.; Mandapaka, P.V.; Lo, E.Y.M. Risk-averse restoration of coupled power and water systems with small pumped-hydro storage and stochastic rooftop renewables. Appl. Energy 2023, 339, 120953. [Google Scholar] [CrossRef]
- Hechun, W.; Zhonghau, X.; Qin, L.; Kai, W.; Hua, L.; Jing, T.; Dunnan, L. The Chilean electricity market and its implications. IOP Conf. Ser. Earth Environ. Sci. 2020, 617, 012035. [Google Scholar] [CrossRef]
- Castro, R.; Silva, M. Experimental and Theoretical Validation of One Diode and Three Parameters–Based PV Models. Energies 2021, 14, 2140. [Google Scholar] [CrossRef]
- Solgi, R. Geneticalgorithm 1.0.2. Retrieved from “An Easy Implementation of Genetic-Algorithm (GA) to Solve Continuous and Combinatorial Optimization Problems with Real, Integer, and Mixed Variables in Python”. Available online: https://pypi.org/project/geneticalgorithm/ (accessed on 1 March 2024).
- Explorador Solar. Ministério de Energía de Chile. Available online: https://solar.minenergia.cl/mediciones (accessed on 1 March 2024).
- Explorador Eólico. Ministério de Energía de Chile. Available online: https://eolico.minenergia.cl/mediciones (accessed on 1 March 2024).
- Pflugradt, N. Load Profile Generator. Available online: https://www.loadprofilegenerator.de (accessed on 1 March 2024).
- Comisión Nacional de Energía de Chile. Informe de Costos de Tecnologías de Generación. Available online: https://www.cne.cl/tarificacion/electrica/costos-de-inversion/ (accessed on 1 March 2024).
- Compañía General de Electricidad Chile. Tarifas de Suministro. Available online: https://www.cge.cl/informacion-comercial/tarifas-y-procesos-tarifarios/tarifa-de-suministro/ (accessed on 1 March 2024).
- Homer Grid. Available online: https://homerenergy.com/products/grid/index.html (accessed on 1 March 2024).
Figure 1.
Proposed hybrid PV/WTG system.

Figure 2.
Hybrid PV/WTG microgrid operation strategy.

Figure 3.
Considered irradiance (top), ambient temperature (middle) and wind speed at hub height (bottom).
Figure 3.
Considered irradiance (top), ambient temperature (middle) and wind speed at hub height (bottom).

Figure 4.
Examples of employed consumption profiles (from left to right CHR07, CHR01, CHR08, CHR18 and CHR15).
Figure 4.
Examples of employed consumption profiles (from left to right CHR07, CHR01, CHR08, CHR18 and CHR15).

Figure 5.
Aggregated annual load demand.

Figure 6.
curve of the selected WTG.

Figure 7.
Power balance for 6 different days of the microgrid operation.


Table 1.
Exporting power to the grid. Excess power greater than 9 MW (derating renewable power). is the exported power to the grid and is the load power.
Table 1.
Exporting power to the grid. Excess power greater than 9 MW (derating renewable power). is the exported power to the grid and is the load power.
| Condition | ||
|---|---|---|
| 0 |
Table 2.
Exporting power to the grid. Excess power less than 9 MW. is the exported power to the grid and is the load power.
Table 2.
Exporting power to the grid. Excess power less than 9 MW. is the exported power to the grid and is the load power.
| Condition | ||
|---|---|---|
Table 3.
Consumption profiles [21].
Table 3.
Consumption profiles [21].
| Type | Description |
|---|---|
| CHR07 | Single with work. |
| CHR09 | Single woman, 30–64. |
| CHR10 | Single man, 30–64, shift worker. |
| CHR23 | Single man over 65 years. |
| CHR04 | Couple, 30–64 years, 1 at work, 1 at home. |
| CHR02 | Couple, 30–64 age, both workers. |
| CHR01 | Couple, both at work. |
| CHR21 | Couple, 30–64 years, shift workers. |
| CHR08 | Single woman, 2 children, with work. |
| CHR45 | Family with 1 child, 1 at work, 1 at home. |
| CHR47 | Single woman, 2 children, without work. |
| CHR49 | Family with 1 child, without work. |
| CHR27 | Family both at work, 2 children |
| CHR44 | Family with 2 children, 1 at work, 1 at home. |
| CHS01 | Couple with 2 Children, father employed. |
| CHR18 | Family, 2 children, parents without work. |
Table 4.
Energy exporting prices [22].
Table 4.
Energy exporting prices [22].
| Time Interval | EUR/kWh |
|---|---|
| 00:00–03:59 | 0.1593 |
| 04:00–07:59 | 0.1324 |
| 08:00–11:59 | 0.0227 |
| 12:00–15:59 | 0.0121 |
| 16:00–19:59 | 0.0825 |
| 20:00–23:59 | 0.1737 |
Table 5.
Simulation main parameters.
| Parameter | Value | Unit | |
|---|---|---|---|
| PV | Peak Power | 0.5 | kWp |
| > 9 MW) | 700 | EUR/kWp | |
| < 9 MW) | 880 | EUR/kWp | |
| O&M costs | 2% | ||
| WTG | Rated power | 100 | kW |
| Investment | 1250 | EUR/kW | |
| O&M costs | 3% | ||
| Economic | Discount rate | 7% | |
| Lifetime | 20 | years |
Disclaimer/Publisher’s Note: The statements, opinions and data contained in all publications are solely those of the individual author(s) and contributor(s) and not of MDPI and/or the editor(s). MDPI and/or the editor(s) disclaim responsibility for any injury to people or property resulting from any ideas, methods, instructions or products referred to in the content. |
© 2024 by the authors. Licensee MDPI, Basel, Switzerland. This article is an open access article distributed under the terms and conditions of the Creative Commons Attribution (CC BY) license (https://creativecommons.org/licenses/by/4.0/).
Share and Cite
MDPI and ACS Style
Merino, C.; Castro, R. Optimization of a Hybrid Solar–Wind Microgrid for Sustainable Development: A Case Study in Antofagasta, Chile. Sustainability 2024, 16, 3668. https://doi.org/10.3390/su16093668
AMA Style
Merino C, Castro R. Optimization of a Hybrid Solar–Wind Microgrid for Sustainable Development: A Case Study in Antofagasta, Chile. Sustainability. 2024; 16(9):3668. https://doi.org/10.3390/su16093668
Chicago/Turabian StyleMerino, Carlos, and Rui Castro. 2024. "Optimization of a Hybrid Solar–Wind Microgrid for Sustainable Development: A Case Study in Antofagasta, Chile" Sustainability 16, no. 9: 3668. https://doi.org/10.3390/su16093668
Note that from the first issue of 2016, this journal uses article numbers instead of page numbers. See further details here.