4.1. Threats: Construction and the Real Estate Sector
“Tsunami” and “tumor” are some of the concepts used by Spanish authors to describe the problems associated with urbanization and housing prices during this economic growth cycle. These descriptions suggest the negative consequences of an economic sector—residential construction—that underpinned the rising Spanish GDP of the past 15 years.
We must start out from an idea: the existence of strong links between finance and real estate and the considerable contributions of capital gains from real estate to economic life [
22,
20]. According to estimates by Naredo, Carpintero and Marcos [
23], real estate assets sank from representing 76% of total household assets in 1992 to 71% in 1998 and then rose again to 80% in 2002. Thus, during somewhat more than a decade, and coinciding with the arrival of the People’s Party (Partido Popular) government, Spain experienced a period of strong economic optimism masked by an assumed wellbeing: steady growth in the GDP, unknown consumption levels, increased numbers of workers affiliated with the social security system, and falling unemployment rates,
etc. The country was living far beyond its means, yet apparently this did not matter, since the international financial context clearly encouraged this process and the abundant liquidity in the global economy allowed the private sector’s over-spending to be easily financed at a very low interest rate [
20]. Moreover, the European Union’s convergence process made Spain an attractive destination for investment, by both domestic as well as foreign private capital. And part of that capital sought an investment haven in real estate during the process of changing over from national currencies to the euro [
24,
25] (
Figure 2).
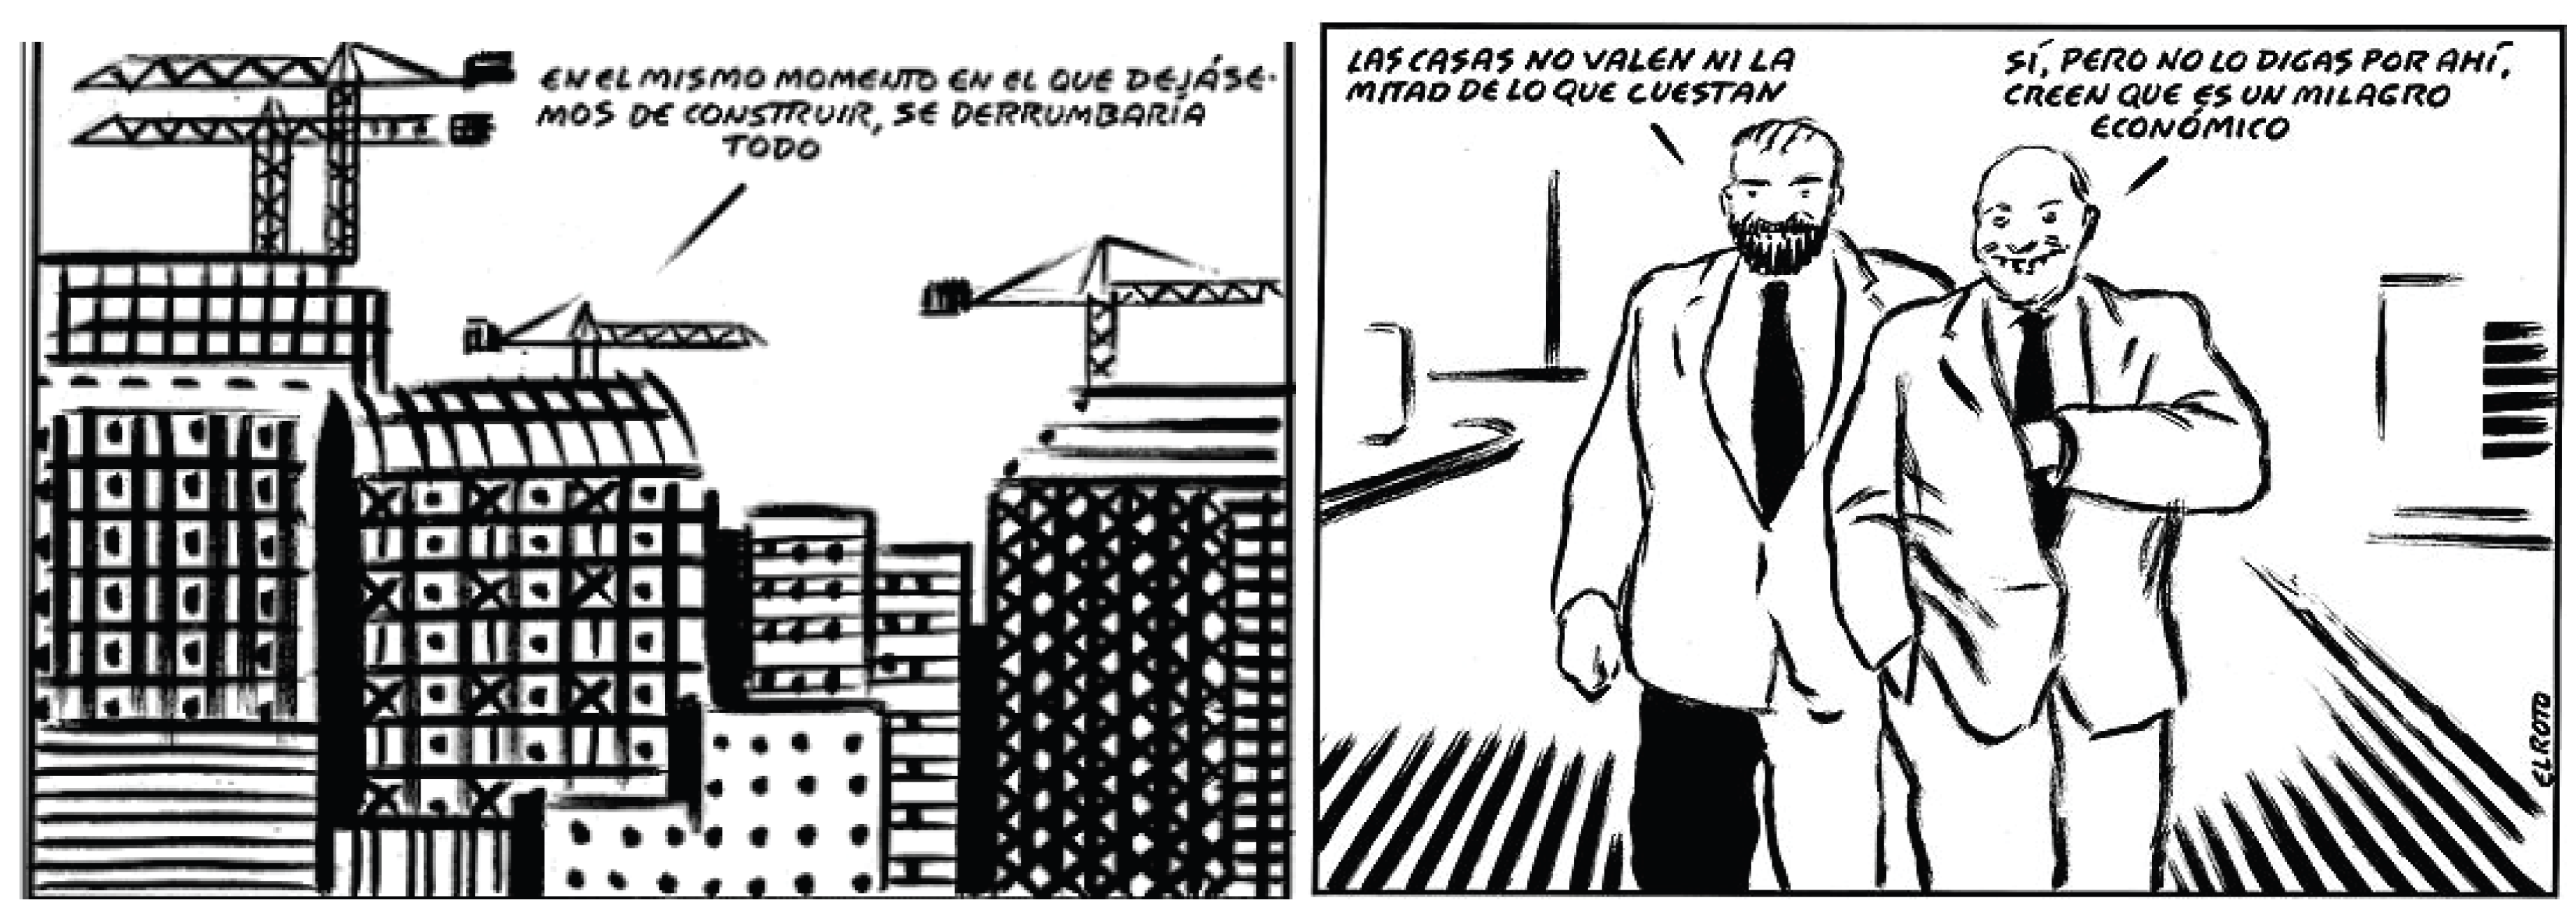
Figure 2.
Cartoonists predicted the economic consequences of the building boom. Translation: Frame 1: As soon as we stop building, it’ll all come tumbling down. Frame 2: person on the left: Houses aren’t worth half of what they cost; Person on the right: Yes, but don’t go spreading that around—they think it’s an economic miracle. (Reproduced with permission from “El Roto”, published by “El País”, 7 December 2005 and 12 May 2006).
Therefore, what was being touted as the “Spanish economic miracle” (El País, 28/01/2010) was founded on a very strong boost from the real estate and construction sectors. The government took care to lay the legislative foundations, both economic (to encourage capital inflows) as well as land-related (by increasing land suitable for development). This model led housing bubbles to condition the Spanish economy’s progress much more intensely than other European countries [
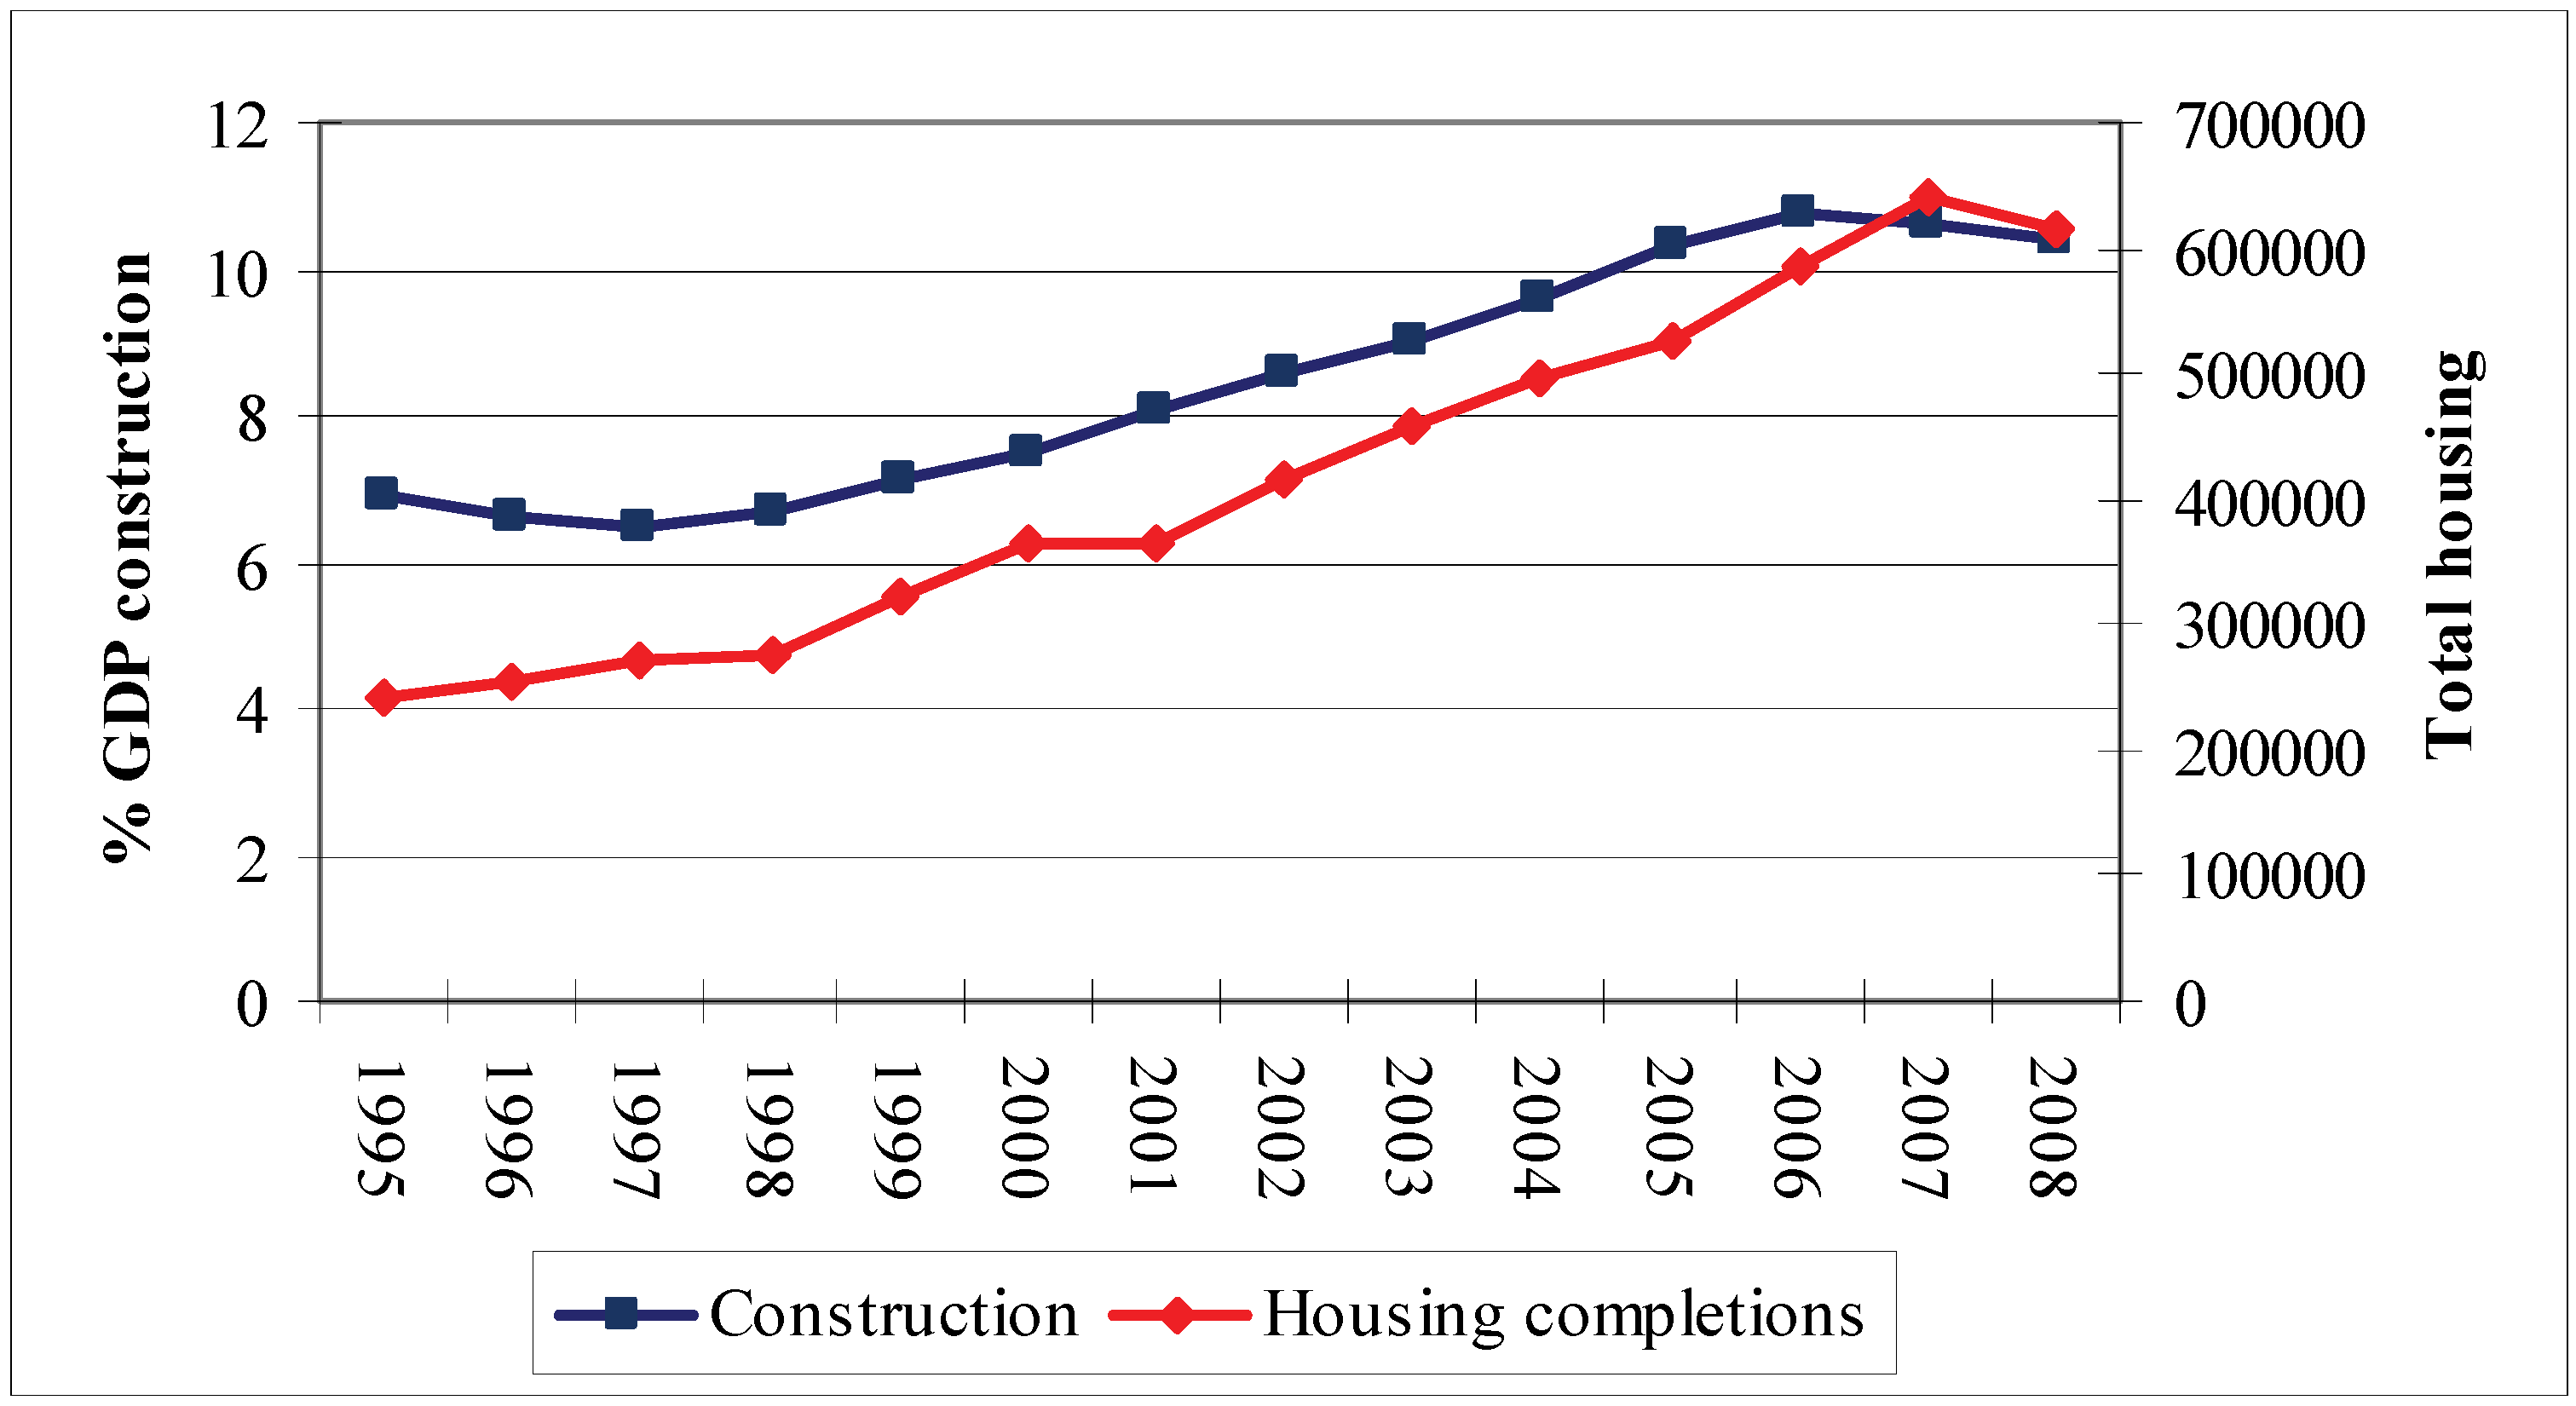
26]. As a result, the construction sector, encouraged by the residential-infrastructure tandem, steadily increased its share of the Spanish GDP. This share rose from 6.9% in 1995 to a high of 10.8% in 2006. Today, this share has fallen slightly to 10.4%, a trend that is evolving in line with housing construction (
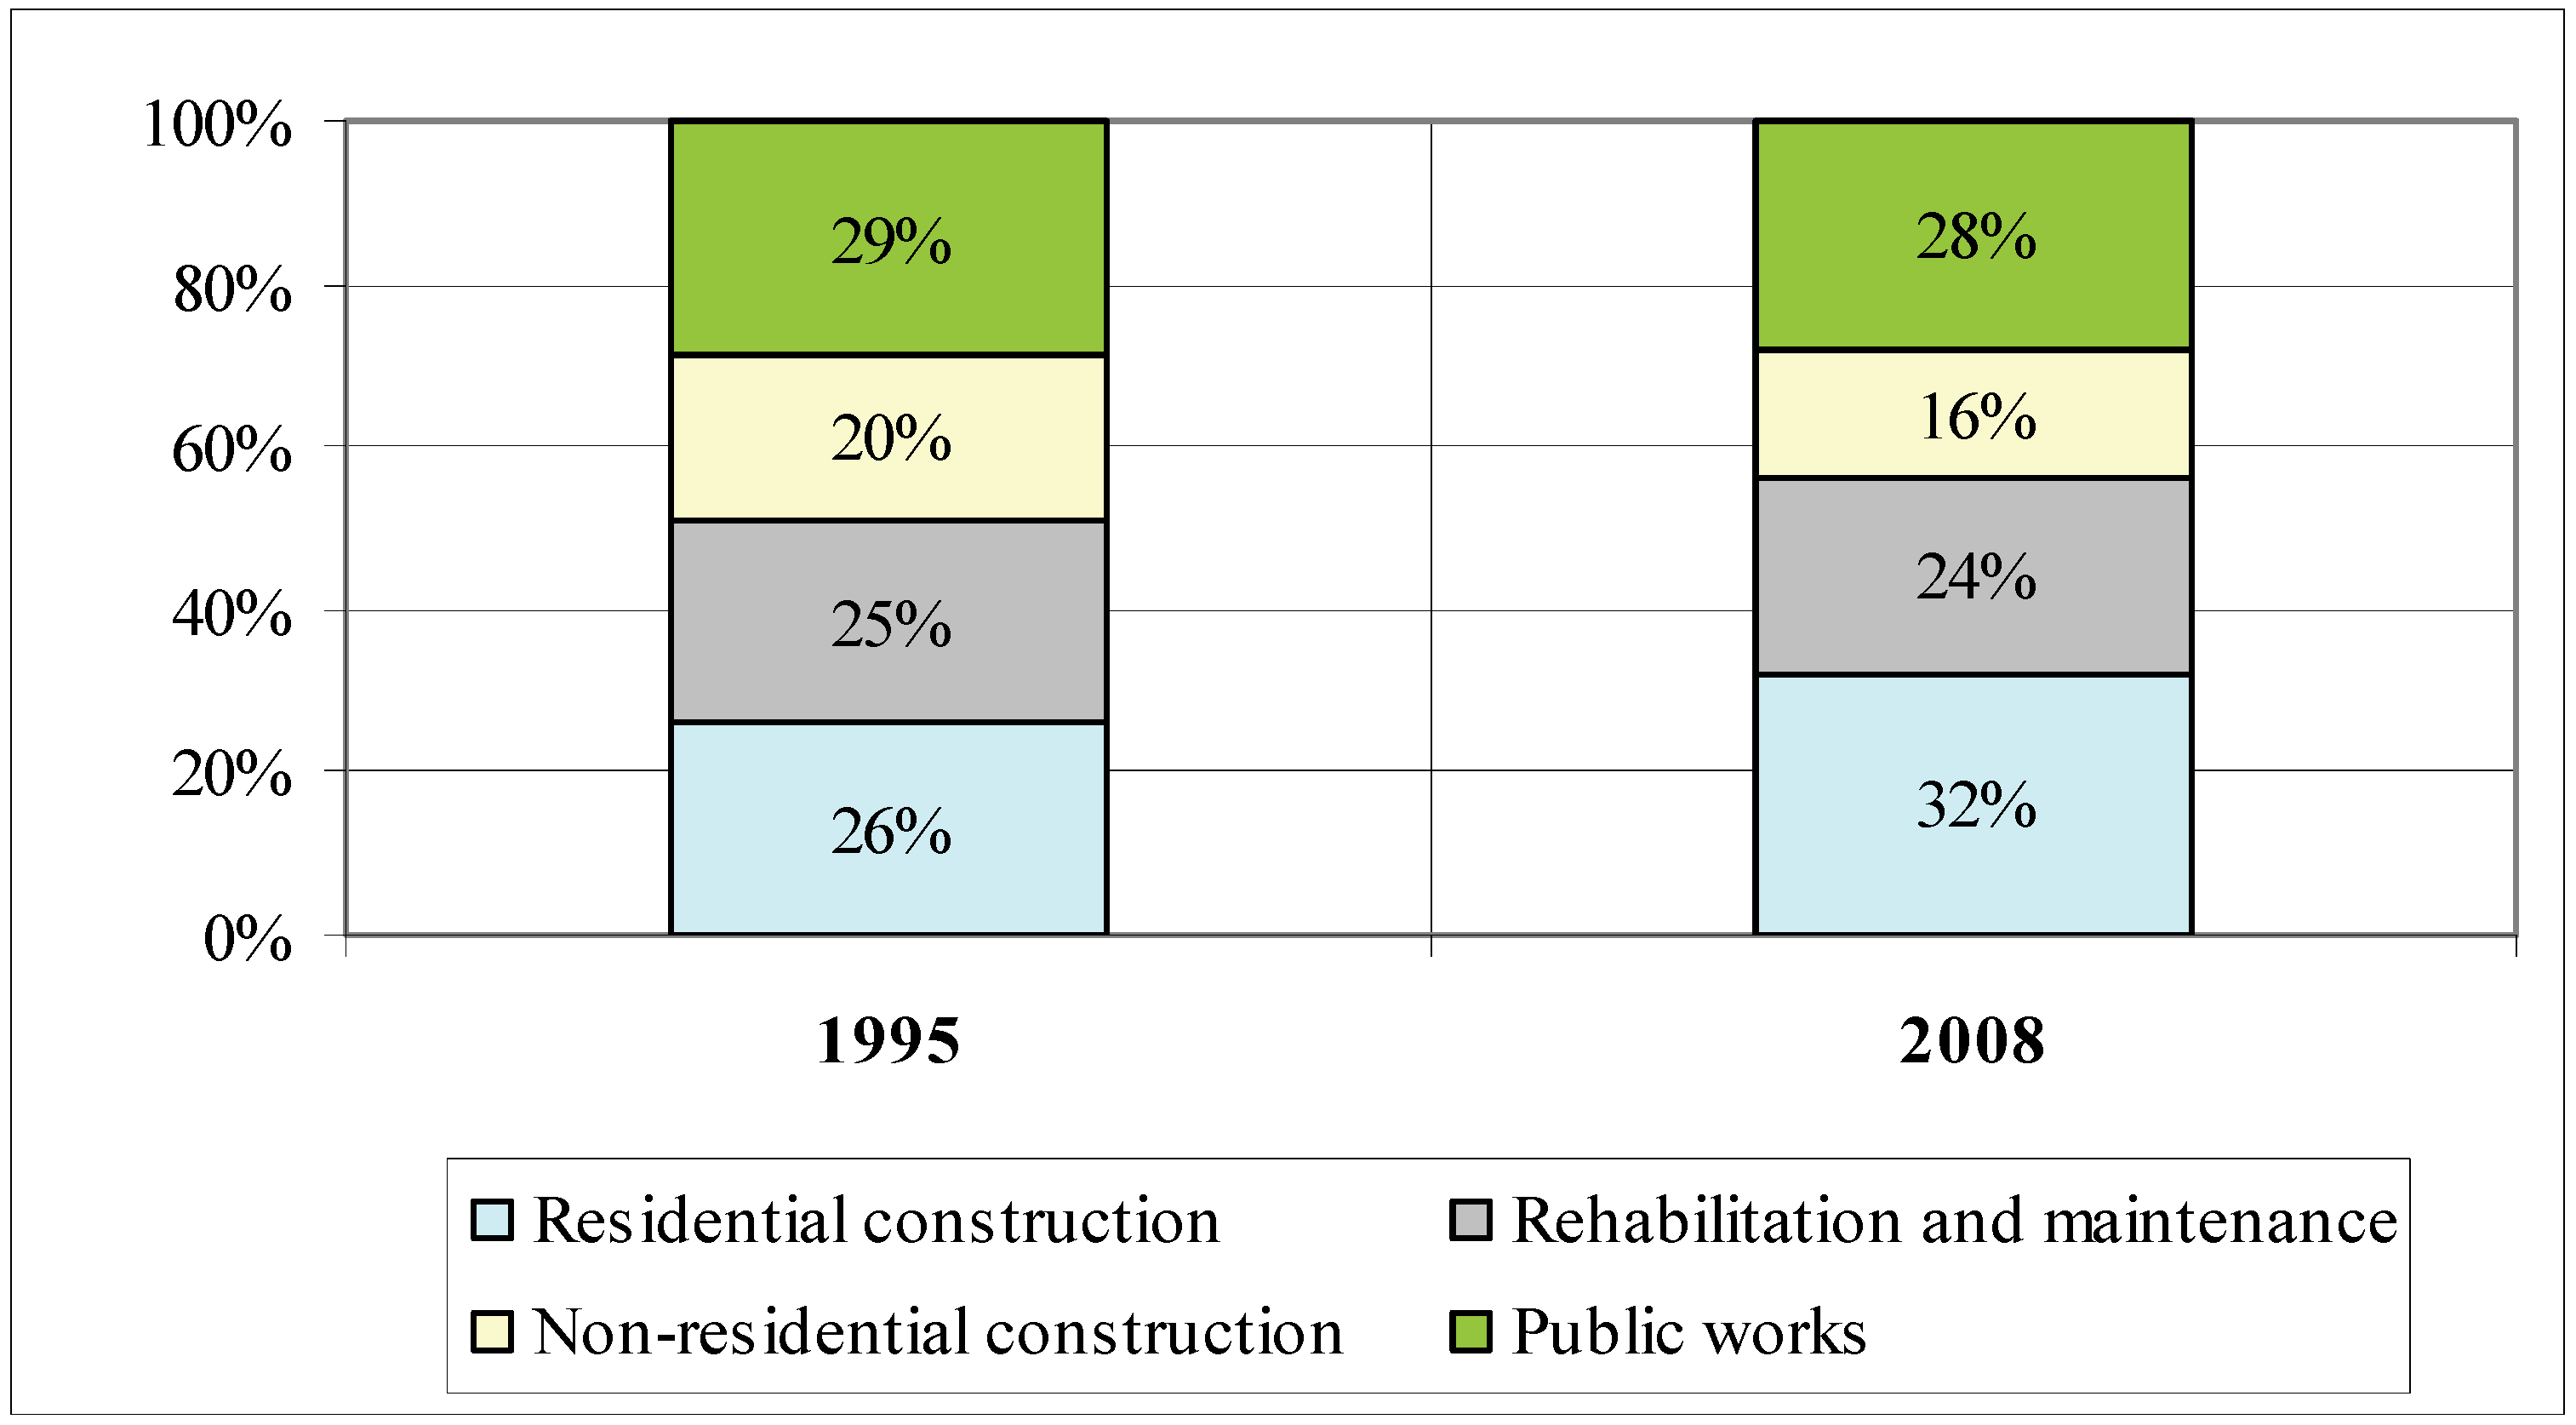
Figure 3). By sector, the rate of construction’s variation in the GDP in current prices between 1995 and 2008 was 268.07%, compared with that of only 38.16% for agriculture, 63.67% for energy, 99.62% for industry, and 152.22% for the services sector. If the construction sector is compared in two different years—at the very beginning of the expansionary phase and at the end—residential construction was the only sector whose share grew, absorbing the slumps in the other subsectors (
Figure 4).
Figure 3.
Percentage of the construction sector’s share of the Spanish GDP and its relation to the number of housing completions: 1995–2008. Source: Data from the INE’s Spanish National Accounts.
Figure 3.
Percentage of the construction sector’s share of the Spanish GDP and its relation to the number of housing completions: 1995–2008. Source: Data from the INE’s Spanish National Accounts.
Figure 4.
Structure of construction by subsector: 1995 and 2008. Source: Data from statistics of The Association of Spanish Constructors (Asociación de Empresas Constructoras de Ámbito Nacional de España, SEOPAN).
Figure 4.
Structure of construction by subsector: 1995 and 2008. Source: Data from statistics of The Association of Spanish Constructors (Asociación de Empresas Constructoras de Ámbito Nacional de España, SEOPAN).
Hence, this was the start of the so-called “third Spanish housing boom” [
22], which caused the emergence of a housing bubble between 1998 and 2006 and was primarily driven by a favorable macroeconomic environment, the stock market crisis of 2000–2003, the conversion of housing into a shelter for assets, and by the successive cuts in interest rates. This cheap and abundant liquidity made real estate investments very attractive by promising capital gains and by having favorable tax conditions [
26]. The beneficial effects on the GDP and employment led governments to not curb the creation of the housing bubble. In 2007, coinciding with the global economic crisis, the bubble burst. However, while international liquidity—until then cheap and plentiful—was lacking, the Spanish real estate model, focused on inflating the speculative bubble, entered a crisis [
26]. We will study this process of promotion and crisis in residential construction through different indicators: housing approvals, employment, and housing prices.
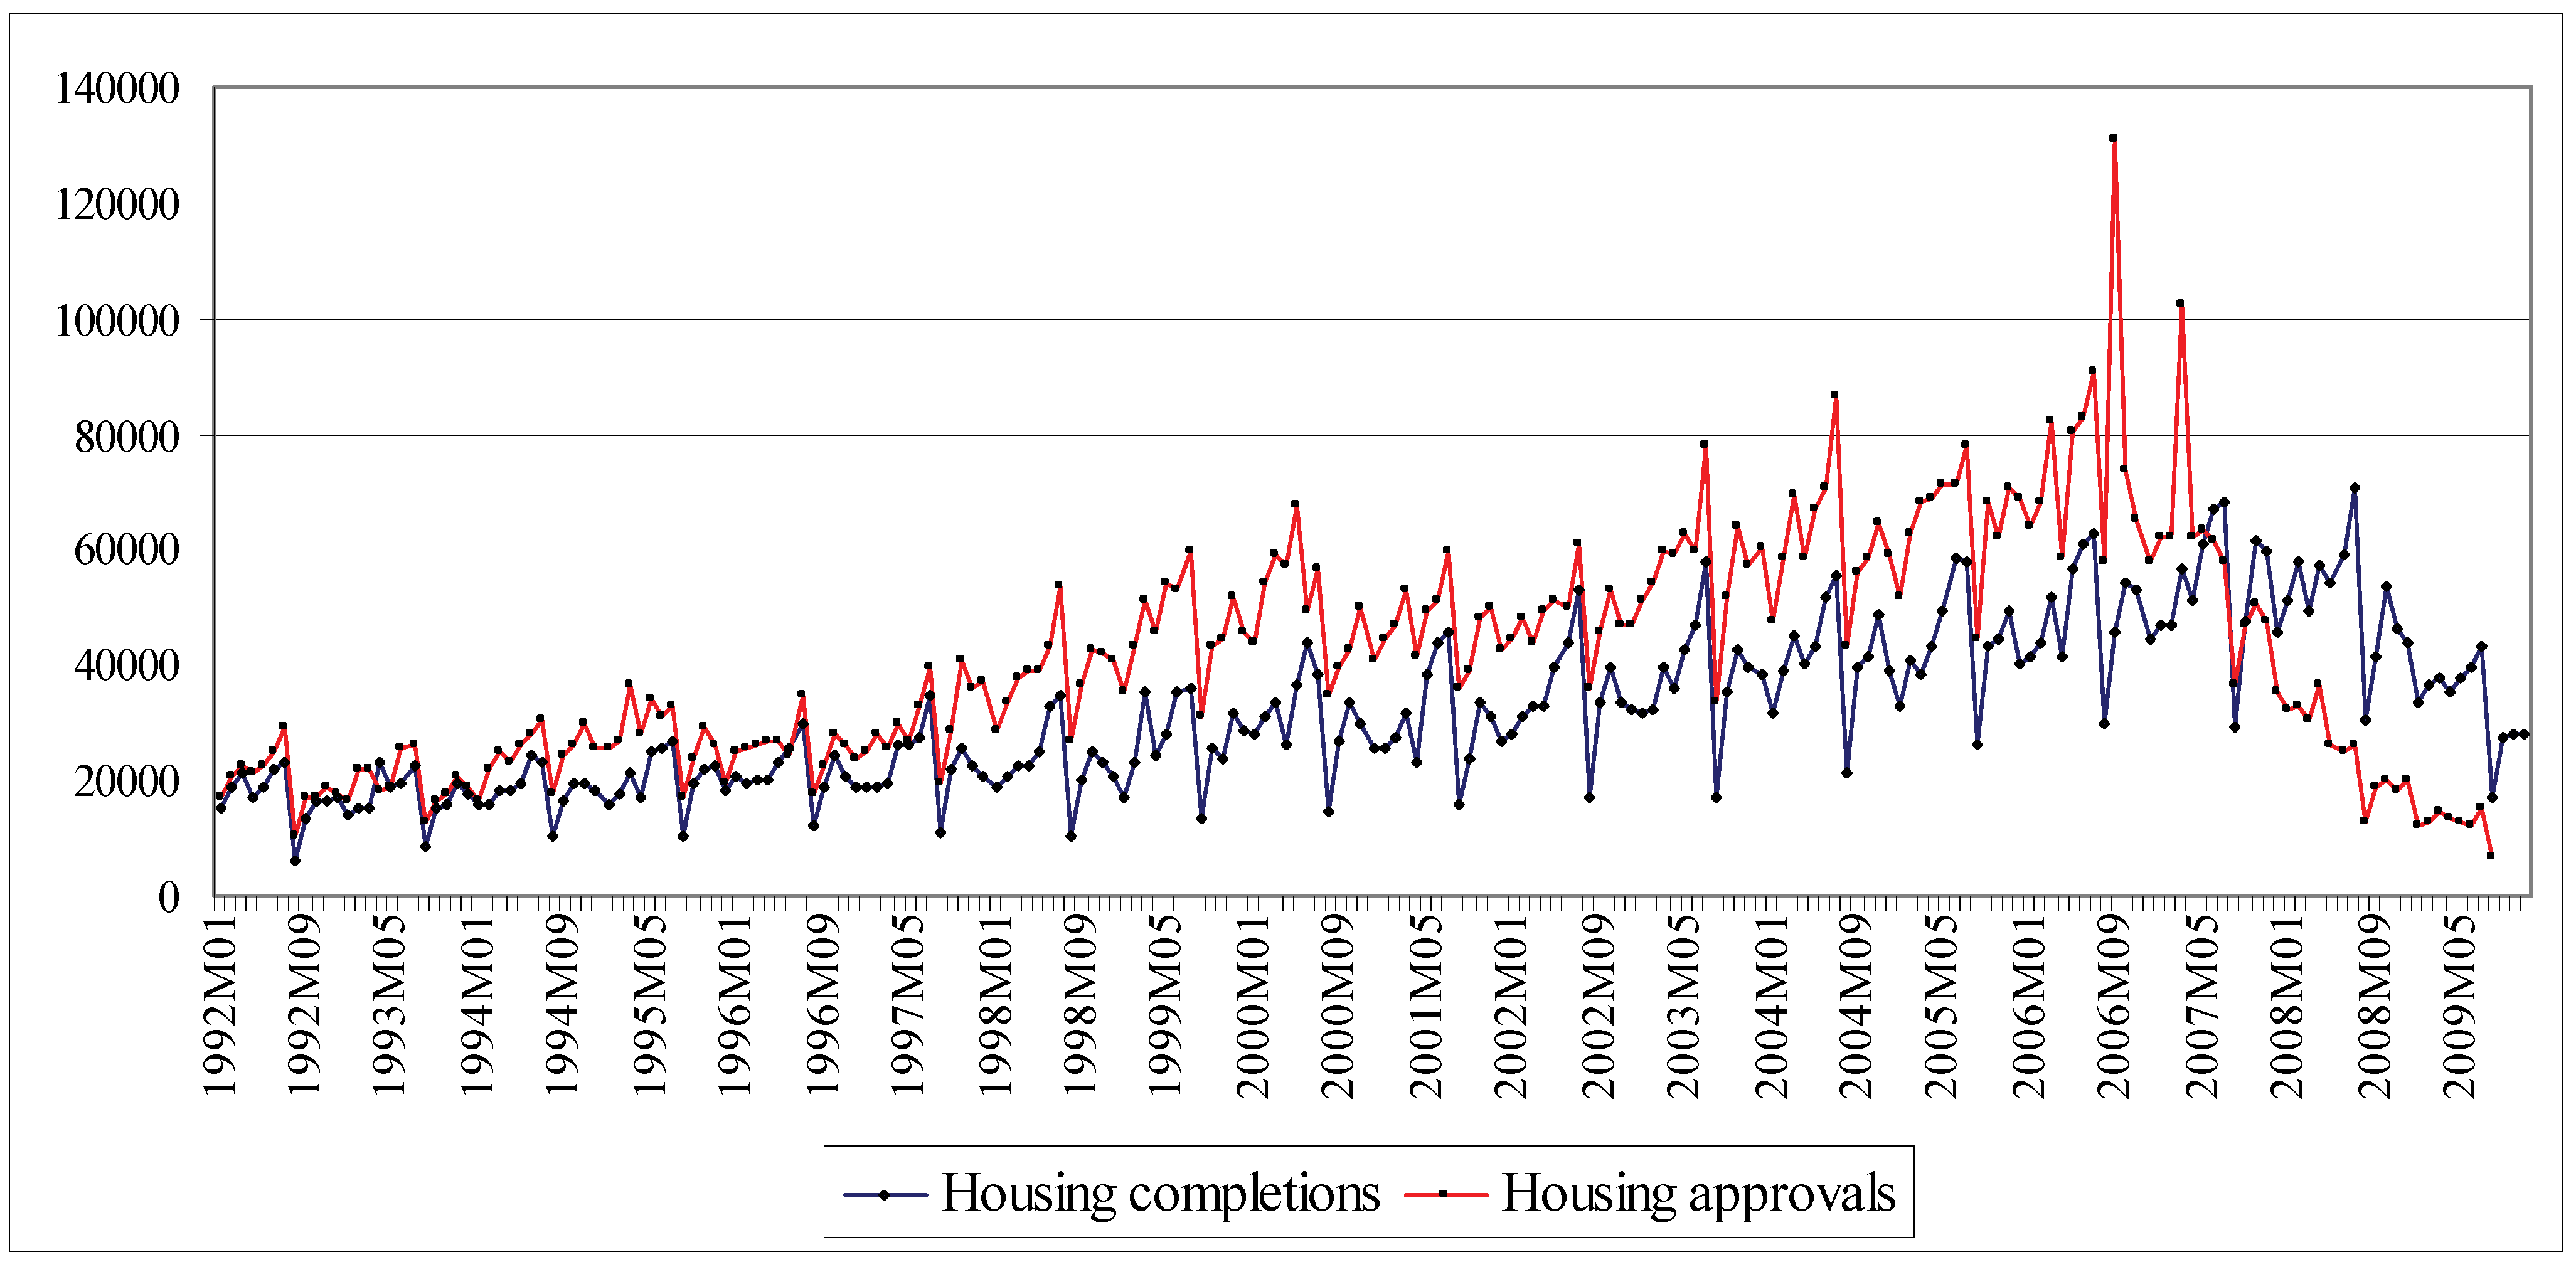
The monthly evolution in the number of housing approvals and completions from 1992 until now reflects the importance of residential construction in Spain. The expectations generated towards this sector produced a rising number of housing approvals (
i.e., those planned to be built) compared with housing completions every month during the years of the real estate boom. The turnaround as of June 2007—more housing completions than approvals—marked the start of the crisis in residential construction (
Figure 5). As houses that had already been started are completed, and given the lack of relief in the construction of new housing, a gradual decline in housing completions is predicted in the coming years. In
Figure 5, housing starts including expansions and reform works. The data for housing completions are for up to and including November 2009 (included) and housing approvals for up to and including August 2009.
Figure 5.
The monthly evolution of the number of housing completions (certifications from technical architect associations) and housing starts (approvals from technical architect associations): 1992–2009. Source: Data from statistics of Ministry of Public Works and Transport (Ministerio de Fomento).
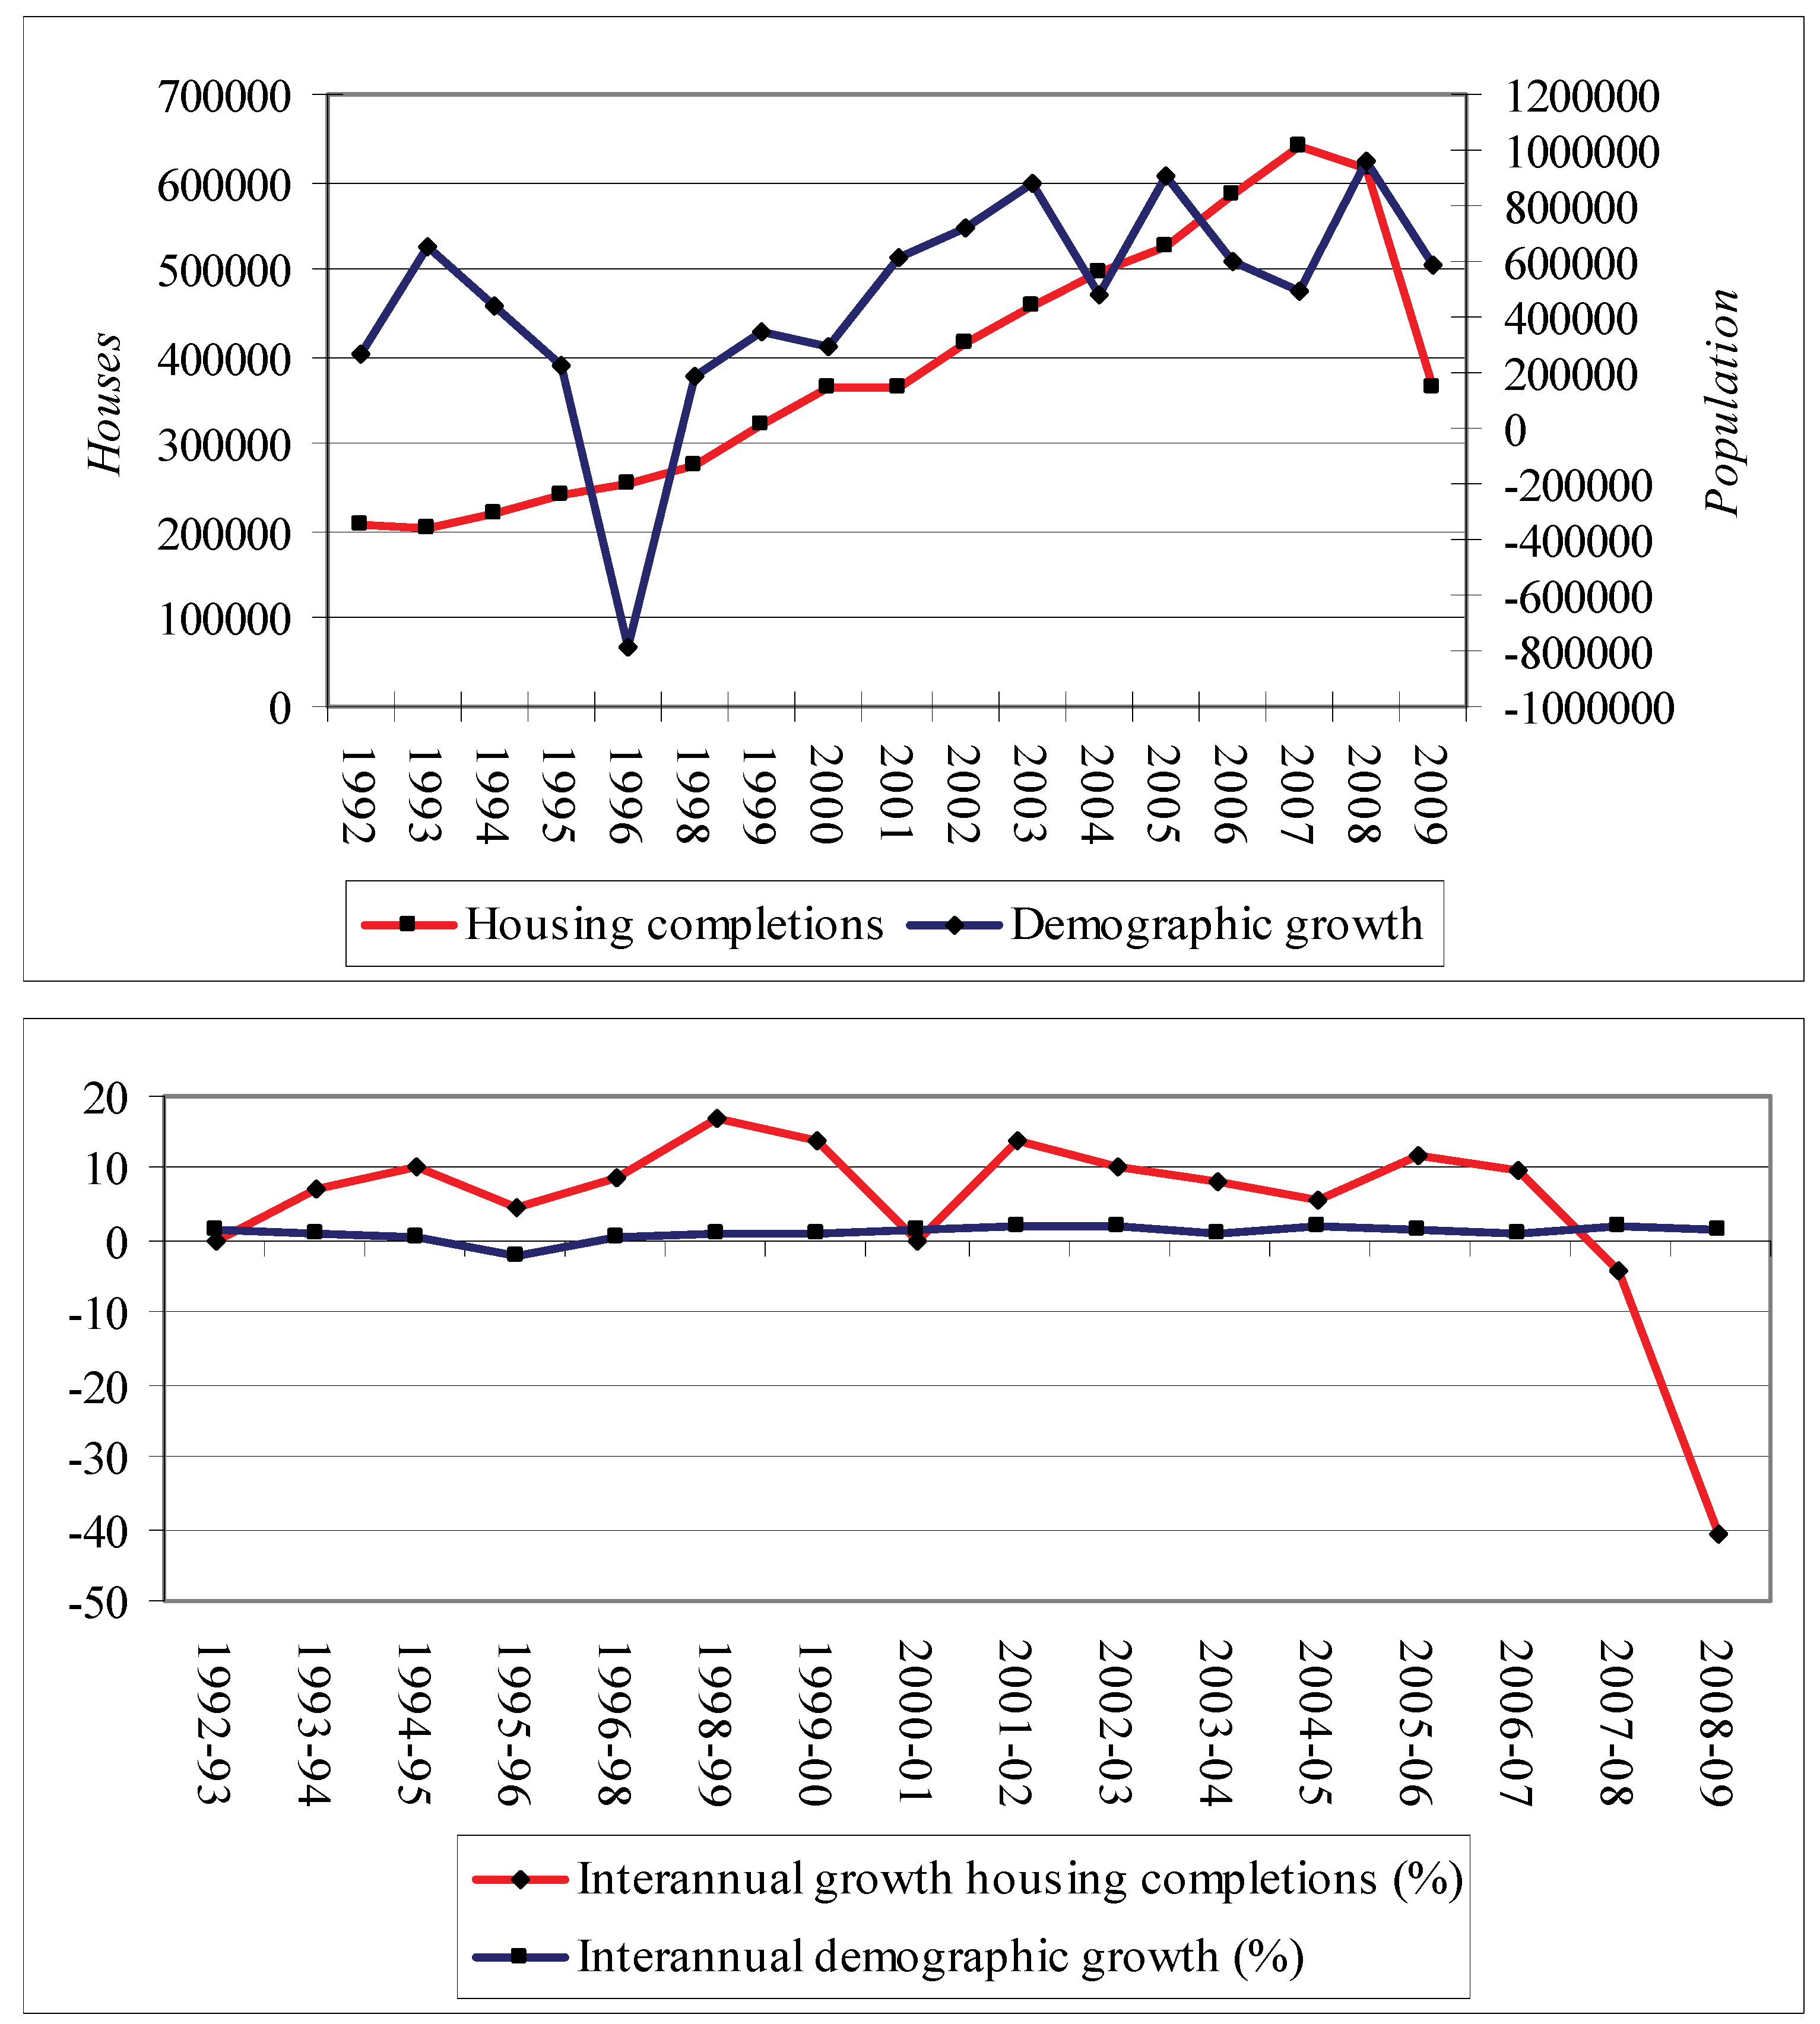
Similarly to stock quotes and expansions, construction and housing prices follow a cyclical pattern that is more closely related to economic aspects than to demographic variables [
22]. Thus, the rising number of houses in Spain had little to do with population growth. The main factor lay in the value placed on housing as a speculative investment [
9,
20,
22,
27]. That is, residential construction made it possible to cover the traditional housing deficit in relation to Spain’s population, yet not the real housing needs demanded by society; above all because of high prices. This was even more serious if we consider the low amounts of investment in social housing and the consolidation of a model firmly committed to ownership [
28]. From a relative point of view, annual housing construction rates were well above population growth until 2007, when the trend changed. Although we lack data for December 2009, housing construction rates fell by more than 40% during the first eleven months of that year, compared with the previous year (
Figure 6). In this figure, the data for housing construction in 2009 do not include those completed in December, since the official statistics for that month have not yet been released.
Figure 6.
Demographic growth and the construction of completed houses (certifications from the technical architects association): 1992–2009. Source: Data from statistics of Ministry of Public Works and Transport and INE.
Figure 6.
Demographic growth and the construction of completed houses (certifications from the technical architects association): 1992–2009. Source: Data from statistics of Ministry of Public Works and Transport and INE.
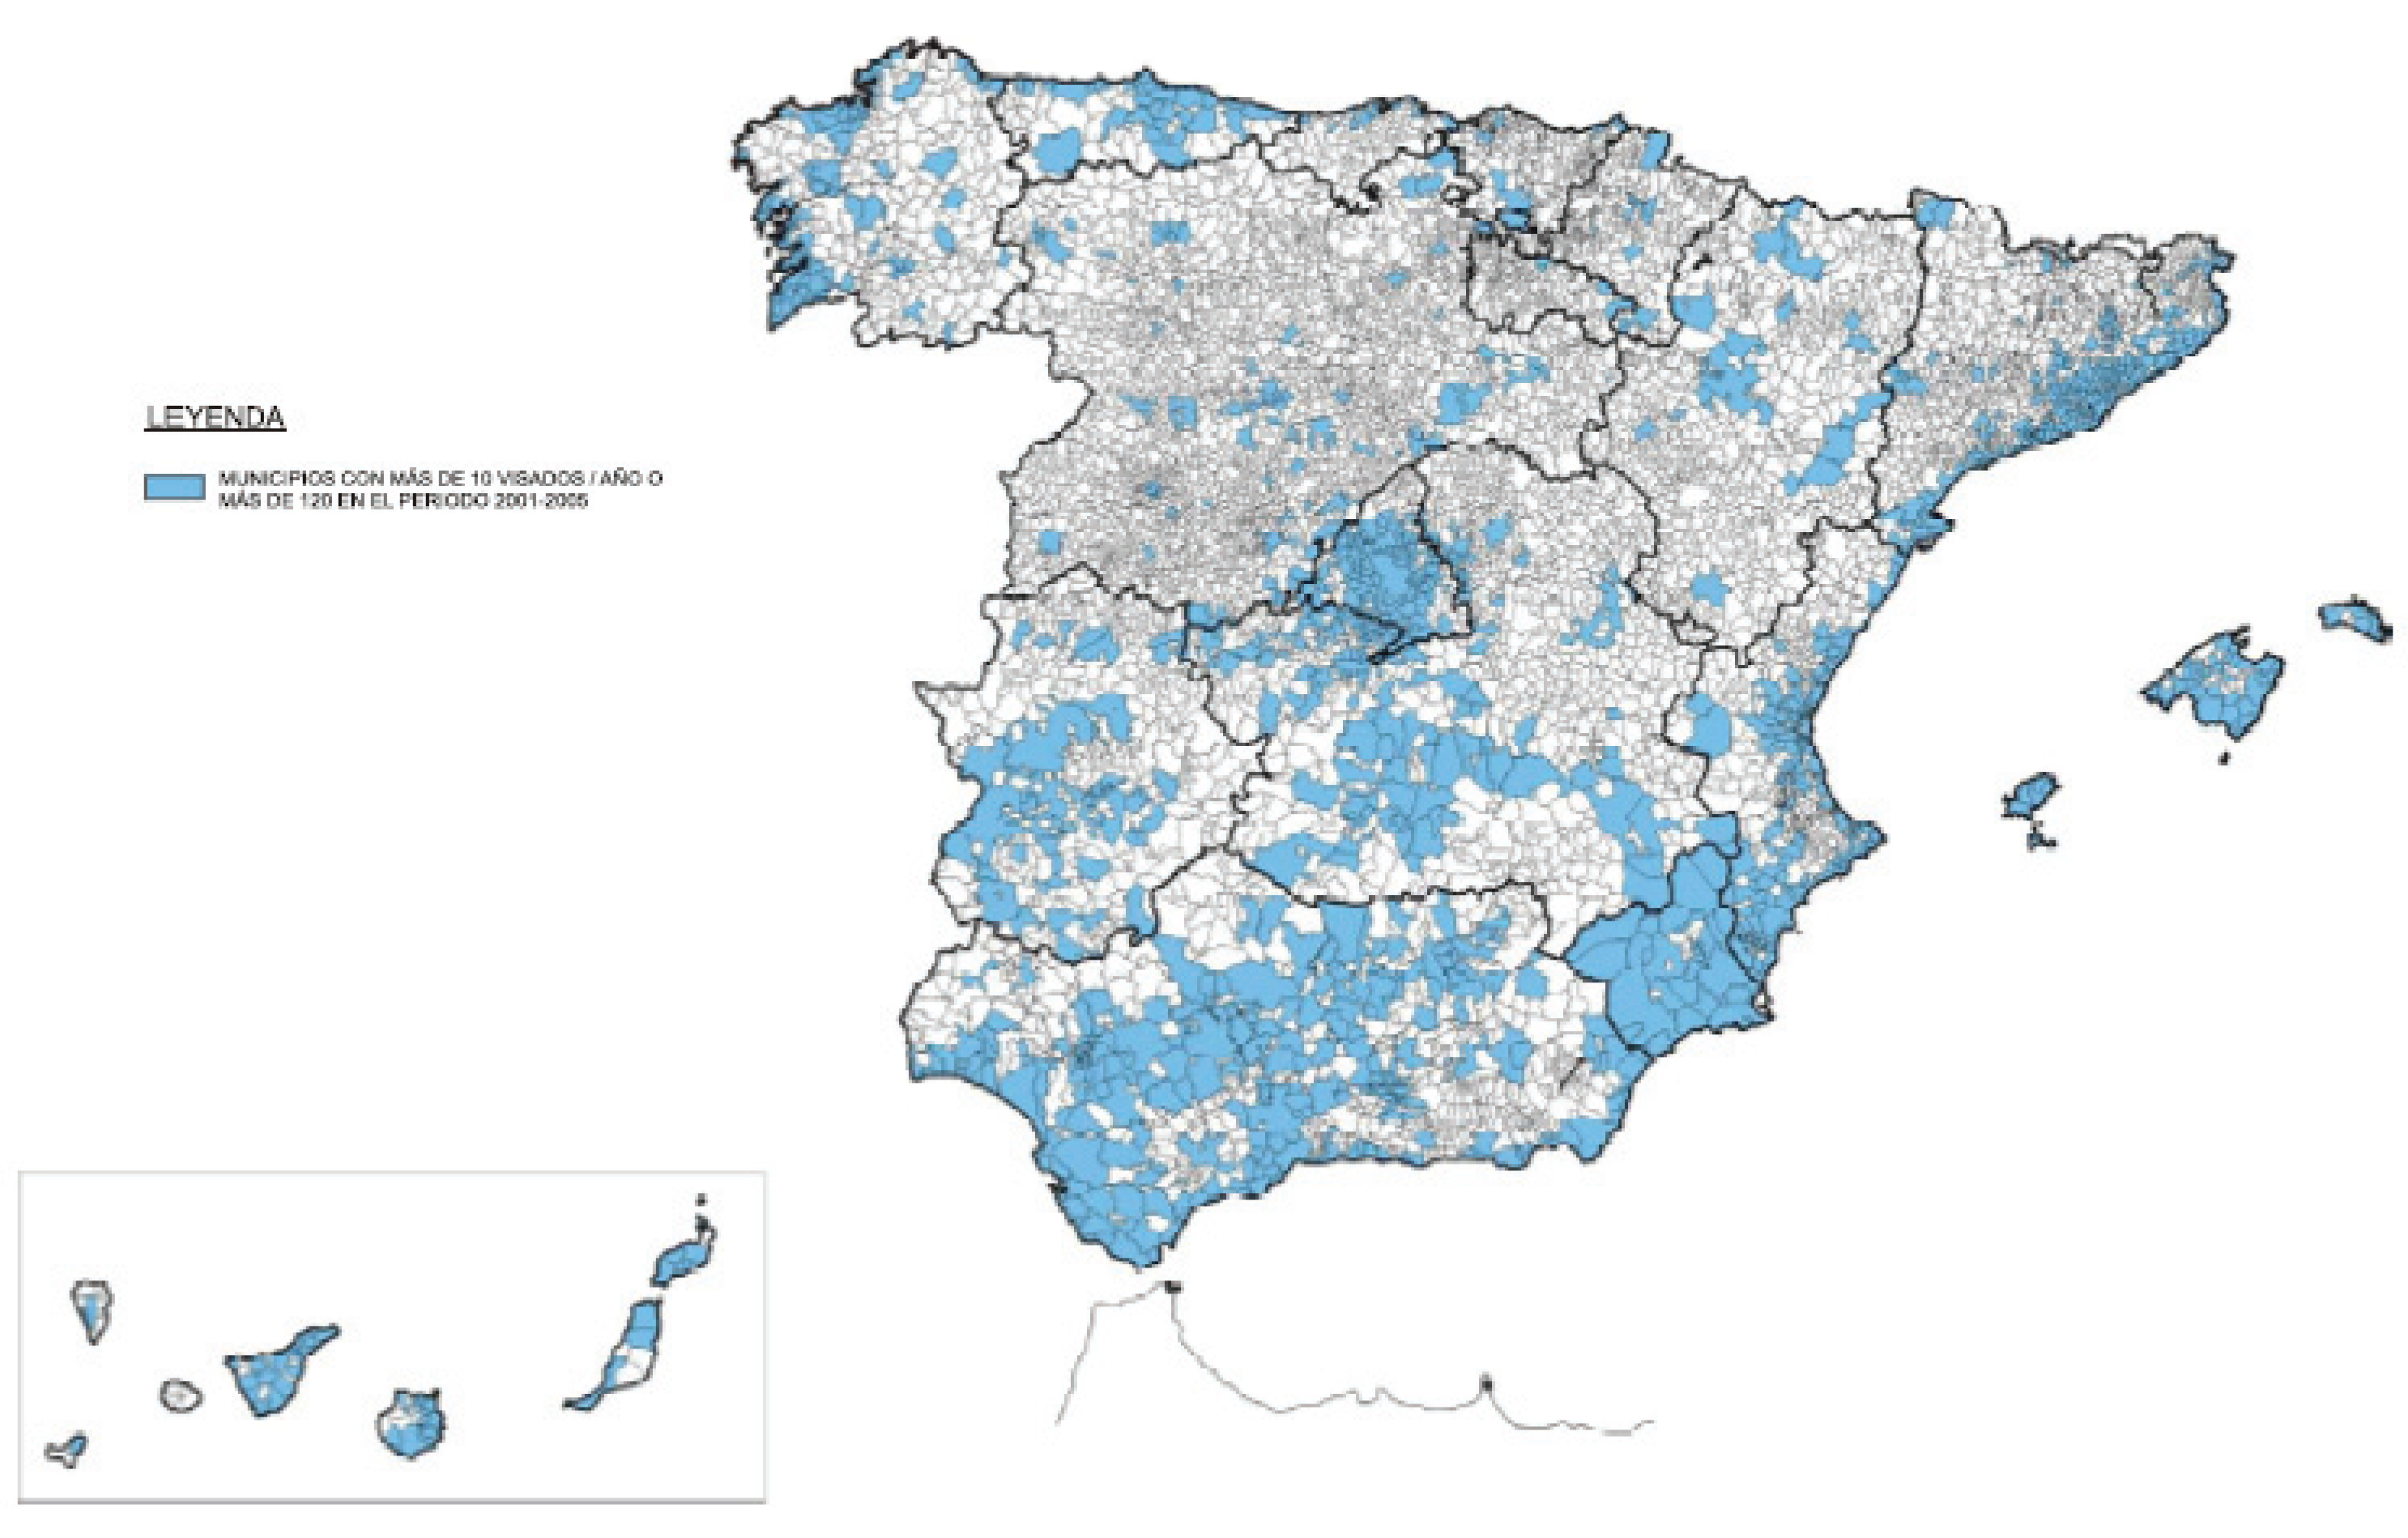
The territorialization of these processes can be clearly seen in the map that displays the municipalities with the most housing approvals during the years when construction was booming (
Figure 7). This map shows the economic and territorial contrasts in Spain between urban and rural areas, coastal and inland areas, northern and southern halves, and the fundamental role of the axes of development in the organization of the space. Prominent among the causes behind this unequal distribution of real estate activity were the spread of cities in the territory and the generalization of metropolitanization processes, the shift of the population to the coasts, the importance of second homes, and residential tourism (metropolitan, Mediterranean and islands).
Figure 7.
Municipalities with 10 or more approvals per year, or more than 120 during the period from 2000 to 2005. (Reproduced with permission from “Atlas de la construcción en España. Año 2005”, published by “Ministerio de Fomento”, 2007) [
29].
Figure 7.
Municipalities with 10 or more approvals per year, or more than 120 during the period from 2000 to 2005. (Reproduced with permission from “Atlas de la construcción en España. Año 2005”, published by “Ministerio de Fomento”, 2007) [
29].
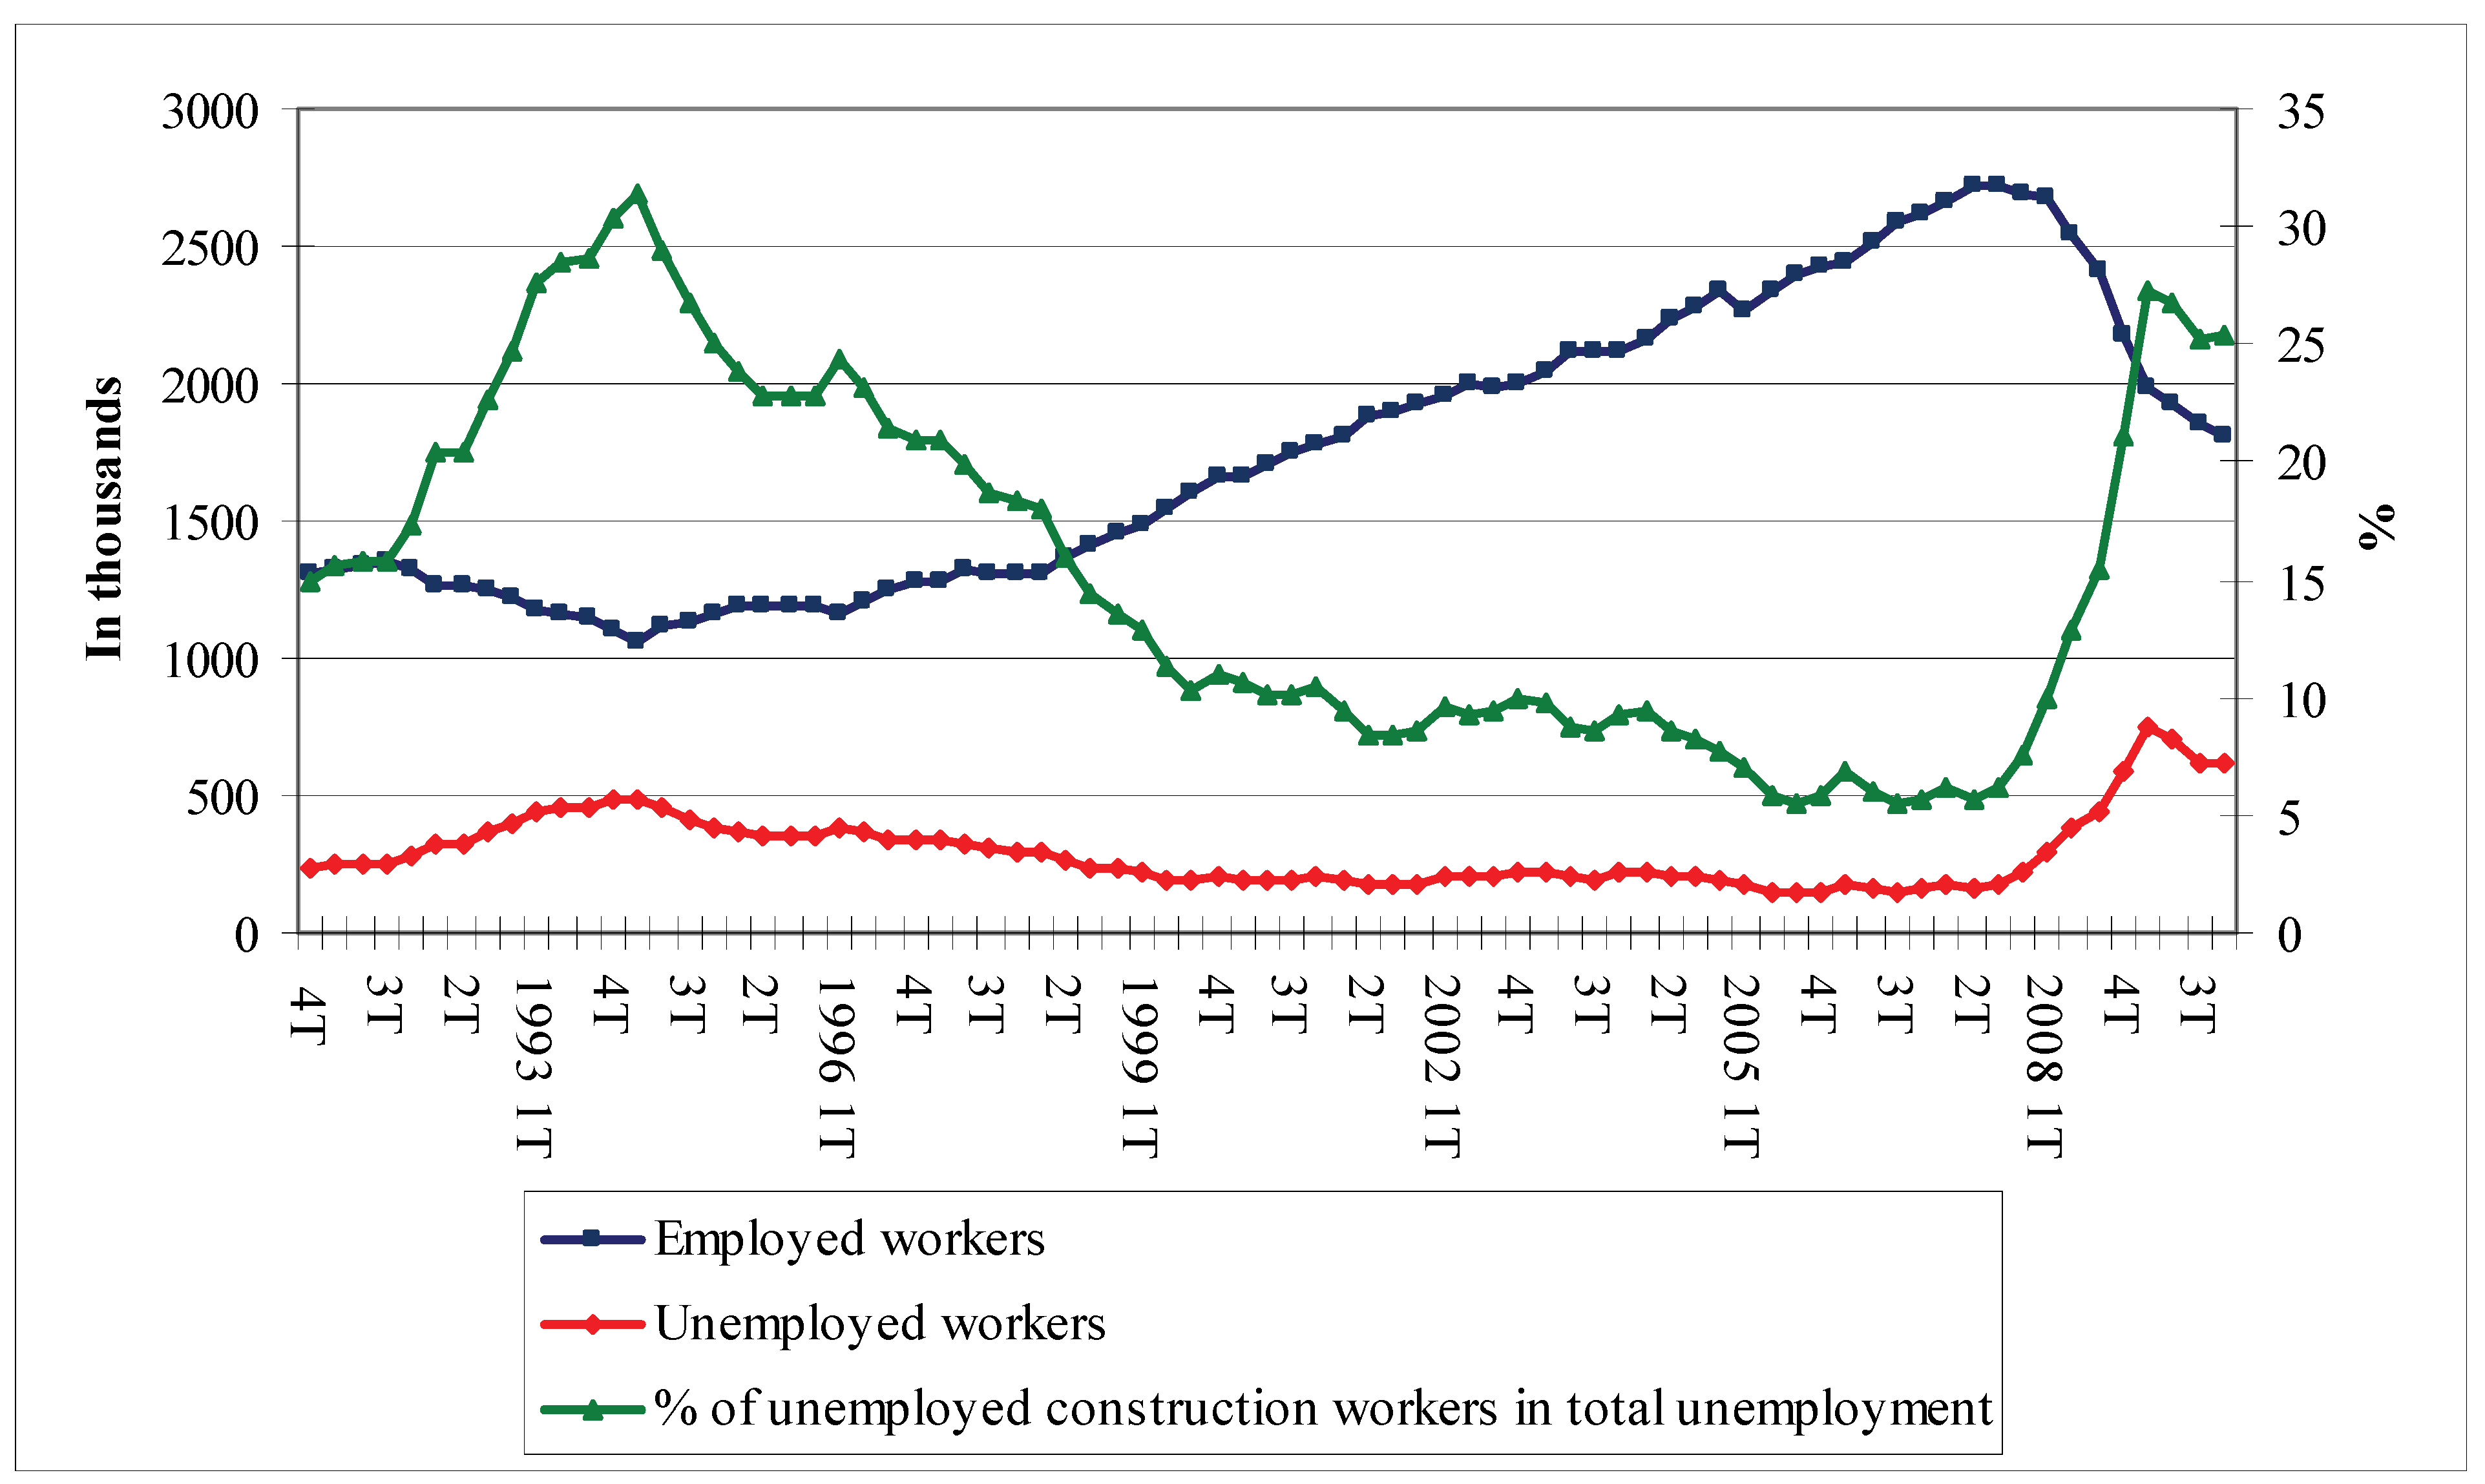
This boom in real estate construction had important social consequences, two of which stand out: the robust effect on the labor market, and the impact on rising housing prices, which J. García [
30] called the “real estate tumor”. During the years of the housing boom, unemployment in the construction sector was negligible and the number of employed workers grew steadily until late 2007. As a counterpoint, the impact of the housing crisis on employment was disastrous: one in every four unemployed workers in Spain belonged to this economic sector in late 2009, a percentage of total unemployment that is nonetheless similar to the figures from 1993 and 1994. Those years had high unemployment rates in Spain (
Figure 8). This confirms the importance of construction in the Spanish labor market and in the country’s economic structure within recent decades.
Despite the extensive literature on the subject of housing prices, I believe it is a factor to be taken into account when studying the changing trends in economic and urban policy. The average price of housing rose by 212.41% (€1,424.90/m²) between the first quarter of 1995 and the last quarter of 2007. In relation to purchasing power, buying a house was more than twice as expensive for a family at the end of the stage under consideration than at the beginning. Economist J. Garcia [
30] claimed that around 60–65% of this evolution in prices could be explained by the usual factors (population, income, interest rates and occupancy rate,
etc.), whereas the remaining 35–40% was caused by other factors, the so-called “housing bubble”.
Figure 8.
Four-month evolution of employed and unemployed workers in the construction industry and the percentage of unemployed workers in this sector compared with total unemployment: 1990–2009. Source: Data from the INE’s Survey of the Active Population.
Figure 8.
Four-month evolution of employed and unemployed workers in the construction industry and the percentage of unemployed workers in this sector compared with total unemployment: 1990–2009. Source: Data from the INE’s Survey of the Active Population.
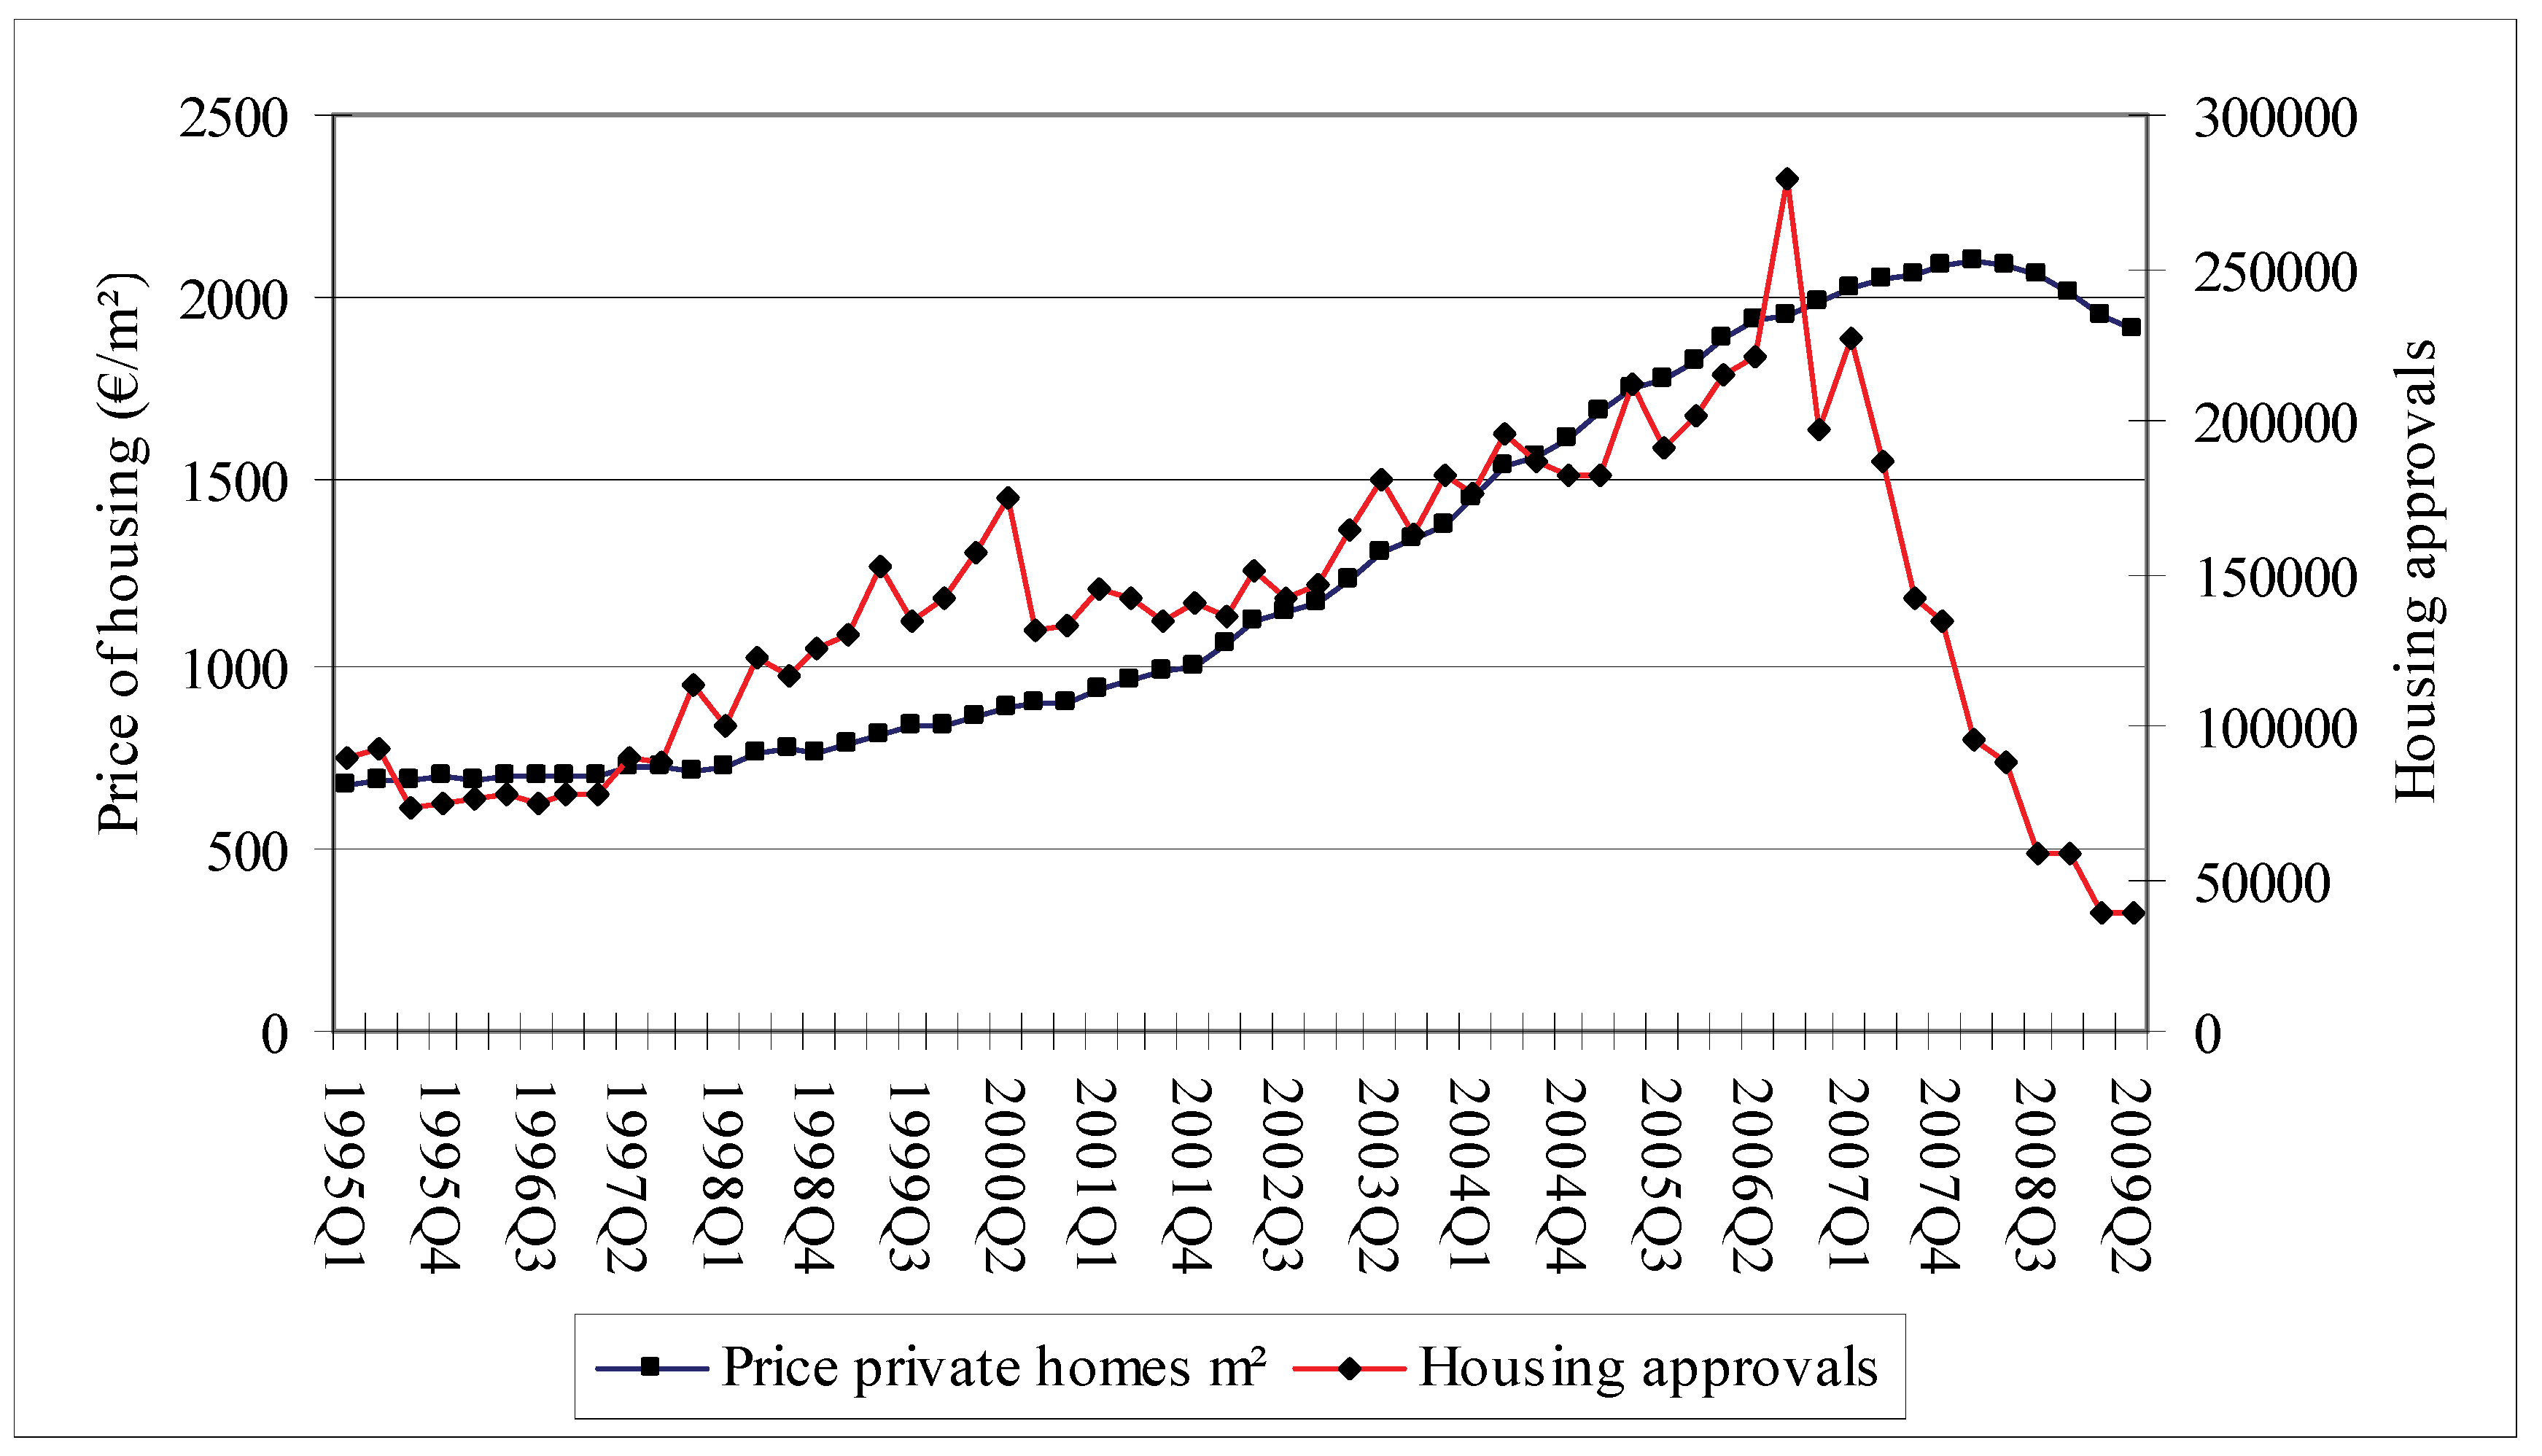
During upturns, housing prices are set as the most a family can afford given existing credit conditions and average income. In this situation, it is the increase in housing prices which is deducted when land is sold [
30]. Until 2001, the main reason for purchasing a home was to use it. From that time on, purchasing’s new role was as an investment, both as patrimonial property and for speculative reasons. In other words, rather than depending on production costs, housing prices in the market depended on expectations of them, as compared with the alternative return of money and other forms of property [
25]. As in the functioning of any speculative bubble, houses are bought because prices are expected to rise and prices rise because there are more and more purchases increasingly financed by loans [
26]. Thus, the main cause of this increase was not a shortage in the housing supply because, as we can see in the figure attached, the more residential construction grew, the higher the average price of residential housing was, in response to an increased demand fundamentally based on speculative investment. There are different reasons behind this phenomenon: the conversion of housing into a shelter for assets, falling interest rates and easy financing conditions provided by banks and savings banks for purchasing second homes, the expectation of obtaining quick, abundant capital gains from the sales of these assets, rising income per capita, population growth and the rising immigration rate, higher employment rates,
etc. These ideas toppled one of the very common stereotypes in all stages of real estate expansion, which was heavily underscored by national land regulations passed in this period: the cause of rising housing prices was due to the rising cost of land, which in turn, was a result of its scarcity; the solution to this was to increase the amount of land classified for development. Studies conducted in other countries confirm this lack of correlation between restrictive land use regulations and rising housing prices [
31] (
Figure 9).
Figure 9.
Four-month evolution of the total number of housing starts (approvals from the technical architect associations) and average housing prices (€/m²): 1995–2009. Source: Data from statistics of INE and Ministry of Public Works and Transport.
Figure 9.
Four-month evolution of the total number of housing starts (approvals from the technical architect associations) and average housing prices (€/m²): 1995–2009. Source: Data from statistics of INE and Ministry of Public Works and Transport.
In short, the real estate boom in Spain reached an unprecedented intensity and duration and also triggered an unprecedented economic crisis [
26]. The residential subsector, which had become the most important throughout the expansion phase, is suffering the most from the economic crisis. Thus, this is an appropriate time to plan public urban policies that are different from those promoted in recent decades and which support housing as an asset for use and not as an investment asset,. This is true not only because of the slump in population growth or excess real estate property (according to data from the Ministry of Housing, December 31, 2008, the private housing stock reached the figure of 613,512 units), but also because social conditions encourage the implementation of measures in this sense. Some of the most prominent of these conditions are the role of civic movements opposed to territorial destruction and real estate speculation, the numerous corruption scandals in urban planning, and the proven failure of a “brick”-based economic policy planned for the short-term without heeding the consequences.
4.2. The Impacts: Development of Artificial Land and Urban Sprawl
Land is a factor in, and a result of, socio-economic processes. The expansive economic cycle over the past decade was accompanied by significant changes in land use. The residential-infrastructures building tandem led to an indiscriminate use of land and an increase in artificial surfaces. The consequences are virtually irreversible. According to the Corine Land Cover data from 2000, artificial surfaces (urban and other artificial surfaces) in Spain accounted for 2.1% of the total, 29.24% more than ten years earlier. This equalled an area equivalent to almost one third of what had been urbanized throughout history [
32], placing Spain, along with Ireland and Portugal, at the head of the list of European countries with the highest growth in artificial surfaces [
32] at a pace of 1.9% annually, a figure well above the average for the countries in the CLC2000 programme, which was 0.68% [
4,
33].
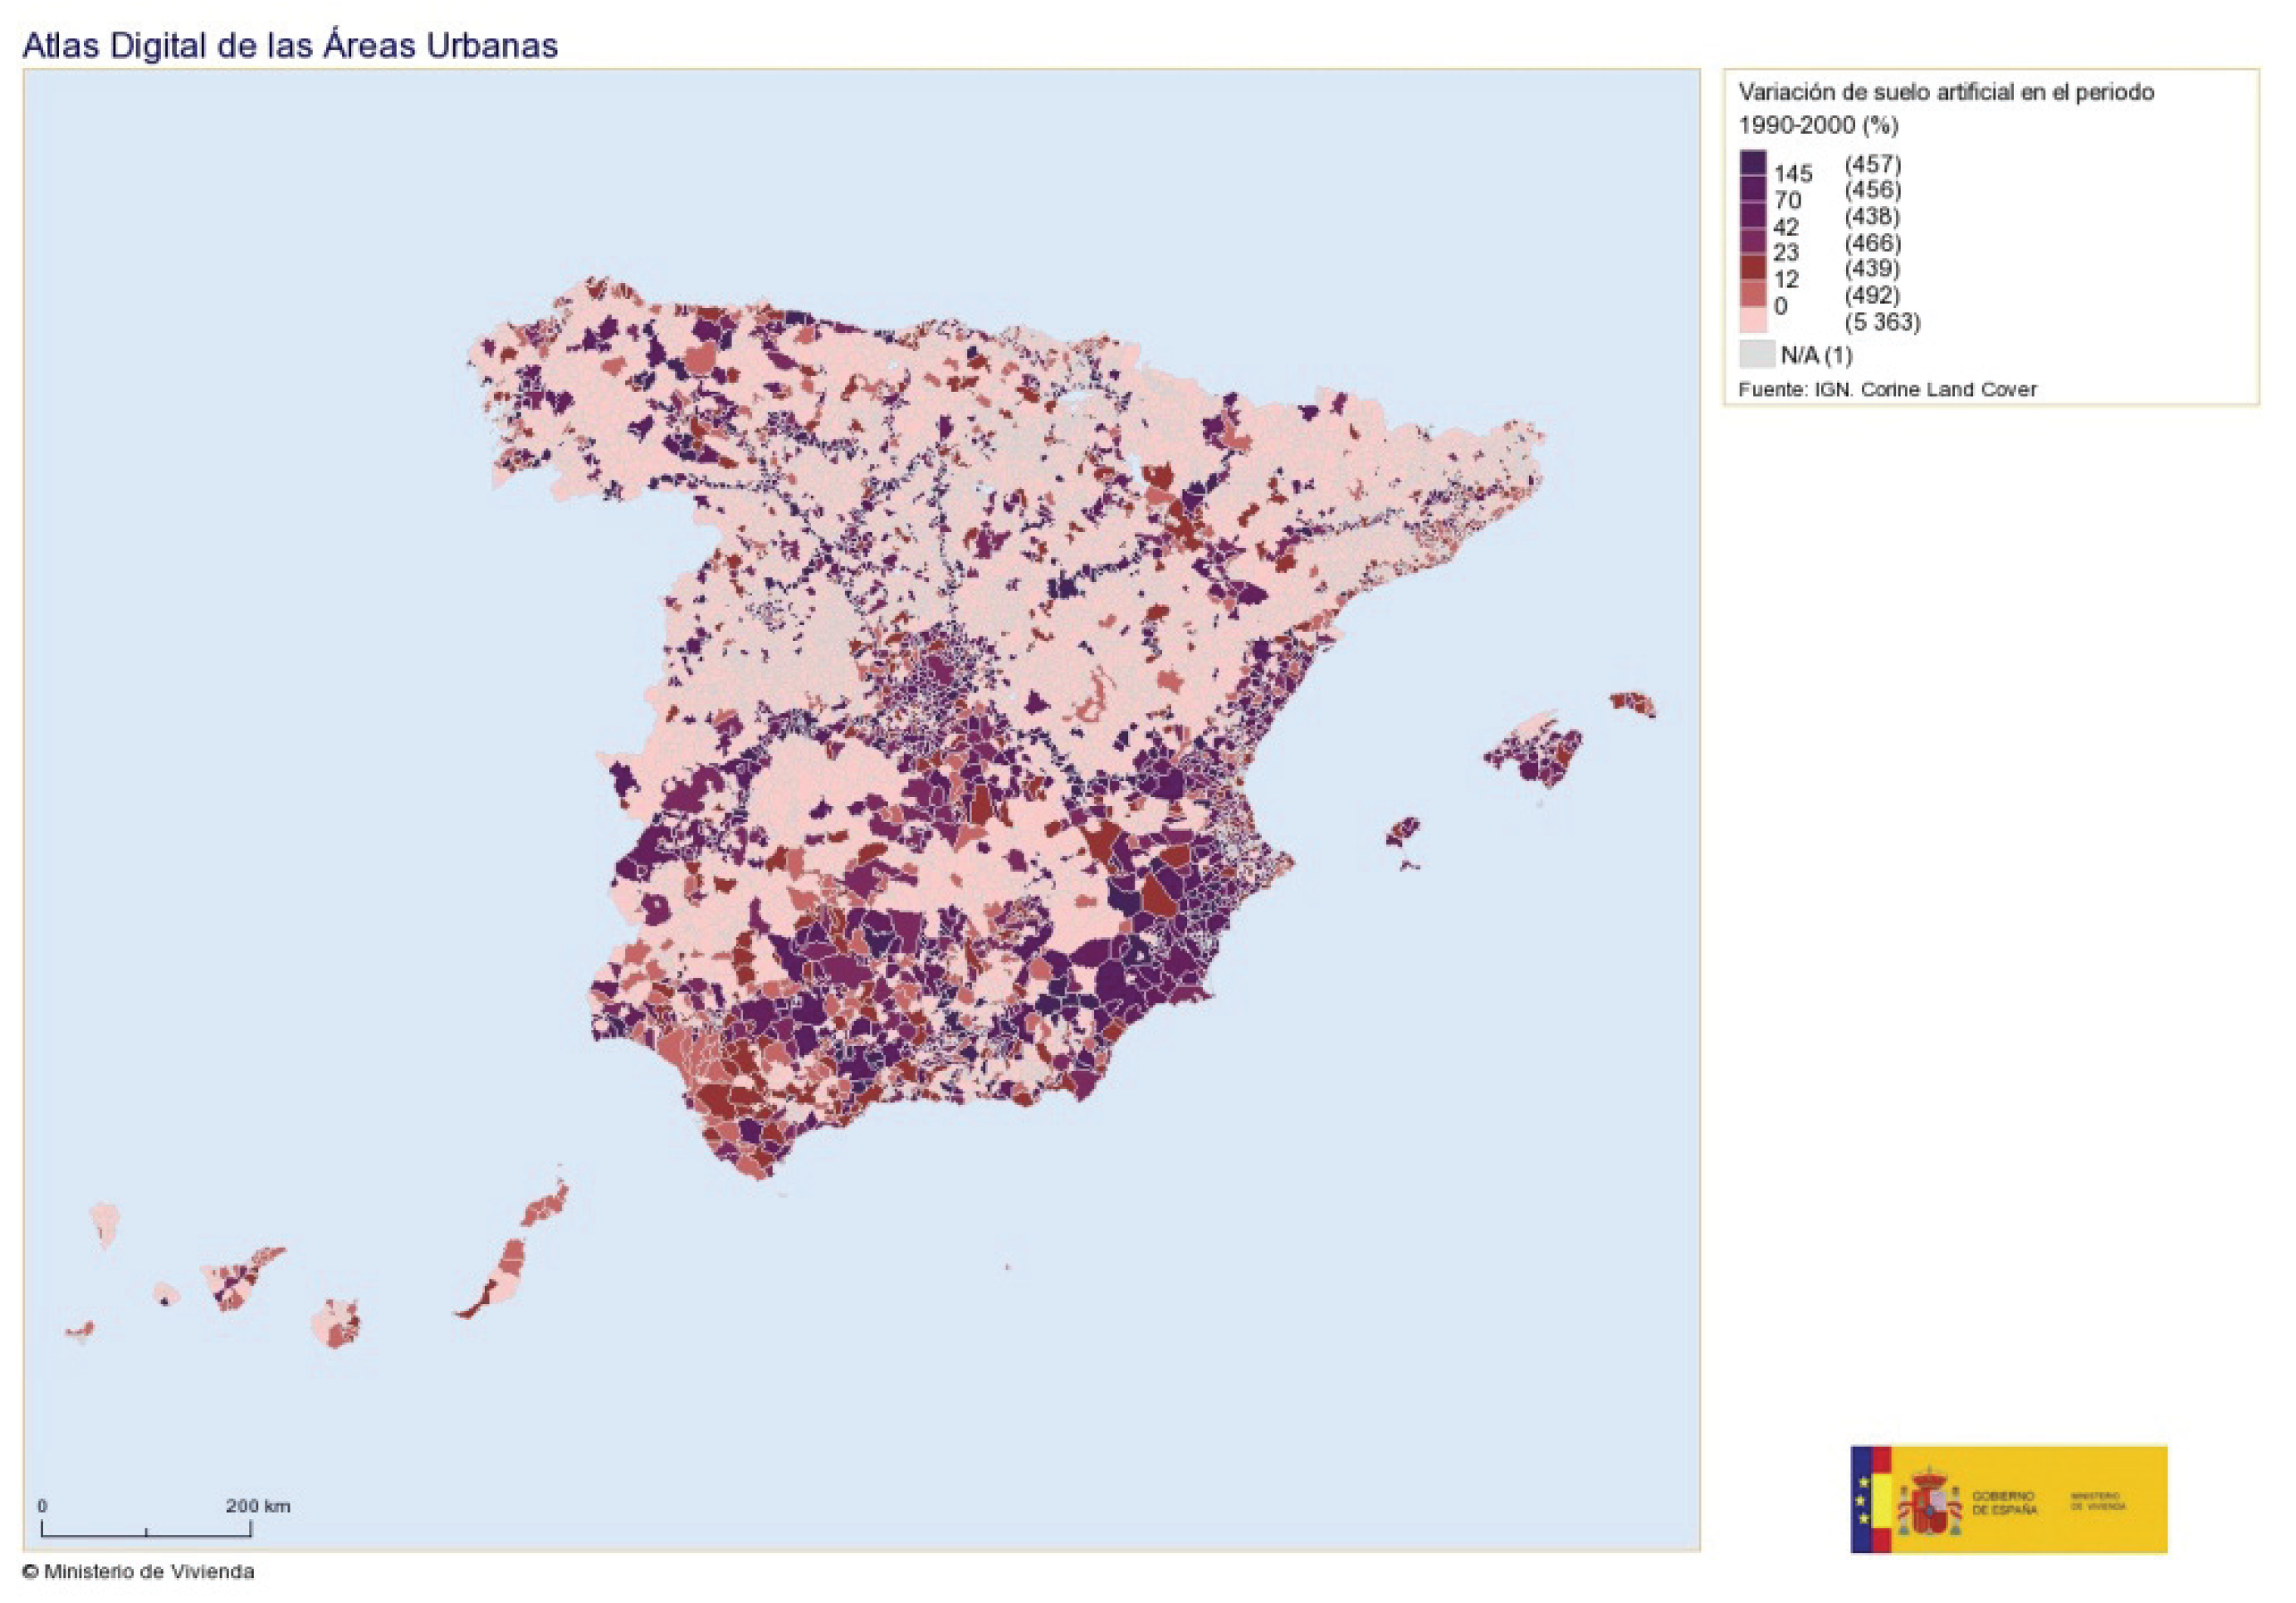
Based on the Corine Land Cover data, using the information contained in the Atlas of Urban Areas in Spain is a good instrument for analysing these territorial changes. Our work is based on four maps that are illustrative of the processes under study. The variation in artificial land by municipality from 1990–2000 reflects a significant increase in this surface in three zones (
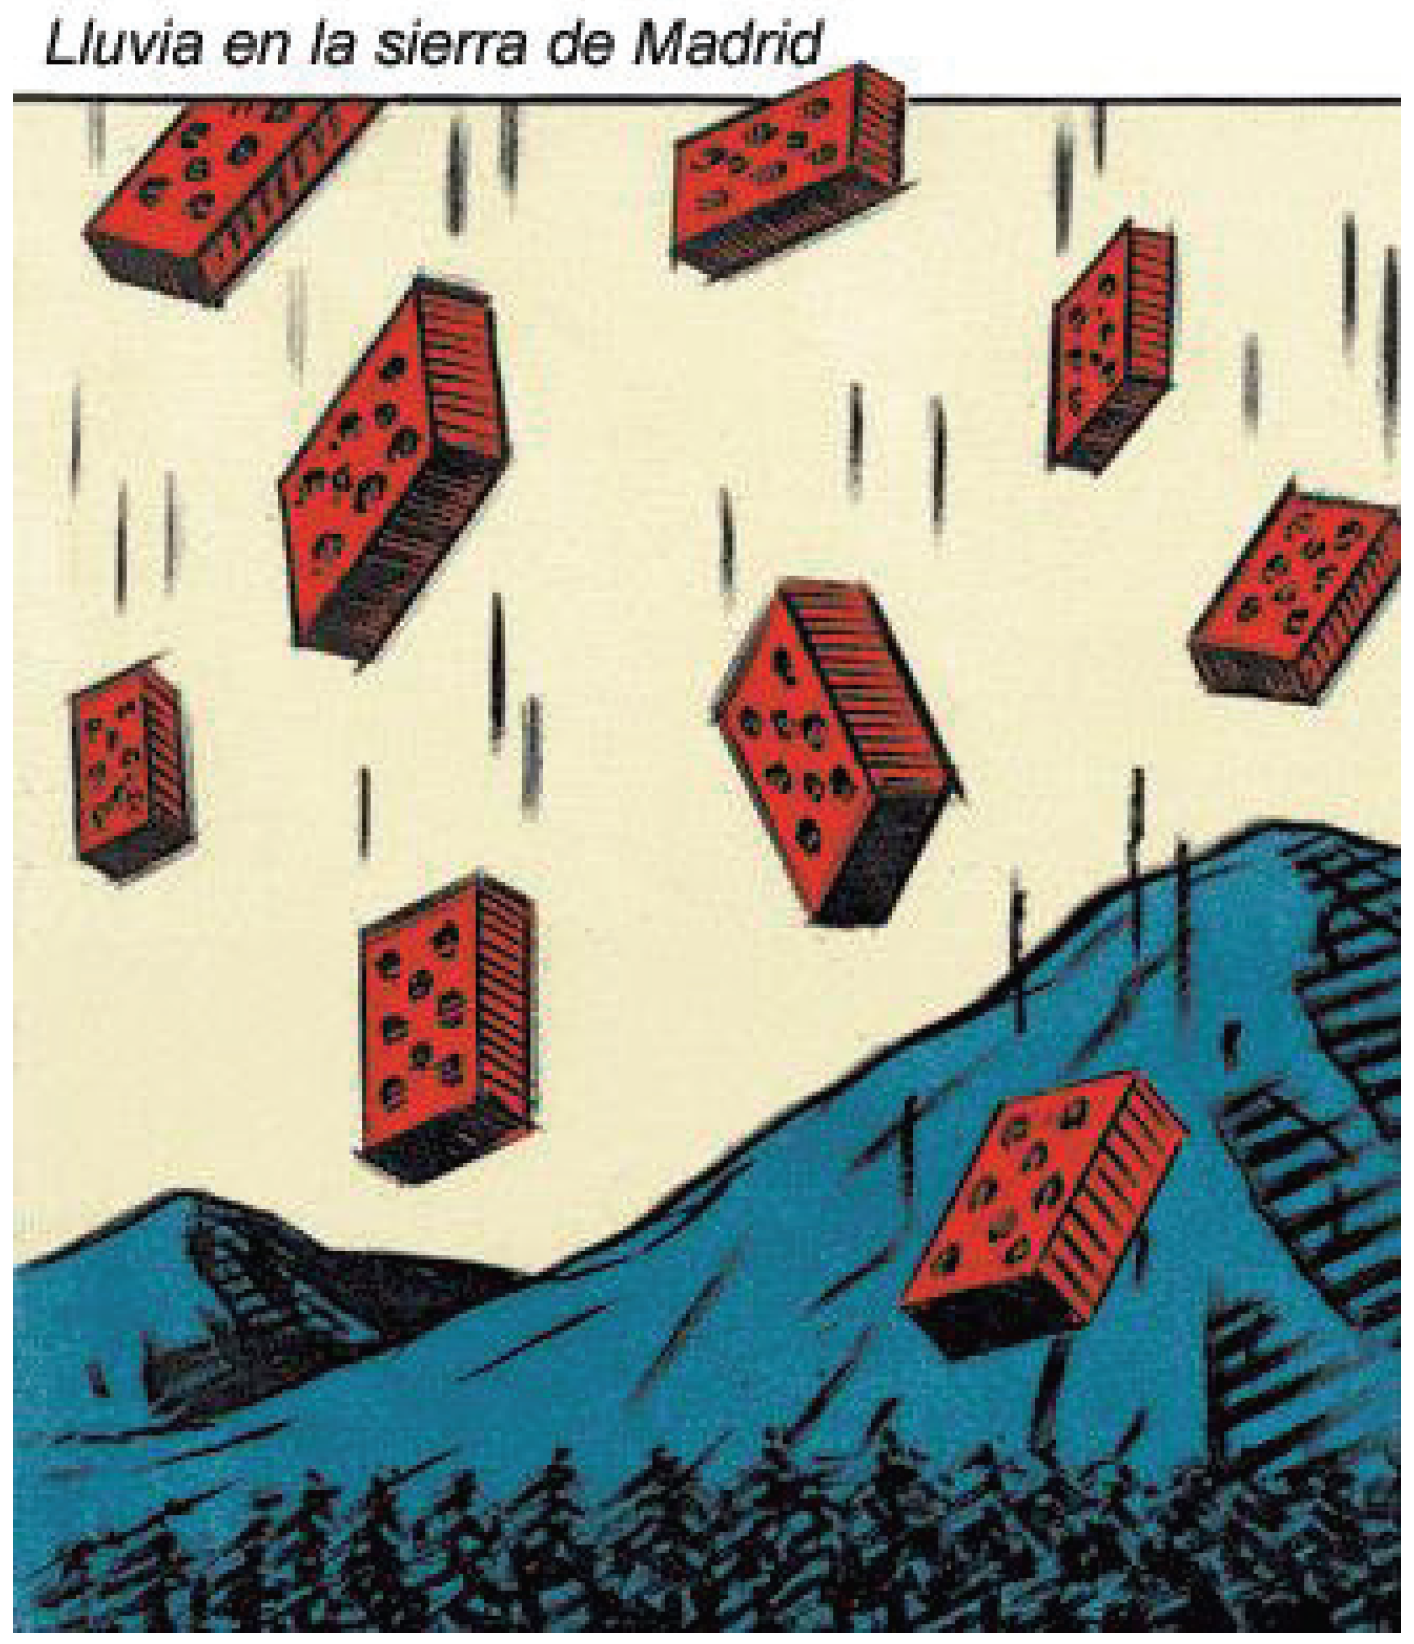
Figure 11). First, in the territories with the greatest real estate booms, primarily the entire Mediterranean coast from Castellón to Huelva, including the Balearic Islands, and most notably in Alicante and Murcia, where almost all the municipalities are included in the group with the highest increases in land artificiality levels (+145%). The tourist areas in the Mediterranean and the islands (the Canaries and the Balearics) have suffered like few others from the real estate excesses of second homes and housing construction as an investment and speculative asset. Secondly, the growth in artificial land in Madrid and its metropolitan area stands out. In absolute values, Madrid has lost as much agricultural land as artificial land has been created. The metropolitan areas in southern, southeast and northeast Madrid are the areas where urban sprawl has spread the most. Also indicative of the changes this region is experiencing is that the fastest growing areas are those earmarked for open urbanization (free-standing homes and/or those with gardens) (17%) and industrial and commercial areas (15%) (
Figure 10). Third, there are a number of municipalities in the interior of mainland Spain where artificial land has grown at a fast pace; these municipalities spread out from Madrid in different directions on linear axes. These developmental axes in different categories have been created and extend parallel to high density roads and have driven not only major real estate developments, but commercial, leisure and industrial ones as well. We are witnessing the spread of urbanization over old rural zones that previously lay far from the most densely populated cities and whose landscapes and functionalities have been radically transformed by improved accessibility.
Figure 10.
A critical view of over-construction: Rain in the mountains of Madrid. (Reproduced with permission from “El Roto”, published by “El País”, 16 July 2006).
Figure 10.
A critical view of over-construction: Rain in the mountains of Madrid. (Reproduced with permission from “El Roto”, published by “El País”, 16 July 2006).
The intense development of artificial coastal land is particularly acute, especially within the first kilometer from the shore. According to the Corine Land Cover data from 2000, the percentage of artificial surfaces within this first kilometer was more than 20% in Catalonia, Valencia, Murcia and Andalusia. The urban occupation of the beachfront led to the spread of urbanization towards pre-littoral stretches (between 1 and 10 km from the coast). Although the process is less intense, the artificial land in pre-littoral stretches in the province of Barcelona reached 30.9% in 2000 (27.5% in 1990), 18.6% in Alicante (1990: 12.2 %) and 17% in Valencia (1990: 13.1%). There are many factors that influence this urbanising dynamic, yet an important one is the impact of tourism—fundamentally the residential tourism characteristic of the post-Fordist period.
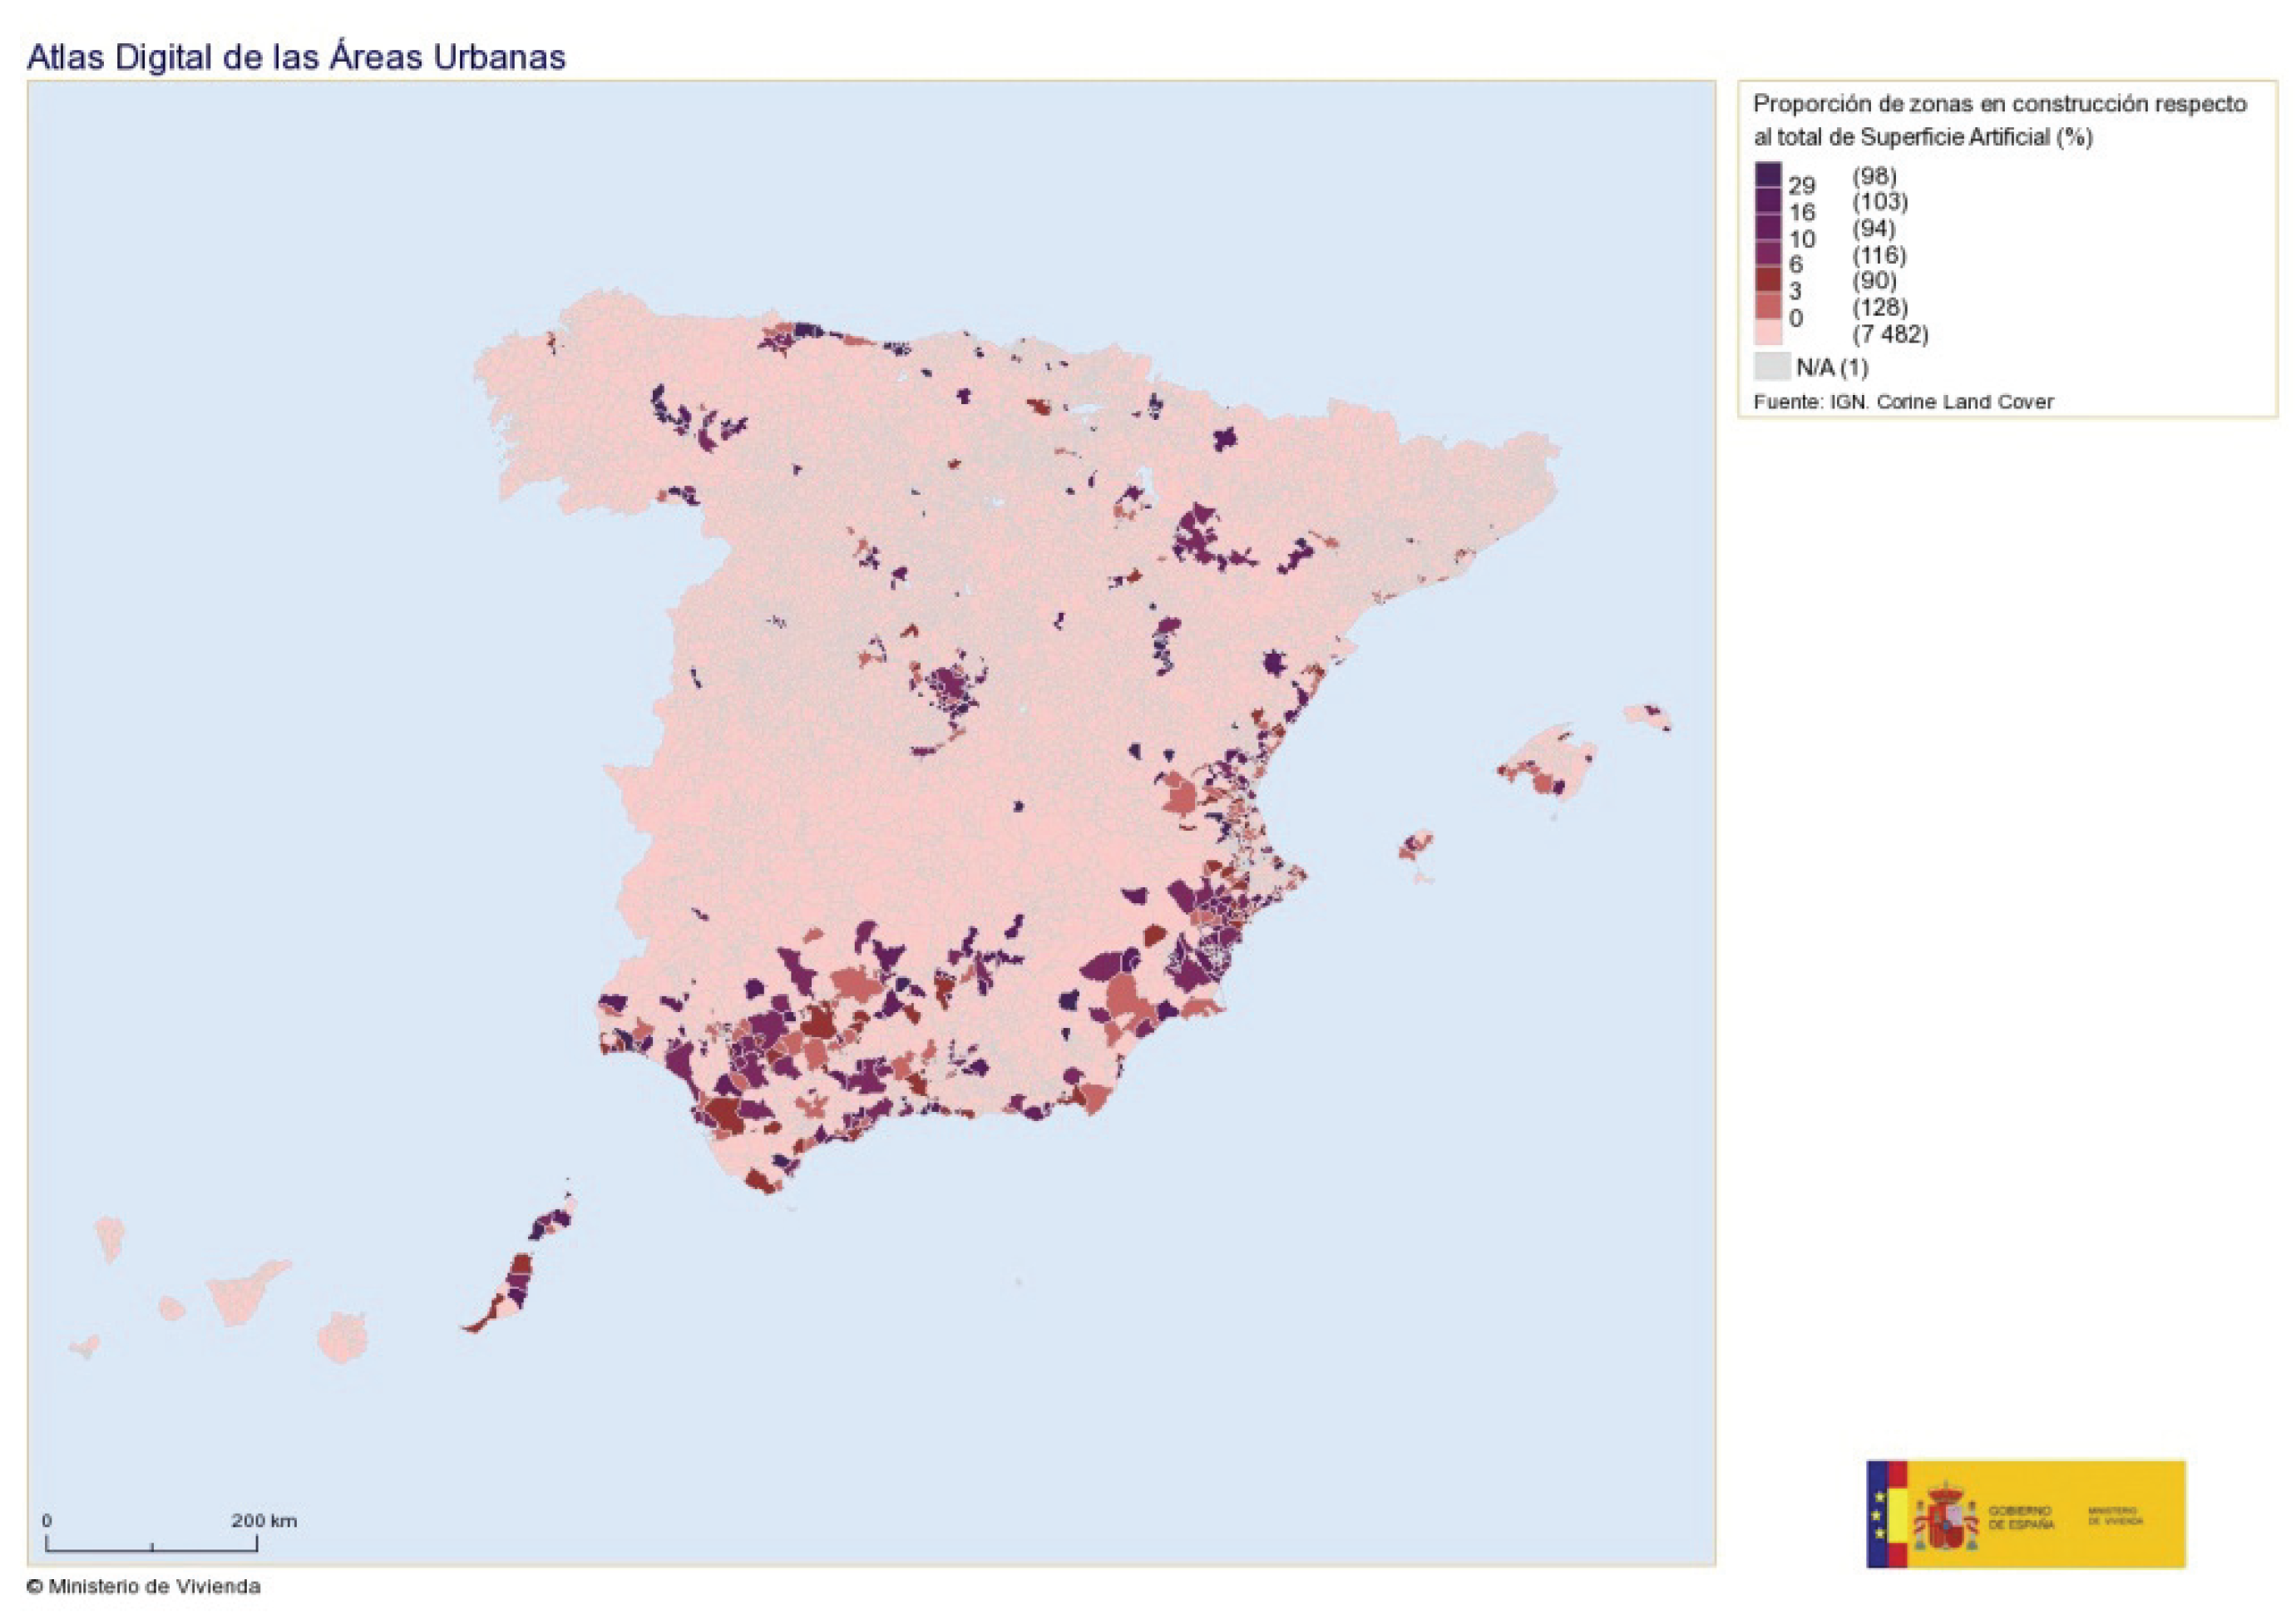
The attractions of the scenery, weather, and of course, speculation and investments, made the zones under construction coincide with the most artificialized territories. This is a situation that portends a negative outcome in the Corine Land Cover’s upcoming results for these regions. The territorial and urban planning instruments in Madrid, Murcia, and Valencia grant a relevant role to land classified for development, provide facilities for construction on land not classified for development, and approve developmentalist sectoral plans—especially those related to tourism and road infrastructures. The aforementioned conditions involve constant conflicts between the real estate sector and land, and between tourism and the environment (
Figure 12).
The third map represents the percentage of free-standing developments or those with gardens, or both. This is a suburbanization process dominated by a loose, disperse, low-density growth pattern. Once again, the Mediterranean regions, Andalusia and Madrid, places with the most second homes (
Figure 13), are the areas where this model is most frequent. These areas account for 15.97% of the total Spanish housing stock, according to the 2001 Population and Housing Census. The ratio per 100 inhabitants rose from 6.86% in 1991 to 8.14% in 2001. In several experts’ opinions, the main cause of this positive evolution is the increase in per capita income and the improvement of the quality of life in Spain [
34]. Other authors prefer to focus on the compensation hypothesis [
35], whereby the importance of second homes is explained by the high density of the urban habitat, due to the relative lack of leisure opportunities this latter model involves [
36]. However, we are more closely aligned with Artigues and Rullan’s idea [
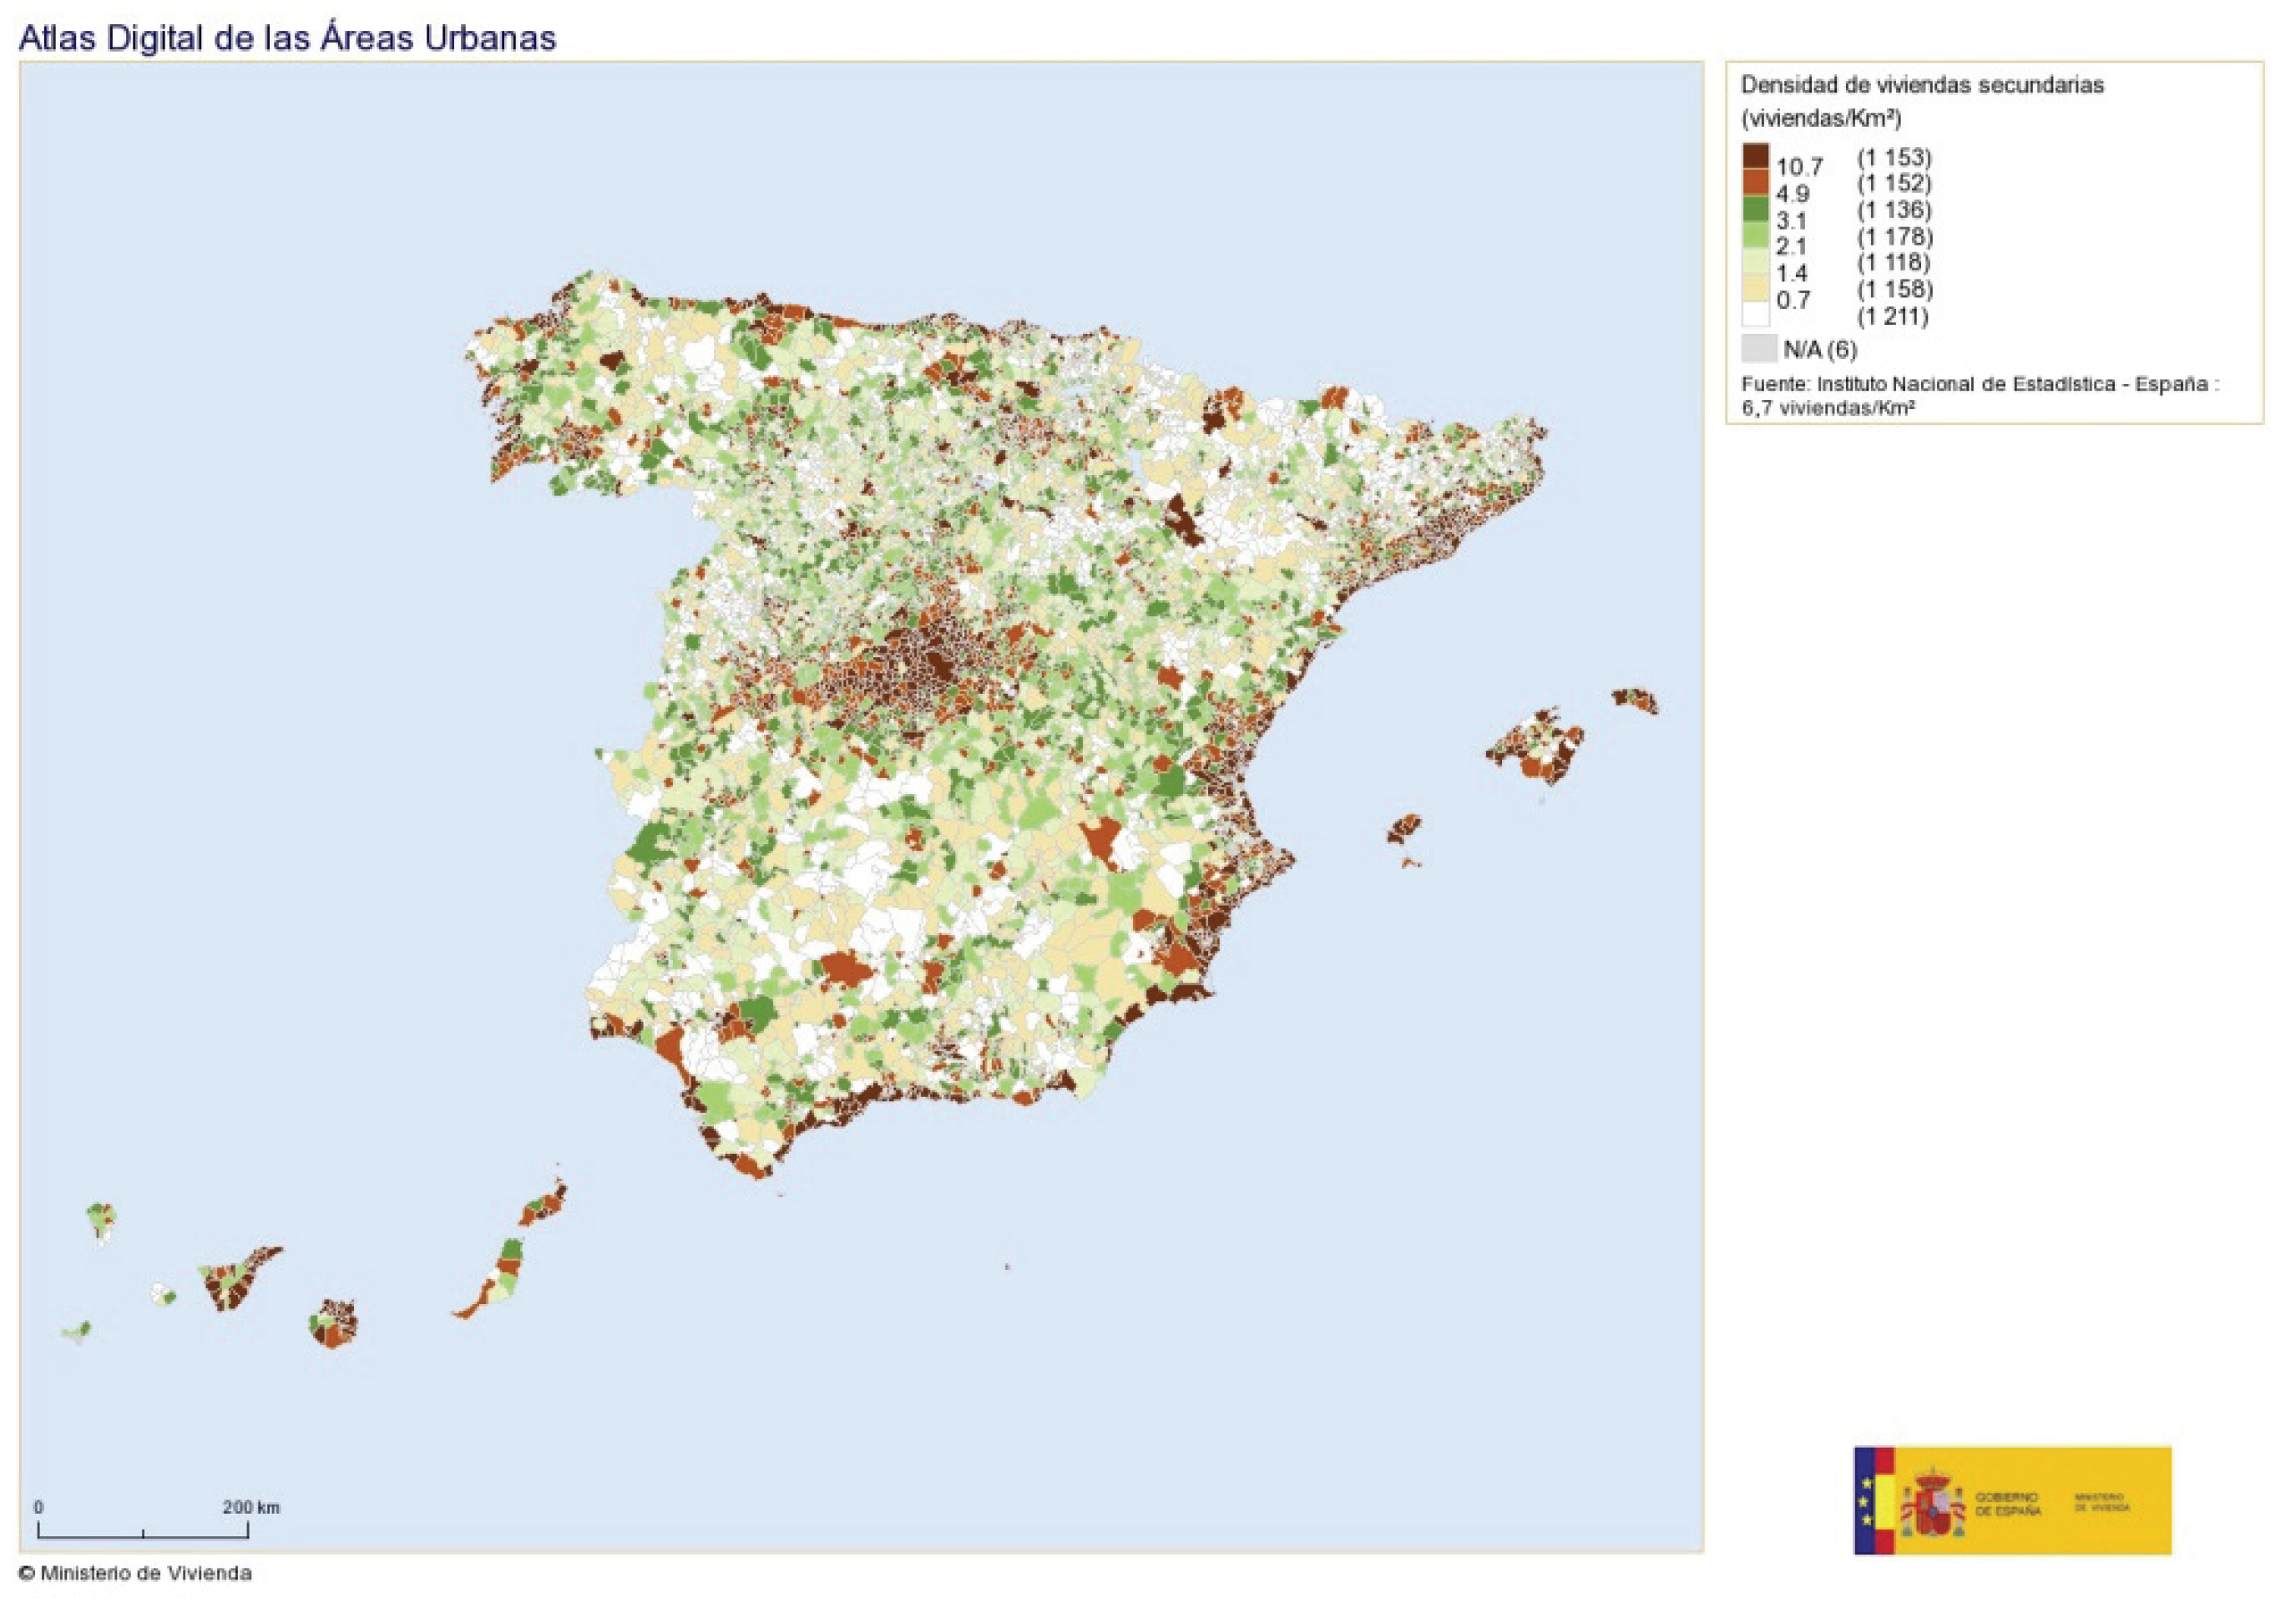
25], which associates it with its merchandise-stock nature. Thus, the objective of housing construction is to prioritize the real estate and construction investment-business, as opposed to the right to housing. This explains the importance of second homes, especially in coastal tourist areas and in spaces close to big cities and urban agglomerations (
Figure 14).
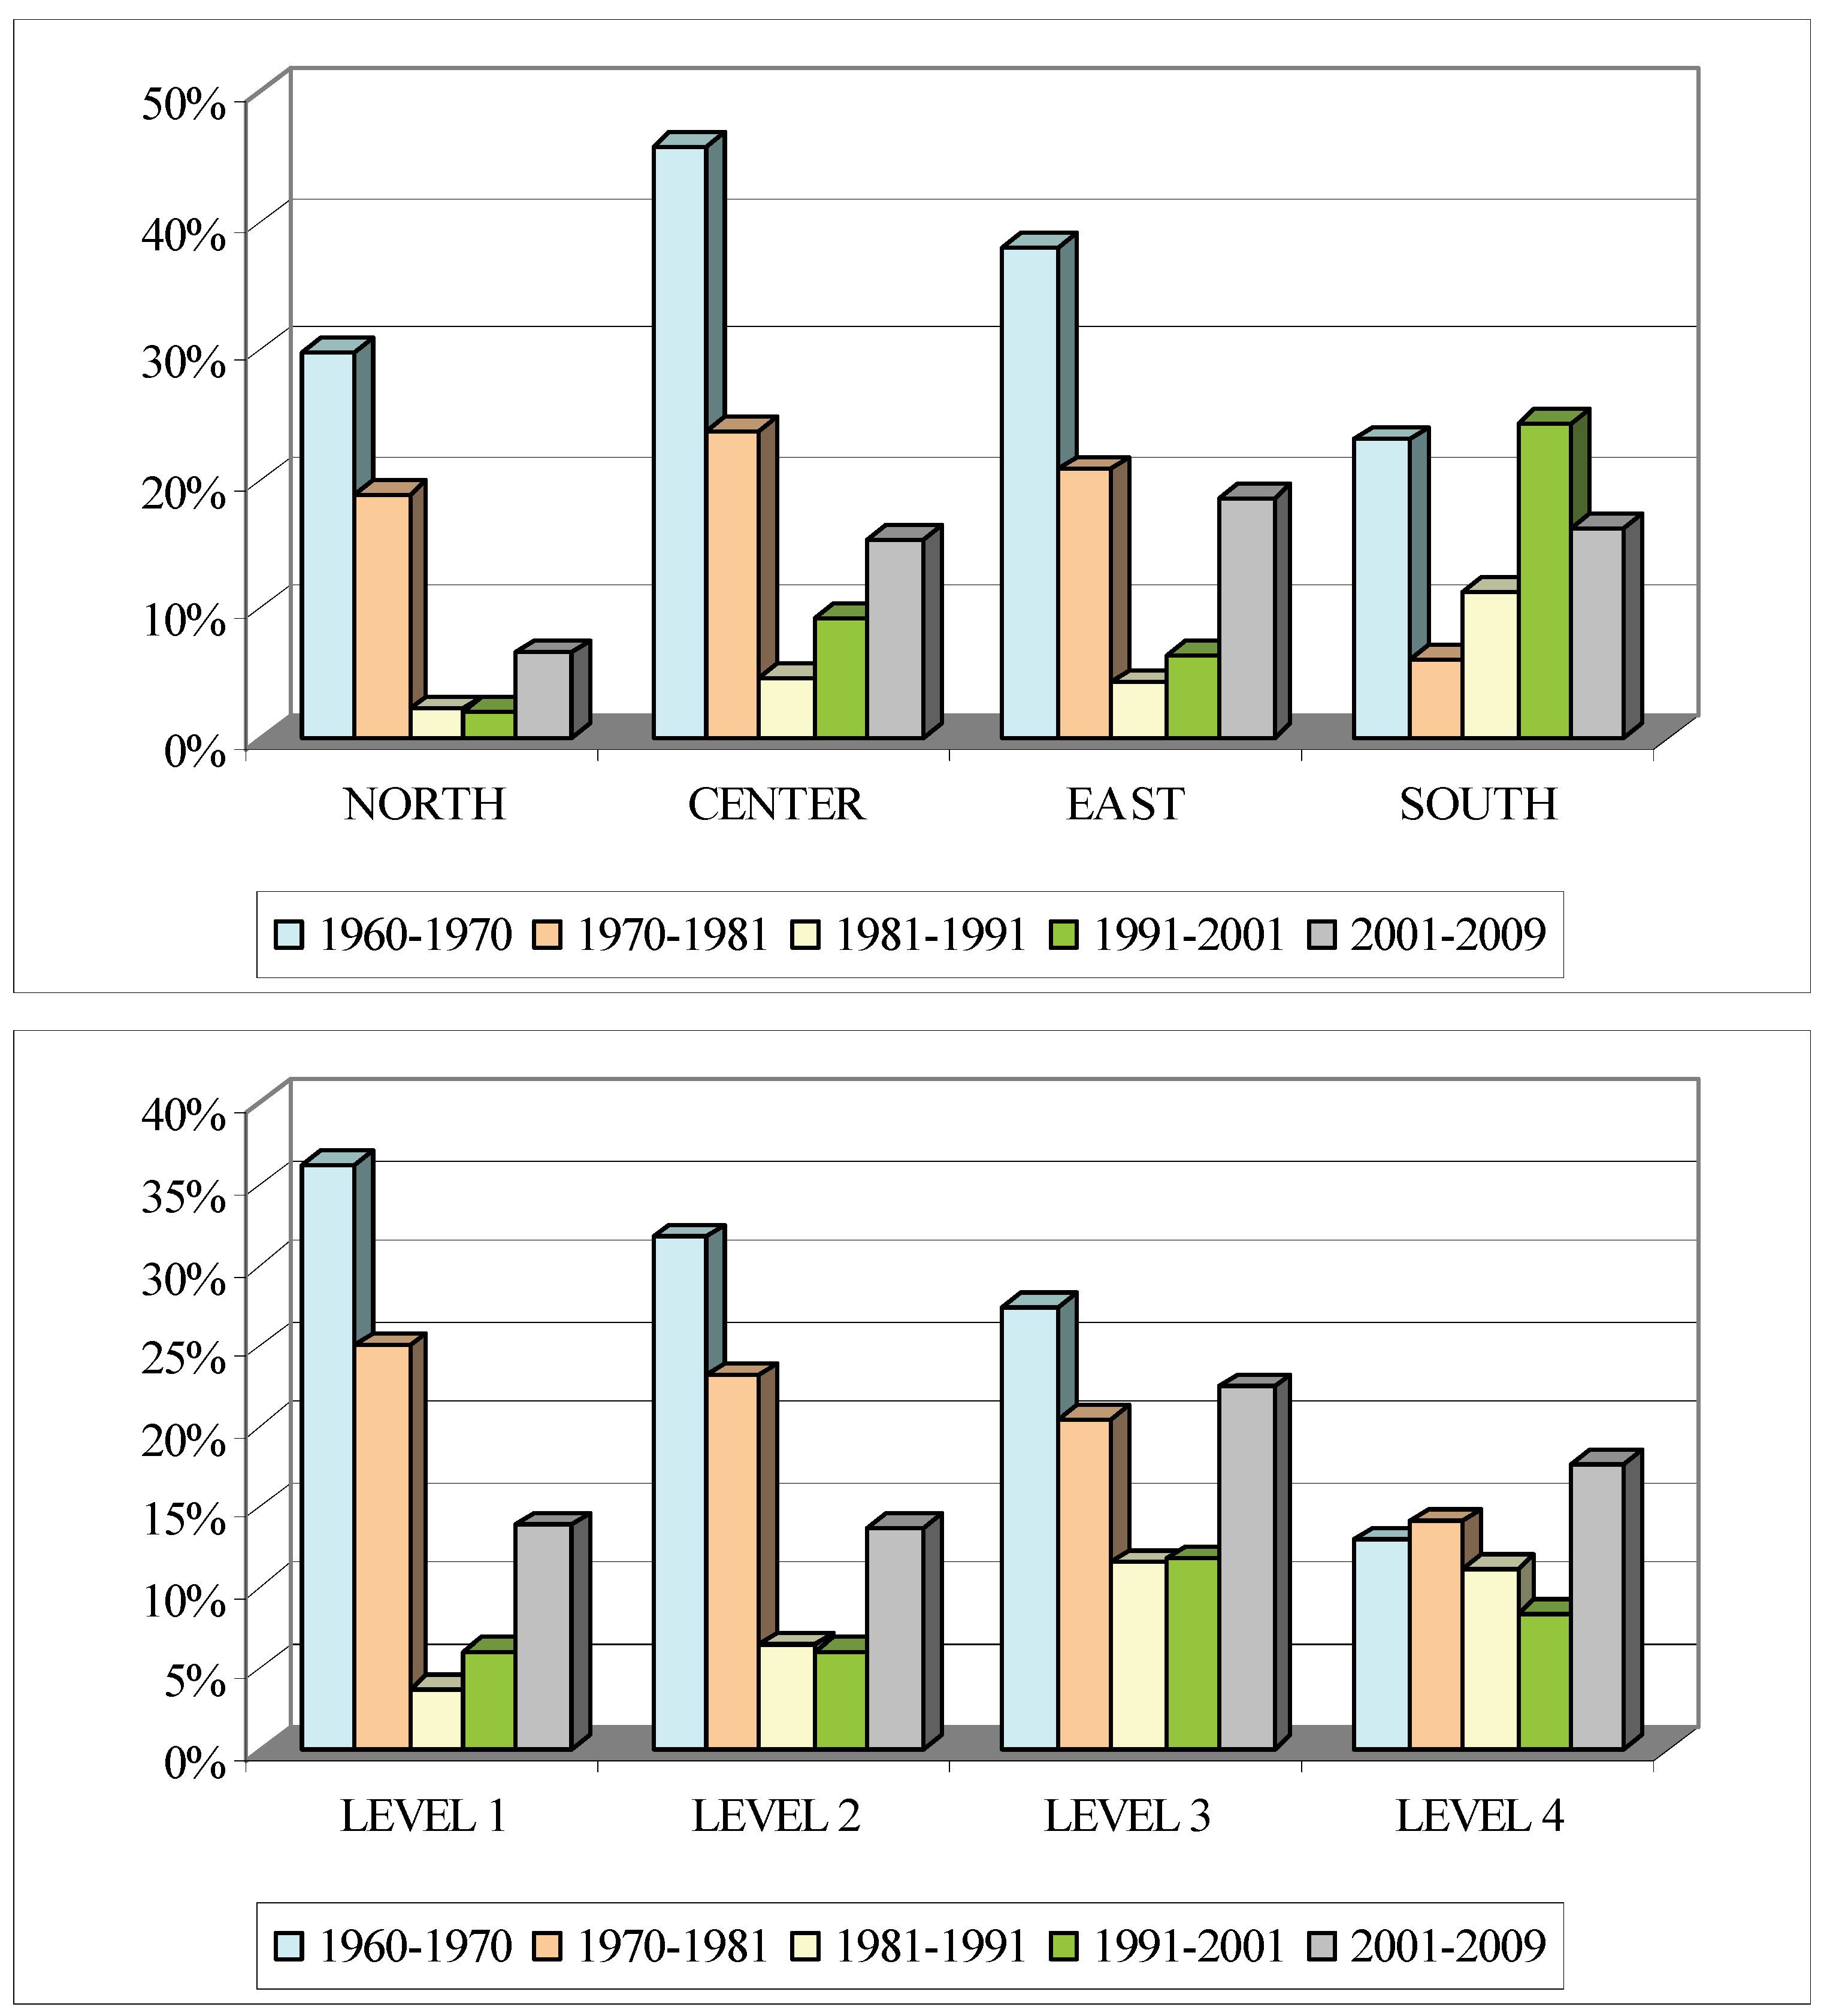
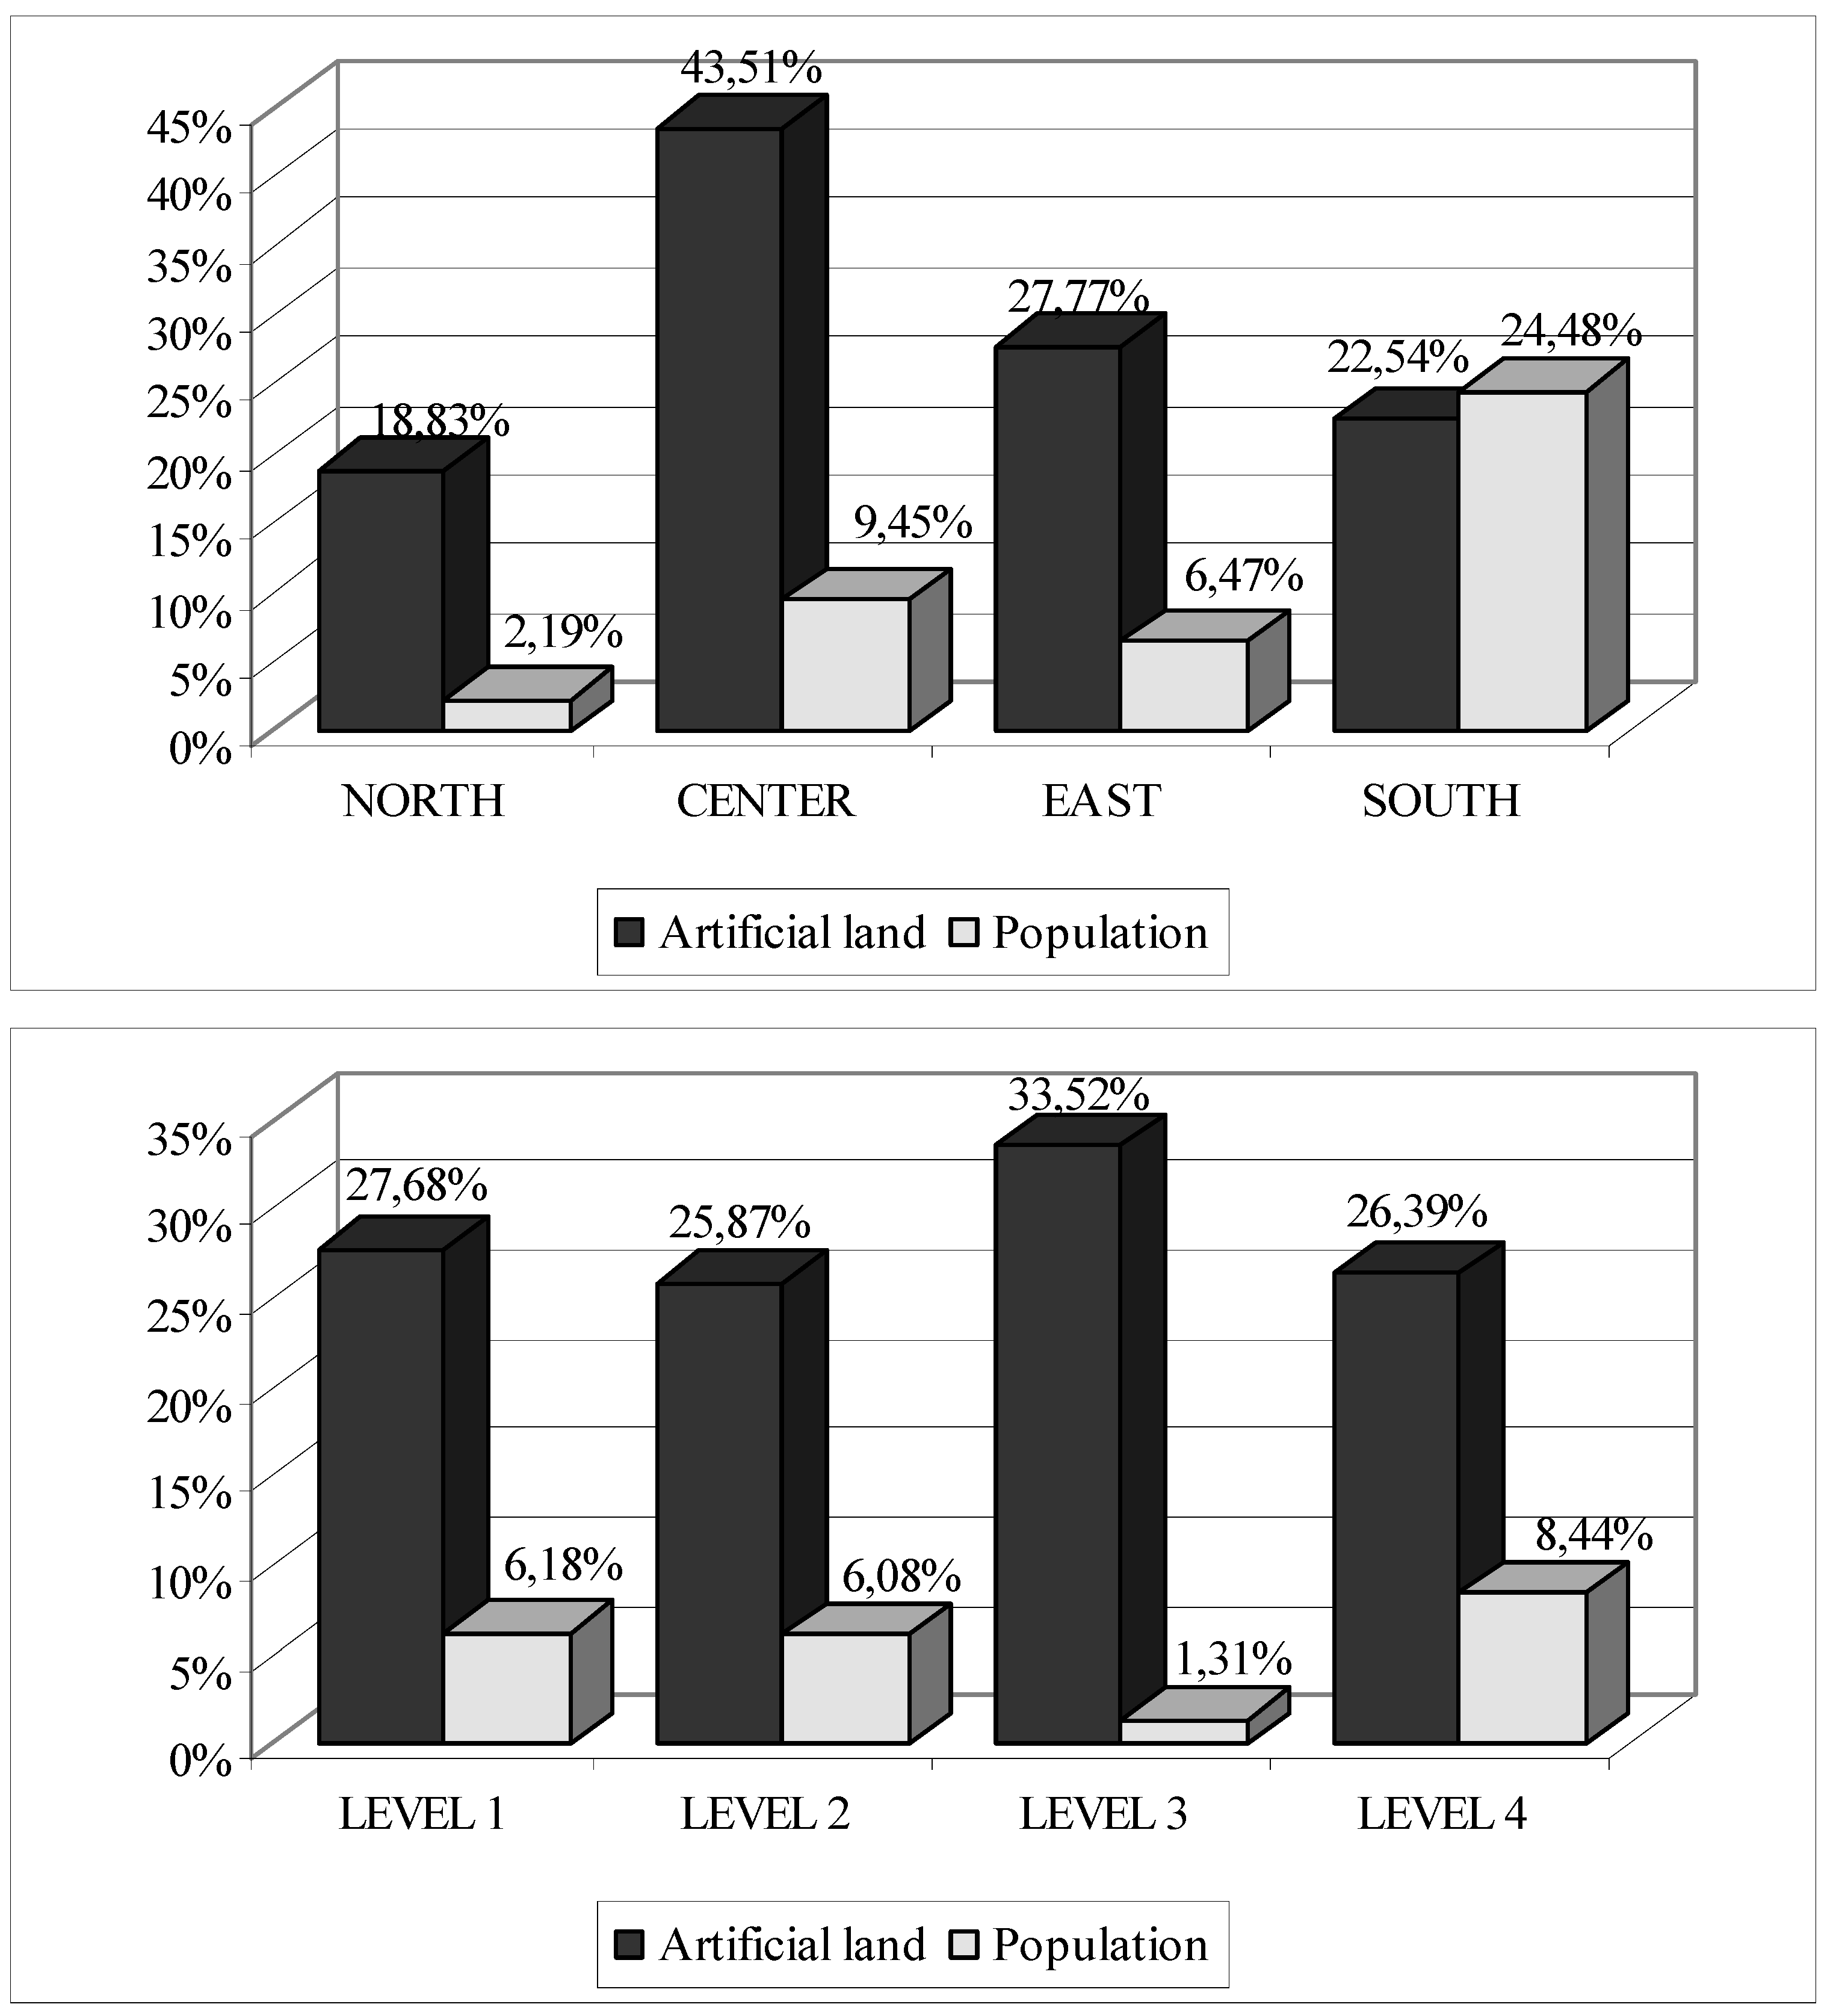
From the point of view of urban areas, the development of artificial land differs by macro-region according to the size of urban agglomerations. The first conclusion is that the relative growth of artificial spaces was much higher than the percentage of population growth between 1990 and 2000. By macro-region, growth in the Center stood out, because of the expansion of Madrid’s urban area (49.38%), as well as in the rest of this territory (34.84%). This may have been due to the combined action of two main processes: the extension of Madrid’s metropolitanization process over other small-sized urban areas located relatively close to the capital and the rising intra-regional inequalities in the regions on the Spanish plateau. Urban nuclei concentrated population, economic activity and infrastructure in these inland regions on the Spanish peninsula were characterized by depopulation, aging and the demographic crisis of rural areas. The urban areas in the East and South had growth rates of around 25%. The East macro-region was the most populous and home to two of the main developmental axes in Spain (the Ebro and the Mediterranean). These territories experienced high growth in artificial land, especially in coastal, tourism-based municipalities (
Figure 15), with the exception of Catalonia, which seemed to have entered a period of a certain containment of urbanization and urban sprawl in the light of municipal maps and as confirmed by specific studies [
37].
Figure 11.
Variation in artificial land between 1990 and 2000 by municipalities. Source: Ministerio de Vivienda
Atlas digital de las áreas urbanas de España [
17].
Figure 11.
Variation in artificial land between 1990 and 2000 by municipalities. Source: Ministerio de Vivienda
Atlas digital de las áreas urbanas de España [
17].
Figure 12.
Percentage of zones under construction compared with total artificial land by municipality in 2000. Source: Ministerio de Vivienda
Atlas digital de las áreas urbanas de España [
17].
Figure 12.
Percentage of zones under construction compared with total artificial land by municipality in 2000. Source: Ministerio de Vivienda
Atlas digital de las áreas urbanas de España [
17].
Figure 13.
Percentage of free-standing developments and/or those with gardens with respect to artificial surface by municipality in 2000. Source: Ministerio de Vivienda
Atlas digital de las áreas urbanas de España [
17].
Figure 13.
Percentage of free-standing developments and/or those with gardens with respect to artificial surface by municipality in 2000. Source: Ministerio de Vivienda
Atlas digital de las áreas urbanas de España [
17].
Figure 14.
Density of second homes (houses/km²) by municipality in 2000. Source: Ministerio de Vivienda
Atlas digital de las áreas urbanas de España [
17].
Figure 14.
Density of second homes (houses/km²) by municipality in 2000. Source: Ministerio de Vivienda
Atlas digital de las áreas urbanas de España [
17].
Figure 15.
Percentage of growth in artificial land surface (1990–2000) and population (1991–2001) in urban areas by macro-region and urban level. Source: Data from Ministerio de Vivienda
Atlas digital de las áreas urbanas de España [
17] and INE.
Figure 15.
Percentage of growth in artificial land surface (1990–2000) and population (1991–2001) in urban areas by macro-region and urban level. Source: Data from Ministerio de Vivienda
Atlas digital de las áreas urbanas de España [
17] and INE.
Lastly, the analysis by urban size leads to some interesting conclusions. The small urban areas in Level 3 (100,000–249,000 inhabitants) experienced the highest growth in artificial surface and paradoxically, the least growth in population. This may have been due to the spread of low-density cities, even in small and medium cities. Level 3 consists of a heterogeneous group of cities. However, there was a high representation of urban areas on the Mediterranean and Canary coasts that have been developed on the basis of specialising in tourism (Costa Blanca, Costa del Sol, Gran Canaria Sur, Tenerife Sur, Gandía, Torrevieja, Denia-Jávea, and Valle de la Orotava).
Although residential production has already been discussed in the previous section, we conclude this section with an analysis of housing prices by region. This is better suited to the current section because of its relationship with the urbanization process and with the changes in land use. It is not possible to draw a comprehensive map of land prices at the municipal level because many Spanish municipalities do not have official data. However, on the basis of regional and provincial statistics, we conclude that the highest spike in housing prices occurred in the regions with the highest percentage of artificial surfaces and the highest increase in residential housing stock, with the exception of the Basque Country. All these facts corroborate the importance of land’s speculative value during the “Spanish economic miracle”.
To reach this conclusion, we drew up a table with the prices of total private homes (€/m²) on three important dates: the first quarter of 1995 (immediately preceding the onset of the housing bubble), the first quarter of 2008 (when housing prices were highest in Spain) and the fourth quarter of 2009 (the latest data, from when the bubble collapsed and prices slumped.) By 2008, all the regions surpassed the average of 1,000 €/m², whereas only Madrid had reached this figure in 1995. Between 1995 and 2008, there was a shift in the highest prices from the northern regions (the Basque Country, Cantabria)—urban network spaces with a dense and complex industrial origin—towards the Mediterranean, currently the main axis of development in Spain with a diversified economy and important levels of tourism. The highest relative increases between these dates took place precisely in the Mediterranean regions—those regions that specialized in tourism and which have the fastest growth in artificial surface along with very dynamic real estate sectors—primarily the Balearic Islands, Murcia, Valencia and Andalusia. From 2008 on, the slump in prices has been notable across all regions. However, this still has not offset the rising prices of the residential boom, as can be seen in the percentage of variation in prices between early 1995 and late 2009 (
Table 3).
Table 3.
Evolution in the price of private homes (€/m²) and variation of artificial land by region.
Table 3.
Evolution in the price of private homes (€/m²) and variation of artificial land by region.
| | 1st quarter 1995 (A) | 1st quarter 2008 (B) | 4th quarter 2009 (C) | % variation A/B | % variation B/C | % variation A/C | % artificial land (1990–2000) |
|---|
| Andalusia | 513.4 | 1,800.2 | 1,613.8 | 250.64 | –10.35 | 214.33 | 28.33 |
| C. of Valencia | 479.2 | 1,684.6 | 1,505.7 | 25154 | –10.61 | 214.21 | 52.13 |
| Extremadura | 394.7 | 1,027.0 | 1,001.9 | 160.19 | –2.44 | 153.83 | 28.36 |
| Galicia | 584.5 | 1,571.7 | 1,467.8 | 168.89 | –6.61 | 151.12 | 20.14 |
| Madrid | 1,078.4 | 3,004.8 | 2,620.0 | 178.63 | –12.80 | 142.95 | 46.86 |
| Murcia | 425.9 | 1,614.3 | 1,351.1 | 279.03 | –16.30 | 217.23 | 62.77 |
| Navarre | 722.8 | 1,751.9 | 1,623.3 | 142.37 | –7.34 | 124.58 | 46.33 |
| The Basque Country | 926.5 | 3,035.8 | 2,738.0 | 227.66 | –9.80 | 195.52 | 13.03 |
| Rioja | 588.6 | 1,644.2 | 1,532.3 | 179.34 | –6.80 | 160.32 | 13.20 |
| Ceuta | - | 1,669.0 | 1,855.0 | - | 11.14 | - | 0.00 |
| Melilla | - | 1,669.0 | 1,570.6 | - | –.89 | - | 19.92 |
| Aragon | 573.6 | 1,962.9 | 1,726.4 | 242.20 | –12.04 | 200.97 | 20.69 |
| Asturias | 657.9 | 1,775.9 | 1,600.7 | 169.93 | –9.86 | 143.30 | 25.25 |
| Balearic Islands | 586.0 | 2,408.1 | 2,125.8 | 310.93 | –11.72 | 262.76 | 35.62 |
| Canary Islands | 572.4 | 1,833.3 | 1,613.5 | 220.28 | –11.98 | 181.88 | 8.41 |
| Cantabria | 750.0 | 2,035.6 | 1,798.7 | 171.41 | –11.63 | 139.82 | 22.48 |
| Castile-La Mancha | 505.3 | 1,447.5 | 1,238.6 | 186.46 | –14.43 | 145.12 | 32.31 |
| Castile-Leon | 616.9 | 1,522.5 | 1,388.6 | 146.79 | –8.79 | 125.09 | 32.31 |
| Catalonia | 735.0 | 2,457.6 | 2,286.0 | 234.36 | –6.98 | 211.02 | 12.55 |
In short, the real estate sector was at the center of the debate during the stage of robust economic growth, to the point where it produced a housing bubble. The housing sector is oversized and the model is exhausted. The effects of the speculative bubble have shown it to be clearly unsustainable with irreversible consequences for the entire territory in general and for the ever-growing, less dense, and predictably more segregated urban areas in particular. Reconversion is needed along with urban return; the compact city and rehabilitation are opportunities within the current context of the economic crisis.


