Article

Energy Information Augmented Community-Based Energy Reduction

1
University of Dayton, Department of Mechanical Engineering, Dayton, OH 45469, USA
2
University of Dayton, Department of Management Information Systems, Dayton, OH 45469, USA
3
Energize Clinton County, 6 N South St., Wilmington, OH 45177, USA
4
Oakwood High School, 20 Rubicon Road, Dayton, OH 45409, USA
*
Author to whom correspondence should be addressed.
Sustainability 2012, 4(7), 1371-1396; https://doi.org/10.3390/su4071371
Submission received: 9 May 2012 / Revised: 8 June 2012 / Accepted: 14 June 2012 / Published: 25 June 2012

Abstract

:
More than one-half of all U.S. states have instituted energy efficiency mandates requiring utilities to reduce energy use. To achieve these goals, utilities have been permitted rate structures to help them incentivize energy reduction projects. This strategy is proving to be only modestly successful in stemming energy consumption growth. By the same token, community energy reduction programs have achieved moderate to very significant energy reduction. The research described here offers an important tool to strengthen the community energy reduction efforts—by providing such efforts energy information tailored to the energy use patterns of each building occupant. The information provided most importantly helps each individual energy customer understand their potential for energy savings and what reduction measures are most important to them. This information can be leveraged by the leading community organization to prompt greater action in its community. A number of case studies of this model are shown. Early results are promising.

Graphical Abstract

1. Introduction

As of September 2011, 24 of 50 U.S. states had adopted Energy Efficiency Resource Standards (EERS). Four others had pending regulations. Four others have established energy efficiency goals, but on a voluntary basis. These standards range from Texas’ very aggressive 25% reduction by 2012 and 30% by 2013 and beyond to Massachusetts’ 2.4% reduction by 2012. Most typically, the energy reduction requirements range from 10–20% by 2020 or so [1].
Additionally, specific to residential and commercial buildings, the U.S. Department of Energy has established aggressive goals for energy reduction in the U.S. building stock. The Energy Independence and Security Act of 2007 [2] established energy management goals and requirements while also amending portions of the National Energy Conservation Policy Act [3]. Addressing only federal buildings, a mandate of 30% reduction by 2015 was established. For the nation as a whole, the Department of Energy has established 35% energy reduction (33% reduction in fossil fuels) by 2030 [4].
Finally, the 2007 U.N. Intergovernmental Panel on Climate Change’s “Fourth Assessment Report” presented worldwide greenhouse gas reduction targets of 40–90% to stave off what could be perilous climate change [5]. With residential and commercial buildings accounting for roughly 40% of the greenhouse gas production in the U.S., it is clear that reaching such targets will be impossible without significant energy reduction in the building energy sector [6]. To date, the energy utilities have been tasked with achieving theses mandates mentioned above. Web-based energy reduction education, mailer pamphlets, energy audits, and a myriad of rebate incentives have been the primary vehicles for achieving targets. While utilities may have real interest in energy reduction to counteract issues associated with growing power production due to increasing construction costs and uncertainty of cost-recovery for new generation in particular, there is still concern within utilities that spending on energy efficiency programs has a detrimental effect on revenues, by reducing sales of the utility’s core product, electricity or gas. The reasoning is straightforward: while a utility’s variable costs change in proportion to sales volume, fixed costs associated with distribution and customer services do not. Therefore, a reduction in sales due to efficiency improvements leads to a reduction in revenue that is larger than the costs avoided. This net lost revenue affects the utility’s balance sheet, reducing the return to its investors and providing a strong incentive for utilities not to invest in programs that help their customers use energy more efficiently [7].
To mitigate this inherent conflict, some state public utility commissions have allowed investor-owned utilities to adopt rate mechanisms that break the link between sales and revenue. This decoupling theoretically enables utilities to promote energy efficiency, while establishing rate structures which permit full recovery of the utility’s revenue requirement [8]. However, this decoupling often does not work. Decoupling works only when the rate of return for the utility is on the same order as the cost of capital. In this case, utilities can opt for either energy sales growth or energy efficiency without loss of revenue. If rates of return are set higher than a utility’s capital cost, increasing investment scale will have primary impact on the utility’s profit. Energy efficiency in this case is deemed counterproductive to revenue generation [9]. Even in the best decoupling scenario, utilities are unlikely to aggressively and innovatively pursue energy reduction. Blanket rebates offered to an entire customer base—the most common energy reduction strategy adopted by utilities—is in general marginally effective at driving adoption of new technologies or energy reduction measures [10]. However, there have been some utility-driven energy reduction successes. A 2008 ACEEE report chronicling exemplary energy efficiency programs reports annual energy savings for the best utility programs of 2,400 GWh. Assuming a $0.10/kWh price of electricity, these savings translate to $240M. The cost to achieve the energy reduction through utility incentives among these exemplary programs was $740M [11]. California municipal utilities reported savings of 523 million kWh from an energy efficient appliances initiative. This came at a cost to the utilities of $123M to yield $2.2B in new appliance purchases [12]. However, as noted by York et al., there are many utilities which have not been effective or are just entering the ‘fray’ who may not be as equipped to effectively administer similar programs [11].
McKenzie-Mohr and Smith offer a critique of the energy reduction strategies most often utilized by utilities [13]. These approaches nearly always seek to educate building occupants about how they might save energy or appeal to their economic self-interest. A number of cases are presented which show the ineffectiveness of this approach. For example, Geller evaluated the impact of intensive three-hour residential energy reduction education on a target group of 40. While all attendees noted improved awareness at the end of the program and even a willingness to change, almost none of them acted on the suggestions made to them [14]. Similarly, telling all energy customers through a media campaign or mailings that they can save energy by purchasing a more efficient refrigerator does not gain much traction [13]. However, when the utility programs exploit what McKenzie-Mohr and Smith term Community Based Social Marketing, they seem to find greater success in achieving reduction. This approach above all is designed to first understand why building occupants/owners do not act and then develop a program seeking to overcome the noted barriers. Central to this approach is gaining community buy-in [13].
It is not surprising that some community energy reduction programs have achieved remarkable success. The assumption is that when energy customers already have a relationship with and trust in an organization working to advance energy reduction within their community, the energy customers will be more likely to act. A very recent effort by NESTA, an English Innovation NGO, shows some startling results from an approach they termed mass localism. Their Big Green Challenge, offered competitive financial awards to individual community organizations to advance innovative climate reduction initiatives. The winning communities achieved reductions in CO2 of 10–32% in less than a two-year period. Such reductions far exceed these of utility managed energy reduction programs [15].
The research question posed in this study is “Can community energy reduction programs achieve better success by providing organizations customized energy reduction information for their community members?” The value of energy information is clear. For example, McAlley provides a recent example of energy reduction realized by providing building occupants with information about their energy usage. They showed that building owners who understood their lack of effectiveness in using energy could be motivated toward energy reduction [16]. For the industrial sector, Kissock and Eger have shown that economics driven recommendations specific to a client can achieve significant action. They report adoption of recommended measures of over 50% yielding annual energy savings of over $110,000/year from single one-day energy assessments [17]. Additionally, a Seattle-based study reported by Penrith shows audit to action conversion rates of over 50% for over 5000 homes evaluated. In this program, an Energy Performance Score is assigned to a residence very quickly. Those residences with poor scores, and thus more opportunity for savings, are targeted for on-site energy audits producing specific recommendations for actions [18].
In this context, our research effort emerged, beginning with a contracted utility demand reduction program which involved the authors. In the early stages of the program, it was very difficult to interest building owners, targeted as energy reduction priorities within the utility’s entire customer base for energy reduction, to permit us to visit their building in order to conduct a free detailed energy assessment which would surely yield cost-effective energy reduction. Only when we linked to already strong community organizations, did the program achieve success. This observation effectively provided direction for research and helped to inform the model which is posed later. The following section describes the methodology for developing community-scale energy information for each building occupant.

2. Review of Community-Based Energy Systems

2.1. Community Partnerships and Roles

Over the previous decade, community action has been identified as an essential strategy in tackling climate change has informed academic inquiry, government policy, and grassroots action [19]. Mulugetta, Jackson, and Van Der Horst [20] suggest that technology provides a crucial impact on solving the climate challenge, but the importance of local and community level plans as channels for altering the society–energy relations should not be discounted. More local and community level schemes would help to deepen our grasp about the advantages associated with low carbon way of life and means of employing people’s creative capabilities. Grunwald [21] suggests that technology programs are not a solution for gaining community action unless they are rooted in community development processes, where the importance is placed not on what the technology can do, but on how the technology can be utilized to meet community needs. Furthermore, the intent of programs should focus on plans that cultivate social inclusion, organize community support for achieving community goals, and thereby ‘multiply’ the existing community resources [22]. For example, it was found that community ownership leads to greater public acceptance of wind farms [23].
In another study, Rogers, Simmons, Convery, and Weatherall [24], found widespread support for local use and generation of renewable energy; respondents expected conservation of natural resources and increased community spirit as benefits from the project. However, the desire for vigorous involvement was lower since residents saw themselves as consultees, instead of project leaders. Rogers et al. [24] suggest that community renewable energy endeavors are not likely to become extensive without greater formal support. This formal support can come from third sector groups. For example, Preston, White, Lloyd-Prince, and Anderson [25] suggest that third sector groups that offer a supportive role to community groups should concentrate on encouraging self-sufficiency, facilitation, and empowering communities to act alone. Furthermore, the external help provided to community groups needs to be adapted to the needs and nature of the group, and this is liable to demand a very informal method to replicate their structure.
Trier and Maiboroda [26] describe a case study whereby a village partnered with other agencies to explore avenues to more sustainable living. The roles of the central participants in this community development and sustainability program were agreed to by all contributors: Westden (a charity promoting sustainability) as a coordinator of the early stages, the villagers as the central owners and decision makers in the development process and the Center for Sustainable Futures (CSF) at the University of Plymouth as the contributor to, and monitor of, the process via research and other expertise.
The role of the individual cannot be downplayed. For example, research to date by Moloney, Horne, and Fien [27] reveals that a wide-ranging socio-technical context that includes both individual psychological factors as well as the systems, standards and norms under which individuals operate is fundamental to the development of successful strategies to shift towards low carbon communities. Similarly, Heiskanen et al., [28] examine how different communities reframe problems on the individual level to reduce carbon emissions. Mulugetta, Jackson, and Van Der Horst [20] argue that local and community level energy reduction programs provide a number of benefits. Most importantly, they enable individuals to get involved with communities via energy reduction programs. After all, behavioral changes at the individual level are required for true energy reduction to be realized throughout a community. Thus, our case studies demonstrate the importance of an outside agency managing a community’s energy information, a leading community group or groups, and individuals (i.e., home owners or building occupants) within a community working in concert toward the goal of energy reduction for a community.

2.2. Case Studies and Definitions

It is common in the community-based energy systems literature to illustrate energy conservation and alternative use principles via case studies. For example, Heiskanen et al., [28] examined how different communities reframe problems on the individual level to reduce carbon emissions via four case studies. Other examples include Devine-Wright and Devine-Wright’s [29] and Warren and McFadyen’s [23] case studies. The current paper is consistent with this approach and utilizes five case studies as examples to demonstrate some of the principles associated with community-based energy reduction programs.
Finally, most community energy based papers do not formally define their use of the term “community”. Instead, they merely imply the meaning of the term. For example, Owens & Driffill’s [30] work implies that communities they describe are ones that are serviced by local government authorities. Trier and Mailboroda [26] refer to an “affluent” community that has had a hard time trying to engage people to change their lifestyle, but again no formal definition is offered. However, Heiskanen et al. [28] briefly describe community types, namely: sector-based; interest-based; smart mob, and geographical. Others infer a geographically based community type as well. For instance, Devine-Wright and Devine-Wright’s [29] case studies, labeled “community case studies”, all involved small towns or villages. Similarly, Warren and McFadyen’s [23] case studies are partially based on an island community. Our definition of community falls into this “geographic” camp and so we define the communities described in our case studies outlined in section 4 as geographically based.
The paper will next outline the process of deriving customized energy information and apply it through the community organization promoting energy reduction programs and then discuss the five case studies that illustrate this process.

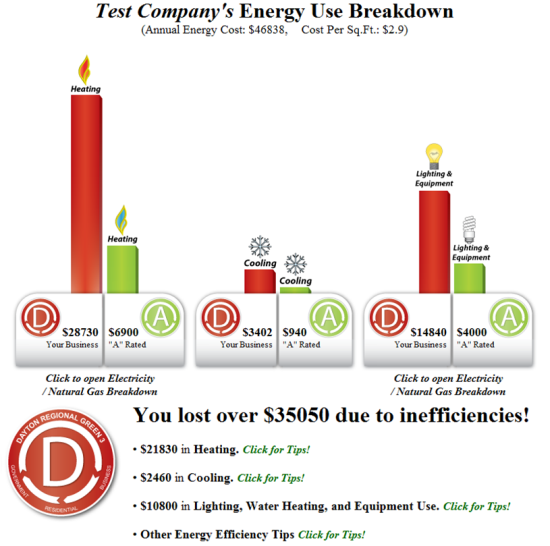
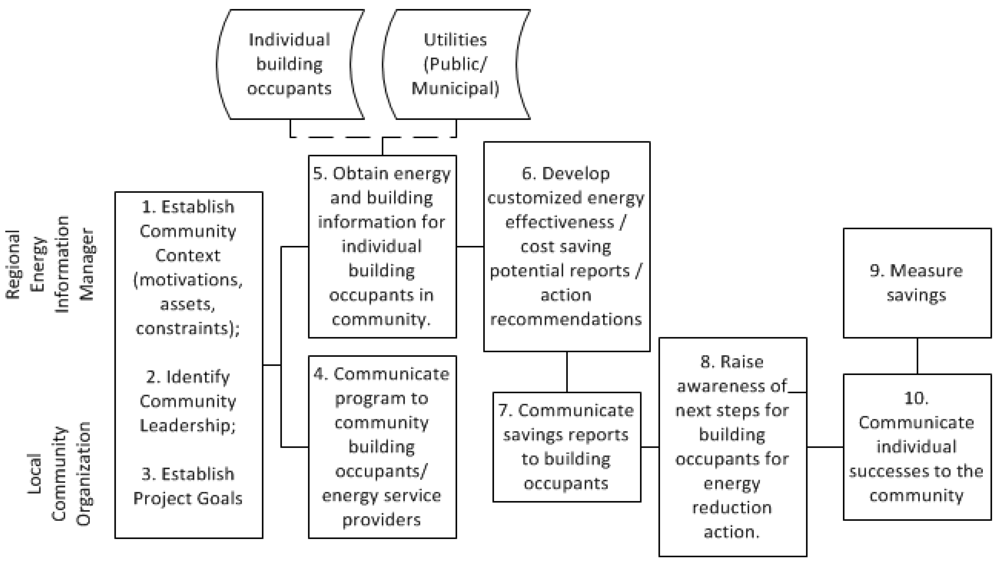
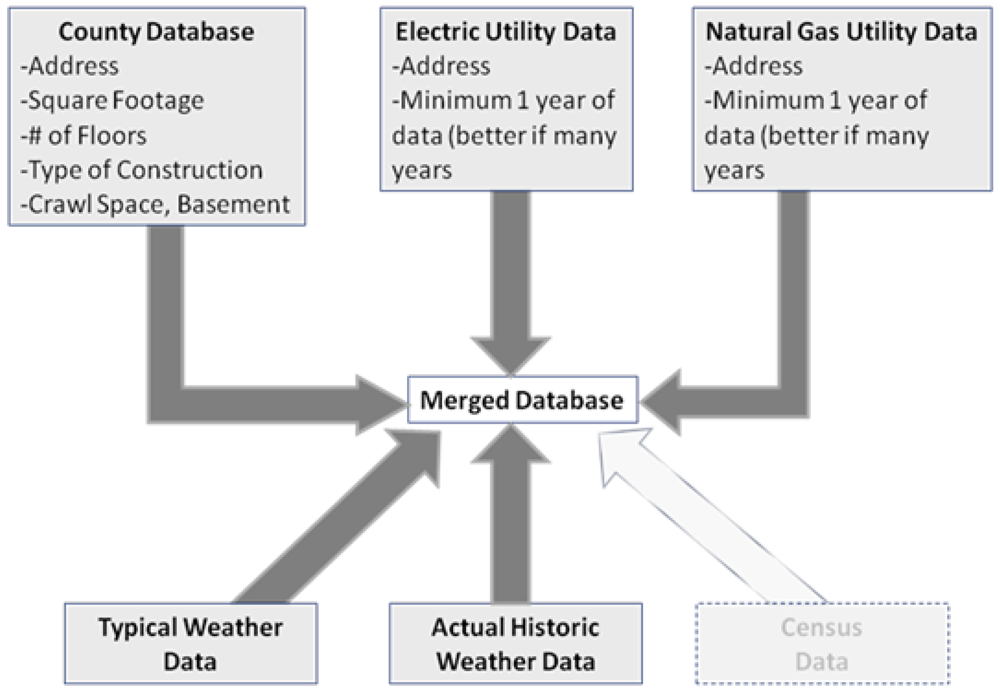
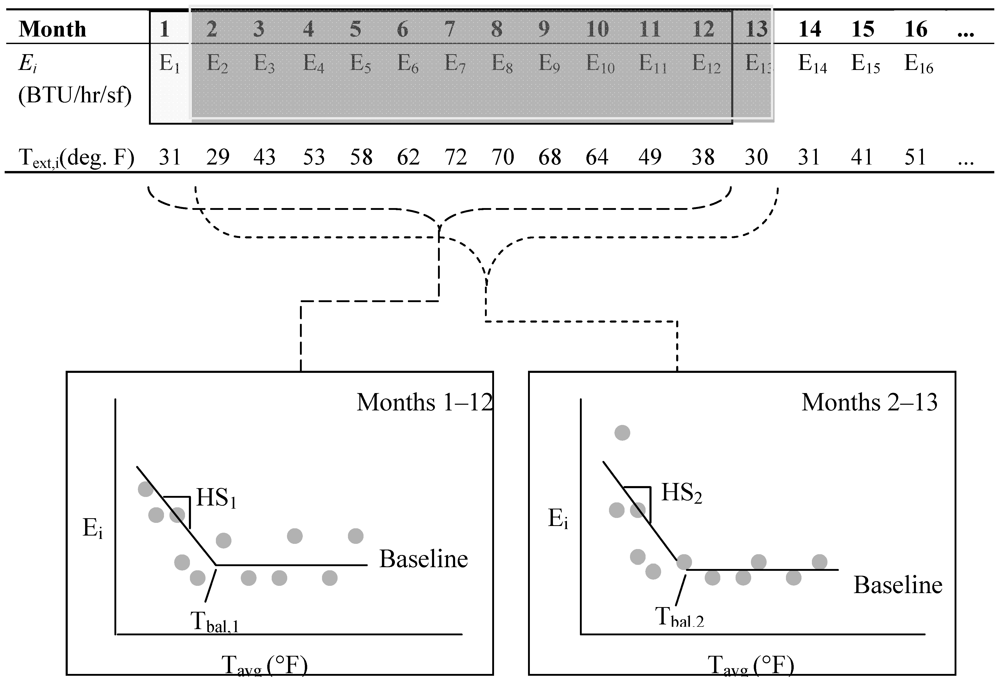
3. Community-Scale Customized Energy Information

Generic information about how to save energy does not seem to spur significant action. Building occupants are given many possible actions, but often little guidance about what to do first, second, third, and so on. Moreover, they have little understanding of how much they can save. Customized information for each building occupant is essential. This section describes the community-scale energy information developed for each building occupant, based upon their distinctive energy use, building, occupancy, and weather conditions. This information developed here rates the energy effectiveness of individual users, identifies changes which may have occurred over time, and assesses the potential energy savings available to a building occupant.
Figure 1 describes the process required to develop this information and as well advance it through the community organization advancing the energy reduction program through the community. Simply put, this process engages two entities—the regional energy information manager and the community organization. The regional energy information manager is responsible for data collection, analysis of the data to create useful energy information for each building occupant, and developing an understandable presentation of the information to building occupants. The community organization is responsible for engaging the community in the program, soliciting the needed data from individuals within the community, delivering the information to community members, and highlighting success in the community to nudge greater participation on the part of individual households and firms.
Figure 1. Community energy reduction process.
Sustainability 04 01371 g001
Most critical for the regional energy information manager is access to data for each building, including: building data (particularly size and use type), weather data, energy data, and census data (number of people and hours of operation). Greatest success is likely achieved if publicly available data is used; although improved information can be developed with further input from individual building occupants. Reliance upon publicly available information translates to a model which can be applied inexpensively and openly anywhere in the country. Figure 2 illustrates the data which can be used. County real estate CAMA or GIS building databases are relied upon to gain information about every residence and building in a community. Available data typically includes: square footage; number of floors; height of floors; building use type, whether residential or commercial (office, school, medical building, restaurant, etc…); construction type; heating energy source; ground coupling (basement, slab, etc…); and for residences number of rooms, number of bedrooms, and number of bathrooms. Weather data used includes actual hourly/daily ambient weather data [31], and typical year hourly weather data [32].
Figure 2. Data employed to construct customized energy savings reports.
Sustainability 04 01371 g002
Gaining access to energy data is difficult in the United States, as the security of such data is protected for a variety of reasons. Basically there are two pathways for accessing this data. The first and best is through partnership with the local utilities, where the utility provides the regional energy information manager individual building energy data. This option is only possible if: (i) the regional energy information manager is contracted by the utility to help with energy reduction, or (ii) the utility is a municipal utility. In the first case, the contractual relationship between the utility and the energy information manager insures the same security of the energy data as provided by the utility itself. In the second case, the utility data is publicly accessible—however, the municipal utility will almost certainly establish a contract to insure data security.
The second option is to gain access to the utility data directly from a building occupant. This can be done by getting consent from a building occupant to access their energy data from their utility or from the building occupant providing their energy data directly to the regional energy information manager. In either event, in order for community-scale viability, this process has to be web-based. While direct contract with a utility is preferred, this second option may actually compliment community energy reduction programs, as the data gathering act can serve as the introduction of the project to the community by the leading community organization.
The information process first requires both electric and natural gas (if applicable) energy data for any building to be normalized by dividing by the square footage. Doing so enables much better comparison to available benchmarks for the buildings. Also, the energy use data for a particular month is divided by the number of hours in the previous month metering period to produce for each month the average electrical power (kW/sf) from electric utility data and average natural gas power (BTU/hr/sf) from the available natural gas data, if applicable.
Finally, in order to extract as much information from the energy data as possible, e.g., actual energy use, data is disaggregated into weather-dependent and weather-independent energy use by applying two different regressions of monthly power flux (power per square foot) to actual outdoor temperature. The disaggregation approach employs statistical regressions of electric and gas energy use relative to outdoor air temperature [33]. Further details are provided in the appendix.
With energy use disaggregated into the various energy categories, the next step is benchmark energy use against what would be typical for the specific use type of the building for peer energy users within the community. This benchmarking can be based upon comparison to like buildings in the community, or based upon a comparison to national benchmarks. For the U.S., the relevant benchmarks are the Commercial Building Energy Consumption Survey—CBECS [34] and Residential Energy Consumption Survey—RECS [35].
Lastly, a comparison of the disaggregated building occupant energy use in the each energy category to the appropriate benchmarks permits the establishment of a building energy savings or home energy grade.
Overall, the essential information provided to building occupants includes:
  • An overall grade or rating which notes how the building occupant is doing relative to others in their community;
  • Some explanation about how this grade is assessed;
  • A comparison of the disaggregated energy use (heating, cooling, baseline electric and baseline gas –if applicable) to typical energy use to help the building occupant appreciate where they have the most potential for energy savings;
  • Suggestions for actions they can do immediately to reduce energy based upon their actual use; and
  • Clear directions for next steps to advance energy reduction in their home or building.

4. Application of Energy Information to Community Energy Reduction Case Studies

This section presents five diverse case studies of this approach considered to date, specifically describing how the process steps have been applied to these cases. Sample applications of each process step are detailed to show the appropriateness of the approach to the diverse communities considered. In all cases, a local university building energy center group has served as the energy information management organization. In this role, the community organizations were either sought or this center was approached by organizations who had heard about the work being coordinated by the center. In all cases, the community organization was responsible for establishing goals for the program and for communications with their constituents. The focus of the energy information manager (based at a local university) was to collect energy and building data and then to develop customized energy information for each building occupant within the leading community organization’s constituency. The community organization was responsible for delivering the information to the individual building occupants.
As mentioned above, our definition of communities is geographically based, (i.e., a village, a rural town, a student residential area, a residential city, and a multi-county region). This definition however is insufficient to properly describe the communities selected for our study. The coherence of a community is critical. For instance, Trier et al. suggest that the community members should have interactions with each other through involvement in clubs and organizations [26]. Gubbins observes that communities must have opportunities to come together and that space is very important. He observes that the use of community buildings can create a virtuous circle of use [36]. Furthermore, Moraes, Szmigin, and Carrigan suggest that a sense of community is fostered over time through common engagements in boycotts, voicing of concerns, and “buycotts” [37]. The notion of buying local is seen as a source of pride for a community. Also, newsletters, flyers, community websites, and life-story narratives are used as ways of maintaining communities [38]. Finally, Devine-Wright et al., refer to a process of social identification (i.e., feelings of pride and belonging in the local community) which leads to enhanced coherence [39].
Lastly, another way to maintain community can be developed through coalescence around common goals. Ebi and Semenza [40] suggest that it is possible to strengthen a community’s social capital [41] and even create a community via encouragement of collective action on climate change.
Table 1 provides an overview of the case studies investigated. Included is a description of the community group and program emphasis, and the community context. The community context includes elements of how the community coheres and is maintained. The community organizations have included governmental and non-governmental organizations, as well as a school system. The motivations of these organizations are quite different, with some of the communities motivated by a desire to live more sustainably, with others motivated to save money, and another motivated mainly to support the education of students in the community. The coherence of these communities is also quite different. The university student residential community (case 3) is strongly connected. The student led project captured the attention of most students. The small suburban village (case 1) and rural town (case 2) populations were not quite as closely bound as the student residential group, yet fairly strong, compared to the other communities considered, particularly given that the community organizations leading the efforts had significant visibility in their communities. At the other end of the spectrum, the effort led by a regional sustainability non-governmental organization calls as its community the populace in eight surrounding counties. There is little hope of their actions becoming a source of talk in all of the coffee shops in the region serviced by this district. Further, the leading organization is in its infancy and thus has little recognition by their community. For this case, the energy reduction project is a means to improve visibility in the community.
The source of energy data for these constituencies was a mix of utility provided data, web data entry by occupants, and user supplied data. Table 2 summarizes the source of energy data for each of the programs. In case 1, for the small suburban residential energy reduction project, the village itself serves as the municipal utility for electric data, but is serviced by a regional natural gas utility. Access to three years of electric energy data was provided after the energy information manager signed a nondisclosure agreement. The natural gas utility however required written consent forms signed by each interested customer to release monthly natural gas data. While this slowed the process, this latter requirement offered the leading community group (village appointed Energy Board) an opportunity to advertise the program to residents.
Table 1. Community energy reduction programs tested.
Community Organization/ProjectCommunity Context
1. Small suburban village volunteer Energy Board/residential energy reductionThis environmentally committed village, with roughly 2200 residences, has a long record of environmental commitment. Social resonance with energy reduction was guaranteed. The local government’s formation of an Energy Board in 2008 was in response to an effort by the utility provider to the village’s municipal utility to build a new coal power plant to service projected energy growth of theirs and surrounding villages and cities. The village refused to commit to future energy purchases from this energy provider if they built a new plant. They argued for energy reduction instead, a measure both of the community’s general commitment to lessening climate impact and the community’s relatively strong socio-economic position, as suggested by Moraes, Szmigin, and Carrigan [37]. The average age of the residential buildings in the city is 1950; thus there are serious impediments toward realizing deep community energy reduction. This community prides itself as a national leader in climate change and is thus very open to implementing a program which can enhance this position.
2. Small rural town economic development organization/commercial building energy reductionIn 2009 this small rural town with a population of nearly 13,000, experienced drastic economic devastation when the main employer in the town eliminated its headquarters located in the town, leaving nearly 8000 people unemployed. The social identification (i.e., feelings of pride and belonging in the local community) is very strong since the community’s members wish to remain where they live in spite of the relatively new economic reality, consistent with Devine-Wright et al. [39]. Further, the community is rural and very conservative. An economic message is much more suitable than an environmental one. Another constraint for change is the age of the housing within the community (roughly 1950) and the fact that 60% of the homes are rented. Lastly, the leading community organization has developed a nationally distinctive “Buy Local” campaign. Linking energy efficiency improvements to benefits of buying local offered promise for this program.
3. University student sustainability organization/residential energy reductionThis Midwestern U.S. university has an atypical residential living arrangement for its upper class students. It owns 550 homes (mostly ‘single-family’), all surrounding the campus. Occupancy of 5–6 students per house and square footage of 1500–1600 is typical. Student community for the more than 3000 students living in these houses is very strong. Socially, the housing area draws all students together from first through senior years and is a source of pride and connection among students, also consistent with Devine-Wright et al. [39]. Relative to energy cost, students are not responsible for paying utility bills. Rather, energy costs are factored into overall housing costs. As a result, there is zero financial incentive for energy reduction. Nevertheless, University students have an increasing commitment to remedying environmental concerns, with a reported 69% saying that a college’s sustainability position influences their college decision [37]. This Midwestern university student population has a similar interest in sustainability.
4. Small exurban high school/residential energy reductionThis primarily residential city has a housing population of over 4000, with an average age of 1945 and an average size in excess of 2500 sq.ft. It is highly affluent and busy. It values education and can be swayed by intellectual arguments for change. This community prides itself in making its voice heard by consistently passing school levies to support the educational system, which is a common engagement for this community, as suggested by Moraes, Szmigin, and Carrigan [37]. Because of its affluence, this community can afford to invest in energy reduction.
5. Regional sustainability organization/commercial building energy reductionThis community is strictly defined geographically, consisting of a multi-county region, including urban, suburban, and rural districts, with over 1 million people and nearly 50,000 commercial buildings. There is little coherence between community members. The multi-county group was developed to be the regional resource for environmental sustainability and energy conservation. Specifically, this organization was tasked to guide the region to: become more energy efficient, integrate sustainability principles into daily operations and benchmark results; develop a database for green standards; introduce sustainability culture into the community; reduce the region’s carbon footprint through energy efficiency; and arrange workshops, seminars, and presentations to businesses and the community. This sustainability initiative is only marginally familiar to the population. However, it offers a scale asset—the potential to reach over 2 million people
Table 2. Source of energy data for the respective community energy reduction projects.
Community OrganizationUtility Supplied Energy DataUser Supplied Data
1. Small suburban village volunteer Energy Board Energy Board worked to get municipal utility to release electric utility data.Residents provided one year’s worth of natural gas data to Energy Board. Have moved to web-based data entry.
2. Small rural town economic development organization Natural gas utility provided energy data via a contractual relationship with the energy information manager.Electric utility data provided by individual building occupants.
3. University student sustainability organization Utility data for each house delivered to university facilities organization and then to student group
4. Small exurban high school Delivery of utility bills to schools or to community grocery store
5. Regional sustainability organization Building occupants enter both building and one year of monthly energy data (gas and electric) on the web.
Case 2 concerned a commercial building energy reduction project for a rural town in southwest Ohio. This program was part of a contracted natural gas energy reduction project with the primary natural gas provider for southwest Ohio. Thus, natural gas monthly energy data (6 years) was made available by this utility. Electric utility data in this case was not available (at the time). Again, the absence of electric utility data was actually a benefit to the program, as it dictated the need by the leading community organization to raise awareness of the program and get community buy-in. With community buy-in established, it was easy for solicitations of electric utility data from each interested building occupant to bear fruit.
Case 3 addressed energy reduction for university owned houses. This project aimed to get reduction simply through behavioral changes by the students. Six years of monthly energy data (both natural gas and electric) was available for each house—except for those which had been recently constructed.
In case 4, the driving community organization is the local high school. Their program was advertised as one which enhanced the learning of students, while serving the community. Through use of a local weekly newspaper, interested residents were encouraged to drop off energy bills to the high school, the local community center, or the sole grocery store in the city. Thus, the process of providing energy data in itself could be seen by residents as linked to their community.
Finally, case 5 represents an attempt to reach a wider audience via a regional scale (eight county) sustainability non-governmental organization. A web-based energy and building data entry system was established. A variety of community meetings have been organized to draw residents to the site.
The following describes the energy information created for each of these constituencies, as summarized in Table 3. In case 1, the village residents are keenly aware of the need for sustainability, and are very proactive, as evidenced by the small amount of air conditioning energy use in the community. Many residents are for example embarrassed to use their air conditioning, if they have it available. With this context, a home energy report was developed to rate them relative to peers in the community, not to some arbitrary peer group. A rating of 100 was assigned to the worst in the community. A rating of 0 was assigned to the best. As well, to meet the needs of those most interested in potential economic savings, an estimate of the potential savings available to each building occupant was made for each energy category, including heating, cooling, water heating, and lighting/appliances. Finally, the report directed building occupants to the next step in a process to realize savings—namely to take advantage of low cost energy audits.
For the rural community commercial building energy reduction project (case 2), the focus had to be on the economic benefits of energy reduction. In the case of the university residential energy reduction project (case 3), the driver for change had to be based upon comparison to peers and upon their environmental impact, as there was no economic benefit to students for reduction. An energy report was designed to emphasize an energy effectiveness grade, a comparison of energy effectiveness to peers, and a measure of their monthly carbon footprint. The peer comparison included a ranking of an individual residence’s energy effectiveness relative to all peers in student housing, and even to the houses on their block. The high school student led project (case 4) energy information report emphasized a grade relative to peer houses in the community and estimates of cost savings achievable via efficiency improvements and behavior changes for each energy category. Also included, were itemized energy reduction measures each resident could take—tailored to their actual energy use profile. Finally, in the case of the regional sustainability organization managed project (case 5), where there is no possibility of a common mobilizing goal, the focus had to be on economic benefit. Thus the most important information developed was an estimate of cost savings potential in each energy category. Strongly emphasized is how much money each building occupant is losing annually due to inefficiencies.
Table 3. Energy information created for each of the communities.
Community OrganizationEnergy Information Developed
1. Small suburban village volunteer Energy Board Sustainability 04 01371 i001
2. Small rural town economic development organization Sustainability 04 01371 i002
3. University student sustainability organization Sustainability 04 01371 i003
4. Small exurban high school Sustainability 04 01371 i004
5. Regional sustainability organization Sustainability 04 01371 i005

5. Interactions between the Community Organizations and Building Occupants

Critical to the ability of the energy information developed to leverage action toward energy reduction within the communities is the nature of the interactions between the various community organizations and the building occupants—whether residential or commercial. Several common elements define these interactions. The first of these is interaction aimed to grow awareness of the project within the communities. For example, for the residential project in the small suburban village (case 1), the Energy Board sought to gain the attention of the community through the scheduling of a community meeting organized around the subject of residential energy reduction. Local media were invited to publicize the event—which they did—and then to develop a story about the event. This community event was very successful in attracting attendance, with nearly 150 attending the inaugural event. Attendees were asked to complete a form authorizing the energy information manager to access their energy data. For the commercial building energy reduction project (case 2), led by a local economic development non-governmental organization, a community meeting was also used to announce the program. The invitees, however, only included the building occupants deemed to have the greatest potential for savings, as determined from the county-wide energy assessment of all commercial buildings. In this case, the leading community organization made individual contact with all of these potential clients to encourage their attendance. Almost 100% of the occupants from the worst buildings identified attended. The generated energy reports were presented to all attendees. Described also was the next step in the program—namely utility sponsored on-site energy audits. For the university program (case 3), the program was announced through both a campus newspaper article and through emails directed to each student residing in the university owned residences. In addition, a kick-off event centered around music and free food was used to generate early interest in the project. Finally, in case 4, the high school student led project, the project was announced in the local community newspaper and through school newsletters. Residents were invited to drop-off their energy bills to all schools, the community center, and the sole grocery store in the small suburban town. The regional sustainability run project (case 5) has used similar vehicles for gaining awareness. As the audience size is much larger, numerous community meetings and events have been organized to reach different constituencies. Further, regional media have been exploited to describe the program broadly to the community. Presentations to city and town chambers of commerce, city and county government organizations, organization of green festivals—designed to both inform and provide fun, and presentation at green/sustainability workshops within the region have been utilized.
Success is best achieved when there is continuous interaction between the driving organization and the community being served. These types of interactions have been somewhat varied for each of the projects. In case 1 for the suburban residential energy reduction project, a follow-up community meeting was established for those residents who had agreed to share their energy data. At this meeting, attendees were provided their residential energy report cards and offered a no-cost on-site residential assessment. Again, nearly all attendees signed up for this service. In case 2, for the rural commercial energy reduction project, the interactions with the community have included use of web and e-mail newsletters from the sponsoring economic development organization, follow-up phone calls with building occupants after energy audits were completed in order to encourage action toward savings recommendations made, and local media highlighting savings realized by building occupants participating in their program. The latter is critical to long-term viability of sustainability initiatives within a community—as advertised successes strengthen the position of the driving organization within the community it serves. In addition, others within the community can be influenced to act if they see real people acting to become more sustainable. In case 3, for the university project, all subsequent interactions were via technology. E-mail was used to deliver monthly energy reports to each resident. Both e-mail and Facebook were used to provide savings recommendations most relevant to the season. For example, in January student residents were encouraged to turn their thermostats down at night to save energy. In the student high school organized project (case 4), energy report cards were delivered via mail to those residents who had provided their energy bills. As well, an Energy Fair was organized for the community. This exposition featured student energy project presentations, invited speakers in the community, energy service providers/contractors, and representatives from the local utilities. Finally, in the case of the regional sustainability organization (case 5), the web has been the primary vehicle for follow-on communication [42]. Businesses which have received green building certification from the program have been highlighted on their page. Sustainability events are also advertised.

6. Results

All of the programs are ongoing, with some more evolved than others, but each offers at least glimpses of success. The most evolved programs are the rural city commercial building project led by the non-governmental economic development organization and the university student housing energy reduction project.
The rural economic development inaugural community meeting saw nearly perfect attendance from those who were invited. Moreover, all who attended, and some who didn’t attend, signed up for an on-site energy assessment immediately. This type of response contrasts vastly with the typical approach we had used in other counties—namely to contact the building owner directly to encourage a free on-site assessment. This latter strategy has resulted in a 5% participation rate. From the detailed energy assessments of 15 buildings assessed in the first year, total savings of over $75,000/year were identified with an estimated simple payback of less than four years. Ninety percent of the building owners acted on the recommendations in energy reduction, again an unprecedented response.
Results for the university residence project (case 3) include survey feedback and measured savings. First, a survey emailed to students a month after they received their first report wanted to know if the home energy report cards had provoked action. Nearly 20% of students responded to the survey. Of those responding,
  • 48.2% changed behavior to reduce their energy usage after receiving their first report card
  • 27.4% were only a little more than neutral in believing they knew how to conserve energy
  • 69.5% incorrectly believed their old house is hindering their grade
This type of response is consistent with the fact that many university students are considering sustainability as a factor when selecting a university to attend [43].
A minority of students said “I don’t care about this. I pay for the housing”. However, one-half of students responding to the survey indicated that they had changed behavior is a strong result. That over one-quarter (i.e., 27.4%) said that they did not know how they could save energy meant that more education was needed. Follow-up prompt emails to students provided them specific energy saving measures they could take advantage of. Measured annual savings in the first year of the program was over 4%.
Energy saving results from the other programs cannot be measured yet, but there has been much progress. In the rural village housing reduction project, nearly 25% of the single-family residents participated, all receiving home energy performance reports. Over 40 of those which had received poor energy performance ratings signed up for on-site detailed assessments. In addition, for this community a more detailed web-based home energy savings system has been developed and also hosted on the participating community leaders’ website. This tool identifies priority energy savings and simple payback for these measures. The utility of this tool for the community has not been measured yet.
The high school led project, which required completion of a paper form by community residents, saw participation of over 200 homes, roughly 10% of the homes in this community. In addition, the Energy Fair hosted at the school saw over 400 residents attending. Current effort focuses on high school students doing detailed energy audits of homes requesting such a service.
Finally, the multi-county initiative is just beginning. The web-based home energy snapshot tool and a similar commercial building rating tool are now hosted on the sustainability organization’s website. Further, a simplified green building certification standard is built around the automated rating, requiring only actual utility billing verification to confirm the user input data. There are now nearly 100 businesses which have received green building certification and the regional sustainability web site has attracted more than 100,000 hits—all in the course of a year.

7. Conclusions

An energy information augmented community energy reduction model has been posed and tested in part. While the results are by no means complete, initial indications are that the posed model has traction. The energy customers have seen value in the information provided them relative to their effectiveness in using energy and specification of directions for potential energy savings. Energy information has an impact.
The model posed is translatable to any region or community. Practitioners will likely recognize the immediate value of an automated building rating system linked to energy cost implications of their rating relative to more energy effective buildings. They may also see the value in translating the rating into a process for community action at local levels.
It is hoped that demonstrated success of community driven energy reduction, augmented by energy information, can impact how we fund energy reduction nationally—moving away from utility managed reduction programs funded through rate increases to its customers and moving toward community incentivized organizations supported by a regional energy information system. This scenario has the potential to realize large-scale energy reduction. Unfortunately, this approach is currently limited by structural issues nationally. It is of foremost importance how utilities are being credited for energy reduction in compliance with state mandated energy efficiency requirements. To date, utilities commissions are only crediting utilities for energy reduction if and only if the utility is the driving force for change. If a community itself produces reduction, the utility will be put in a difficult situation. The community driven energy reduction project would have targeted the most cost effective energy reduction. Further reduction would only be possible at much greater cost. Were the utilities required to achieve the mandate independent from community based energy reduction, the cost for energy reduction to the utility and ultimately to its customers would be prohibitive. Thus, if community based energy reduction gains momentum, state utility commissions would have to re-examine their energy efficiency mandates and the expectation of utilities as the principal agents for energy reduction. Ultimately a much more effective energy reduction strategy could be crafted which recognizes the value of existing community organizations for energy reduction and the potential for cost effective energy reduction and green jobs development. Energy reduction should be seen not as something required by the state but as something which is truly good for the communities and for people.

Conflict of Interest

The authors declare no conflict of interest.

Appendix

This appendix summarizes how the historical energy data for each building is disaggregated into weather and weather-independent energy use. It also describes the value of this disaggregated energy data in terms of characterizing the effectiveness of energy use by each building occupant in various energy categories—namely heating, cooling, water heating, and appliances/lighting/ventilation.
A five parameter regression is used as the starting point for disaggregating the electric power into weather and weather independent energy. This regression is of the form:
Sustainability 04 01371 i006
In this equation, Baselinee refers to the weather independent electric power for the building (primarily for lighting and appliances) in units of (kW/sq.ft.), CSe is the electric cooling power slope in units of (kW/sq.ft-°F), T refers to the actual average monthly exterior dry-bulb temperature with units of (°F) obtained from the NOAA weather data site [1], HSe is the electric power heat slope in units of (kW/sq.ft.-°F), Tbalc,e is the electric cooling balance point temperature (e.g., the exterior temperature at which the building occupants just begin to cool their building) and Tbalh,e is the electric heating balance point temperature, associated with the exterior temperature below which the occupants utilize electric heating. As well, the Heaviside function used in Equation (1) is defined as shown in Equation (2):
Sustainability 04 01371 i007
This fit, referred to as a 5-P fit, captures power increases for heating and cooling seasons if applicable. Physically, the heating and cooling power slopes characterize the overall heat transfer coefficient, UA (BTU/hr/sf/deg.F), of the house divided by the efficiency or coefficient of performance of the heating or cooling equipment.
A representative curve-fit for one residence is shown for a residential building in Figure A.1 for respectively 2003–04 and 2007–2008. As seen, this data shows that residents effectively abandoned electric heating since 2003–04. In the early period the residents supplemented their natural gas heating energy with electric space heating when the outside air temperature fell below 20°F. The data also shows that residents were much more erratic with their cooling energy use in the latter period shown, as evidenced by the greater amount of scatter around the cooling slope fit.
Figure A.1. Representative 5-P fit for a residential building.
Sustainability 04 01371 g003
A 3 parameter (3-P) fit is regressed to the natural gas power of the form:
Sustainability 04 01371 i008
The cooling and heating degree hours (CDH and HDH), metrics designed to reflect the demand for energy needed to respectively cool or heat a home or business, are evaluated from the building owner’s actual balance point temperature rather than some statistical average of all buildings. Equations (4) and (5) show respectively the calculations for heating degree hours (HDH) and cooling degree hours (CDH). The hourly temperature, Ti, is the typical hourly temperature, defined from a 30 year average for a location. Thus, the energy performance in one year can be compared to the energy performance in another year by translation of the observed building performance for any year based upon actual weather data to a typical weather year.
Sustainability 04 01371 i009
and
Sustainability 04 01371 i010
The annual baseline electric energy, heating energy, cooling energy, and heating energy per square foot can be determined. Annual baseline energy use per square foot (energy intensity) for both electric and natural gas can be determined. Likewise heating energy for both natural gas and electricity (if applicable) can be determined.
Sustainability 04 01371 i011
where energy data is available for a period of time greater than one year, changes in these annual consumptions can also be evaluated. With the goal being to determine how the energy use or power is changing over time, irrespective of weather, 3 parameter or 5 parameter regressions can be fit for 12 months of data at a time.
Sustainability 04 01371 i012
Figure A.2 shows the nature of this regression. For each 12 months of data, a 3P fit is made in order to determine HS, Tbalh,i,, and Baselinei. These respectively characterize the heating characteristics of the building (UA­overall/efficiency), the user characteristics (e.g., how the building is controlled from a temperature set-point perspective), and the non-weather dependent usage. Note that these are independent of the specific weather for the year.
Figure A.2. Sliding 3PH Fit Progression.
Sustainability 04 01371 g004
In order to compare heating energy from month to month or year to year, these characteristics are applied to a typical weather year for the city or region. NREL tmy3 typical dry bulb temperature data is employed [2]. Thus, the weather normalized annual heating energy is determined for each 12 month period to be equal to:
Sustainability 04 01371 i013
where the heating degree hours for any 12 month period can be well represented for SW Ohio and the estimated balance point temperature, Tbalh,i, for each 12 month period by:
Sustainability 04 01371 i014
The annual baseline energy or non-weather dependent energy is roughly constant all year, so the total annual baseline energy is equal to the hourly baseline energy times the number of hours per year.
Sustainability 04 01371 i015
Figure A.3 shows historical energy use for a sample building relative to annual natural gas energy used for heating. This building shows a clear increase in heating energy with time.
Figure A.3. Sliding annual heating energy for sample building showing clear increase over time.
Sustainability 04 01371 g005
In order to gain social acceptance for the information provided, the calculated energy use per category (heating, cooling, etc...) is then benchmarked against what would be typical for the specific use type of the building for peer energy users within the community. For the US, there are two benchmarks for comparison, namely the Commercial Building Energy Consumption Survey—CBECS [3], and Residential Energy Consumption Survey—RECS [4]. Benchmarks are available in each energy category: heating, baseline electric (lighting and appliances), cooling, and water heating. Alternatively, if enough real data from a community is available, average or probabilistic data from this real data can be used.
Lastly the disaggregated building occupant energy use in the various categories can be compared to the benchmarks and/or to other occupants in the same community. A building energy savings or home energy grade is then determined. This grade can be based upon:
  • the total annual energy cost for a building divided by the average annual enwhergy cost for the same size building;
  • comparison to past energy use; and
  • comparison to other houses/buildings in a region or community.
Further the grade or rating can be scaled such that poor energy performance is associated with a low grade or high energy savings potential.

References

  1. NOAA. Climate Data Online. Available online: http://www.ncdc.noaa.gov/cdo-web (accessed on 15 February 2012).
  2. NREL. 1991–2005 Update: Typical Meteorological Year 3. Available online: http://rredc.nrel.gov/solar/old_data/nsrdb/1991-2005/tmy3/ (accessed on 15 February 2012).
  3. U.S. Department of Energy EERE. The Energy Index for Commercial Buildings. Available online: http://buildingsdatabook.eren.doe.gov/CBECS.aspx (accessed on 15 December 2011).
  4. U.S. Department of Energy EERE. Available online: http://205.254.135.7/consumption/residential/ (accessed on 15 December 2011).

References

  1. Federal Energy Regulatory Commission. Renewable Power and Energy Efficiency: Energy Efficiency Resource Standards (EERS) and Goals. 13 September 2011. Available online: http://www.ferc.gov/market-oversight/othr-mkts/renew/othr-rnw-eers.pdf (accessed on 1 May 2012).
  2. U.S. Congress. U.S. Government Archive. 2007. Available online: http://www.gpo.gov/fdsys/pkg/BILLS-110hr6enr/pdf/BILLS-110hr6enr.pdf (accessed on 15 April 2012).
  3. U.S. Congress. Federal Energy Management Program. EERE. 1978. Available online: http://www1.eere.energy.gov/femp/regulations/necpa.html (accessed on 1 May 2012).
  4. DOE—EERE. Building America Kickoff. July 2010. Available online: http://apps1.eere.energy.gov/buildings/publications/pdfs/building_america/ns/plenary_1_doe_initiatives.pdf (accessed on 15 March 2012).
  5. Pachauri, R.; Reisinger, A. IPCC Fourth Assessment Report: Climate Change; Intergovernmental Panel on Climate Change, Geneva, Switzerland; 2007.
  6. Energy Information Agency. 2009. Available online: http://www.eia.doe.gov/aer/pecss_diagram.html (accessed on 1 May 2012).
  7. ACEE. Incentivizing Utility Led Efficiency Programs. 2011. Available online: http://www.aceee.org/sector/state-policy/toolkit/utility-programs (accessed on 15 January 2012).
  8. American Public Power Association (APPA), The Effect of Energy Efficiency Programs on Electric Utility Revenue Requirements; American Public Power Association (APPA): Washington, DC, USA, 2009.
  9. Kihm, S. When revenue decoupling will work...and when it won’t. Electr. J. 2009, 22, 19–28. [Google Scholar] [CrossRef]
  10. Ludwig, P. Addressing climate change by retrofitting Chicago’s buildings: The whole home energy savers experience. In Proceedings of the 2010 ACEEE Summer Study on Energy Efficiency in Buildings, Pacific Grove, CA, USA, 15–20 August 2010.
  11. York, D.; Kushler, M.; White, P. Compendium of Champions: Chronicling Exemplary Energy Efficiency Programs from Across the U.S. American Council for an Energy-Efficient Economy; ACEEE: Washington, DC, USA, 2008. [Google Scholar]
  12. California Municipal Utilities Association. Energy Efficiency in California’s Public Power Sector: A Status Report. 2011. Available online: http://www.anaheim.net/utilities/adv_svc_prog/SB1037.pdf (accessed on 15 April 2012).
  13. Mckenzie-Mohr, D.; Smith, W. Fostering Sustainable Behavior: In Introduction to Community-Based Social Marketing, 3rd ed; New Society Publisher: Gabriola Island, BC, USA, 2011. [Google Scholar]
  14. Geller, E.S. From ecological behaviorism to response generalization: Where should we make discriminations? J. Organ. Behav. Manag. 2001, 21, 55–73. [Google Scholar] [CrossRef]
  15. Bunt, L.; Harris, M. Mass Localism: A Way to Help Small Communities Solve Big Social Challenges; NESTA: London, UK, 2010. [Google Scholar]
  16. McAlley, L. From motivation and cognition theories to everyday applications and back again: The case of product-integrated information and feedback. Energ. Pol. 2006, 34, 129–137. [Google Scholar] [CrossRef]
  17. Kissock, J.; Eger, C. Measuring Industrial Energy Savings. J. Appl. Energy 2008, 85, 347–361. [Google Scholar] [CrossRef]
  18. Penrith, S. Multi-State Energy Performance Score (EPS). In Proceedings of the ACI National Home Performance National Conference, San Francisco, CA, USA, 28 March–1 April 2011.
  19. Peters, M.; Fudge, S.; Sinclair, P. Mobilising community action towards a low-carbon future: Opportunities and challenges for local government in the UK. Energ. Pol. 2012, 38, 7541–7545. [Google Scholar]
  20. Mulugetta, Y.; Jackson, T.; van der Horst, D. Carbon reduction at community scale. Energ. Pol. 2010, 38, 7541–7545. [Google Scholar] [CrossRef]
  21. Grunwald, T. Making the New Work: Online Strategies for Community Based Organisations; UKCO: London, UK, 1997. [Google Scholar]
  22. Warschauer, M. Demystifying the digital divide. Sci. Am. 2003, 289, 42–47. [Google Scholar] [CrossRef]
  23. Warren, C.R; McFayden, M. Does community ownership affect public attitudes to wind energy? A case study from South-West Scotland. Land Use Pol. 2010, 27, 204–213. [Google Scholar] [CrossRef]
  24. Rogers, J.; Simmons, E.; Convery, I.; Weatherall, A. Public perceptions of opportunities for community based renewable energy projects. Energ. Pol. 2008, 26, 4217–4226. [Google Scholar]
  25. Preston, I.; White, V.; Lloyd-Prince, L.; Anderson, W. Best Practice Review of Community Action on Climate Change. Centre for Sustainable Energy on Behalf of the Energy Savings Trust: Bristol, UK, 2009; Final Report. [Google Scholar]
  26. Trier, C.; Maiboroda, O. The Green Village project: A rural community’s journey toward sustainability. Local Environ. 2009, 14, 819–831. [Google Scholar] [CrossRef]
  27. Moloney, S.; Horne, R.; Fien, J. Transitioning to low carbon communities-from behavior change to systematic change: Lessons from Australia. Energ. Pol. 2010, 38, 7614–7623. [Google Scholar] [CrossRef]
  28. Heiskanen, E.; Johnson, M.; Robinson, S.; Vadovics, E.; Saastamonien, M. Low-carbon communities as a context for individual behavioural change. Energ. Pol. 2010, 38, 7586–7595. [Google Scholar] [CrossRef]
  29. Devine-Wright, P.; Devine-Wright, H. Public engagement with community-based energy service provision: An exploratory case. Energy Environ. 2009, 20, 303–317. [Google Scholar] [CrossRef]
  30. Owens, S.; Driffill, L. How to change attitudes and behaviours in the context of energy. Energ. Pol. 2008, 36, 4412–4418. [Google Scholar] [CrossRef]
  31. NOAA. Climate Data Online. Available online: http://www.ncdc.noaa.gov/cdo-web (accessed on 15 February 2012).
  32. NREL. 1991–2005 Update: Typical Meteorological Year 3. Available online: http://rredc.nrel.gov/solar/old_data/nsrdb/1991-2005/tmy3/ (accessed on 15 February 2012).
  33. Hallinan, K.; Brodrick, P.; Kissock, K.; Brecha, R.J. Establishing building recommissioning priorities and potential energy savings from utility energy data. ASHRAE Transactions 2011, 117, 495–505. [Google Scholar]
  34. U.S. Department of Energy EERE. The Energy Index for Commercial Buildings. Available online: http://buildingsdatabook.eren.doe.gov/CBECS.aspx (accessed on 15 December 2011).
  35. U.S. Department of Energy EERE. Available online: http://205.254.135.7/consumption/residential/ (accessed on 15 December 2011).
  36. Gubbins, N. Community energy in practice. Local Econ. 2007, 22, 80–84. [Google Scholar] [CrossRef]
  37. Moraes, C.; Szmigin, I.; Carrigan, M. Living production-engages alternatives: An examination of new consumption communities. Markets Cult. 2010, 13, 273–298. [Google Scholar] [CrossRef]
  38. Friedman, M. A positive approach to organized consumer action: The “boycott” as an alternative to the boycott. J. Consumer Policy 1996, 19, 439–451. [Google Scholar] [CrossRef]
  39. Devine-Wright, P.; Walker, G.; Hunter, S.; High, H.; Evans, B. An Empirical Study of Public Beliefs about Community Renewable Energy Projects in England and Wales. 2007. Available online: http://geography.lancs.ac.uk/cei/Downloads/PDW%20STP%20Working%20Paper%202.pdfS (accessed on 15 May 2012).
  40. Ebi, K.; Semenza, J. Community-based adaptation to the health impacts of climate change. Am. J. Prev. Med. 2008, 35, 501–507. [Google Scholar] [CrossRef]
  41. Halpern, D. Social capital: The new golden goose; Cambridge University: London, USA, 1999. [Google Scholar]
  42. Princeton Review, Guide to Green Colleges; Princeton Review, Inc.: Framingham, MA, USA, 2011.
  43. Dayton Regional Green 3. Available online: http://www.drg3.org (accessed on 15 June 2011).

