
Initial Evaluation of Provincial-Level Environmental Risks from the Perspective of Human Settlements

Abstract
:1. Introduction
2. Data and Method
2.1. Data Sources
2.2. Index System
2.3. Research Method
- (1)
- Primitive matrix: , then is the value of the th value in the th province.
- (2)
- Standardized treatment of data: . In this expression, is the average of the th index values and is the standard deviation of the th index values.
- (3)
- Calculate the weight of the th index in the th province: .
- (4)
- The entropy value of indicator: , , .
- (5)
- Difference coefficient: .
- (6)
- Calculate the weight of the th index: .
- (7)
- Calculate the score of human settlement indexes (, , and ): .
3. Results and Analysis
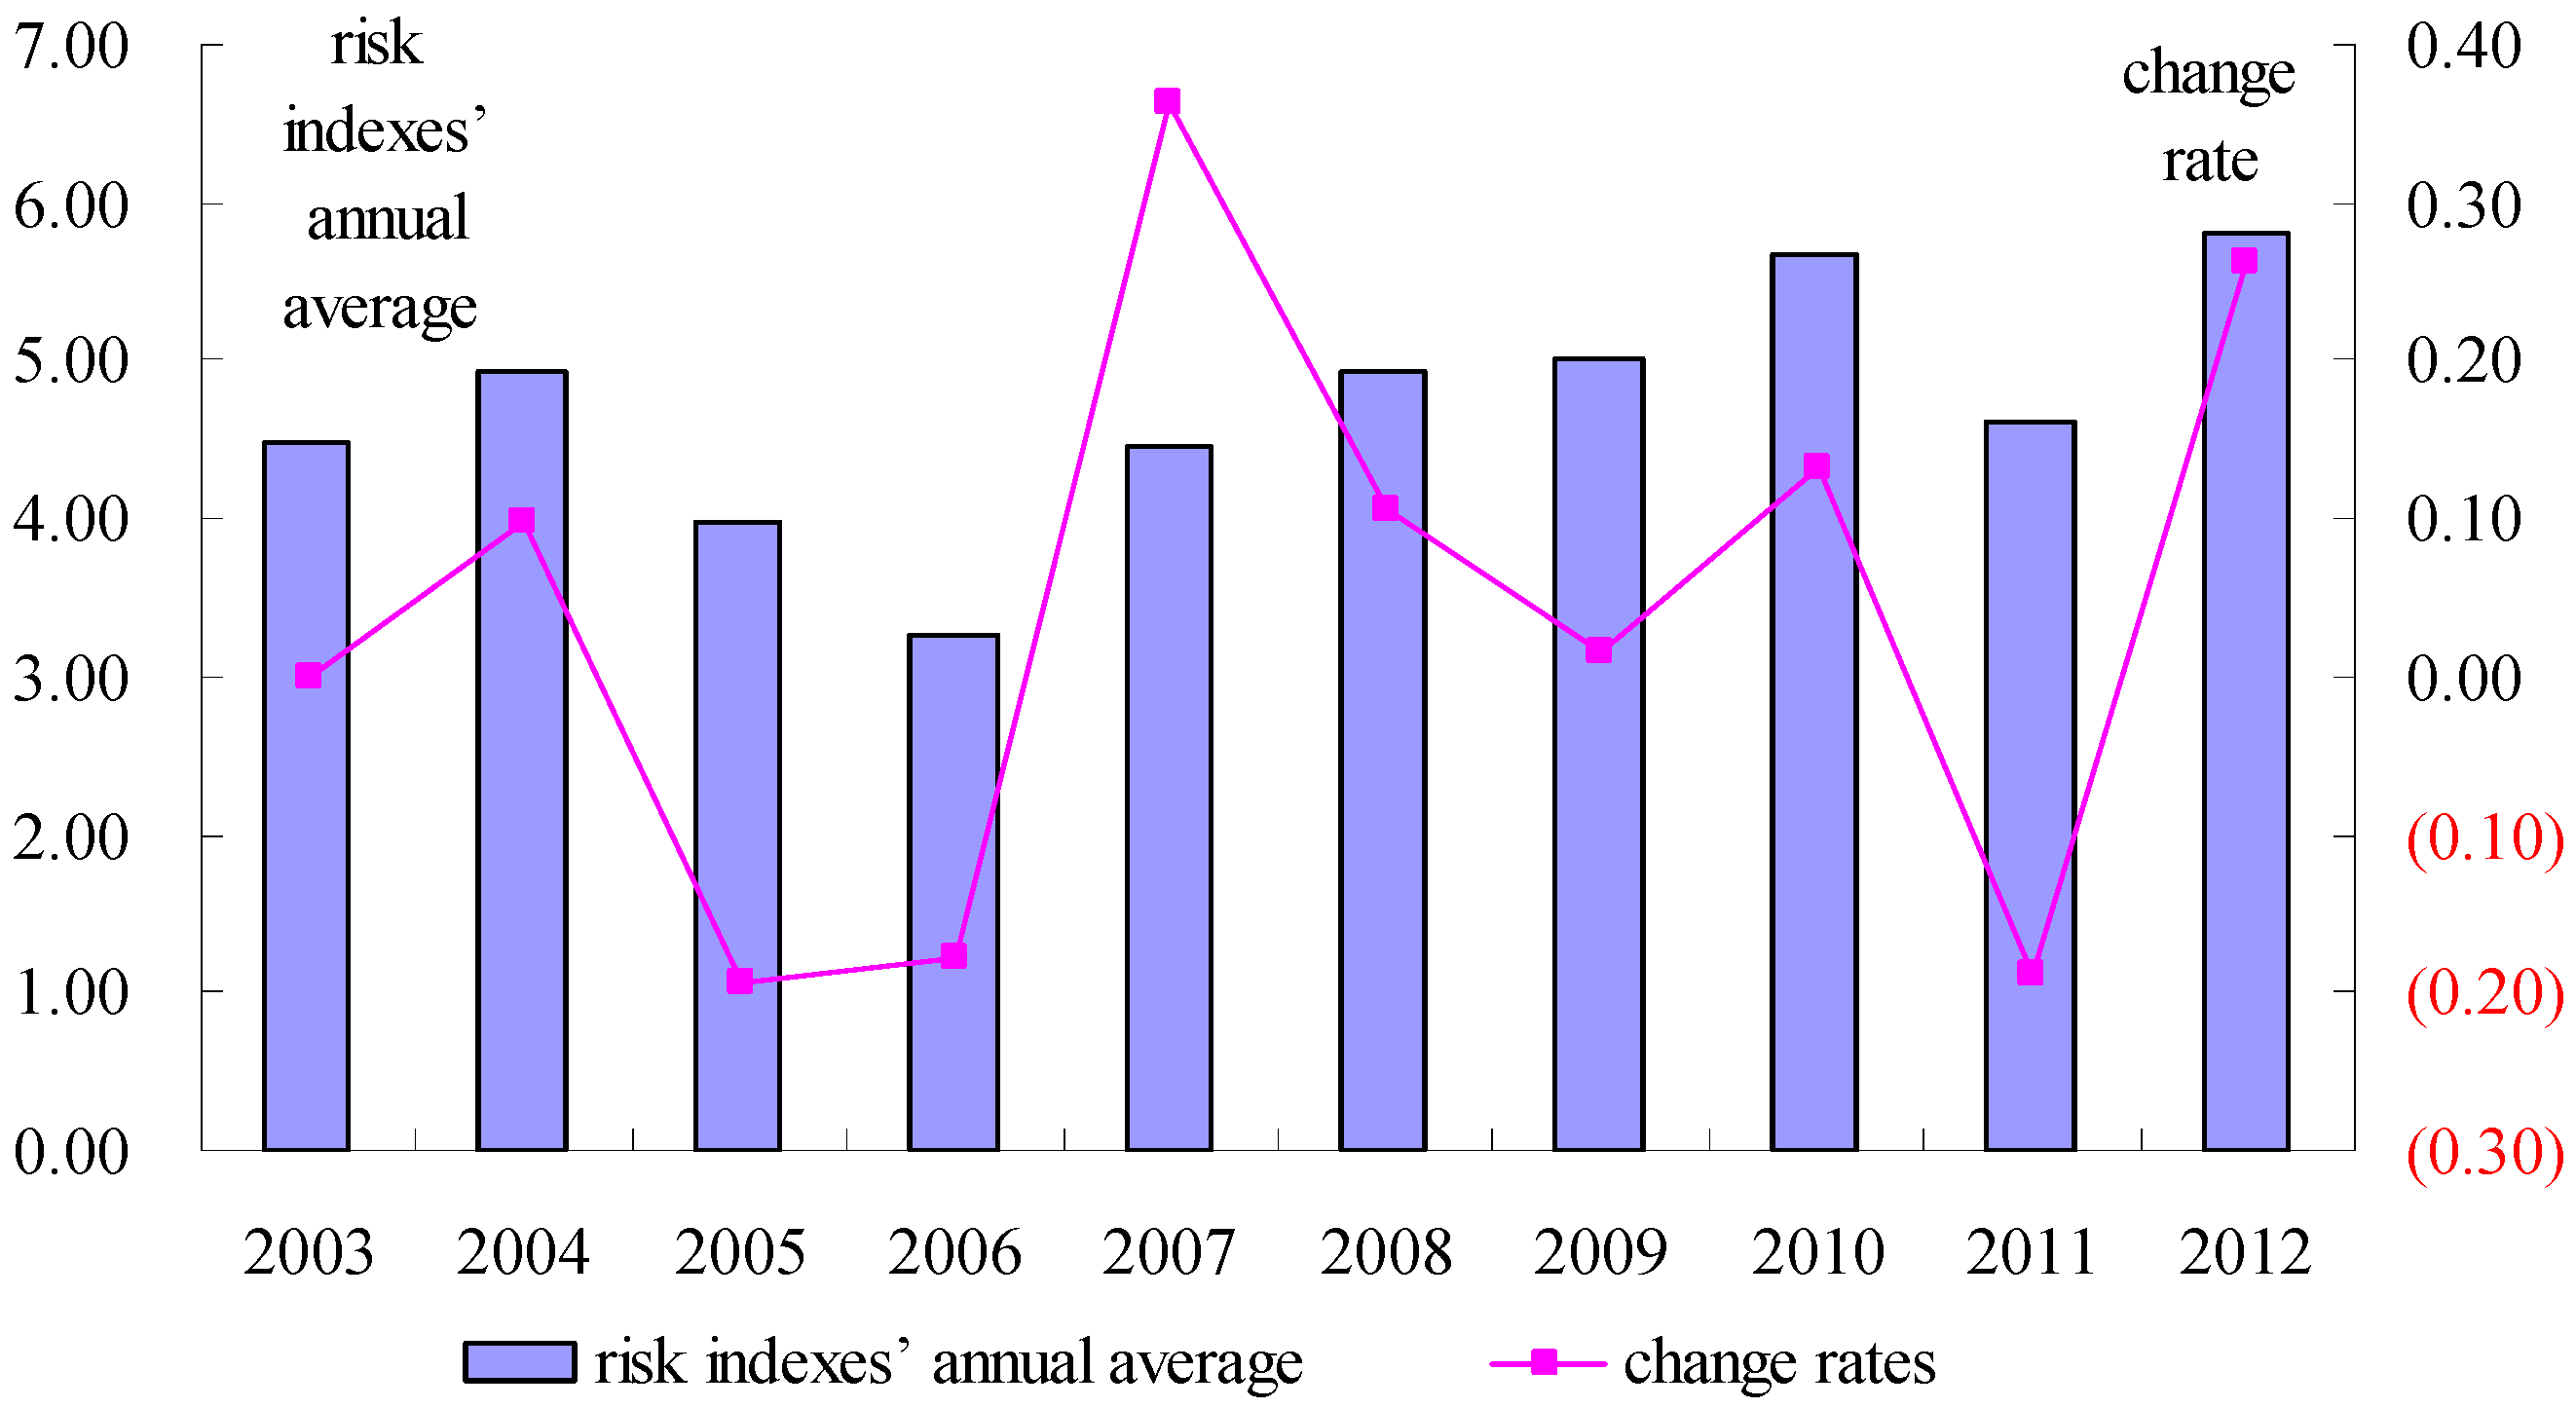
3.1. Temporal Characteristics Analysis of Human Settlement Risks
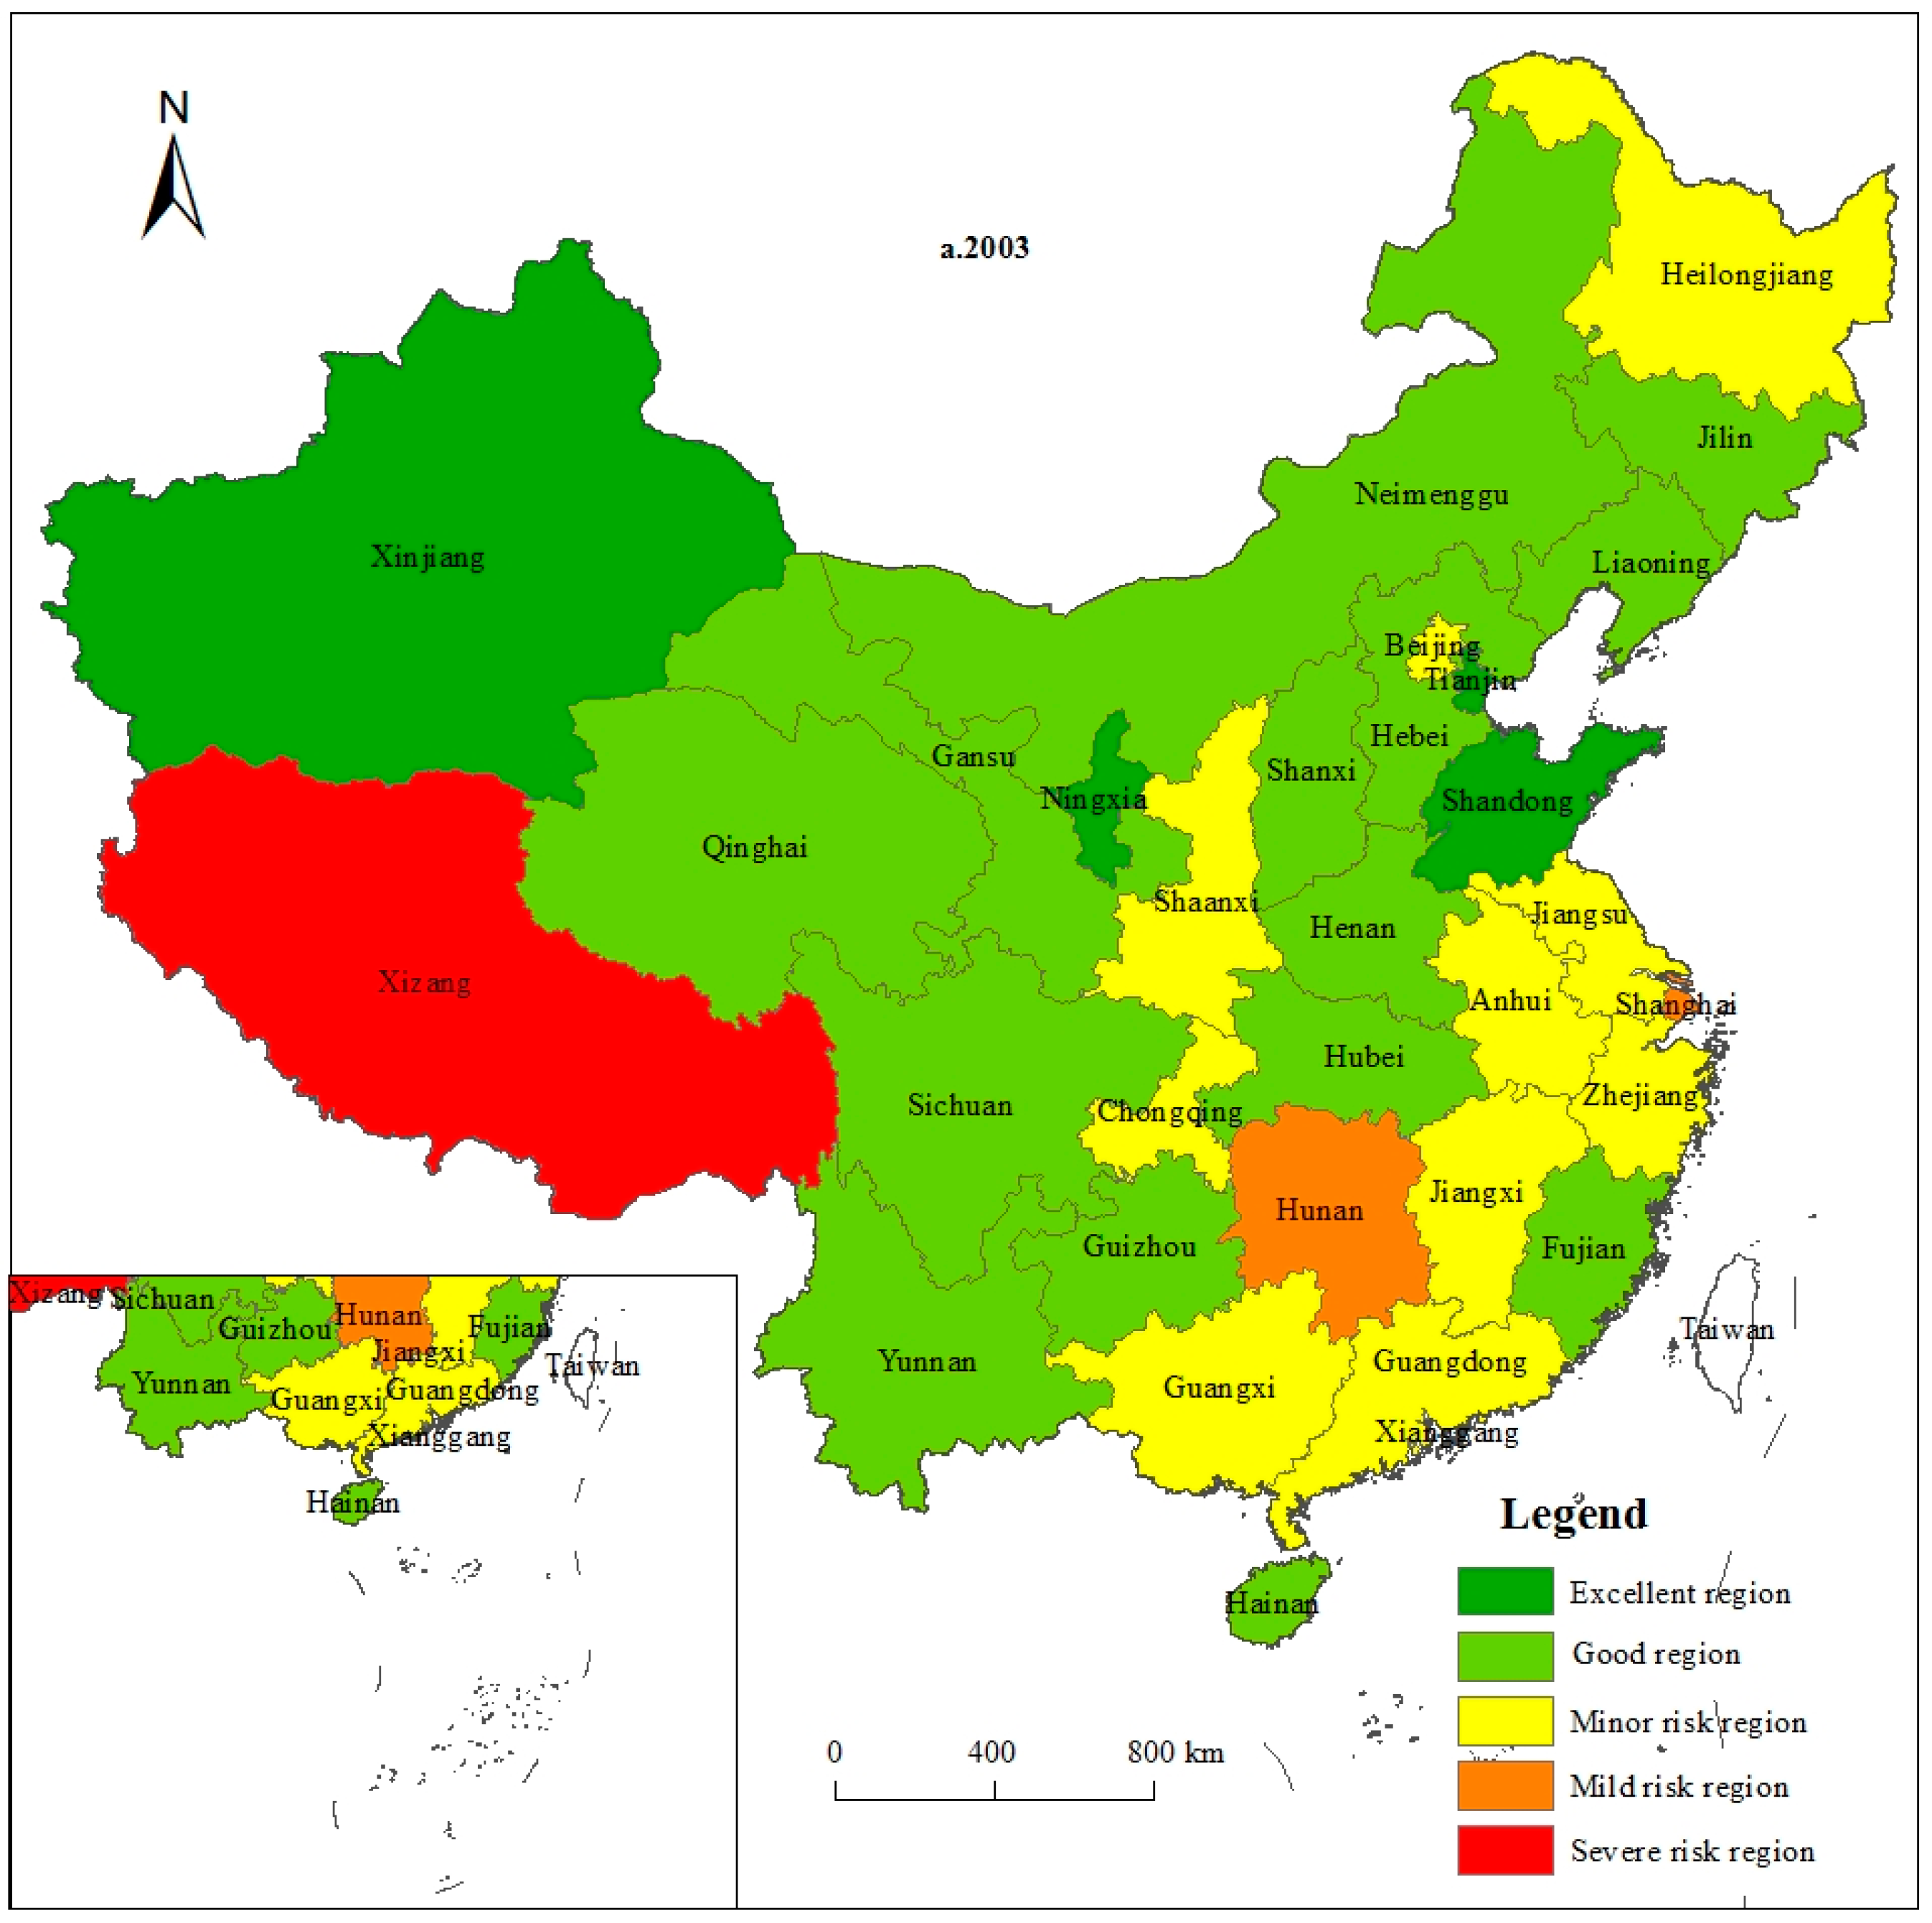
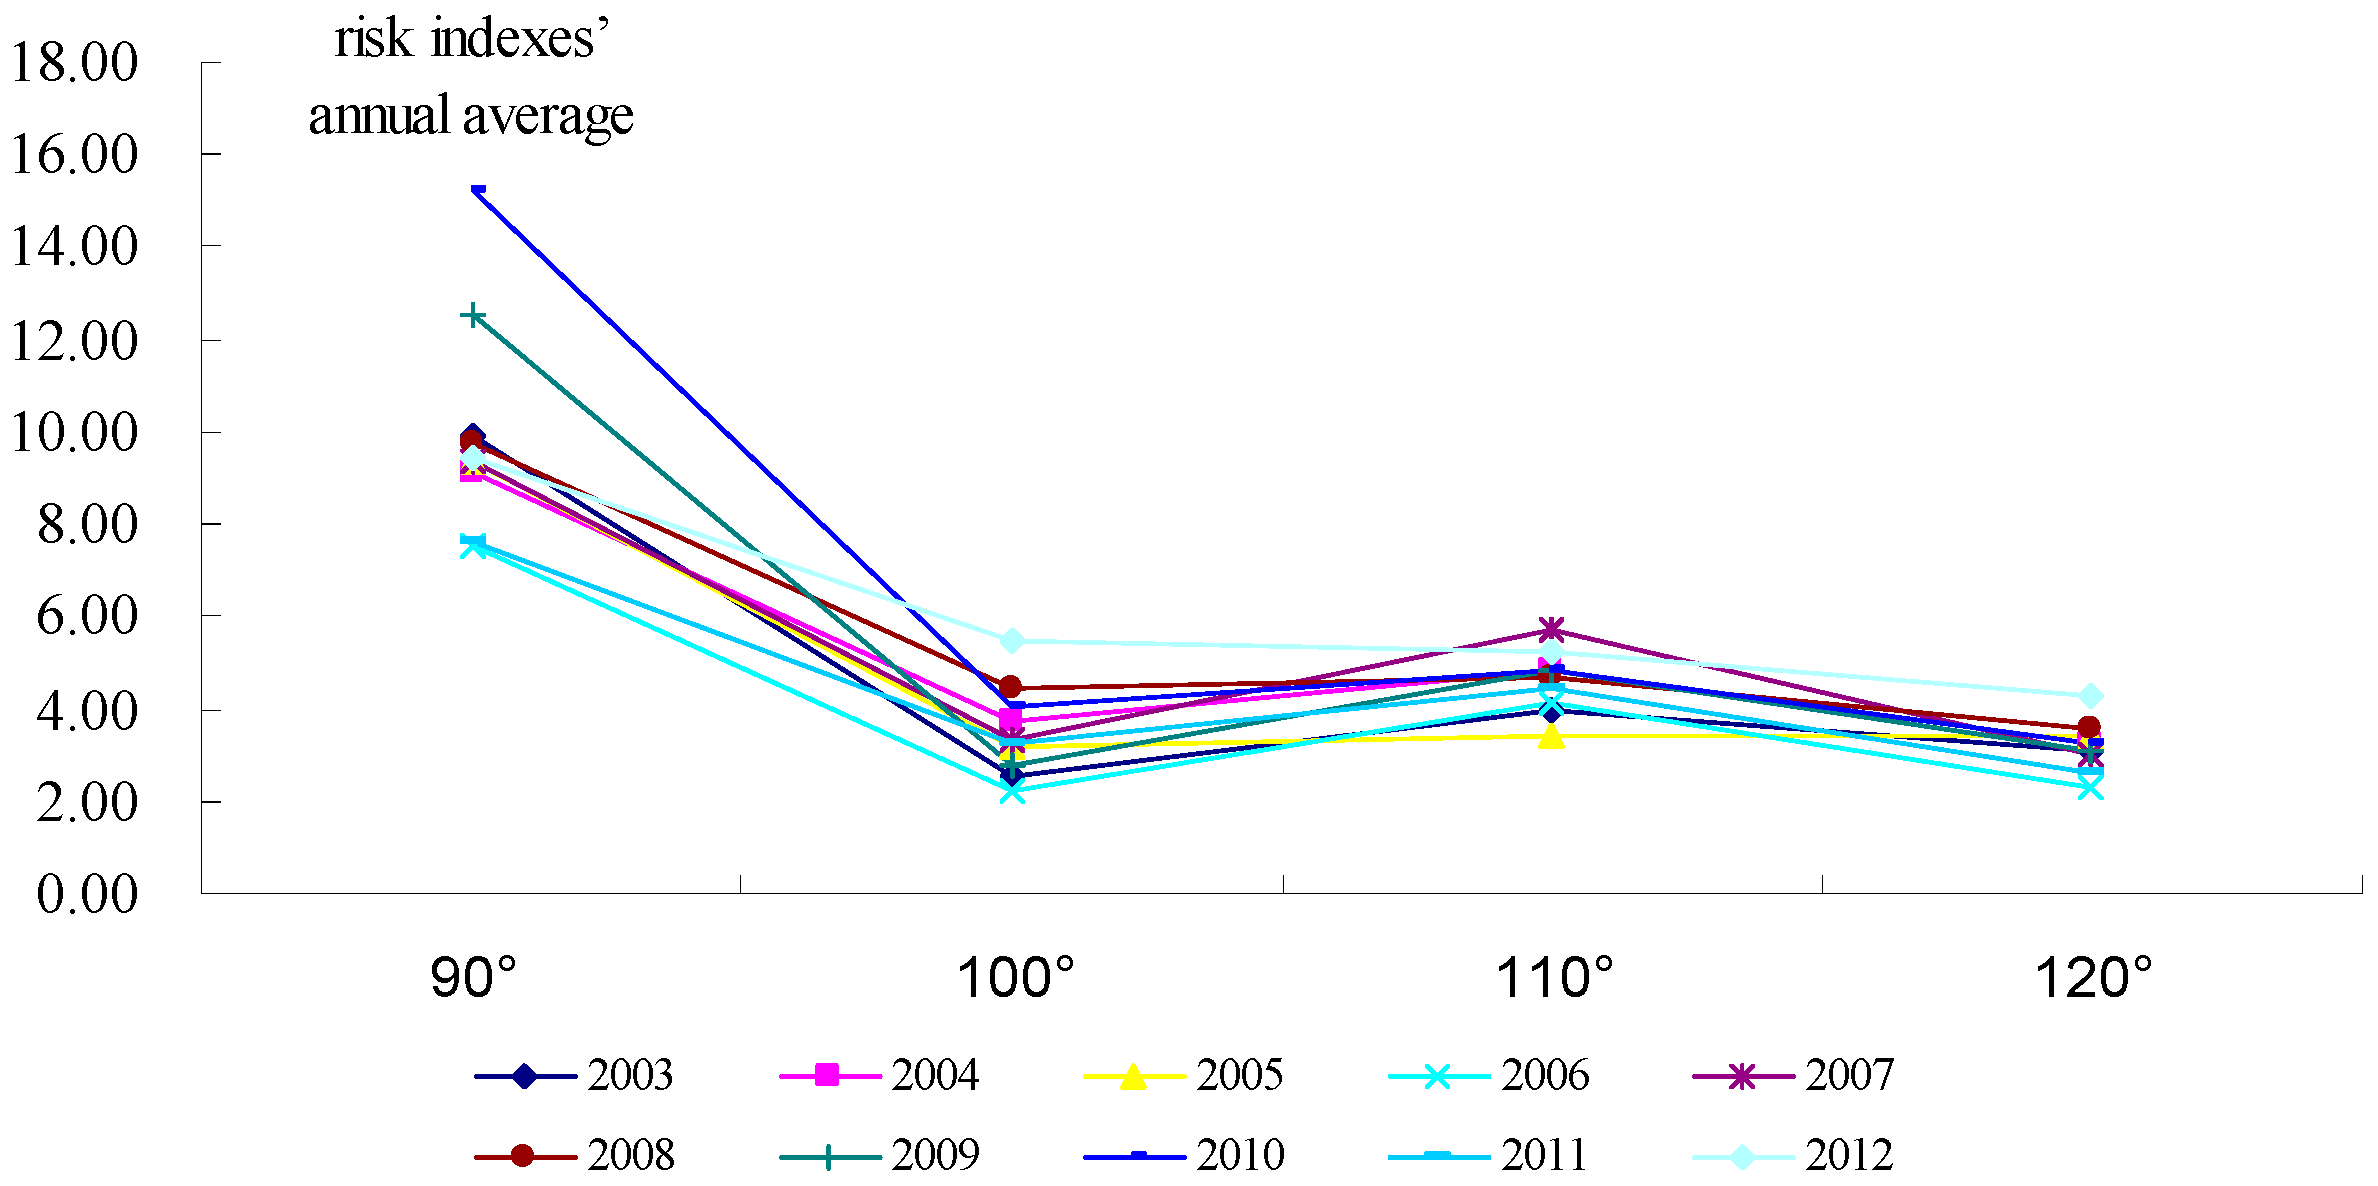
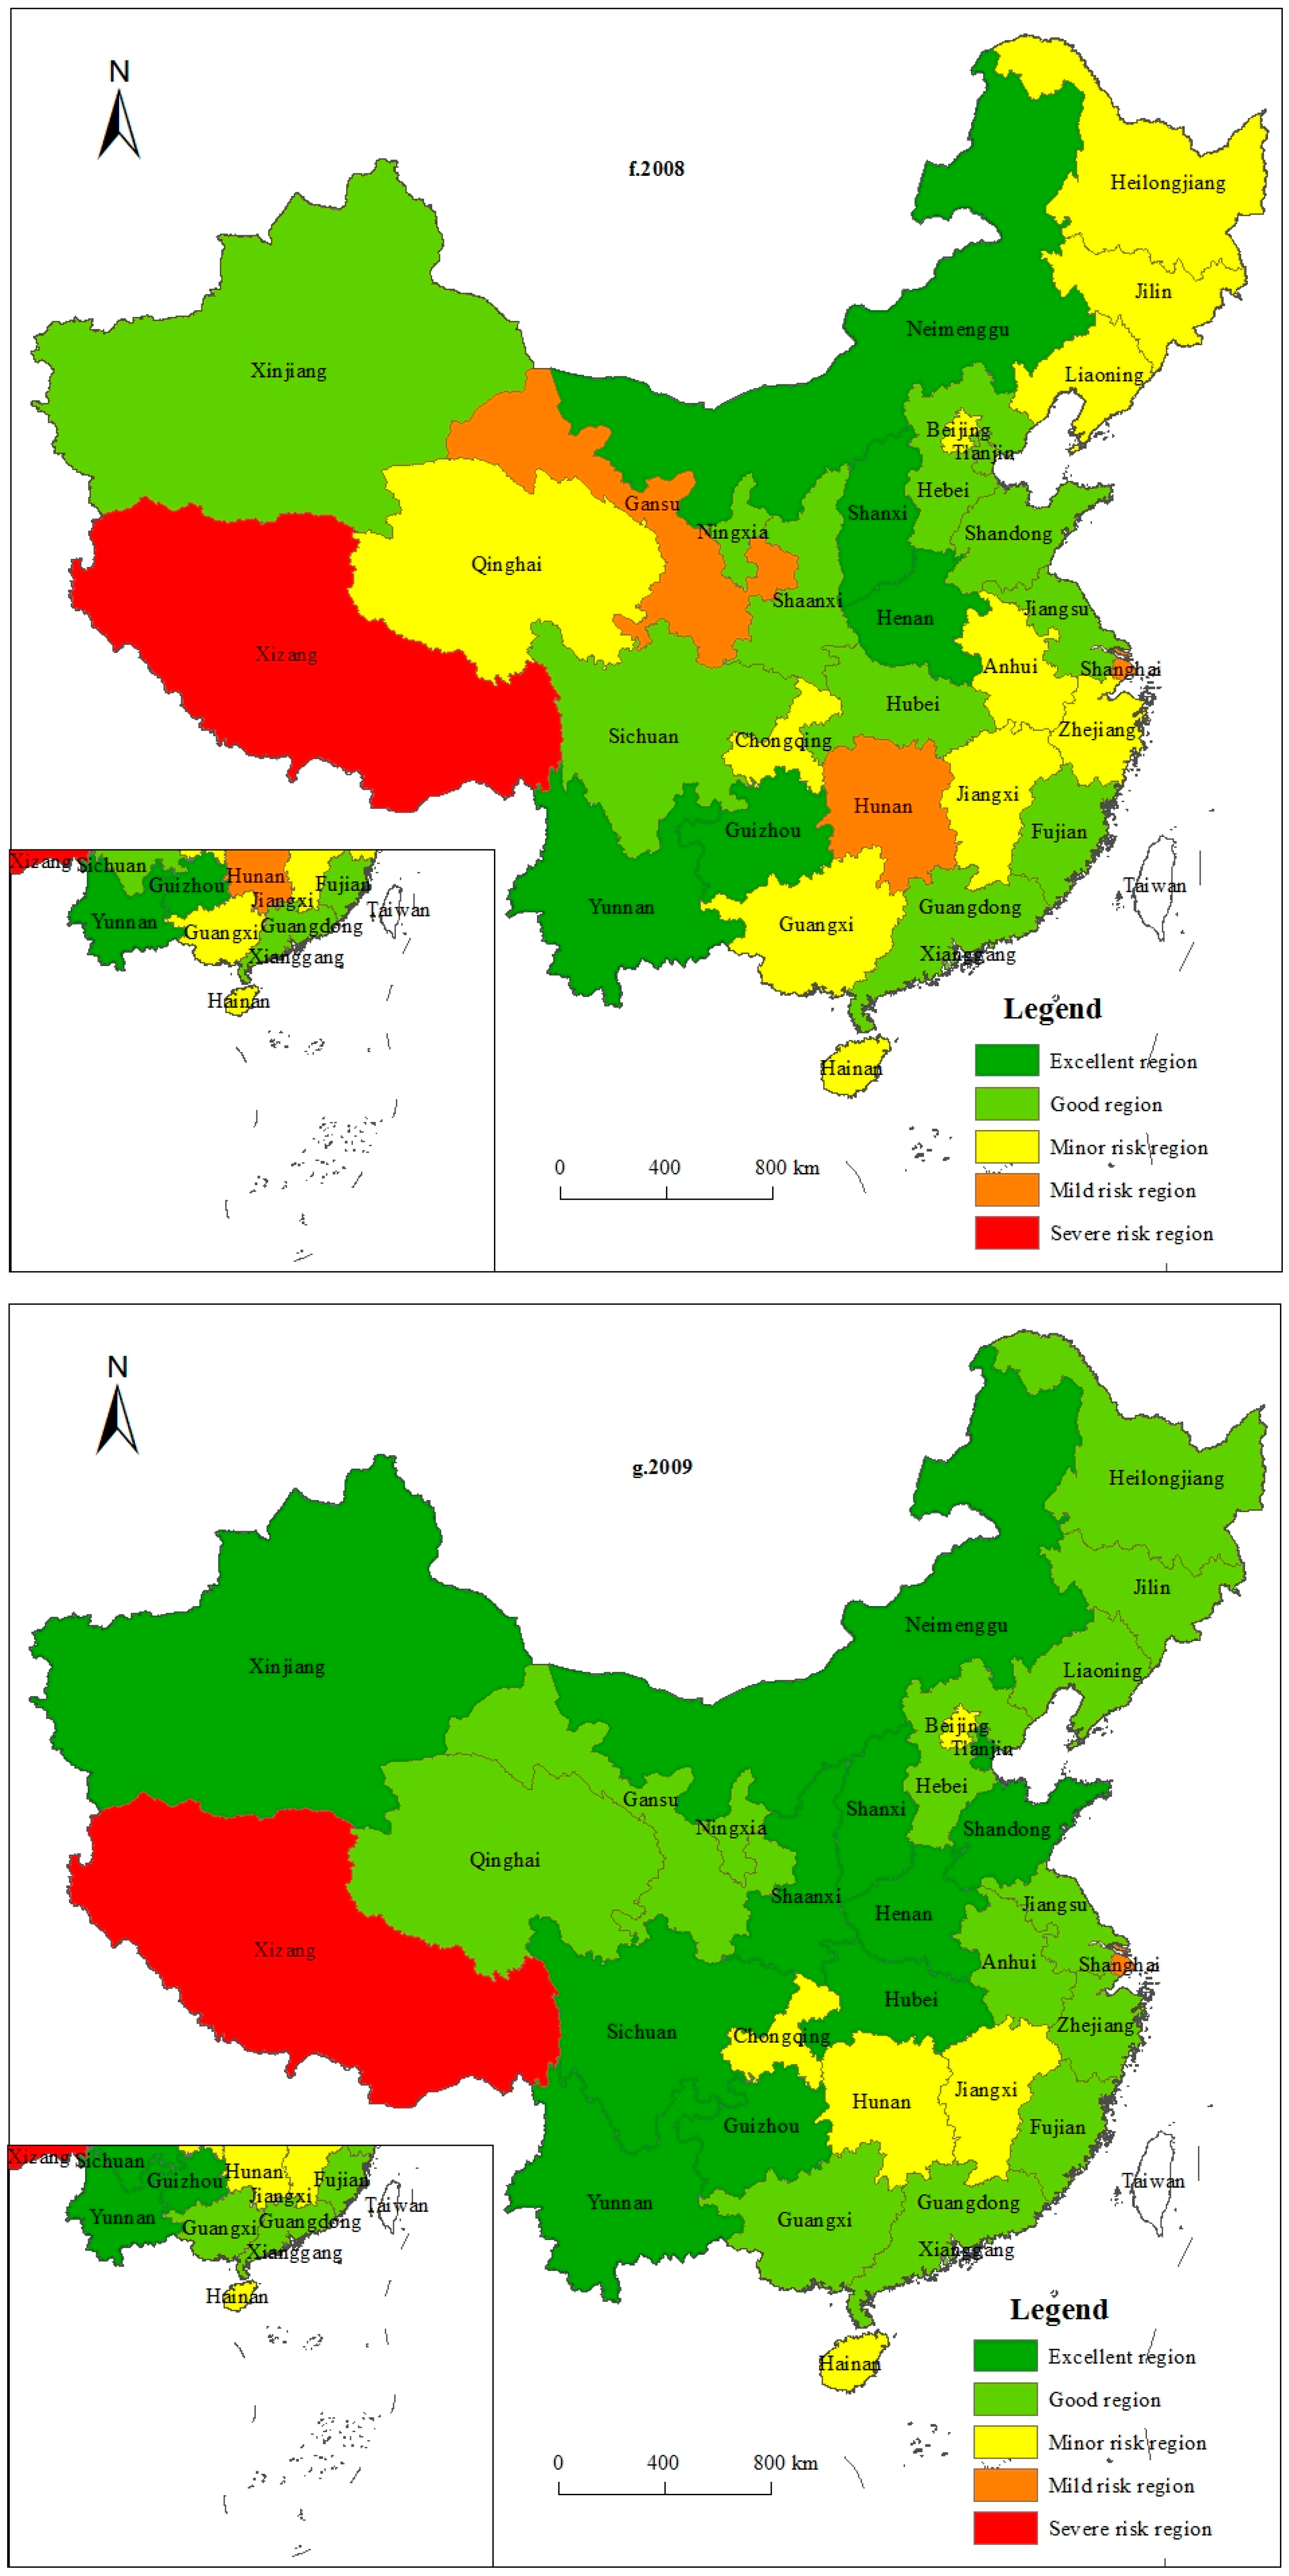
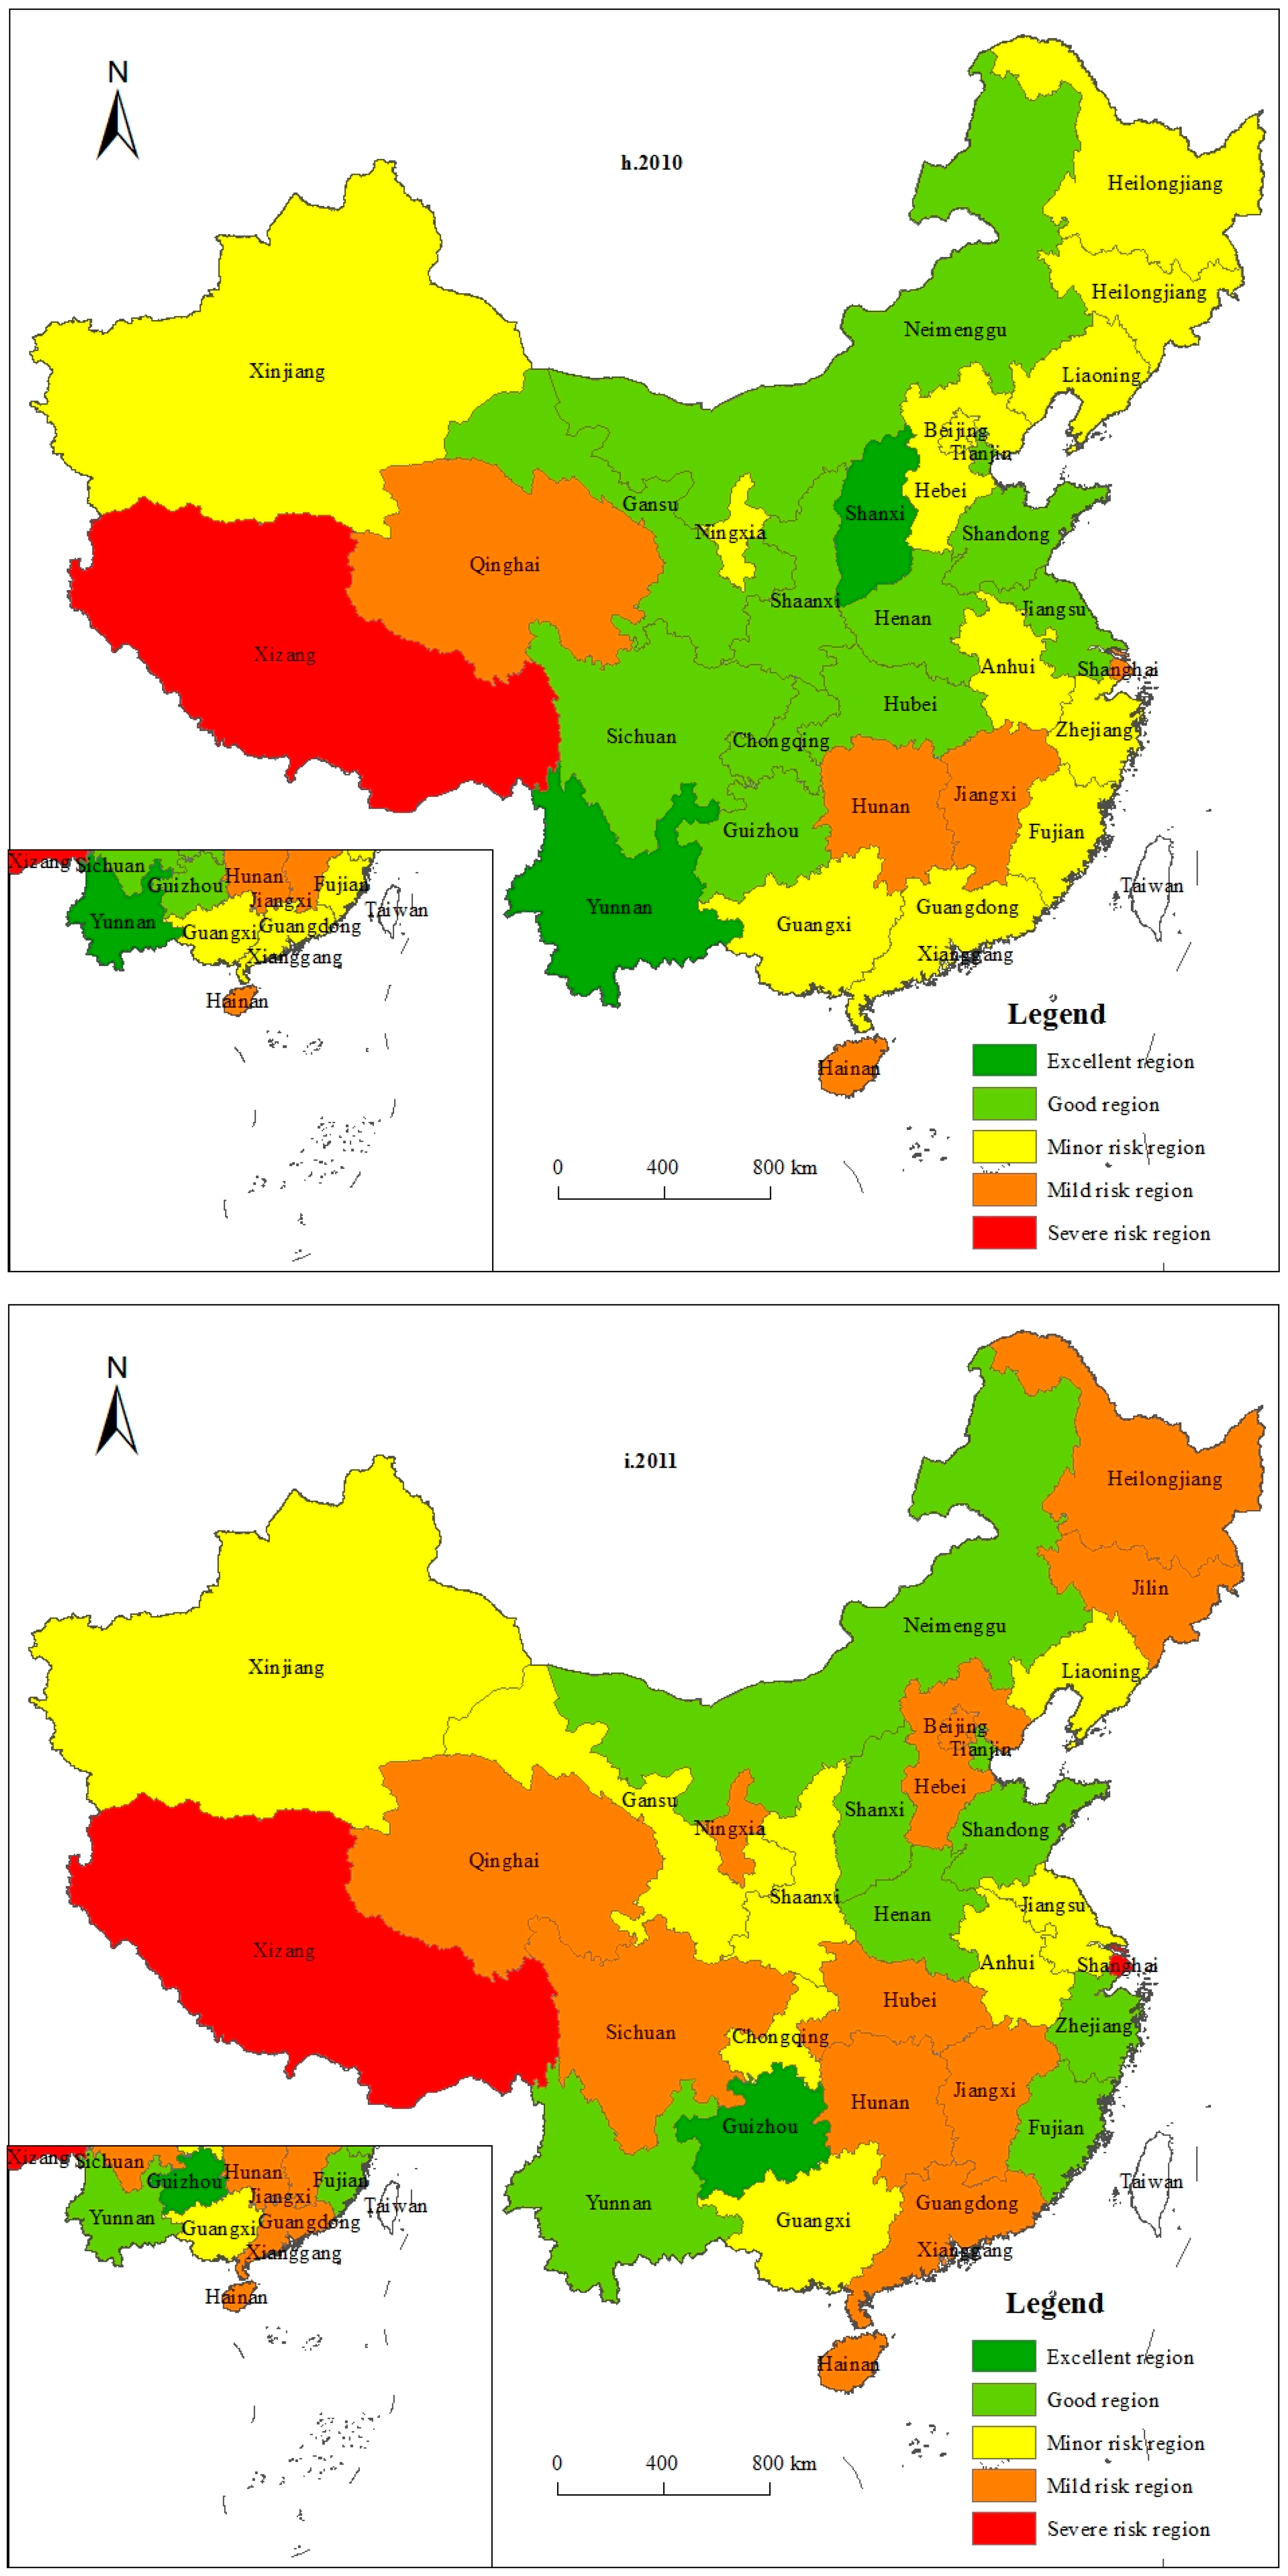
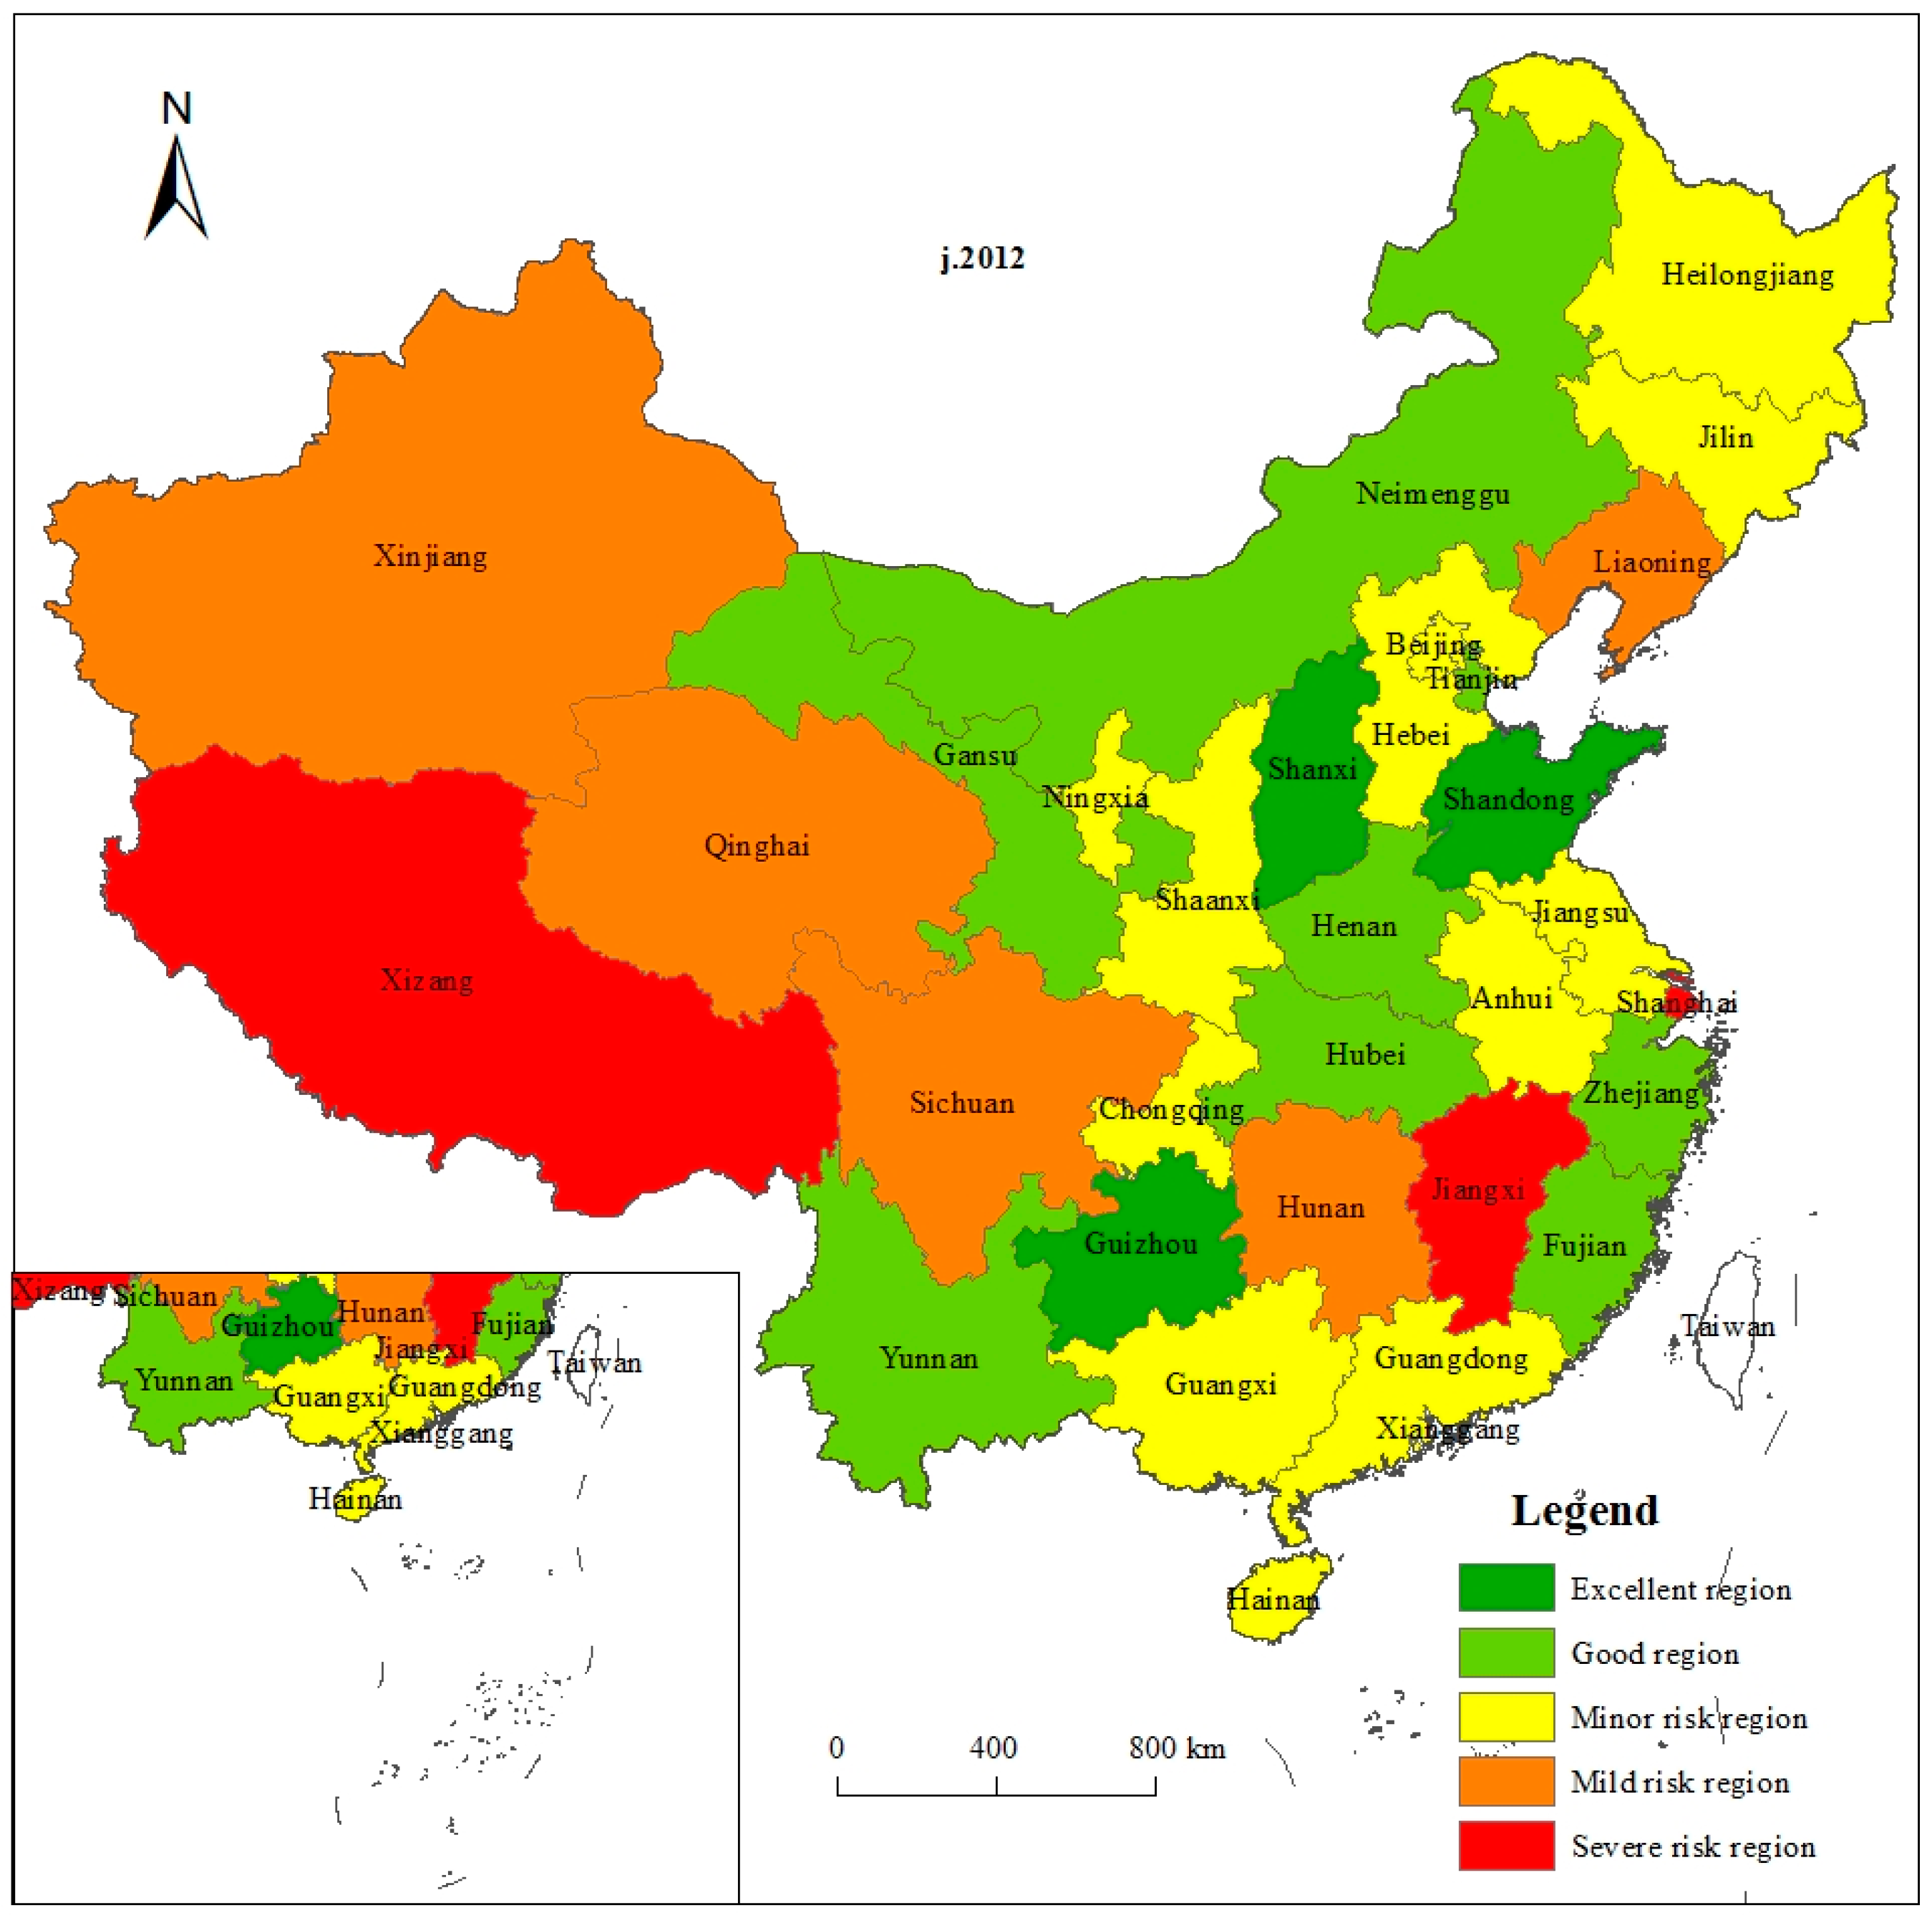
3.2. Spatial Characteristics Analysis of Human Settlement Risks
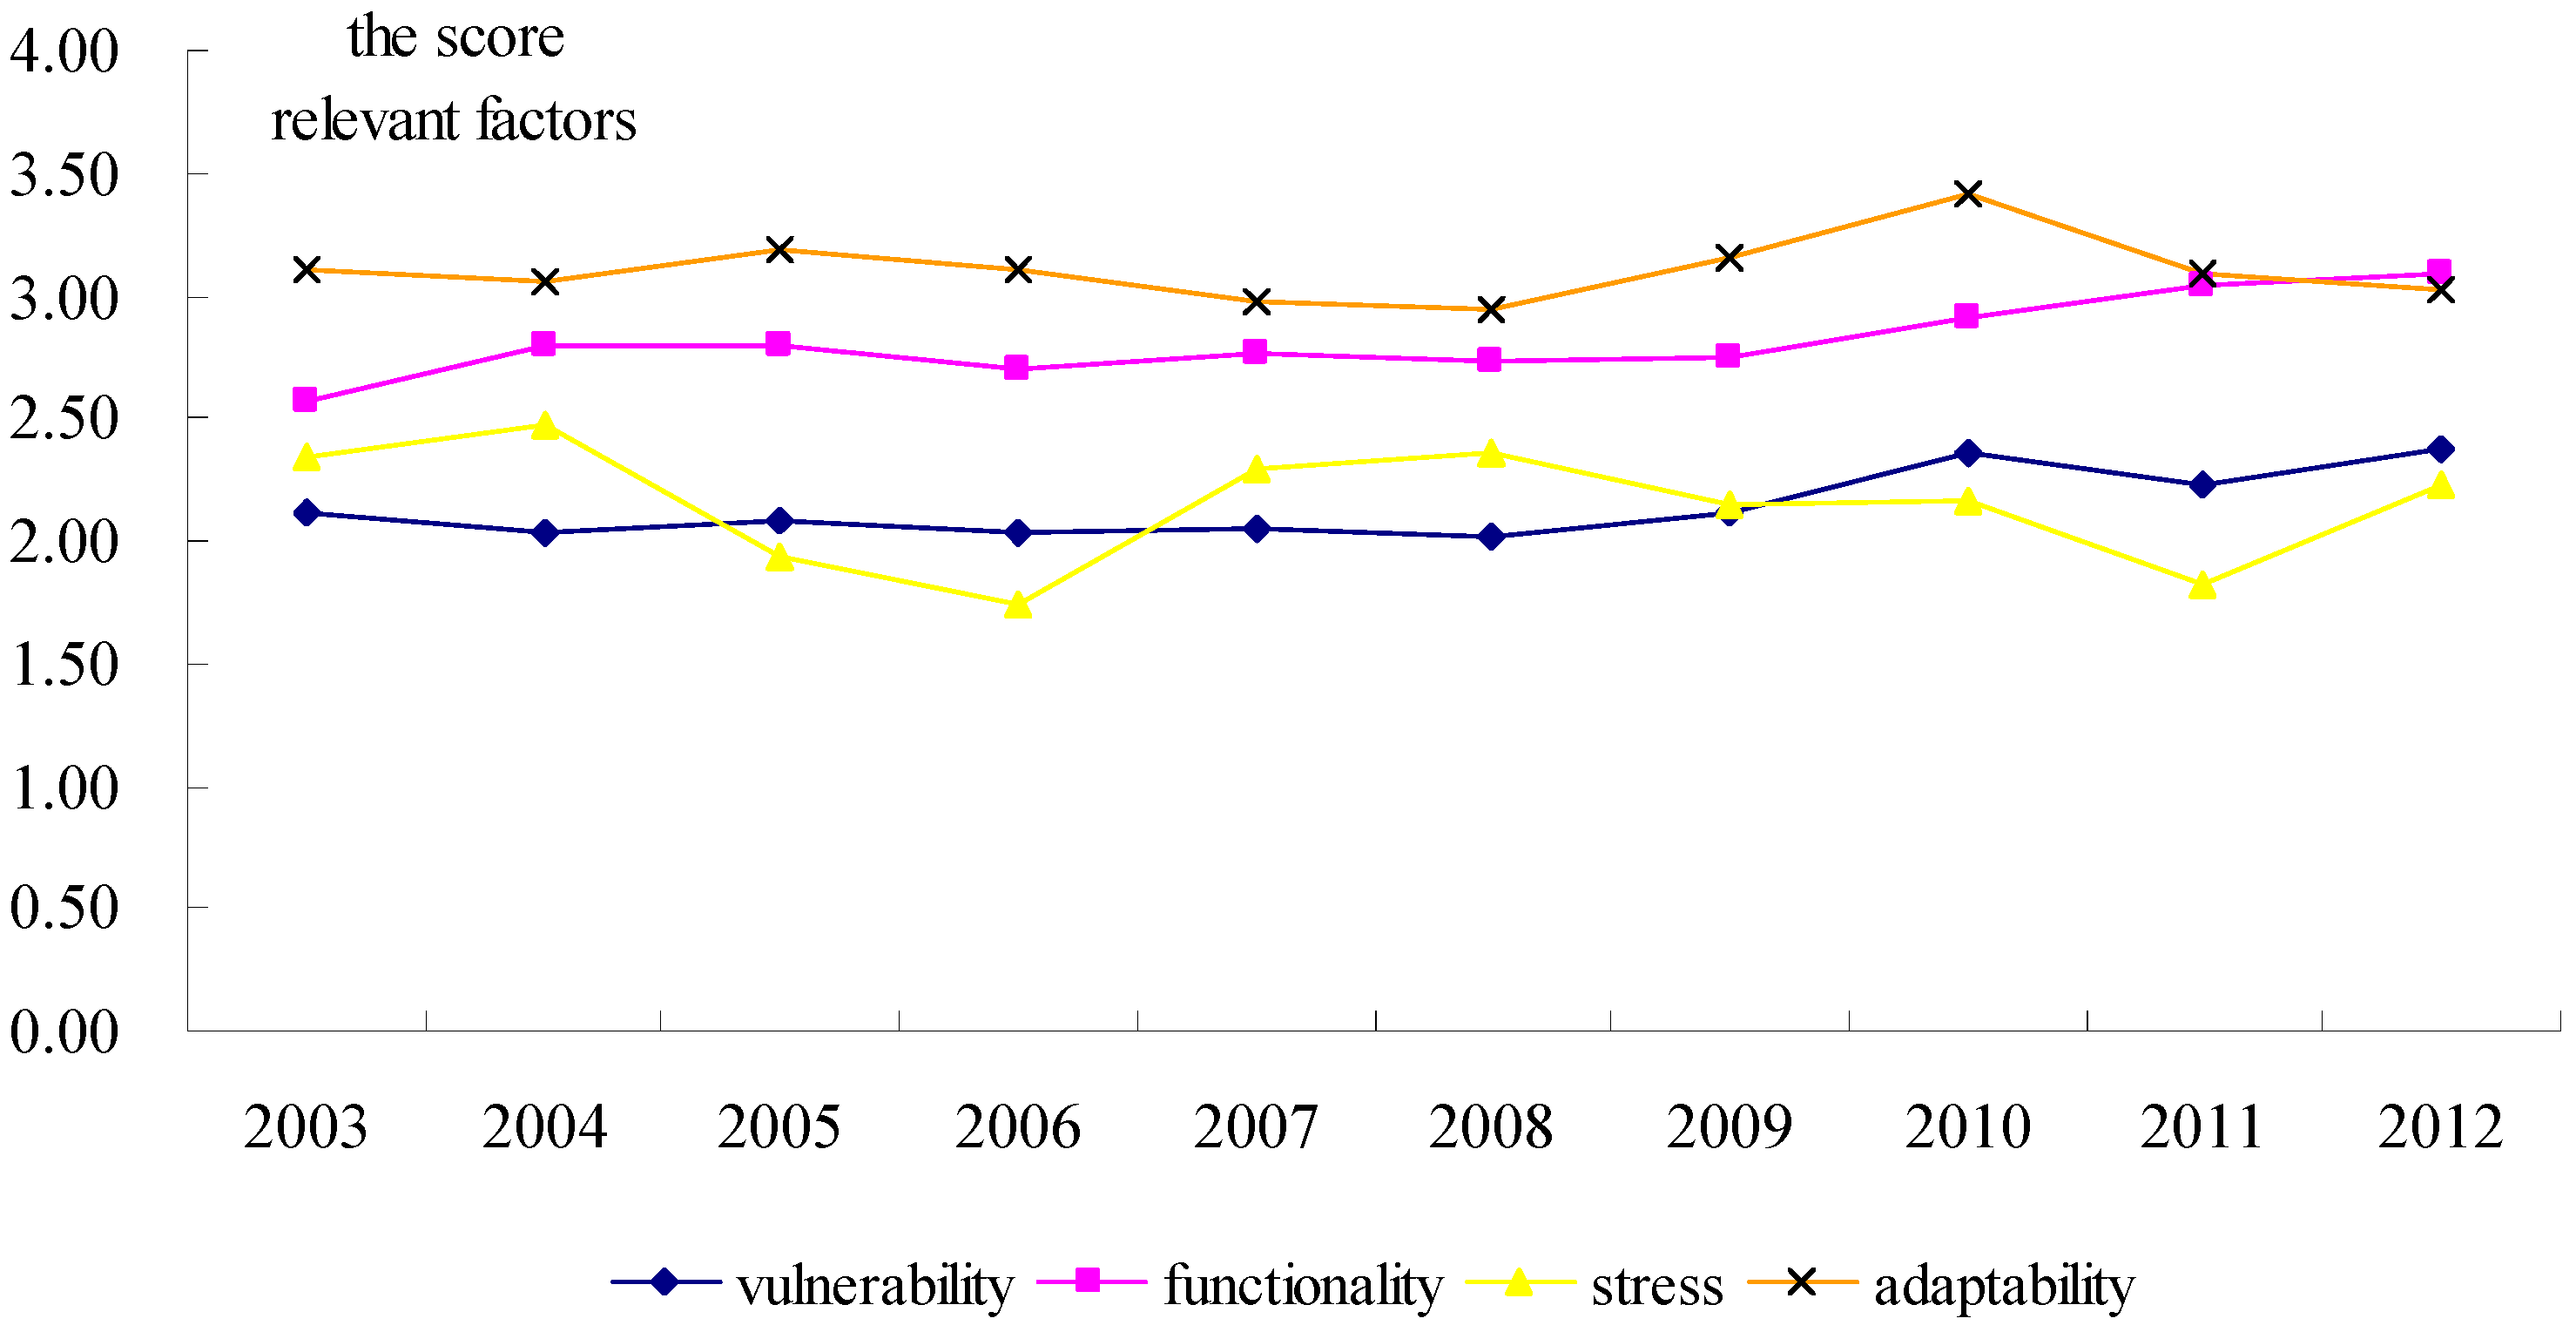
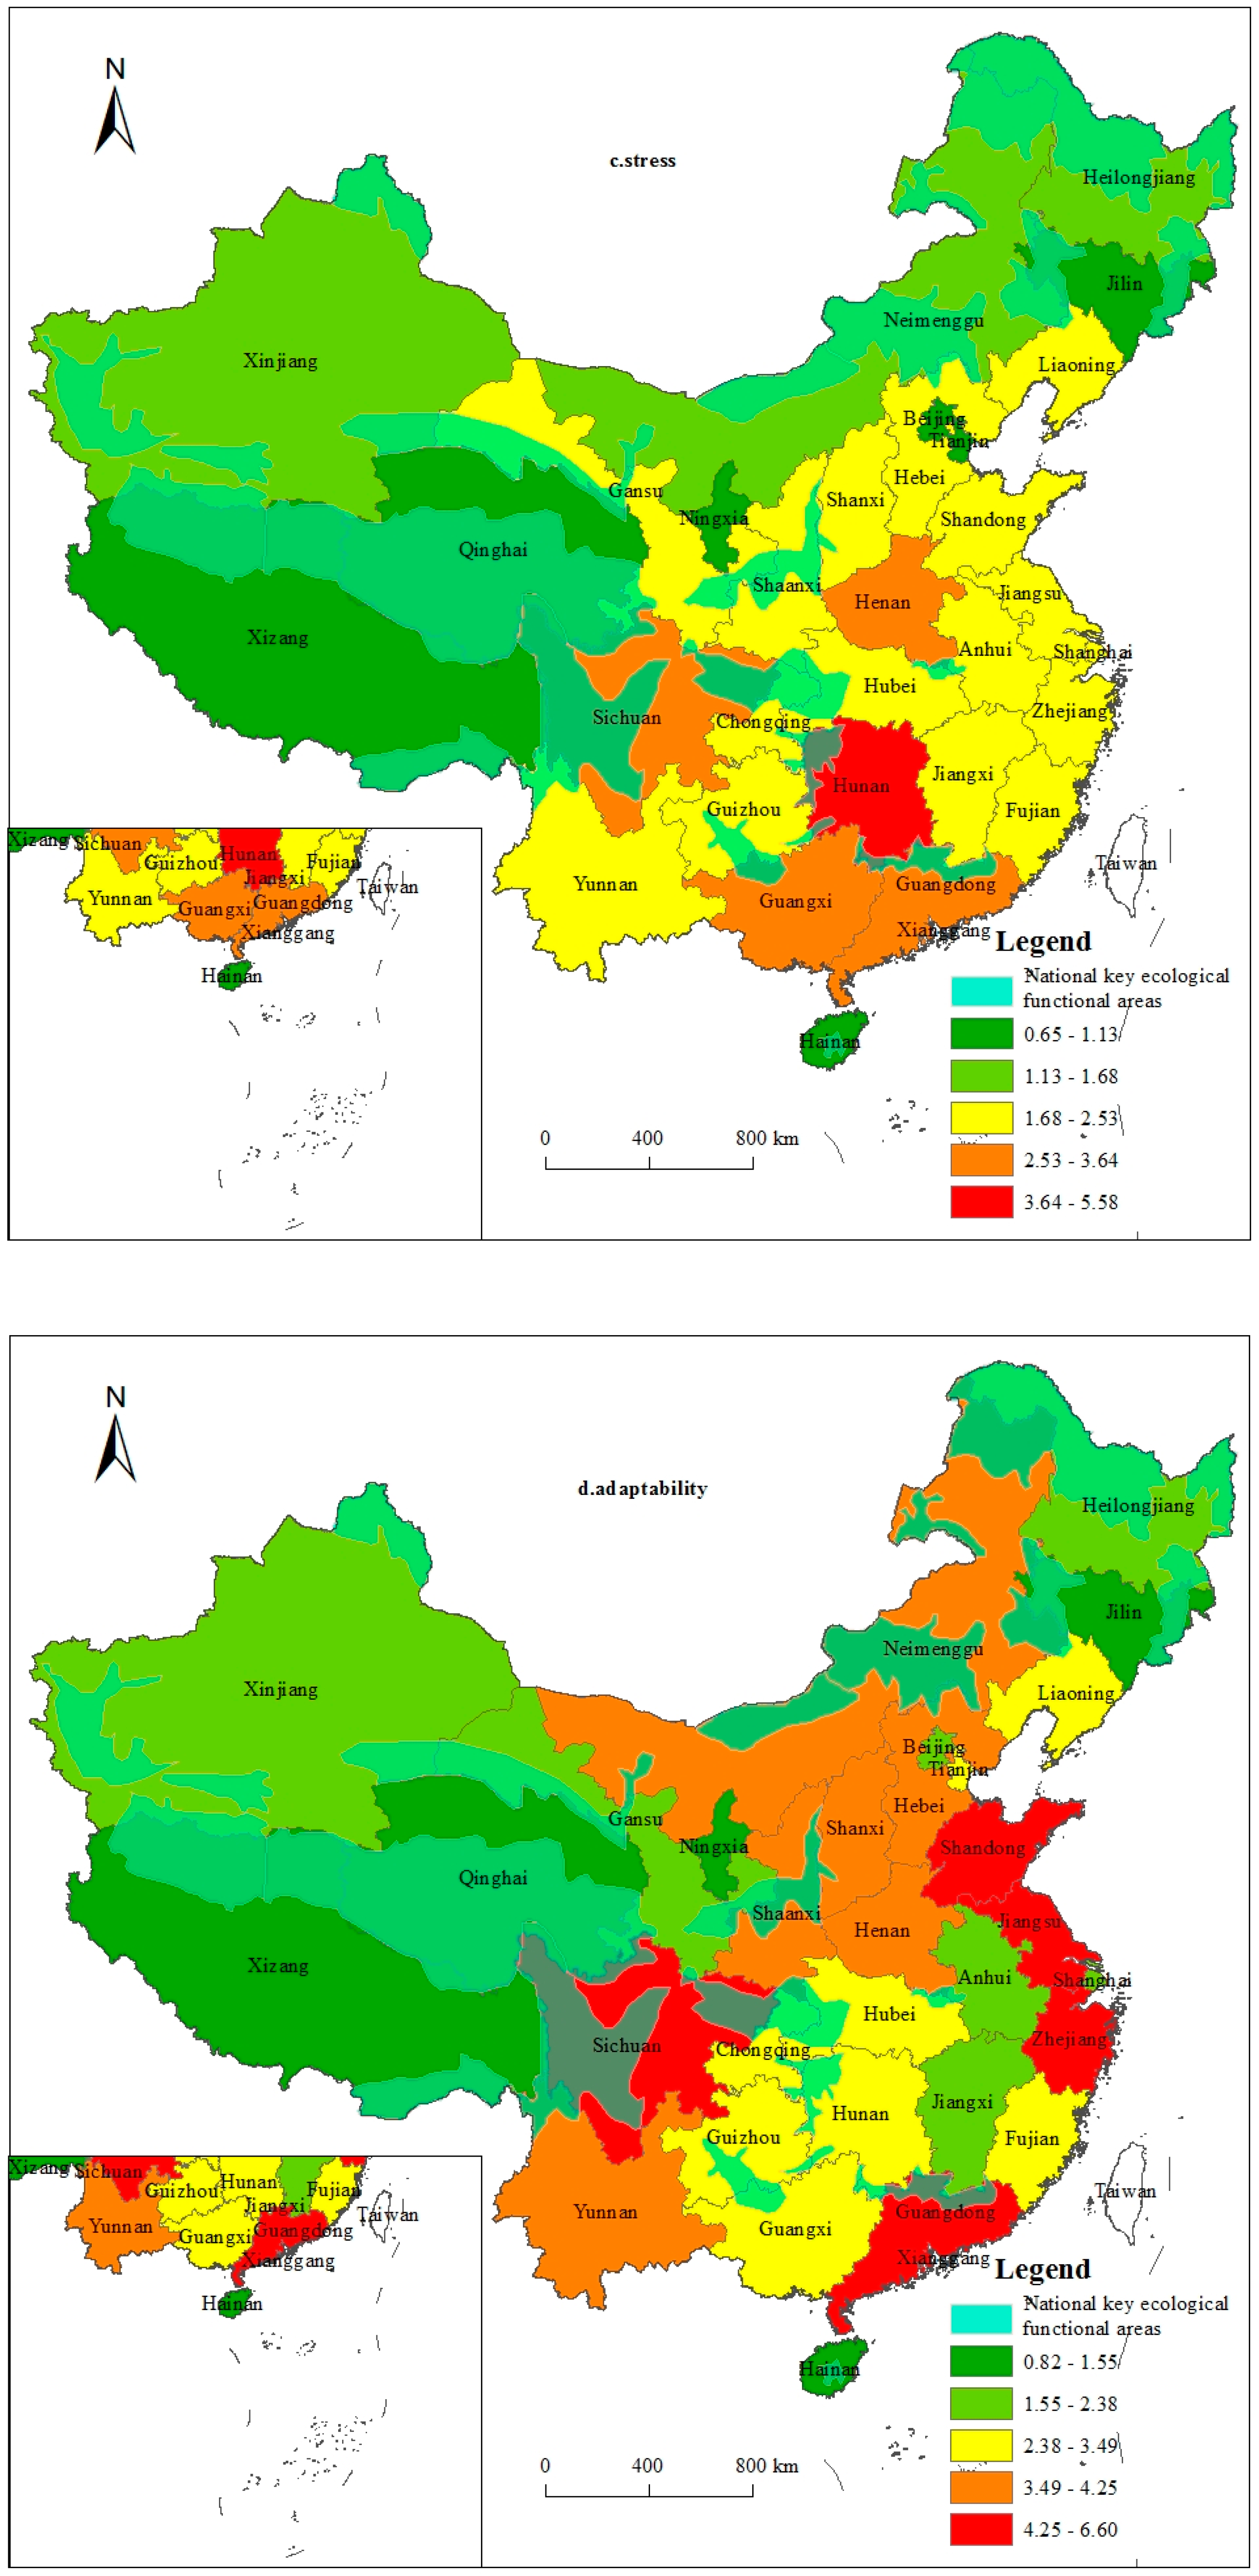
3.3. Relevant Factor Analysis of Human Settlement Risks
- (1)
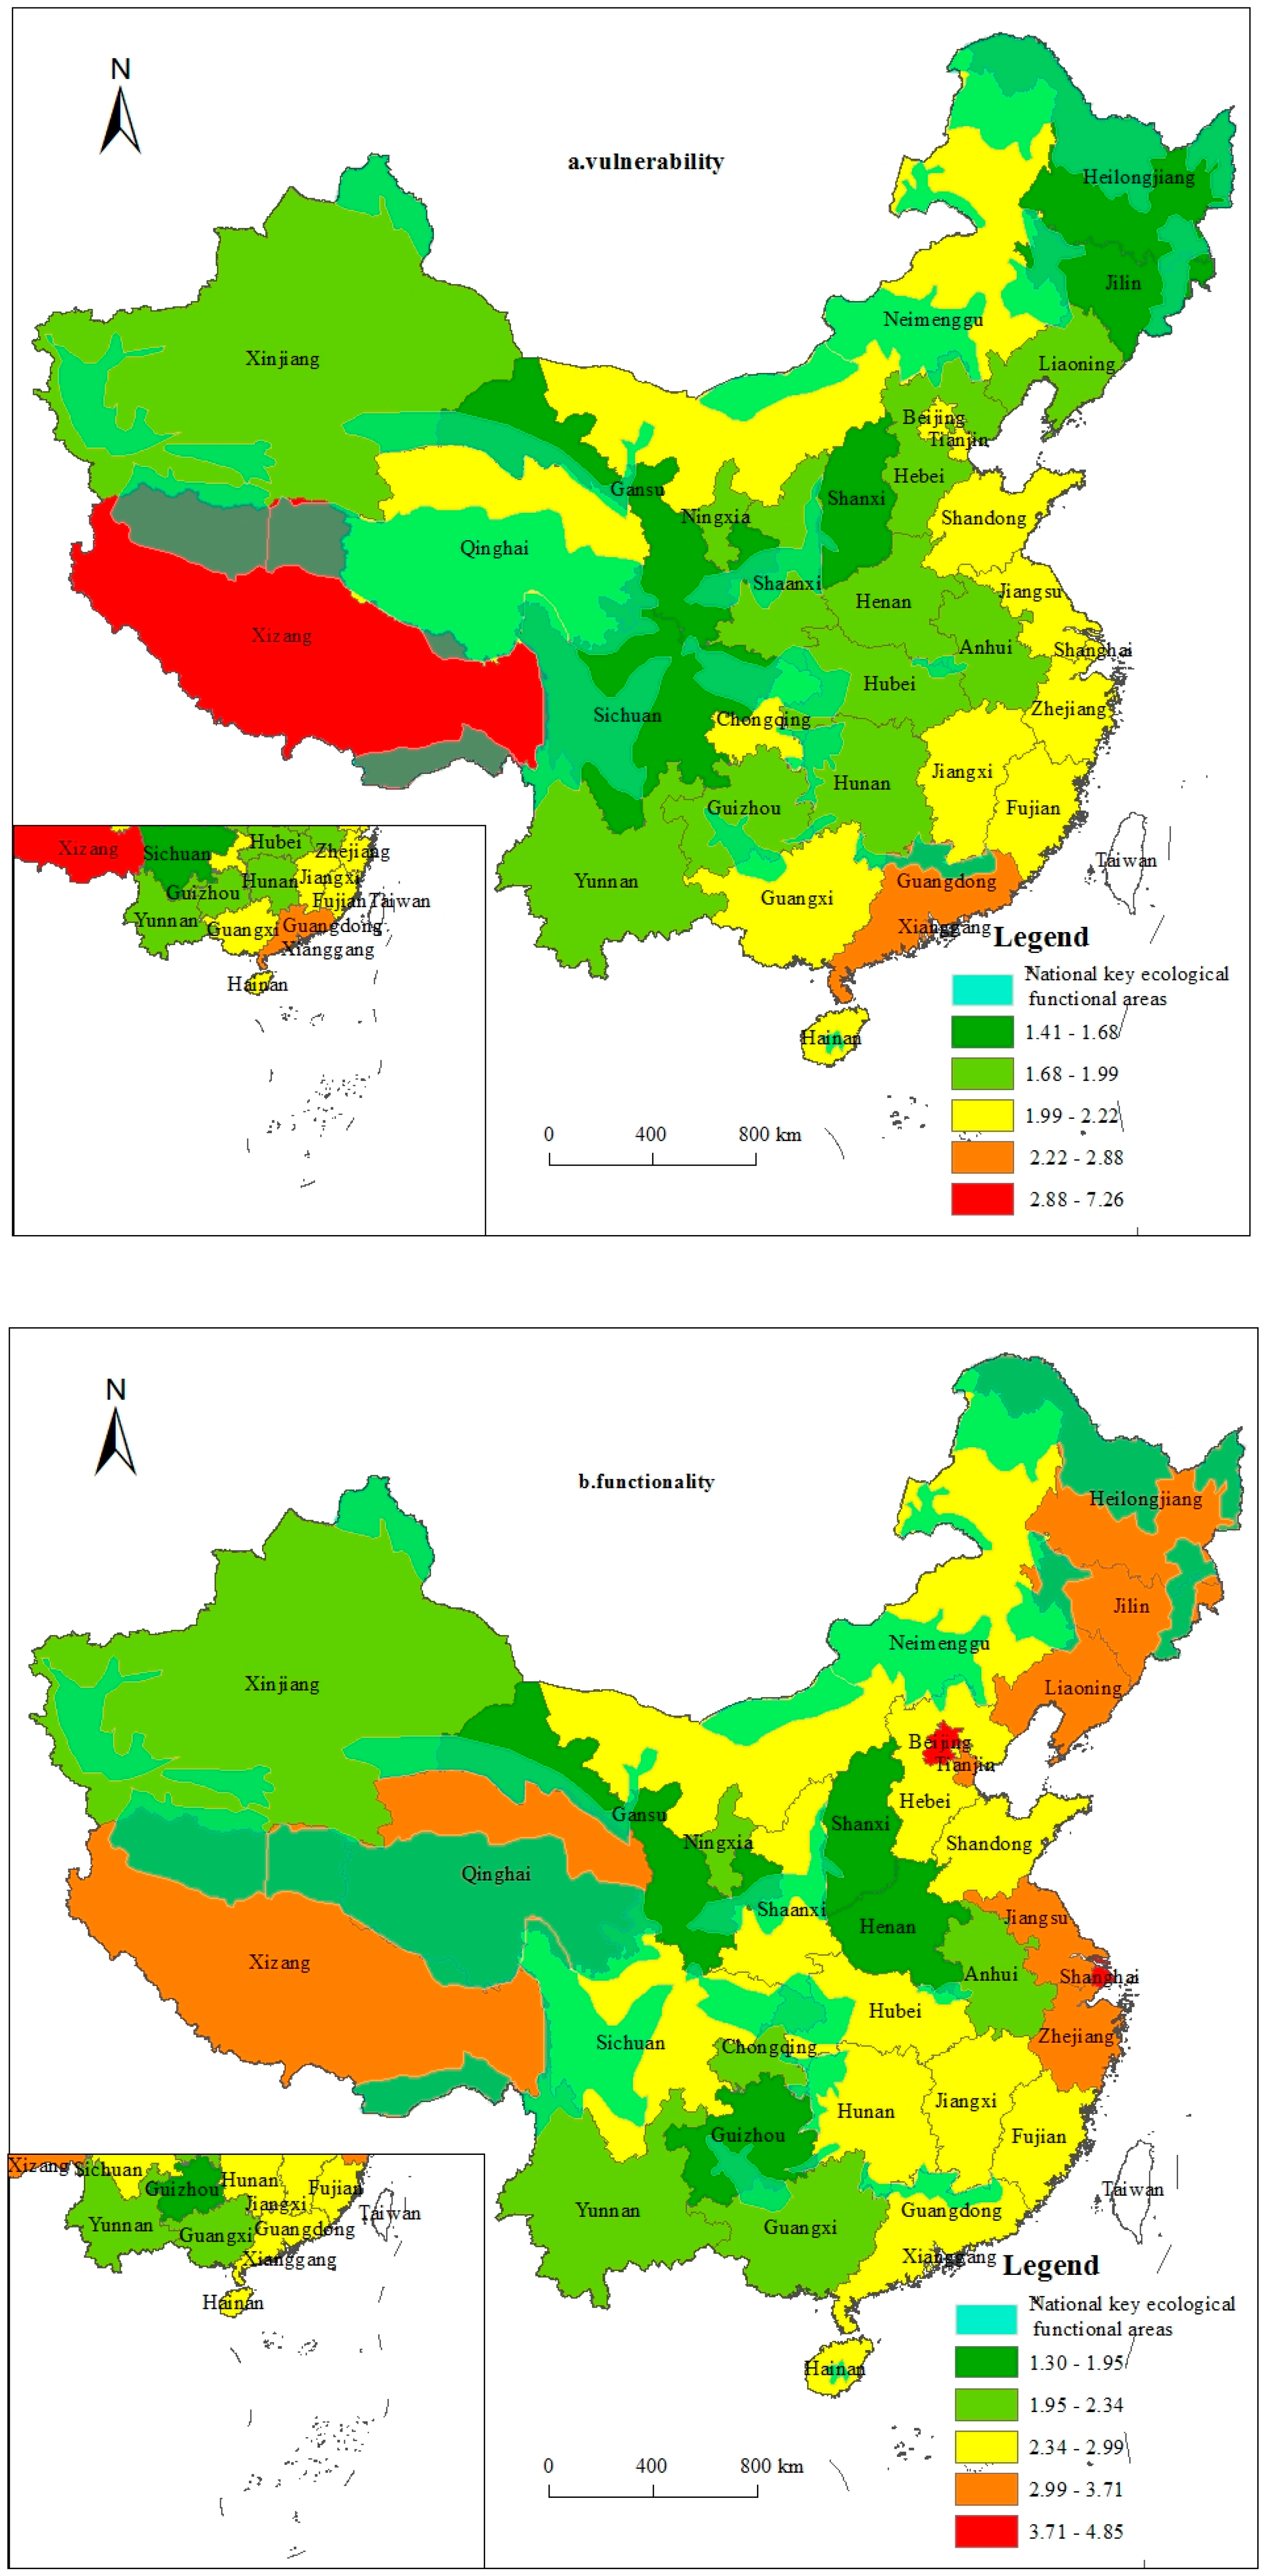
- Vulnerability. The spatial and temporal patterns of the relevant factors of China’s human settlements risk (Figure 7 and Figure 8) show that during 2003–2012, the vulnerability of human settlements was stable and without obvious fluctuation. Its values were between 2.01 and 2.37 with an overall value change range of 0.36.Spatial distribution (Figure 8a) showed that the vulnerability of China’s human settlements was distributed in a scattered fashion but with obvious aggregation in three blocks, namely Tibet and southwestern China, Guangdong and Guangxi region, and Beijing and Tianjin region. According to The National Major Function Oriented Zoning and The National Ecological Function Zoning, the Tibetan area, the forest ecological function region on the edge of the southeastern Tibetan Plateau in southwestern China, Sanjiangyuan Grassland meadow wetland ecological function area, and Ruoergai meadow wetland ecological function area had severe natural geographical environments with complex topographical structures and frequent occurrences of primary disasters. Thus, their human settlements were quite vulnerable. Guangdong, Guangxi, and Hainan areas partially overlapped with ecological function areas for biodiversity at Nanling mountainous forest and the ecological function area at the rainforest in the central mountainous area of Hainan Island. They suffered from frequent occurrences of primary disasters and environmental pollution caused by human activities. Thus, their human settlements were quite vulnerable as well. The meadow ecological function area in the Hulunbeir Grassland of Inner Mongolia, Khorchin meadow ecological function area, and Beilu Grassland meadow ecological function area in Yinshan Mountains were very vulnerable. Human settlements in areas with high population density and exhaust emissions from motor vehicles, like Beijing and Tianjin, also had high vulnerability.
- (2)
- Functionality. According to Figure 7, from the perspective of temporal characteristics, functionality of human settlements from 2003 to 2012 had an overall small uptrend tendency. The changes in values increased from 2.58 in 2003 to 3.09 in 2012, but the overall fluctuation range was not large, with a maximum variation range of 0.51.In terms of spatial patterns (Figure 8b), the functionality of human settlements in eastern China was better than that in central China, which was better than that in western China. According to National Major Function Oriented Zoning, Beijing, Tianjin, Jiangsu, Zhejiang, and other lower reaches of the Yangtze River were parts of state-level optimized development areas with more developed economies, complete urban infrastructure, higher education level per capita, higher environmental protection investment, larger green park areas per capita, and higher plantation coverage rate. Therefore, their functionalities in human settlements evidently were higher. Guizhou is part of an ecological function zone to protect against Guizhou-Yunnan karst rocky desertification and Gansu is part of an important water-supply ecological function area of the Yellow River. The scale development of these regions has been very restricted. Meanwhile, Shanxi and Henan were found to be heavily populated. Education, sanitation, and medical resources in these provinces were relatively poor. In addition, excessive resource development, low forest coverage rate, and significantly decreased protected natural area led to seriously deteriorated environments and low functionality of human settlements.
- (3)
- Stress. According to Figure 7, from the perspective of temporal characteristics, the overall fluctuation in the stress of human settlements was relatively intense and presented evident stage characteristics. The overall curve was similar to a “W” shape, with the largest change value of 0.73.With regard to spatial patterns (Figure 8c), there were no evident block aggregation characteristics in the overall spatial pattern of the stress of human settlements in China. However, the stress of Hunan and Sichuan was higher than that of other provinces in China. In particular, the stress of Hunan was eight times higher than that of the lowest province, because there were 1041 emerging environmental incidents in total in Hunan from 2003 to 2007, which was significantly higher compared to other provinces. Geological disasters occurred in 119,571 places in Hunan, while 25,404 such disasters occurred in Sichuan. Therefore, the stress of human settlements in these regions was relatively high.
- (4)
- Adaptability. According to Figure 7, from a perspective of temporal characteristics, the adaptability values were relatively high and were significantly higher than those of vulnerability, functionality, and stress. The overall change of adaptability was relatively stable, presenting a slight decreasing tendency, and its value changes decreased from 3.11 in 2003 to 3.02 in 2012.In terms of spatial patterns (Figure 8d), the overall adaptability of human settlements in eastern China was better than that of central China, which was better than that of western China, except for Sichuan. Guangzhou, Jiangsu, and Zhejiang in eastern China had relatively strong economies, and they invested more in environmental protection and non-pollution treatments of solid waste. Therefore, the adaptability of human settlements in these regions was relatively high. Because the government had carried out ecological environmental management in mining areas in previous years in Shanxi, Shaanxi, and Inner Mongolia, and investment proportions in industrial pollution control projects and environmental protection had increased significantly, the adaptability of human settlements also improved significantly. By initiating projects in Sichuan and Yunnan, like enlarging forest areas and ecological restoration and protection, the adaptability of human settlements has improved consistently.
4. Discussion and Conclusions
- (1)
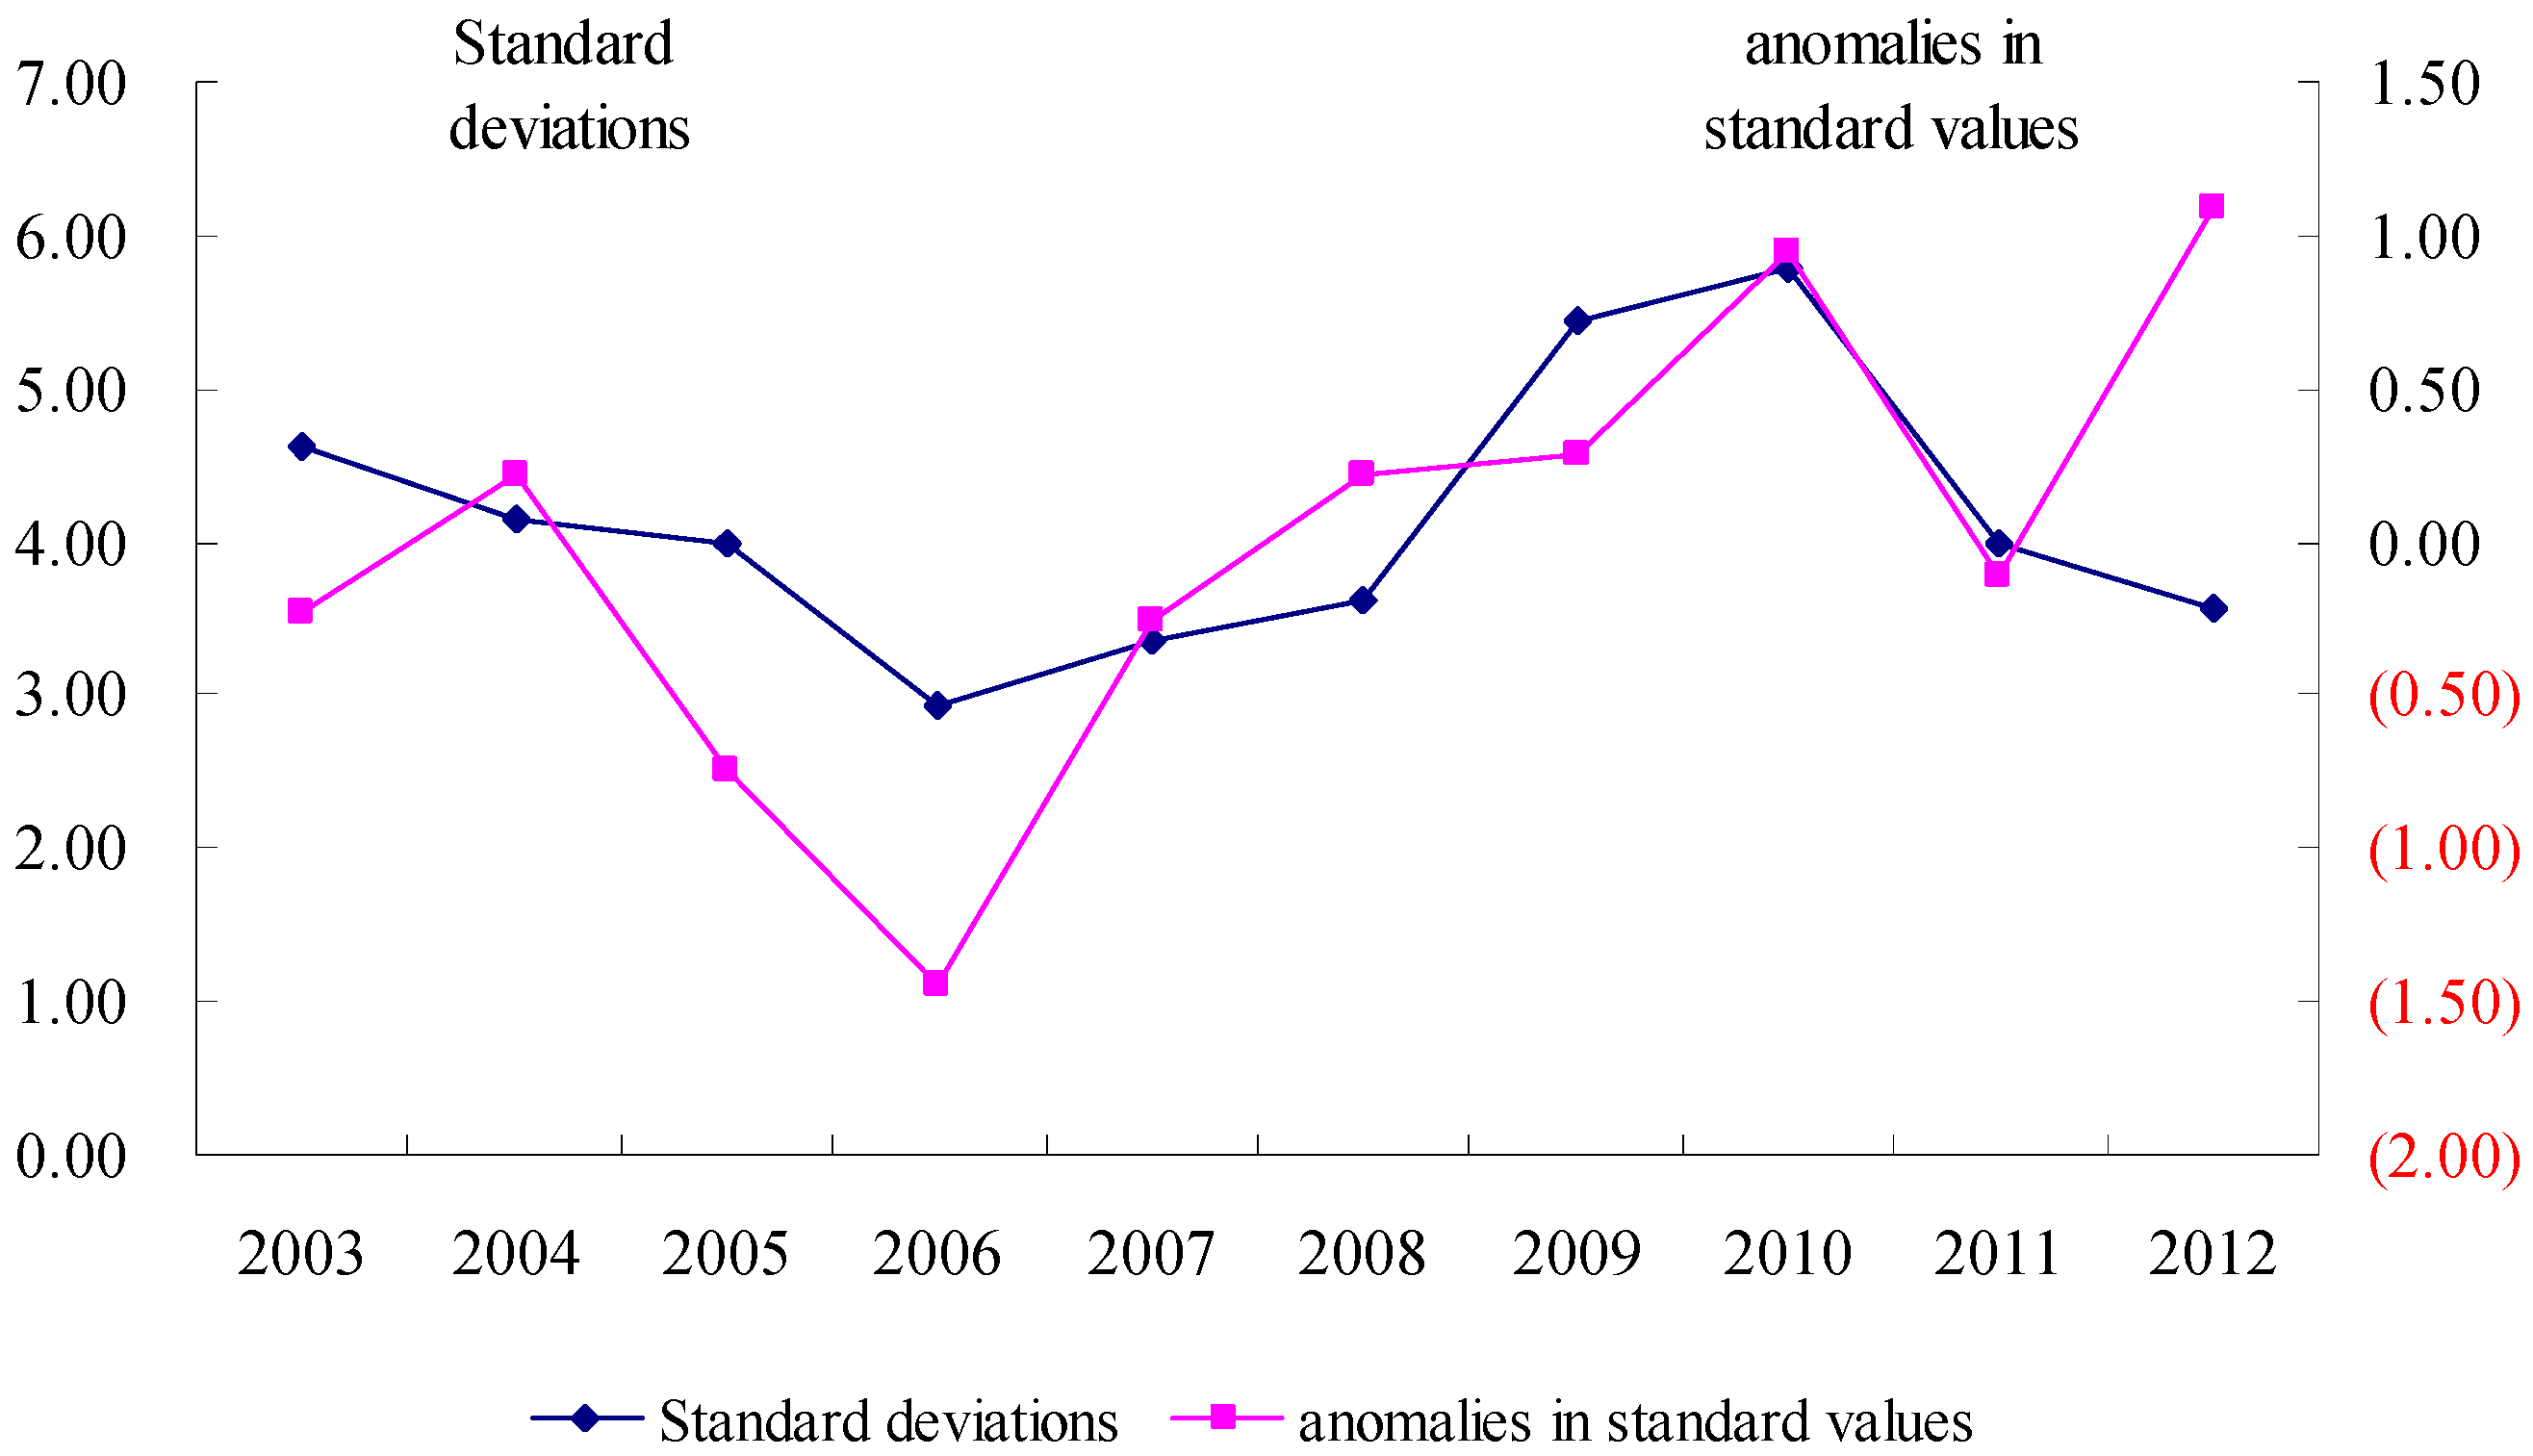
- With regard to temporal characteristics, environmental risks of human settlements in China showed a fluctuating uptrend from 2003 to 2012. The year 2006 marked both a sudden change and a cut-off point when the standard deviations of human settlements reached a trough of 2.94, and the anomalies in standard values also reached a trough of −1.45. After 2006, the uptrend of human settlement risk in China became more obvious, indicating qualitative changes and new risks.
- (2)
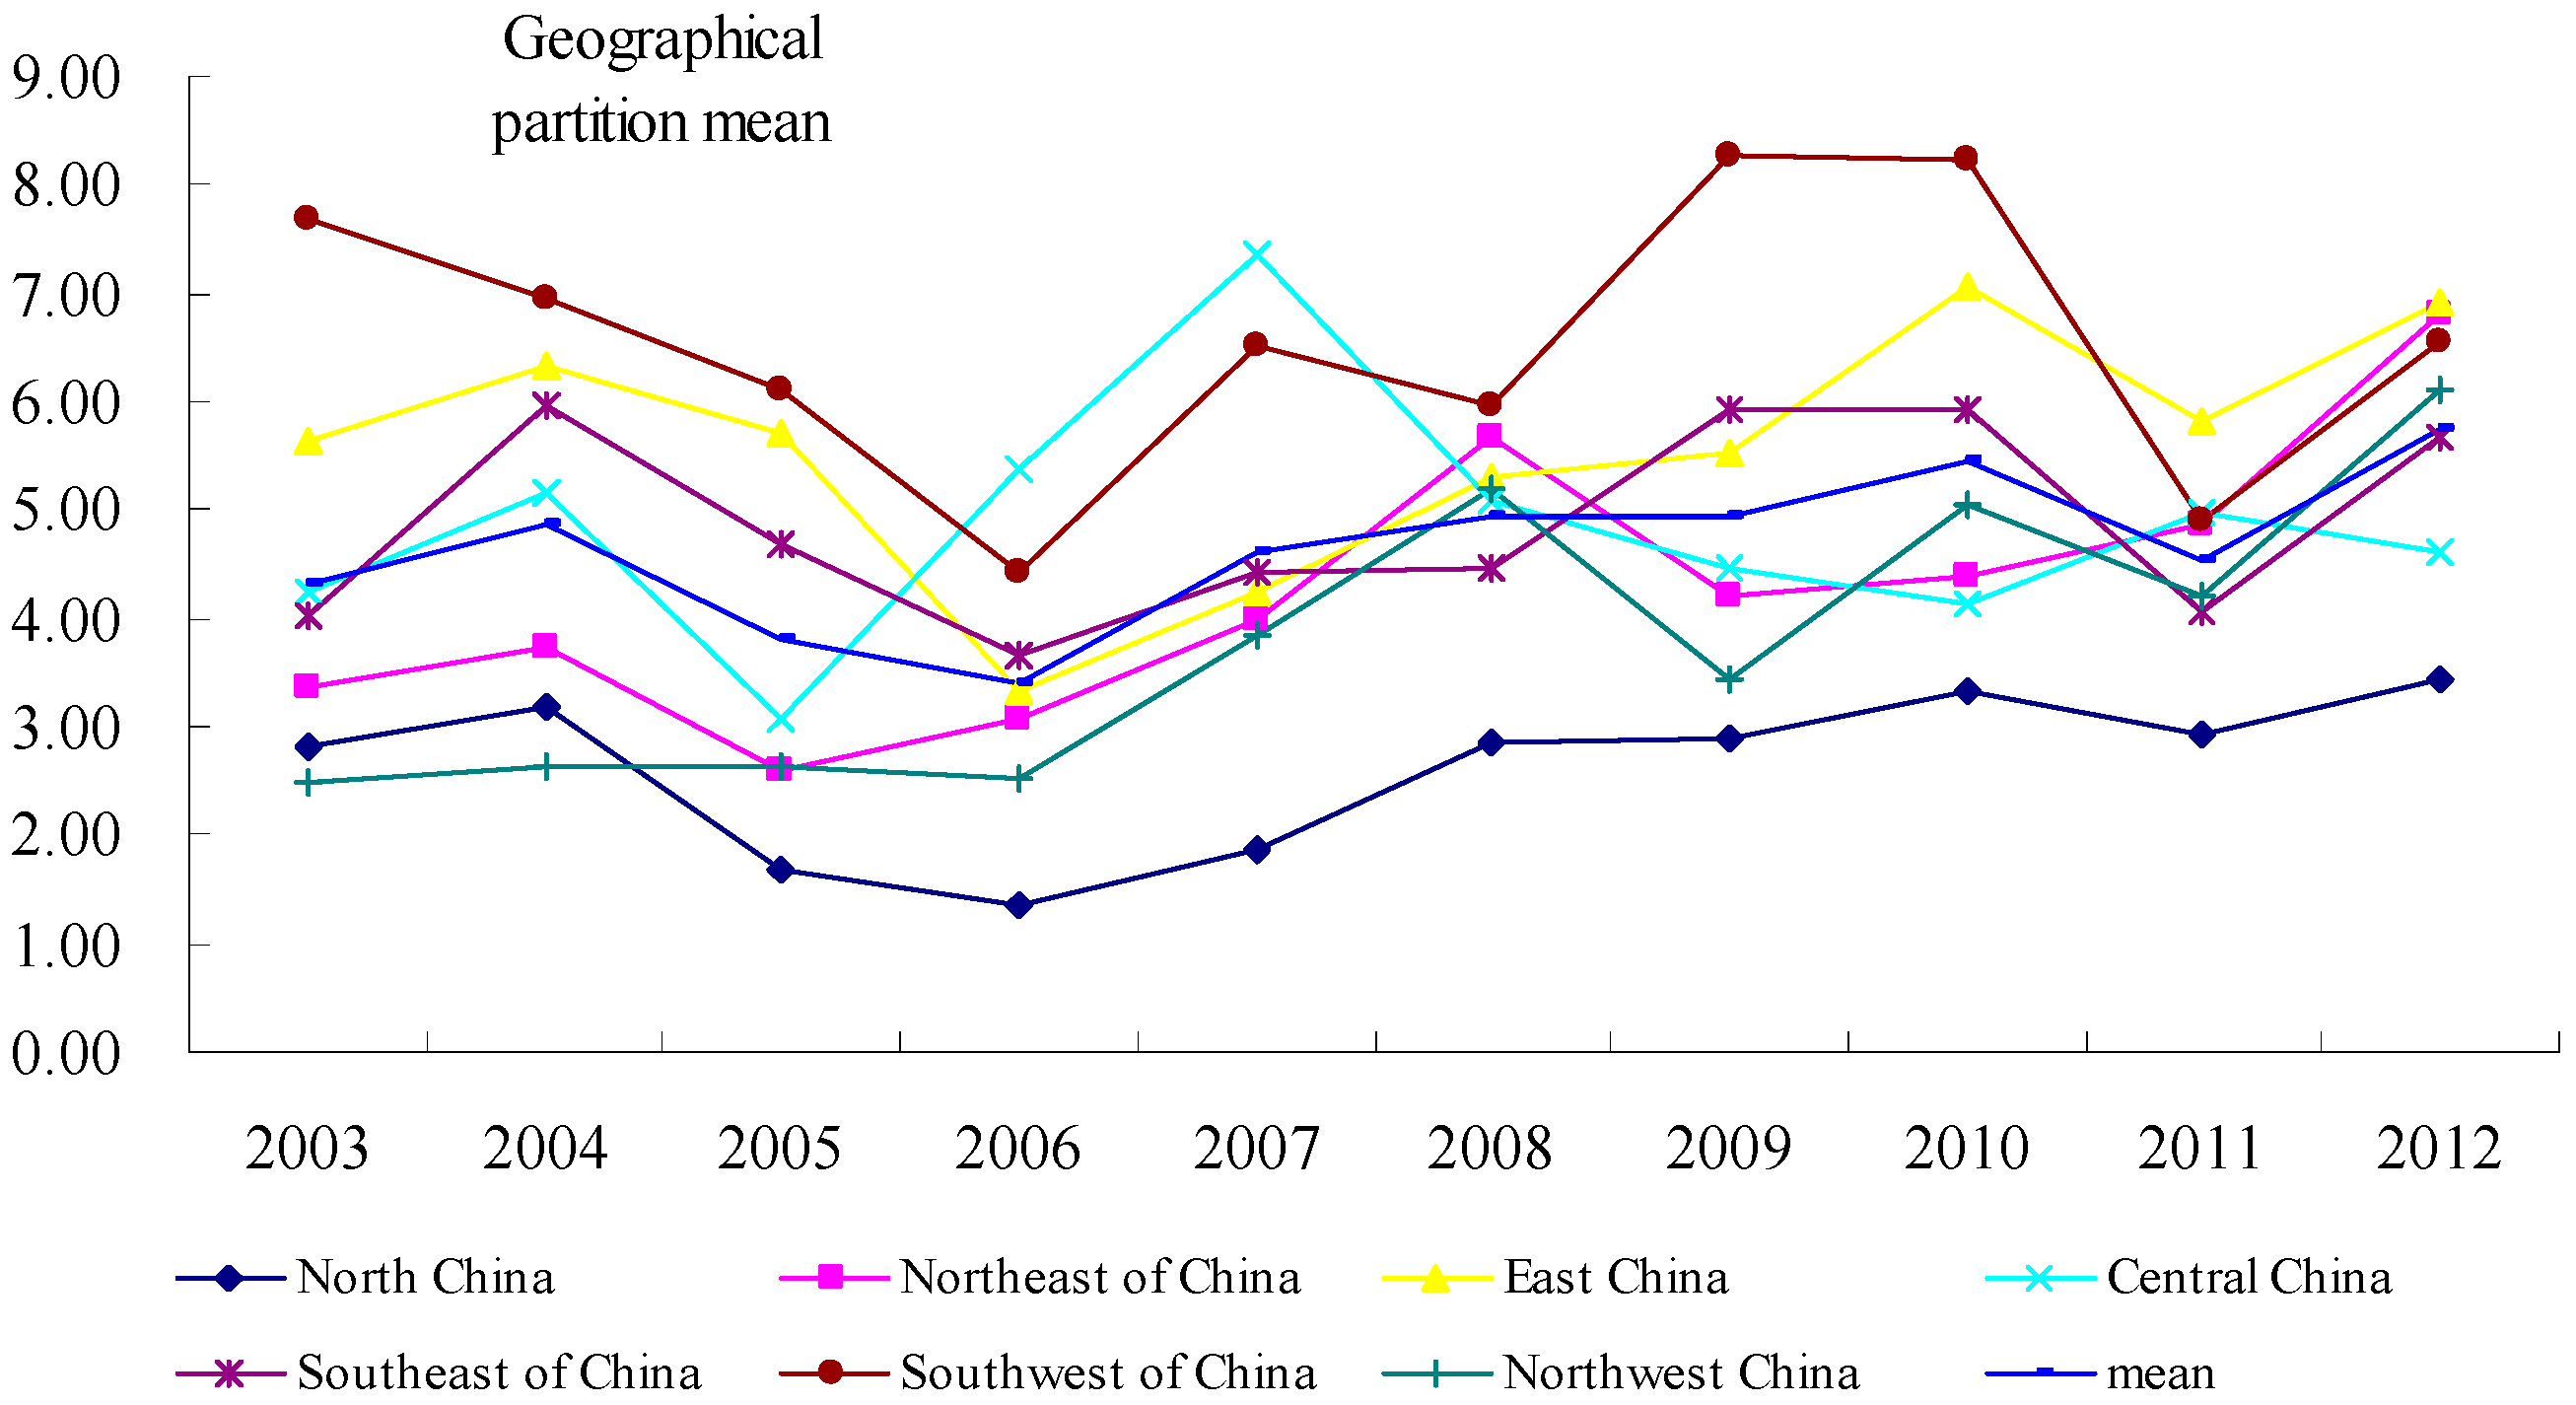
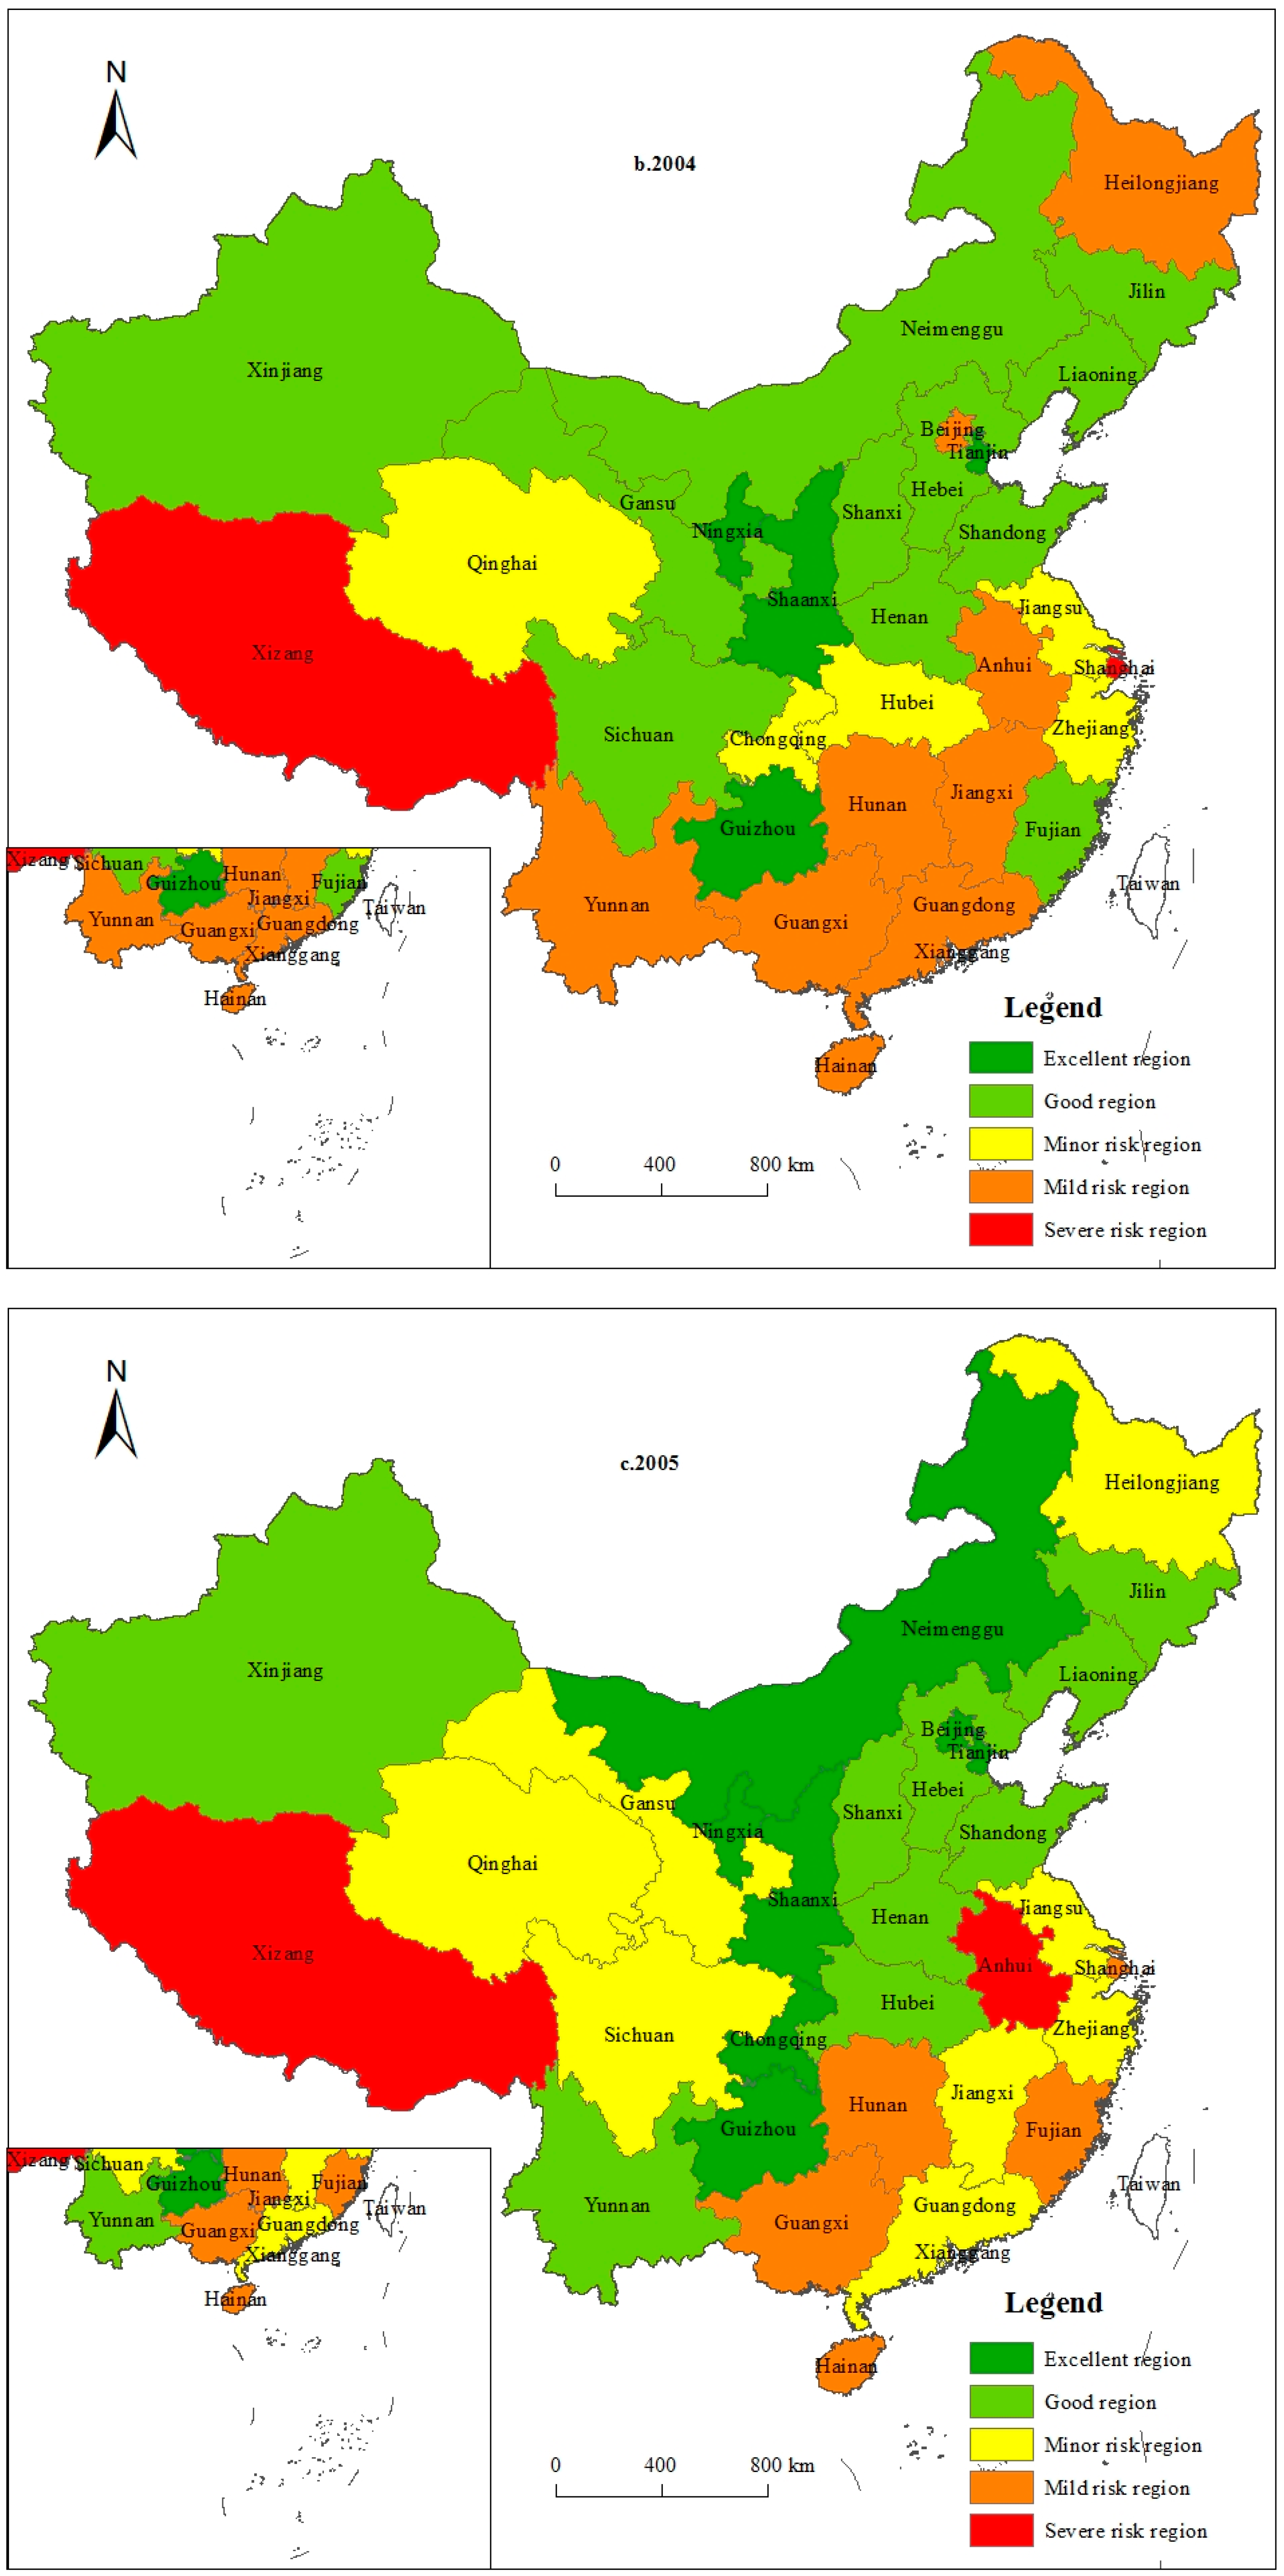
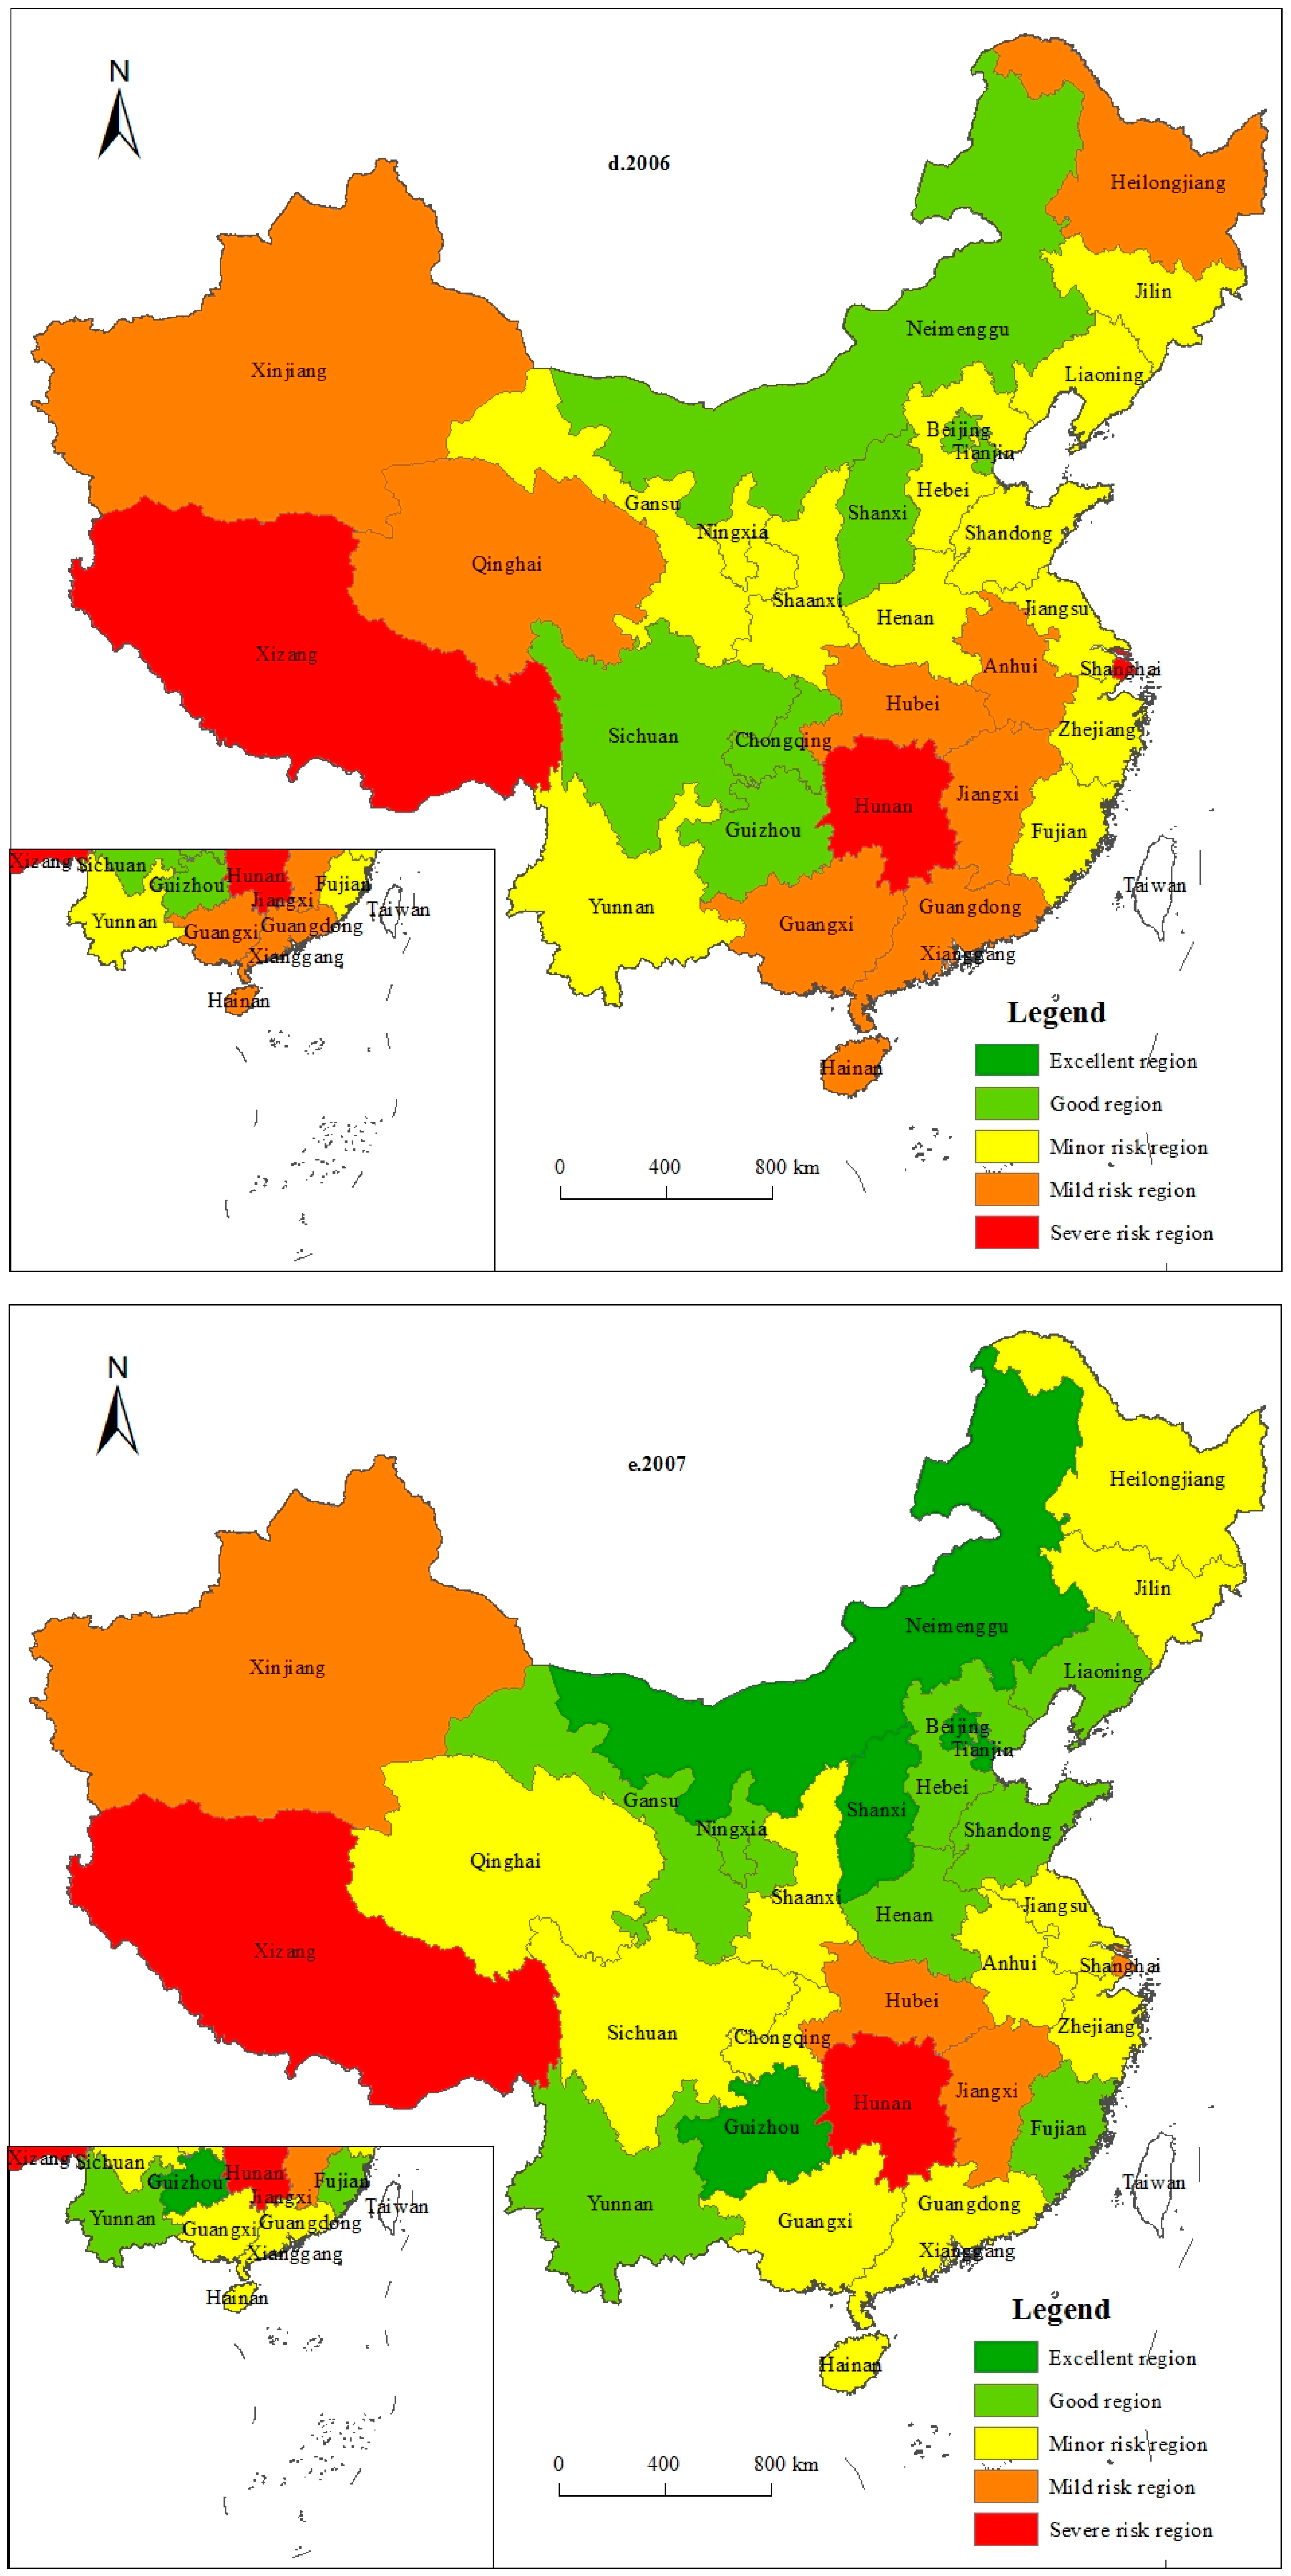
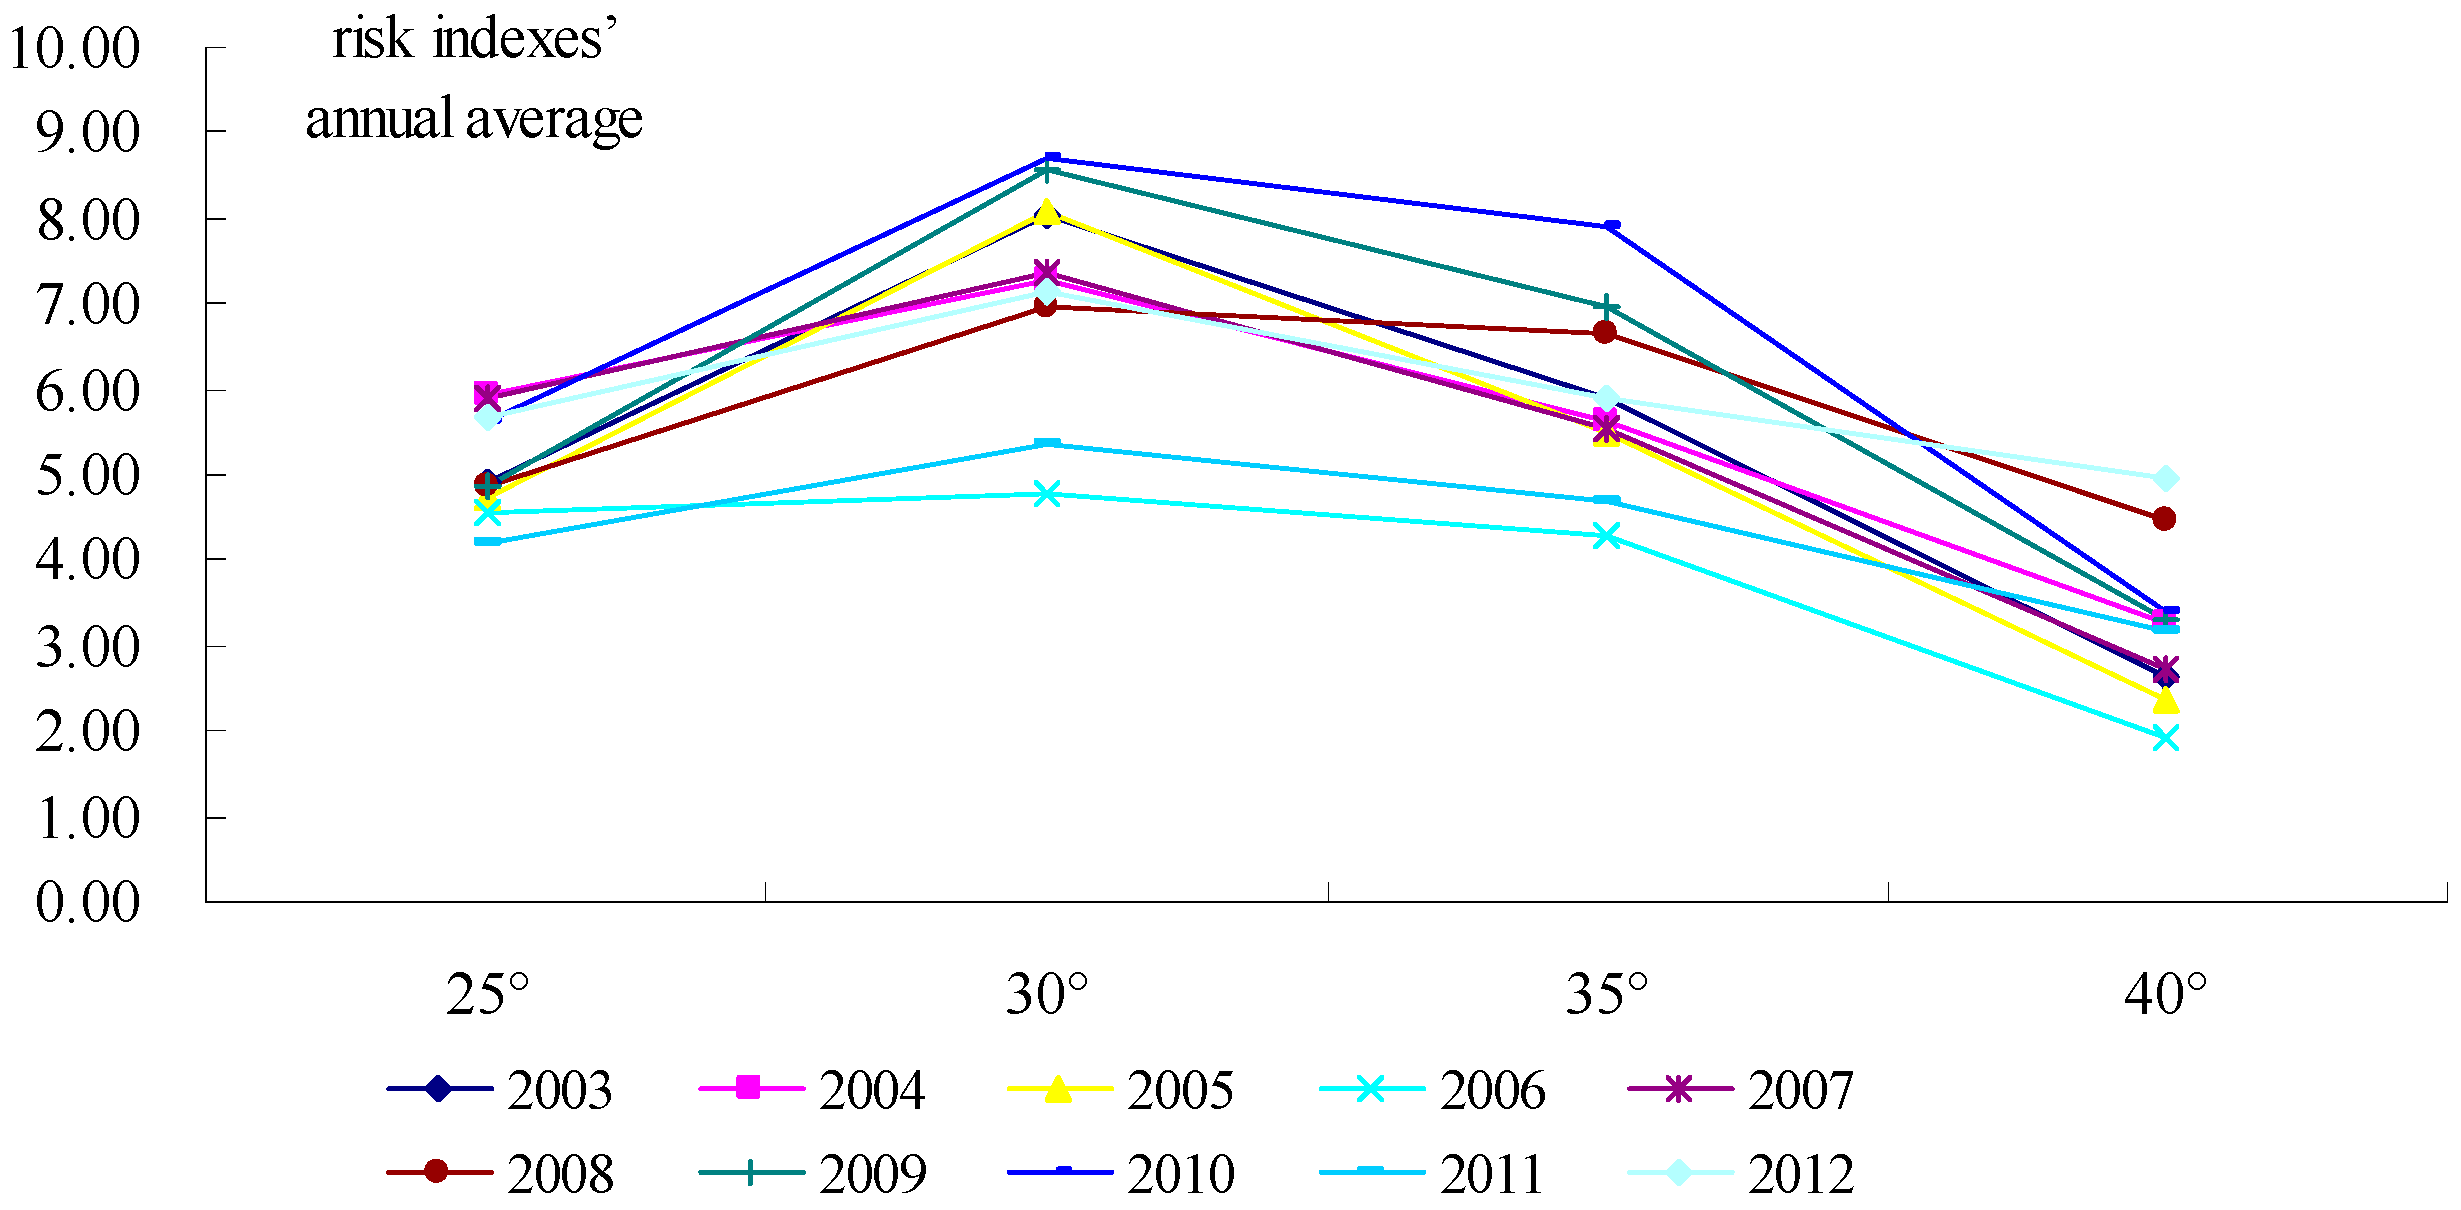
- In terms of overall spatial characteristics, the risk indexes of human settlements in China gradually decreased from southwestern to northeastern, northwestern, and northern China. Special differences in the risk indexes of human settlements were significant, with obvious block aggregation of spatial-distribution characteristics among regions of different types at the national scale. In the latitudinal distribution, the risk decreased progressively on the two sides at 30°N. The longitudinal distribution shifted from 90°E to the three longitudes in the middle and eastern parts of China.
- (3)
- With regard to relevant factor characteristics, from 2003 to 2012, the temporal change in vulnerability was relatively stable and fluctuation was not very obvious, with values from 2.03 to 2.37 and an overall range of change of 0.34. A slight increase in functionality was observed, with values increasing from 2.58 in 2003 to 3.09 in 2012. However, the overall fluctuation range was not large and the largest change in values was 0.51. The overall fluctuation in stress of human settlements was relatively large; it presented evident stage characteristics and had a near “W”-shaped characteristic, with the largest variation range of 0.73. The adaptability values were higher than those of vulnerability, functionality, and stress. The overall adaptability change was relatively stable although a slight decrease was observed from 3.11 in 2003 to 3.02 in 2012. Spatially, vulnerability was distributed dispersedly but the block aggregation characteristics were evident. There were three blocks: first, Qinghai, Tibet, and southwestern China; second, Guangdong and Guangxi; and third, Beijing and Tianjin. The Beijing and Tianjin region and the Jiangsu and Zhejiang region had the best functionality. Hunan and Sichuan had relatively high stress. Shandong, Jiangsu, Zhejiang, Guangdong, and Sichuan had relatively strong adaptability in human settlements.
Acknowledgments
Author Contributions
Conflicts of Interest
References
- Tang, Z.; Wu, C.Z.; Xie, B.; Lu, L.J. Research progress of regional environmental risk assessment. Adm. Tech. Environ. Monit. 2012, 24, 8–11. [Google Scholar]
- Peng, W.M.Z. Review of the methods of environmental risk assessment in different levels. Environ. Sci. Manag. 2009, 34, 170–173. [Google Scholar]
- He, G.Z.; Lv, Y.L. Risk management approaches for environmental and human health risks in the United States and Canada. Acta Ecol. Sin. 2011, 31, 556–564. [Google Scholar]
- De Vries, P.; Tamis, J.E.; Foekema, E.M.; Klok, C.; Murk, A.J. Towards quantitative ecological risk assessment of elevated carbon dioxide levels in the marine environment. Mar. Pollut. Bull. 2013, 73, 516–523. [Google Scholar] [CrossRef] [PubMed]
- Maanan, M.; Saddik, M.; Maanan, M.; Chaibi, M.; Assobhei, O.; Zourarah, B. Environmental and ecological risk assessment of heavy metals in sediments of Nador lagoon, Morocco. Ecol. Indic. 2015, 48, 616–626. [Google Scholar] [CrossRef]
- Andrieu, M.; Rico, A.; Phu, T.M.; Huong, D.T.T.; Phuong, N.T.; Van den Brink, P.J. Ecological risk assessment of the antibiotic enrofloxacin applied to Pangasius catfish farms in the Mekong Delta, Vietnam. Chemosphere 2015, 119, 407–414. [Google Scholar] [CrossRef] [PubMed]
- Gamarra, J.S., Jr.; Godoi, A.F.L.; de Vasconcelos, E.C.; de Souza, K.M.T.; de Oliveira, C.M.R. Environmental Risk Assessment (ERA) of diclofenac and ibuprofen: A public health perspective. Chemosphere 2015, 120, 462–469. [Google Scholar] [CrossRef] [PubMed]
- Lim, Y.W.; Kim, H.H.; Lee, C.S.; Shin, D.C.; Chang, Y.S.; Yang, J.Y. Exposure assessment and health risk of poly-brominated diphenyl ether (PBDE) flame retardants in the indoor environment of elementary school students in Korea. Sci. Total Environ. 2014, 470, 1376–1389. [Google Scholar] [CrossRef] [PubMed]
- Ragas, M.J.; Oldenkamp, R.; Preeker, N.L.; Wernicke, J.; Schlink, U. Cumulative risk assessment of chemical exposures in urban environments. Environ. Int. 2011, 37, 872–881. [Google Scholar] [CrossRef] [PubMed]
- Morisset, T.; Ramirez-Martinez, A.; Wesolek, N.; Roudot, A.C. Probabilistic mercury multimedia exposure assessment in small children and risk assessment. Environ. Int. 2013, 59, 431–441. [Google Scholar] [CrossRef] [PubMed]
- Bouissou-Schurtz, C.; Houeto, P.; Guerbet, M.; Bachelot, M.; Casellas, C.; Mauclaire, A.C.; Panetier, P.; Delval, C.; Masset, D. Ecological risk assessment of the presence of pharmaceutical residues in a French national water survey. Regul. Toxicol. Pharmacol. 2014, 69, 296–303. [Google Scholar] [CrossRef] [PubMed]
- Bokhoree, C.; Beeharry, Y.; Makoondlall-Chadee, T.; Doobah, T.; Soomary, N. Assessment of Environmental and Health Risks Associated with the Management of Medical Waste in Mauritius. APCBEE Procedia 2014, 9, 36–41. [Google Scholar] [CrossRef]
- Liu, Y.H.; Ao, H.G.; Feng, Y.J.; You, H. Review of environmental risk assessment. Environ. Sci. Manag. 2011, 36, 159–163. [Google Scholar]
- Liu, G.Y.; Xu, L.Y.; Li, W. Review of environmental risk assessment. Environ. Sci. Manag. 2007, 32, 114–118. [Google Scholar]
- Cao, X.S. The study of risk assessment and management of regional environment. Chin. Environ. Sci. 1994, 14, 465–470. [Google Scholar]
- Zeng, G.M.; Zhong, Z.L.; Zeng, B.W. Research of the uncertainty in environmental risk assessment. Chin. Environ. Sci. 1998, 18, 61–64. [Google Scholar]
- Sun, Y.F.; Xie, Z.M.; Xu, J.M.; Li, J.; Zhao, K.L. Assessment of toxicity of heavy metal contaminated soils by Toxicity Characteristic Leaching Procedure. Environ. Sci. 2005, 26, 152–156. [Google Scholar] [CrossRef] [PubMed]
- Liu, J.L.; Liao, W.H.; Zhang, Z.X.; Zhang, H.T.; Wang, X.J.; Meng, N. The response of vegetable yield to phosphate fertilizer and organic manure and environmental risk assessment of phosphorus accumulated in soil. Sci. Agric. Sin. 2007, 40, 959–965. [Google Scholar]
- Huang, Y.L.; Wang, Y.L.; Tan, Q.Y.; Yang, L.; Liu, Z.H. Environmental health risk assessment and management for urban water supply sources. Earth Sci. Front. 2006, 13, 162–167. [Google Scholar]
- Jin, J.L.; Wu, K.Y.; Li, R.Z. Coupling method of stochastic simulation with triangular fuzzy numbers for water environment risk assessment. J. Hydraul. Eng. 2008, 39, 1257–1261. [Google Scholar]
- Tang, Z.W.; Cheng, J.L.; Yue, Y.; Chen, Y.M. Accumulations and risks of heavy metals in the sediments from 8 typical lakes in Wuhan, China. J. Lake Sci. 2009, 21, 61–68. [Google Scholar]
- Zou, Y.R.; Zhang, Z.X.; Zhou, Q.B.; Liu, B. Risk assessment of Eco-environment factors on soil erosion based on GIS. Bull. Soil Water Conserv. 2002, 22, 48–50. [Google Scholar]
- Wang, Y.; Yang, K.; Wang, Y.; Gu, L.X. Method of environmental risk assessment in petrochemecal industry. Chin. Environ. Sci. 1995, 15, 161–165. [Google Scholar]
- Cao, Y.Z.; Shi, L.Y.; Li, L.H.; Li, F.X. Petroleum Hydrocarbons-Contaminated sites and related Risk-Based management strategy. Asian J. Ecotoxicol. 2007, 2, 265–272. [Google Scholar]
- Zhou, X.P.; Li, D.B. Genetically engineering resistance to viruses and environments risk assessment of releases of transgenic plants. Chin. Bull. Life Sci. 2000, 12, 4–6. [Google Scholar]
- Jia, S.R. Environmental risk assessment of GM crops: Progress in risk assessment. Sci. Agric. Sin. 2004, 37, 175–187. [Google Scholar]
- Xiao, R.L.; Lv, J.; Fu, Z.; Shen, W.M.; Xiong, W.C.; Shi, Y.L.; Cao, F.; Xu, Q.X. The application of remote sensing in the environment risk monitoring of tailings pond in Zhangjiakou city, China. Remote Sens. Technol. Appl. 2014, 29, 100–105. [Google Scholar]
- Chen, M.Y. Study on 4D data application in environmental monitoring and environmental risk assessment. Electr. Test 2014, 12, 33–35. [Google Scholar]
- Wang, F. Conflict and cooperation: Problems and Countermeasures of the transboundary environmental risk governance—A case of Yangtze River Delta. J. Chin. Univ. Geosci. 2014, 14, 78–85. [Google Scholar] [CrossRef]
- Yuan, C.C.; Liu, L.M.; Zhao, X.; Qi, X.X.; Liu, Z.X. Environmental Risk Assessment of Suburban Agriculture Based on Relative Risk Model: A Case Study of Changsha. J. Ecol. Rural Environ. 2013, 29, 158–163. [Google Scholar]
- Zhu, D.M.; Ping, H.Y. Evolutionary mechanism and coping method transform from Environmental risk to social risk. Soc. Sci. Nanjing 2013, 7, 57–63. [Google Scholar]
- Wu, L.Y. Introduction to Sciences of Human Settlements; China Architecture & Building Press: Beijing, China, 2001; pp. 97–112. [Google Scholar]
- Zhou, Z.; Zhu, W.Y. Review on the Research of Human Settlements. Soc. Sci. Nanjing 2002, 12, 84–88. [Google Scholar]
- Li, B.H.; Zeng, J.X.; Hu, J. Progress and prospects on the research of rural human settlement environment. Geogr. Geo-Inf. Sci. 2008, 24, 70–74. [Google Scholar]
- Li, B.H.; Liu, C.M.; Zeng, J.X. An evaluation on the satisfaction degree and optimization strategy of rural human settlements—A Case Study of Jiuheyuan Town in Shishou City. Hum. Geogr. 2009, 24, 28–32. [Google Scholar]
- Ma, R.F.; Zhang, W.Z.; Yu, J.H.; Wang, D.; Zhan, L. Overview and Prospect of Research on Human Settlement of Chinese Geographers. Sci. Geogr. Sin. 2014, 34, 1470–1479. [Google Scholar]
- Li, X.M.; Tian, S.Z.; Zhang, F.; Yang, J.; Zhang, C.H. The evaluation of human settlements of urban special functional area scale: Taking 10 universities in Dalian as cases. Urban Probl. 2014, 2, 24–30. [Google Scholar]
- Ning, Y.M.; Zha, Z.Q. The study of evaluation and optimization for human settlements in the metropolitan areas: Taking Shanghai as an example. City Plan. Rev. 1999, 23, 14–19. [Google Scholar]
- Qi, X.H.; Cheng, Y.; Hu, X.S.; Chen, L.; Lin, X.Y.; Zhou, Y.P. Eco-geographic processes in the evolution of human settlements system on the metropolis fringe: A case study of Guangzhou. Acta Ecol. Sin. 2010, 30, 4512–4520. [Google Scholar]
- Tang, Y.; Feng, Z.M.; Yang, Y.Z. Evaluation of climate suitability for human settlement in China. Resour. Sci. 2008, 30, 648–653. [Google Scholar]
- Zhang, W.Z. Index system and method of residential environmental evaluation in inner cities. Sci. Geogr. Sin. 2007, 27, 17–23. [Google Scholar]
- Tian, S.Z.; Li, X.M.; Yang, J.; Zhang, C.H.; Zhang, Y. Initial study on triaxiality of human Settlements—In the case of 10 districts (counties) of Dalian. Sustainability 2014, 6, 7276–7291. [Google Scholar] [CrossRef]
- Chai, Y.W.; Zhang, Y.; Liu, Z.L. Spatial differences of Home-Work separation and the impacts of housing policy and urban sprawl: Evidence from household survey data in Beijing. Acta Geogr. Sin. 2011, 66, 157–166. [Google Scholar]
- Chen, F.; Chen, H.Y.; Zhu, Z.H.; Peng, B.Z. Analysis on evaluation of urban residential quality and satisfaction. Hum. Geogr. 2000, 15, 20–23. [Google Scholar]
- Li, X.M.; Tian, S.Z.; Yang, J.; Zhang, F.; Kong, F.Q. The preliminary study of mismatch degree of urban human settlements: Taking 14 cities in Liaoning Province as cases. Geogr. Res. 2014, 33, 687–697. [Google Scholar]
- Wu, Q.; Cheng, J.P.; Zhong, S.Y.; Li, Y. Empirical research of urban human settlement environment elements based on the needs of different subjects: A case study of Xintang Town, Guangzhou. Geogr. Res. 2013, 32, 307–316. [Google Scholar]
- Feng, Z.M.; Tang, Y.; Yang, Y.Z.; Zhang, D. Establishment and application of human settlements environment index model (HEI) based on GIS. Acta Geogr. Sin. 2008, 63, 1327–1336. [Google Scholar]
- Wang, Y.; Zhao, W.N. Information theory for human settlements research and its Info-spectrum images system. Acta Geogr. Sin. 2012, 67, 253–265. [Google Scholar]
- Li, X.M.; Li, W.N. Quantitative analysis about coordinating development of environment of urban human settlements and economy in Dalian since the 1900s. Econ. Geogr. 2005, 25, 383–386. [Google Scholar]
- Zhang, Y.J.; Li, X.M.; Xia, C.G. Spatial pattern of coupling development between real estate development and housing condition at prefectural level in China. Prog. Geogr. 2014, 33, 232–240. [Google Scholar]
- National Bureau of Statistics of the People’s Republic of China. China Statistical Yearbook; China Statistics Press: Beijing, China, 2004–2013.
- Ministry of Environment Protection of the People’s Republic of China. China Environmental State Bulletin [EB/OL]. Available online: http://www.zhb.gov.cn/hjzl/zghjzkgb/lnzghjzkgb/ (accessed on 27 May 2014). (In Chinese)
- National Bureau of Statistics of the People’s Republic of China. China City Statistical Yearbook; China Statistics Press: Beijing, China, 2004–2013.
- Population Census Office under the State Council Department of Population and Employment Statistics National Bureau of Statistics. Tabulation on the 2005 Population Census of the People’s Republic Of China By Township; China Statistics Press: Beijing, China, 2005.
- Population Census Office under the State Council Department of Population and Employment Statistics National Bureau of Statistics. Tabulation on the 2010 Population Census of the People’s Republic of China by Township; China Statistics Press: Beijing, China, 2010.
- Ministry of Environmental Protection of the People’s Republic of China. Technical Guidelines for Environmental Risk Assessment on Projects; China Environmental Science Press: Beijing, China, 2004.
- Ministry of Environmental Protection of the People’s Republic of China. Technical Guideline for Environmental Impact Assessment Ecological Impact; China Environmental Science Press: Beijing, China, 2011.
- Ministry of Housing and Urban-Rural Development of the People’s Republic of China. Evaluation Index System for China Human Settlements Award [EB/OL]. Available online: http://www.mohurd.gov.cn/wjfb/201605/t20160530_227652.html (accessed on 30 May 2016).
- Chen, H.; Liu, J.S.; Cao, Y.; Li, S.C.; Ouyang, H. Progresses of ecological risk assessment. Acta Ecol. Sin. 2006, 26, 1558–1566. [Google Scholar]
- Sun, C.Z.; Zhu, J. Environmental risk evaluation of shallow groundwater and its spatial auto-correlation in lower reach of Liaohe River Plain. Prog. Geogr. 2014, 2, 270–279. [Google Scholar]
- Li, C.X.; Ma, Y.F.; Zhang, Y. Dynamic evolution mode of regional dominance indexes of Chinese in bound tourism flows during 1993 to 2008: An empirical research based on modified entropy technology. Geogr. Res. 2012, 31, 257–268. [Google Scholar]
- Lin, Z.M.; Xia, B. Analysis of sustainable development ability of the urban ecosystem in Guangzhou City in the perspective of entropy. Acta Geogr. Sin. 2013, 68, 45–57. [Google Scholar]


| Object | Criterion | Index Type | Index |
|---|---|---|---|
| Human settlement risks | Vulnerability | Social conditions | Non-agricultural composition (regional total output value = 100); regional production index (previous year = 100); comparison of urban and rural consumption levels (rural resident = 1); residence consumer price index (CPI); regional total output value per capita (yuan); year-end urban population proportion (%); natural population growth rate (%) |
| Natural conditions | Water resource quantity per capita (cubic meter per person); annual average temperature (°C); annual relative humidity (%); sunshine duration (h) | ||
| Functionality | Social functions | Public transportation (vehicles per 10,000 people); urban road area per capita (m2); number of public toilets per 10,000 people; student–teacher ratio in general colleges (teacher = 1); average number of undergraduate students per 100,000 people | |
| Ecological functions | Green area per capita (m2); natural reserve–administrative region ratio (%); wetland–administrative region ratio (%); green coverage ratio in built-up areas (%); forest coverage rate (%) | ||
| Stress | Social stresses | Urban population density (people per square kilometer); total dependency ratio of population (%); urban registered unemployment rate (%); gender ratio (female = 100) | |
| Environmental stresses | Sulfur dioxide emissions (10,000 tons); smoke (dust) emissions (10,000 tons); total wastewater discharge (10,000 tons); amount of household waste cleared (10,000 tons); number of unexpected environmental accidents; number of geological disasters | ||
| Adaptability | Human responses | Innocent treatment ratio of household waste (%); completed investment in industrial pollution treatment (10,000 yuan); number of completed pollution treatment projects within the year; innocent treatment capacity (tons per day); total afforestation area (ha); environmental investment ratio (%) |
| Year | Excellent Region | Good Region | Minor Risk Region | Mild Risk Region | Severe Risk Region | |||||
|---|---|---|---|---|---|---|---|---|---|---|
| Score | Number | Score | Number | Score | Number | Score | Number | Score | Number | |
| 2003 | 1.65 | 4 | 2.52 | 14 | 4.80 | 10 | 12.27 | 2 | 24.91 | 1 |
| 2004 | 1.68 | 4 | 2.76 | 11 | 4.31 | 5 | 6.23 | 9 | 19.10 | 2 |
| 2005 | 1.49 | 7 | 2.18 | 9 | 3.73 | 8 | 5.62 | 5 | 17.62 | 2 |
| 2006 | 0.96 | 1 | 1.26 | 6 | 2.26 | 12 | 3.71 | 9 | 10.76 | 3 |
| 2007 | 1.61 | 5 | 2.83 | 8 | 4.34 | 12 | 5.91 | 4 | 15.87 | 2 |
| 2008 | 1.59 | 5 | 3.23 | 11 | 5.40 | 11 | 10.23 | 3 | 19.41 | 1 |
| 2009 | 2.01 | 11 | 3.88 | 13 | 7.35 | 5 | 15.38 | 1 | 30.52 | 1 |
| 2010 | 1.42 | 2 | 2.90 | 11 | 4.42 | 12 | 11.37 | 5 | 31.13 | 1 |
| 2011 | 1.38 | 1 | 2.13 | 8 | 3.43 | 8 | 5.03 | 12 | 18.19 | 2 |
| 2012 | 2.10 | 3 | 3.20 | 7 | 5.28 | 13 | 8.10 | 5 | 14.16 | 3 |
© 2016 by the authors; licensee MDPI, Basel, Switzerland. This article is an open access article distributed under the terms and conditions of the Creative Commons Attribution (CC-BY) license (http://creativecommons.org/licenses/by/4.0/).
Share and Cite
Tian, S.; Li, X.; Li, H.; Zhang, Y.; Bao, T. Initial Evaluation of Provincial-Level Environmental Risks from the Perspective of Human Settlements. Sustainability 2016, 8, 1259. https://doi.org/10.3390/su8121259
Tian S, Li X, Li H, Zhang Y, Bao T. Initial Evaluation of Provincial-Level Environmental Risks from the Perspective of Human Settlements. Sustainability. 2016; 8(12):1259. https://doi.org/10.3390/su8121259
Chicago/Turabian StyleTian, Shenzhen, Xueming Li, Hang Li, Yingjia Zhang, and Tongliga Bao. 2016. "Initial Evaluation of Provincial-Level Environmental Risks from the Perspective of Human Settlements" Sustainability 8, no. 12: 1259. https://doi.org/10.3390/su8121259