1. Introduction
Interest in the renewable energy resources has increased in recent years [
1,
2]. In particular, countries with suitable coastlines are able to exploit wave energy that is associated with the motion of the water surface, produced by wind currents blowing across the sea. Such a form of energy is not uniformly distributed throughout the world [
3,
4,
5,
6] and being generally weak in enclosed seas, is therefore scarcely used for energy exploitation. In particular, the wave energy availability in the Mediterranean Sea, in terms of mean annual wave power, gives values in a range of 2–12 kW/m [
7,
8,
9,
10,
11,
12,
13]. The areas of the highest energy are located on the western coast of the island of Sardinia, near Alghero (Italy) [
14,
15], where the mean power is about 12 kW/m. Nevertheless, such values are low if compared with those achieved along the west coast of Europe, of Scotland and Ireland, where the mean power is 75 kW/m [
4,
16].
Within the Mediterranean Sea, the present study focuses attention on the coasts of the island of Sicily (Italy). The energy around these coasts was studied comprehensively in [
8], where hotspot areas of energy concentration were selected and studied, by means of a third-generation model. Thus, the wave data around Sicily was estimated with a high degree of detail with steps of 400 m for the depths shallower than 50 m. Starting from the data from the European Centre for Medium-Range Weather Forecasts (ECMWF), the study analyzed a period of about fifteen years. The highest energetic areas were found to be located along the western and southern coasts of Sicily, with maximum values of mean power equal to 8 kW/m and 6 kW/m. Furthermore the minimum annual energy levels are reached on the northern and eastern sides of the island, with mean power in the range of 2–3 kW/m.
The exploitation of wave power needs the installation of Wave Energy Converters (WECs), for the transformation of part of the wave motion into electricity. More than one thousand WEC devices have been patented since 1799 [
14]. A classification of the WEC system is proposed in [
16], which considers: (i) location of the device in respect of the coast; (ii) size and direction of the device compared to the incoming wave; and (iii) working principle. Among such devices, attention is focused here on towards those types of WECs which can be embedded into the breakwater of the port, both in vertical wall and rubble mound dykes. Specifically, four types of systems are considered here: Oscillating water column (OWC) devices, modified OWC systems with an U-shaped internal conduit (U-OWC), point absorber and overtopping devices.
The first two kinds of systems (i.e., OWC and U-OWC) are based on the same working principle: the wave motion causes a variation of water level which enters, through a gap at the front vertical wall in an internal chamber where the air is compressed and decompressed. In this way, the flux of air crosses a turbine which can operate in both directions [
16,
17,
18,
19,
20]. Additionally, the U-OWC system presents a further vertical duct, before the air chamber, which increases the oscillating period of the system and makes such a period close to the typical wave periods of sea waves, so increasing the overall performance of the device [
21,
22].
The point absorber is a floating body that absorbs energy from all direction of the wave through its movements near the water surface. Its application is of greater interest when large arrays of absorbers are considered [
23,
24].
Overtopping devices are based on the wave run-up mechanism over a slope. The overtopping flow of the waves is collected in a reservoir behind the slope. Such systems use the difference of level, between the reservoir and the sea, through a hydraulic turbine [
25,
26,
27,
28].
Some of the WECs described above have been embedded inside breakwaters for the protection of ports. In particular, an OWC device was installed in Mutriku, Spain [
29]. That device is located inside a vertical breakwater for a length of about 100 m; it is composed of 16 caissons, arranged to a curvature of 220 m. Each caisson has a trapezoidal shape of about 6 × 12 m and contains 16 turbo-generators. Energy produced by the system was expected to be 600 MWh/year [
29]. That system no longer produces energy since the structure was damaged by a violent storm in 2009.
A full scale U-OWC breakwater is being constructed at the harbor of Civitavecchia, Italy. This breakwater embodies 19 caissons, each including 8 cells, 34 m long [
22]. The vertical duct is 1.60 m wide and the U-duct opening is located 2.00 m below the mean water level, so that the opening is not always below the free surface; the pneumatic chamber is 3.20 m wide. In such an installation the turbine duct is protected during severe sea states, as the impact of the inner free surface with the turbine can damage the device. The system is estimated to absorb 57% of the incident wave energy for the most frequent sea states. However the estimated performance of the system is reduced to 23% due to the presence of Wells turbines [
30].
In 2015 an overtopping device was installed in the port of Naples, Italy. The device is denominated OBREC (Overtopping BReakwater for Energy Conversion) and represents the world’s first WEC prototype, completely embedded into a breakwater, which exploits the wave overtopping process [
27,
31]. It was installed inside an existing breakwater in an area of 75 m
2, replacing part of the seaward armor layer. In the machine room, three low head turbines were located in order to convert potential energy into kinetic energy and then in electrical energy by means of a generator. The total power installed was 2.5 kW.
The feasibility of installing WECs inside a breakwater for port protection is investigated in the present work, by considering a site having ordinary wave energy availability. The main goal is to identify a convenient strategy for exploiting wave energy, also in enclosed seas like the Mediterranean. Attention is focused here on the main advantages and issues related to the presence of WECs inside the breakwater of a port. Energy, reflection, loadings, noise and economic payback are considered in detail. To begin with, a physical model was implemented in order to test the chosen device and to achieve reliable data for the carrying out of the feasibility study.
The site of interest and the choice of WEC typology are described in
Section 2.
Section 3 shows the laboratory tests carried out, by considering different configurations of the chosen kind of device. The results of the physical modeling are used in
Section 4 in order to evaluate wave reflection, loadings and noise. The structural and economic feasibility is carried out in
Section 5, where a reliable solution is achieved for the design of the breakwater. Finally the main conclusions are drawn in
Section 6.
2. Choice of WEC System for the Case Study
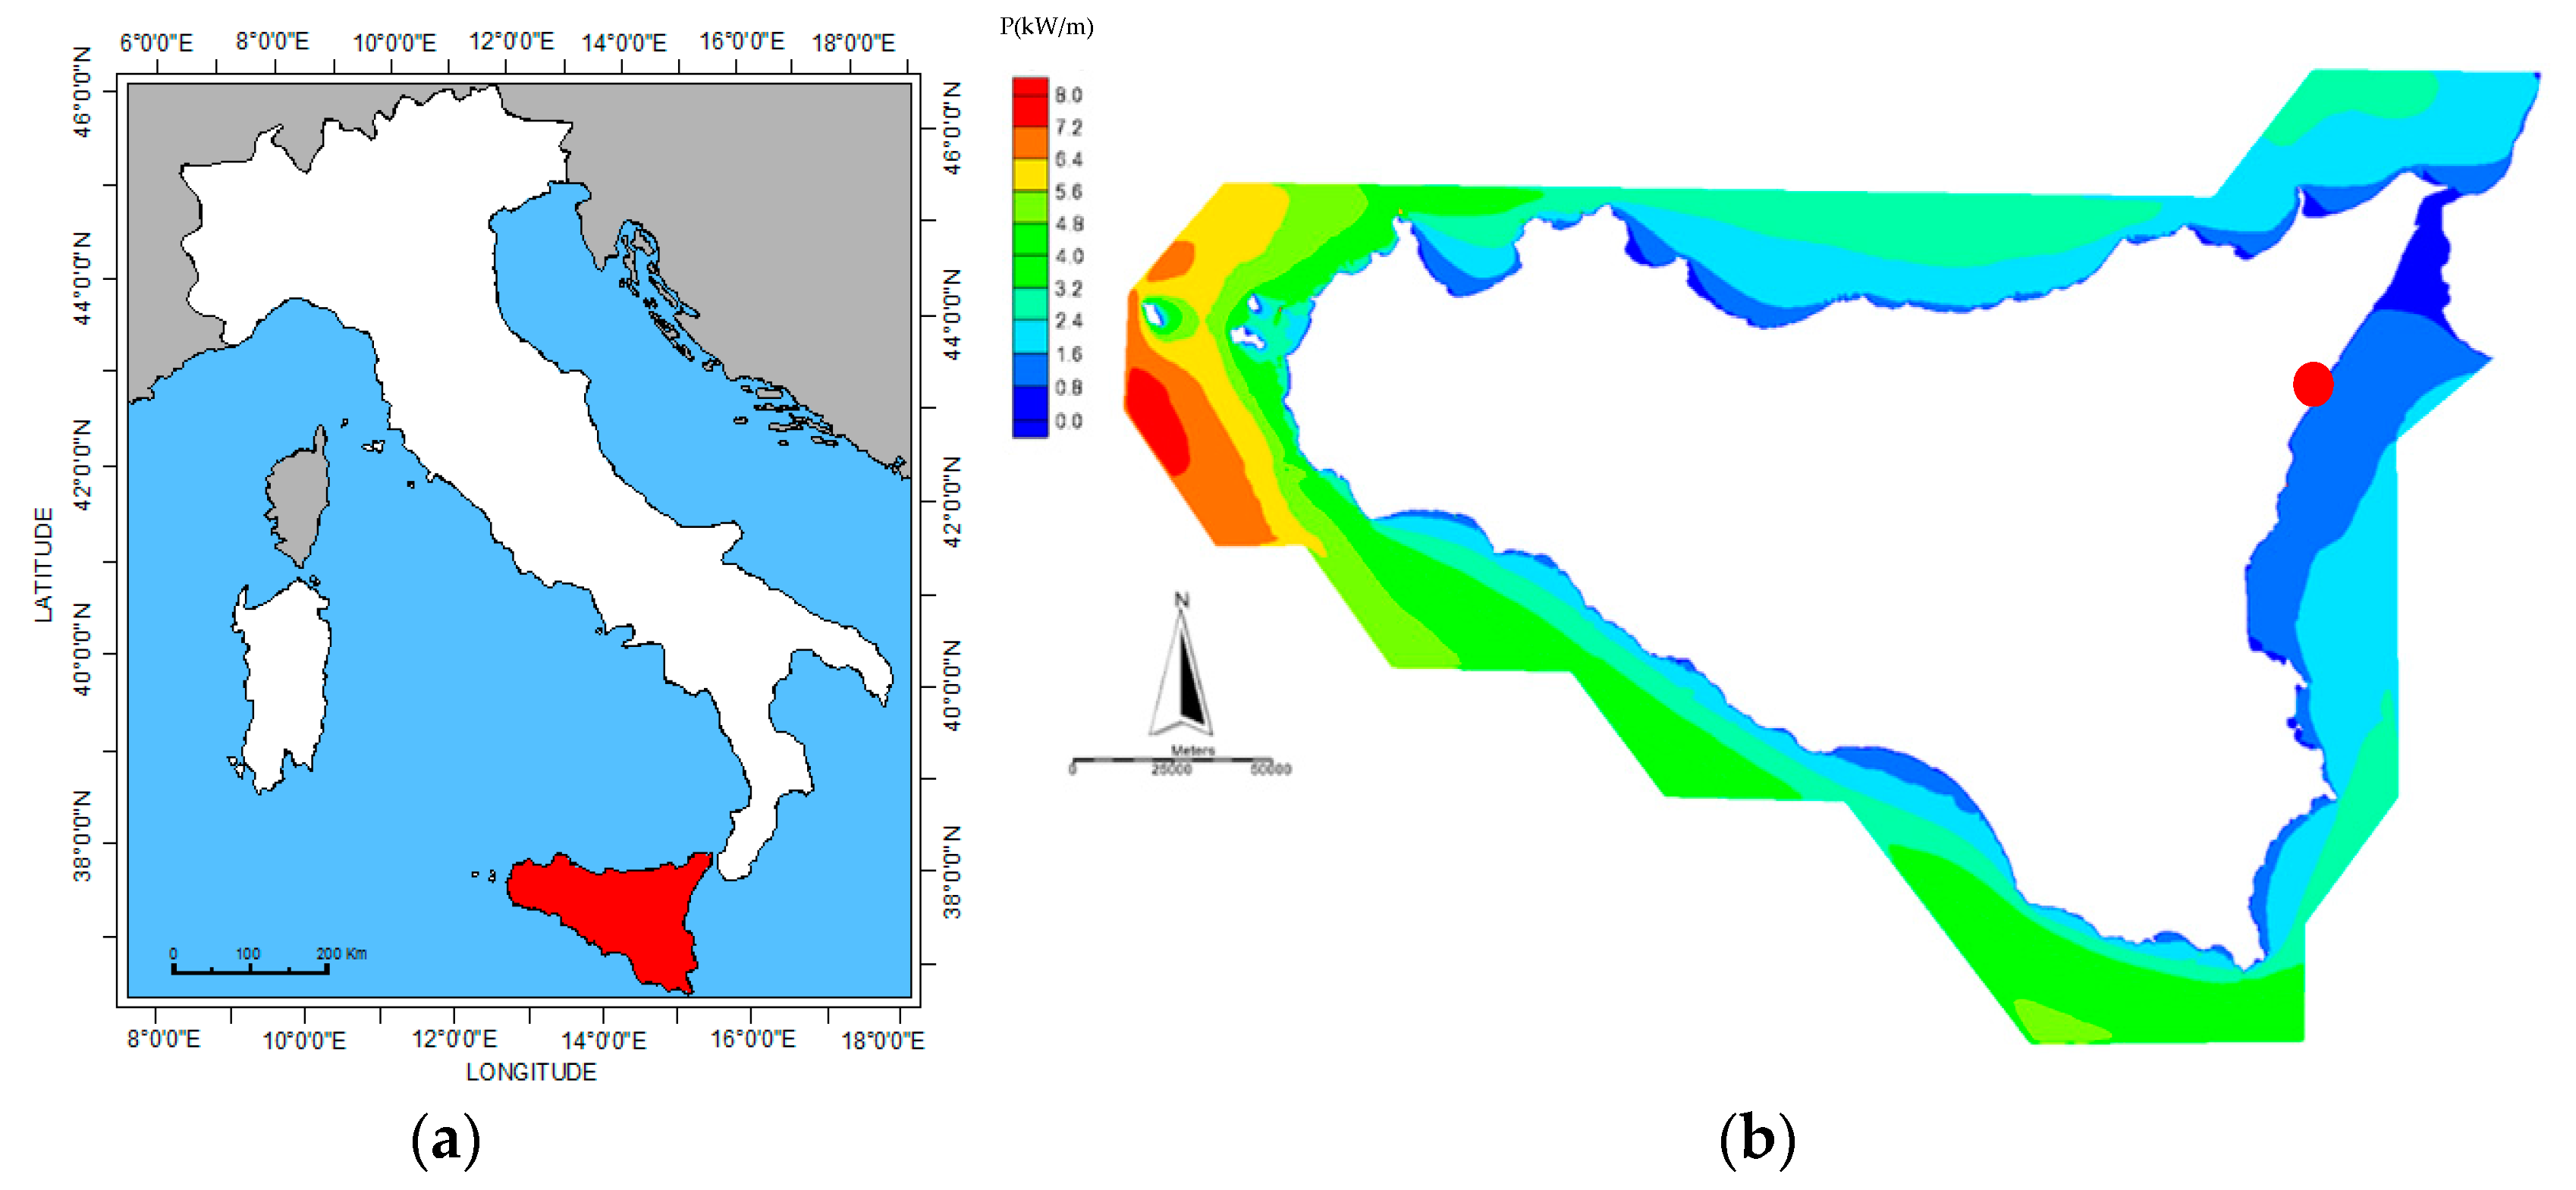
The site of interest for the feasibility study is Giardini Naxos (in Italy), which is situated along the east coast of the island of Sicily, as shown in
Figure 1. A summer seasonal port is located in front of Giardini Naxos, which is constituted by a breakwater 250 m long, having a quay at its shoreward side. In the summer, the water surface protected by the breakwater is used for berthing by means of floating docks. At present, the port requires maintenance intervention. In such a context, there are plans to improve and extended the infrastructure.
The widening of the port includes the construction of a new lee breakwater and the extension of the existing main breakwater. Therefore, the berths for yachts and cruise ships will be expanded. The growing concern about energy sustainability prompted the developer to investigate the feasibility of building a green infrastructure, by using renewable energies for the lighting of the port. In particular, the installation of a WEC system inside the new part of the main breakwater is investigated here.
At the beginning, the available energy at the site of interest is estimated on the basis of annual offshore wave climate toward the coast [
9]. In particular, the wave mean power distribution around the island of Sicily is shown in
Figure 1b, from which the values in front of Giardini Naxos (red dot) are extracted. The chosen low wave power site allows us to evaluate the feasibility of installing WECs also in low energy sites.
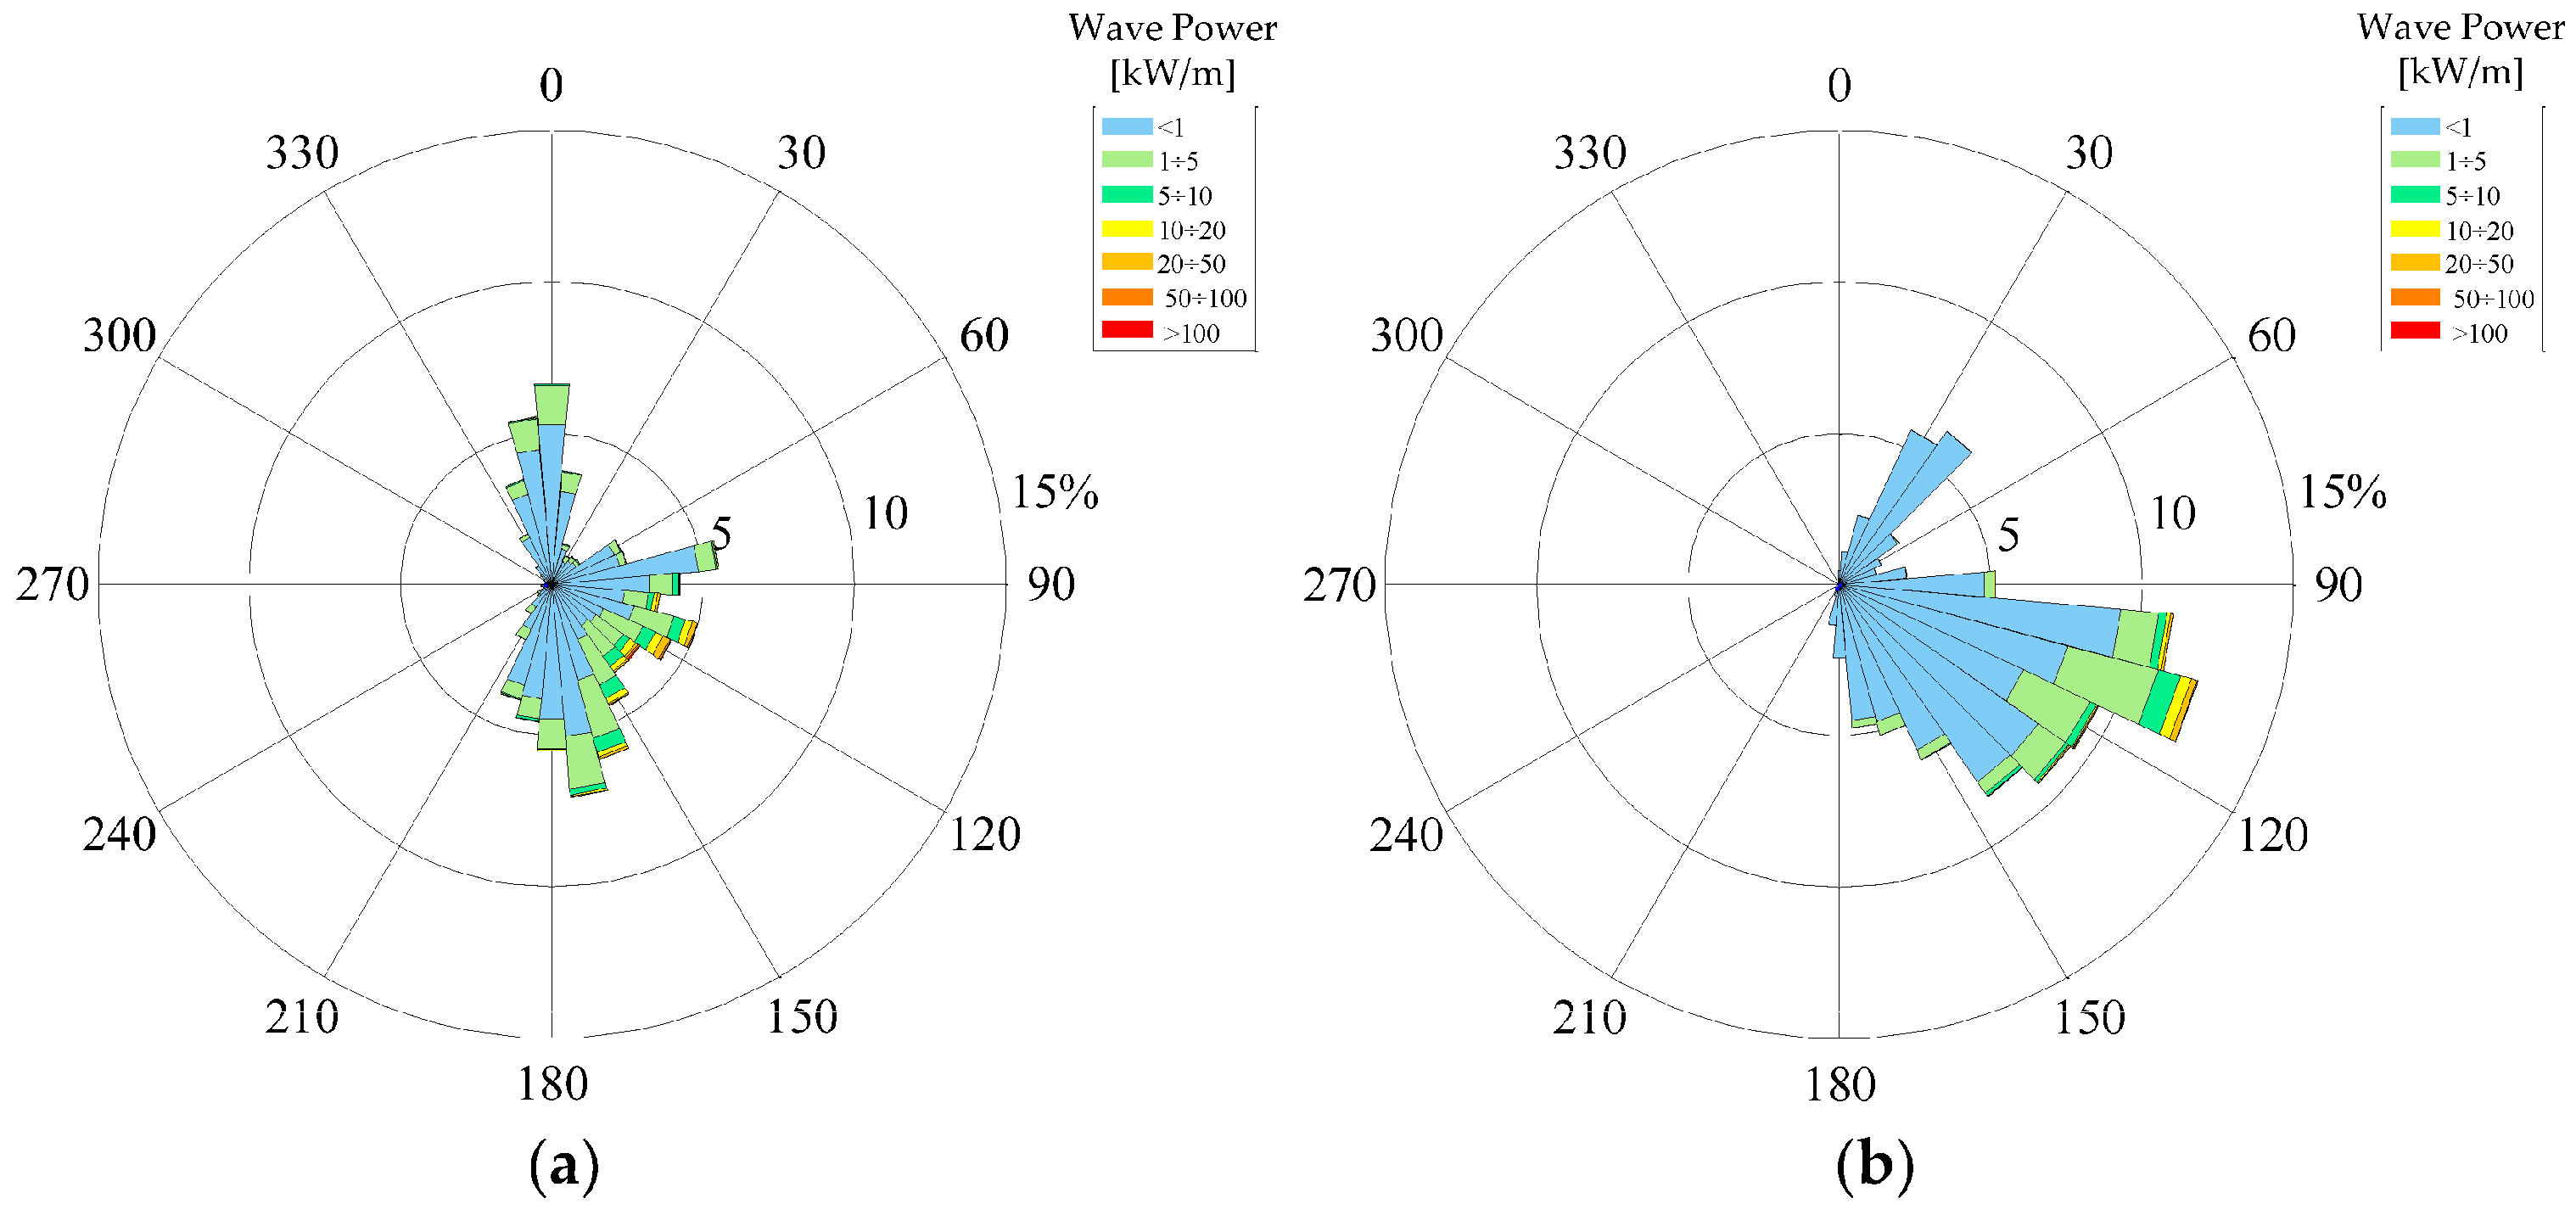
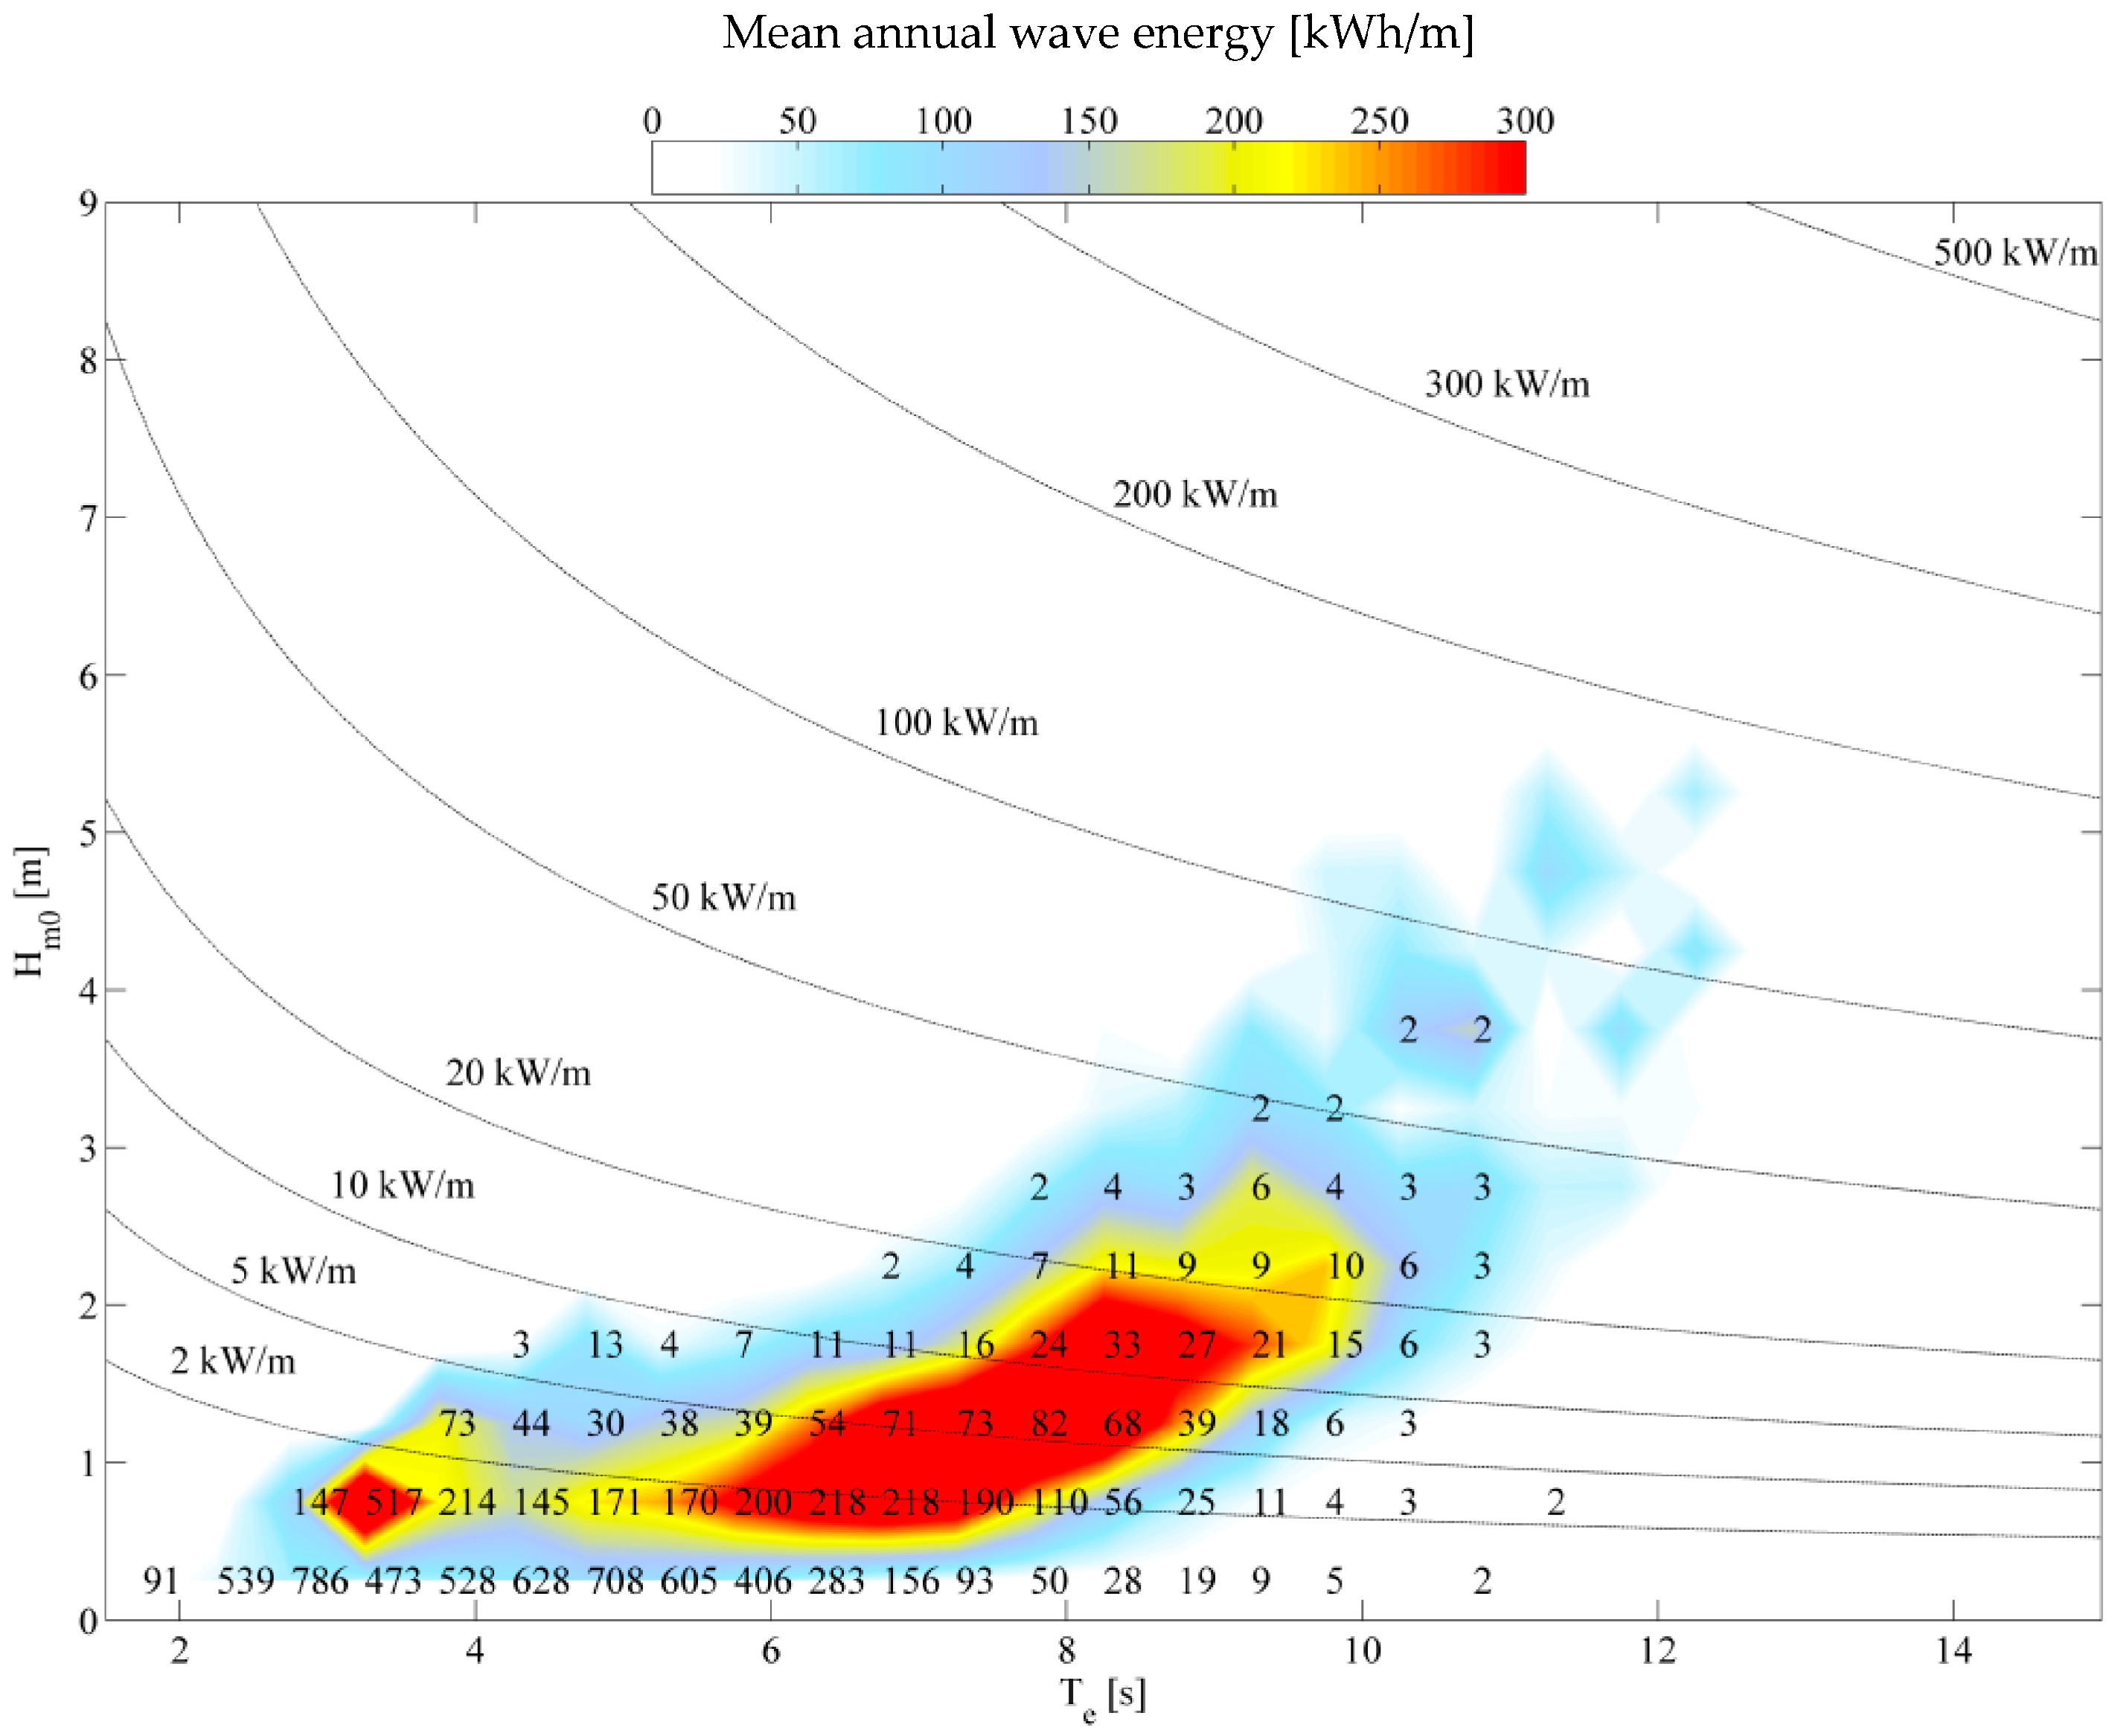
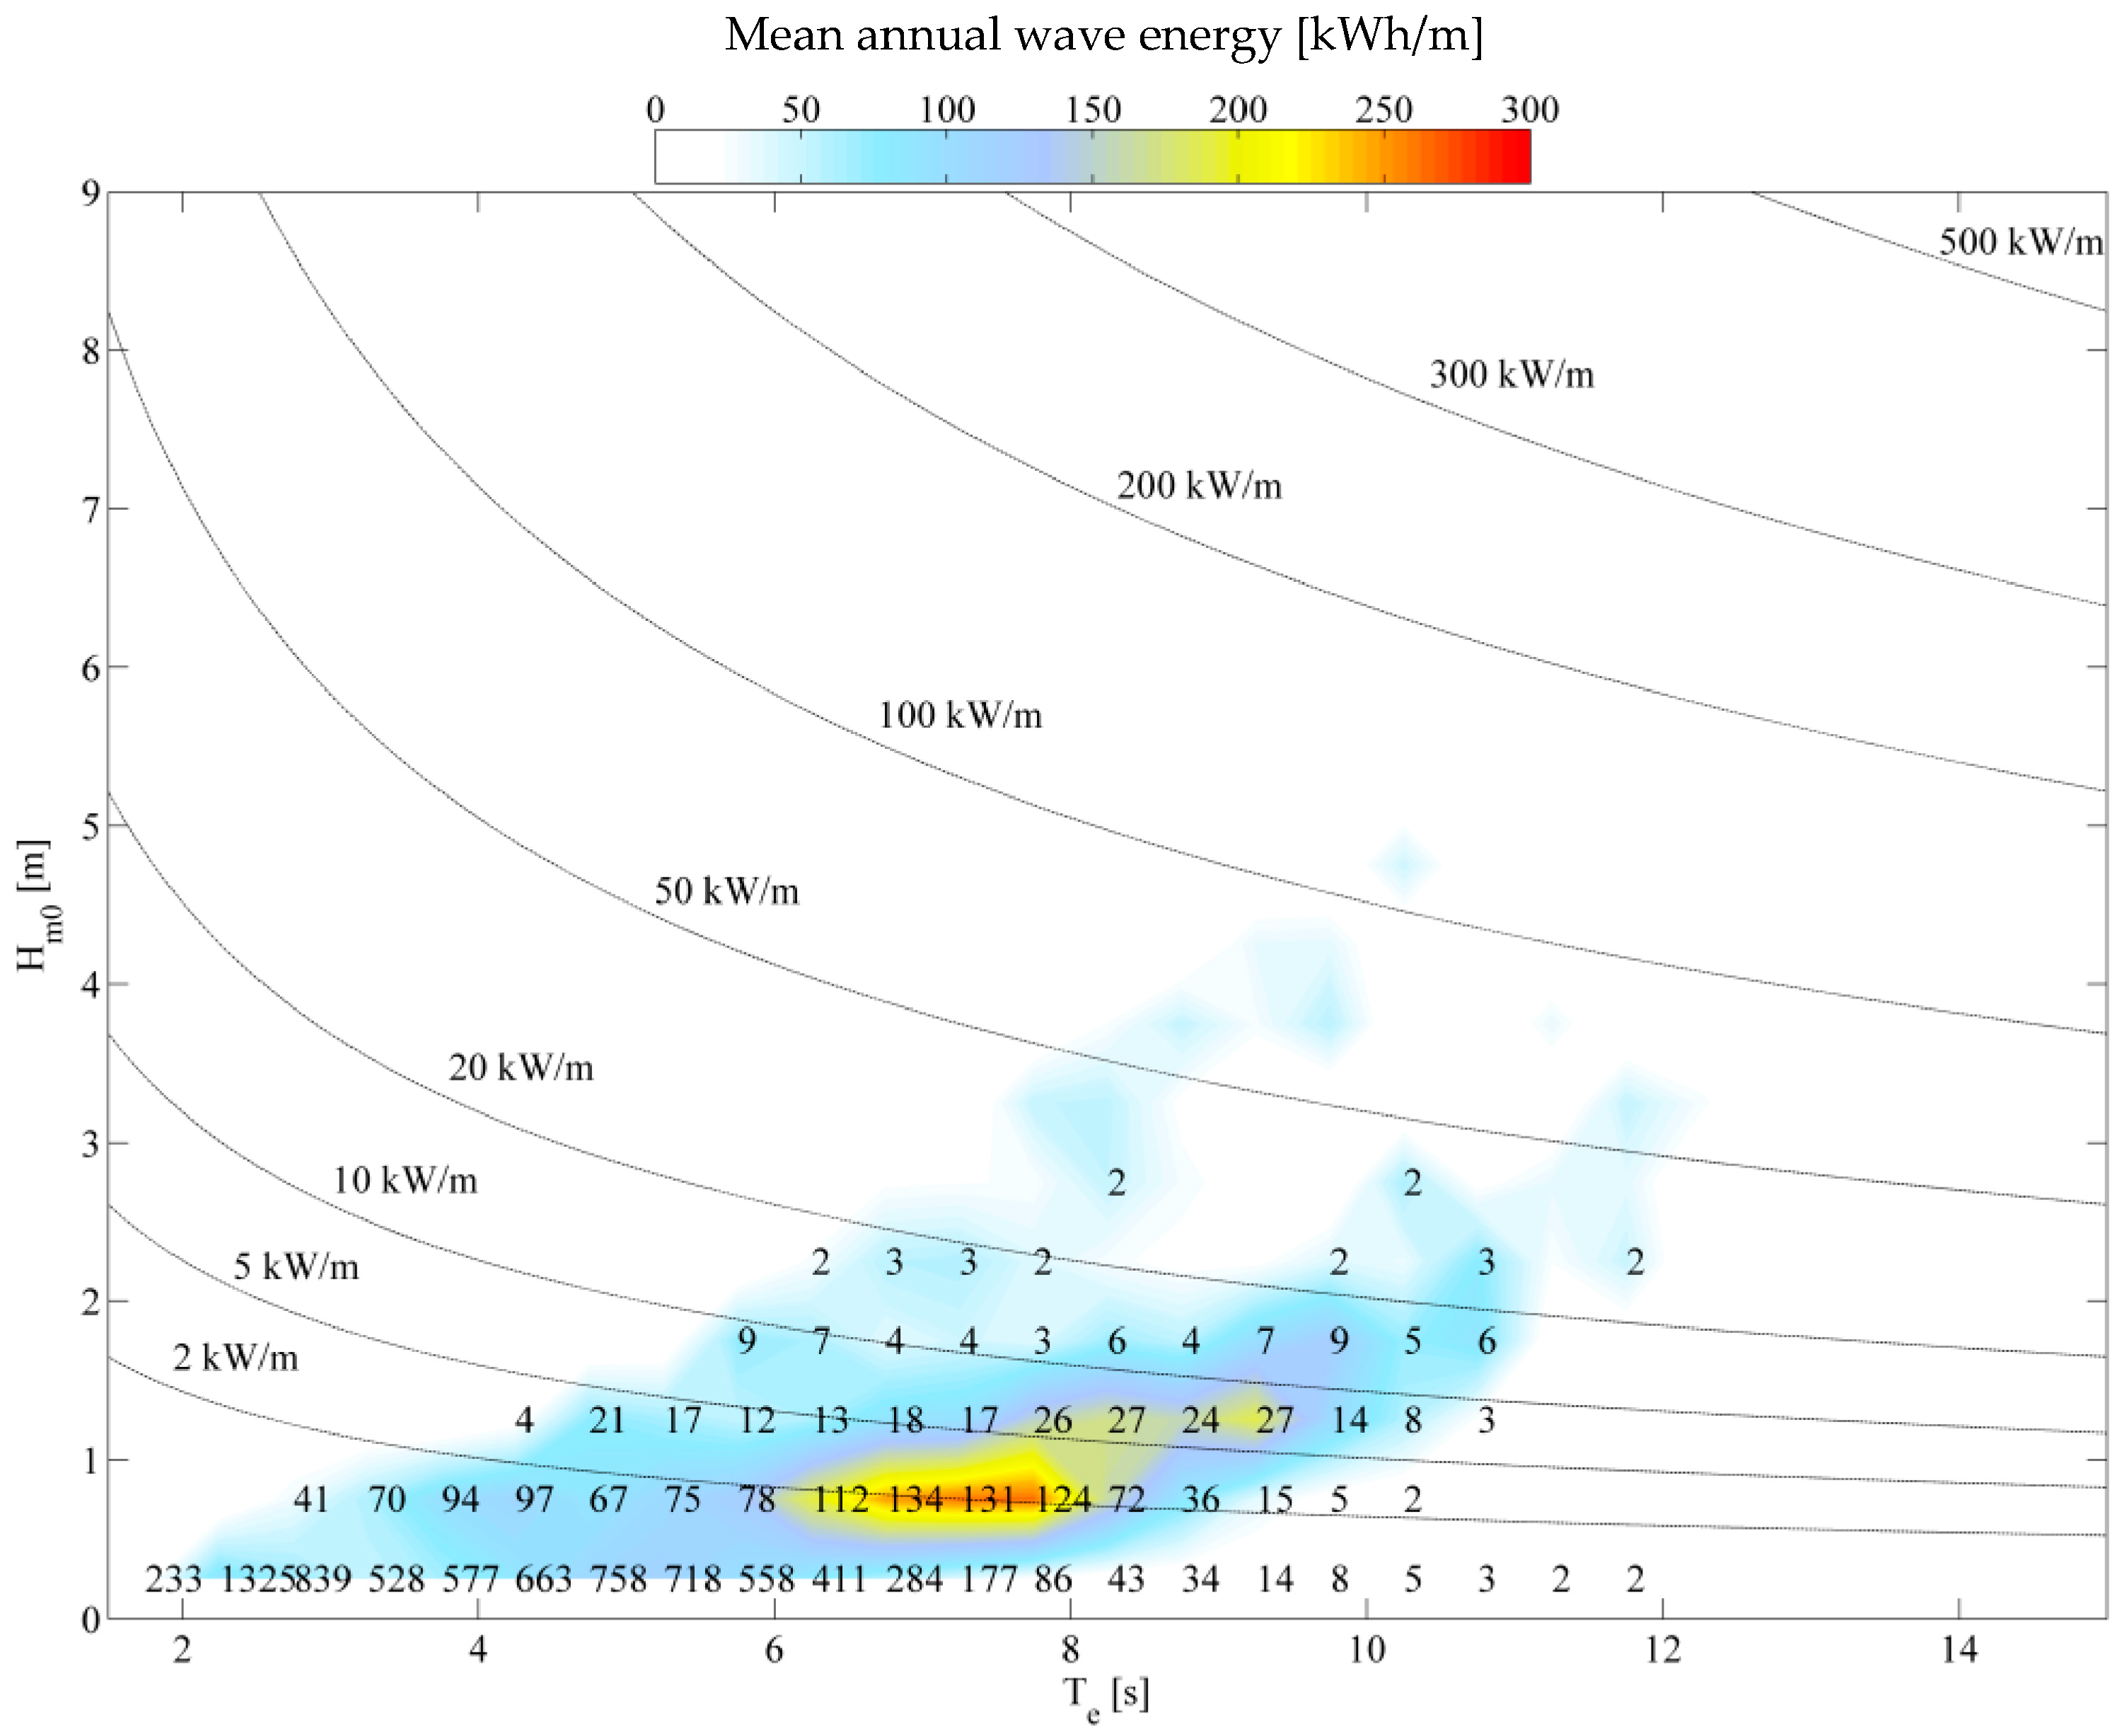
The available energy distributions are shown in
Figure 2,
Figure 3 and
Figure 4, as a function of wave direction of propagation and of wave conditions respectively. Such distributions highlight the fact that the greatest part of offshore mean power comes from the sector 60°–210° N, while a small energy component arrives from the North. In more detail, the offshore annual mean power is equal to 1.75 kW/m and is mainly due to sea states having significant height in the range 0.5–2 m.
The wave propagation is carried out from offshore toward the zone where the breakwater will be extended, i.e., at the bathymetric −20 m. The corresponding mean power reduces its intensity to 0.76 kW/m and is more focused near to a direction perpendicular to the bathymetries, i.e., 120° N. Furthermore, the annual energy is concentrated in sea states having significant height in the range 0.5–1 m and energetic period Te = 6–8 s.
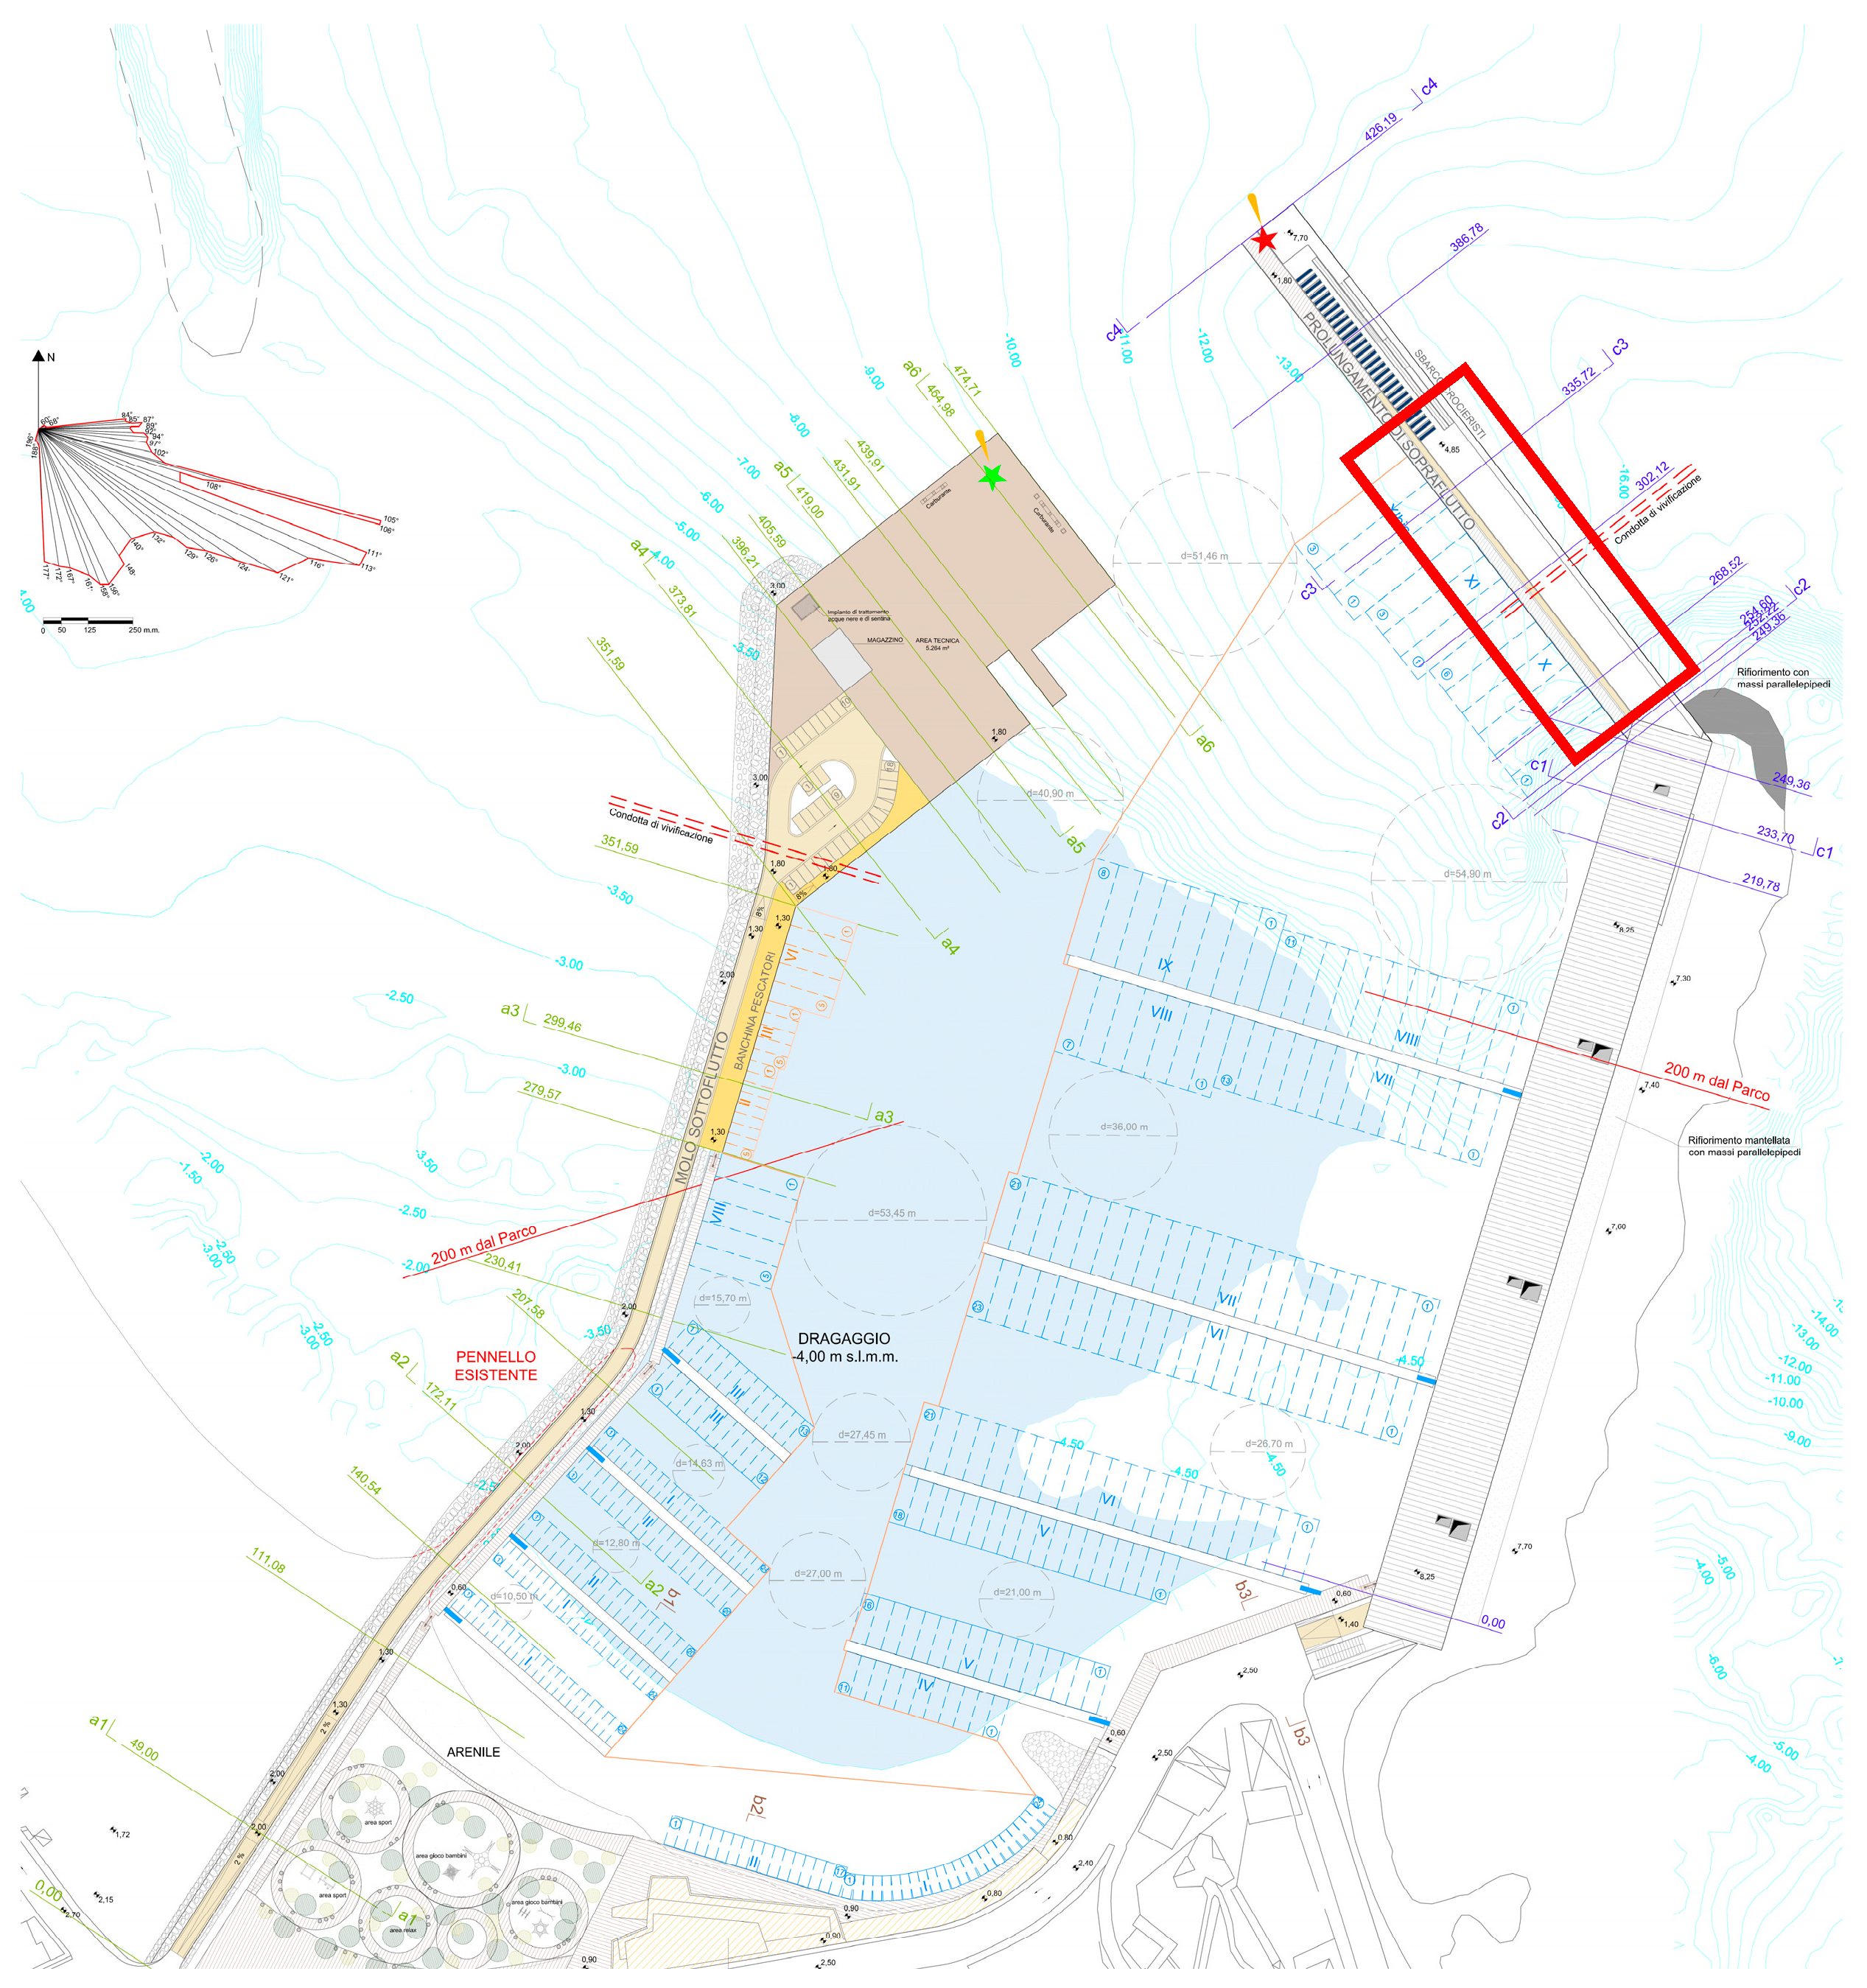
Since the site of interest is characterized by low wave energy, it is important to choose a WEC system optimized for the case study and to install such devices in that part of the port most exposed to waves, i.e., the extension of the main breakwater. As shown in
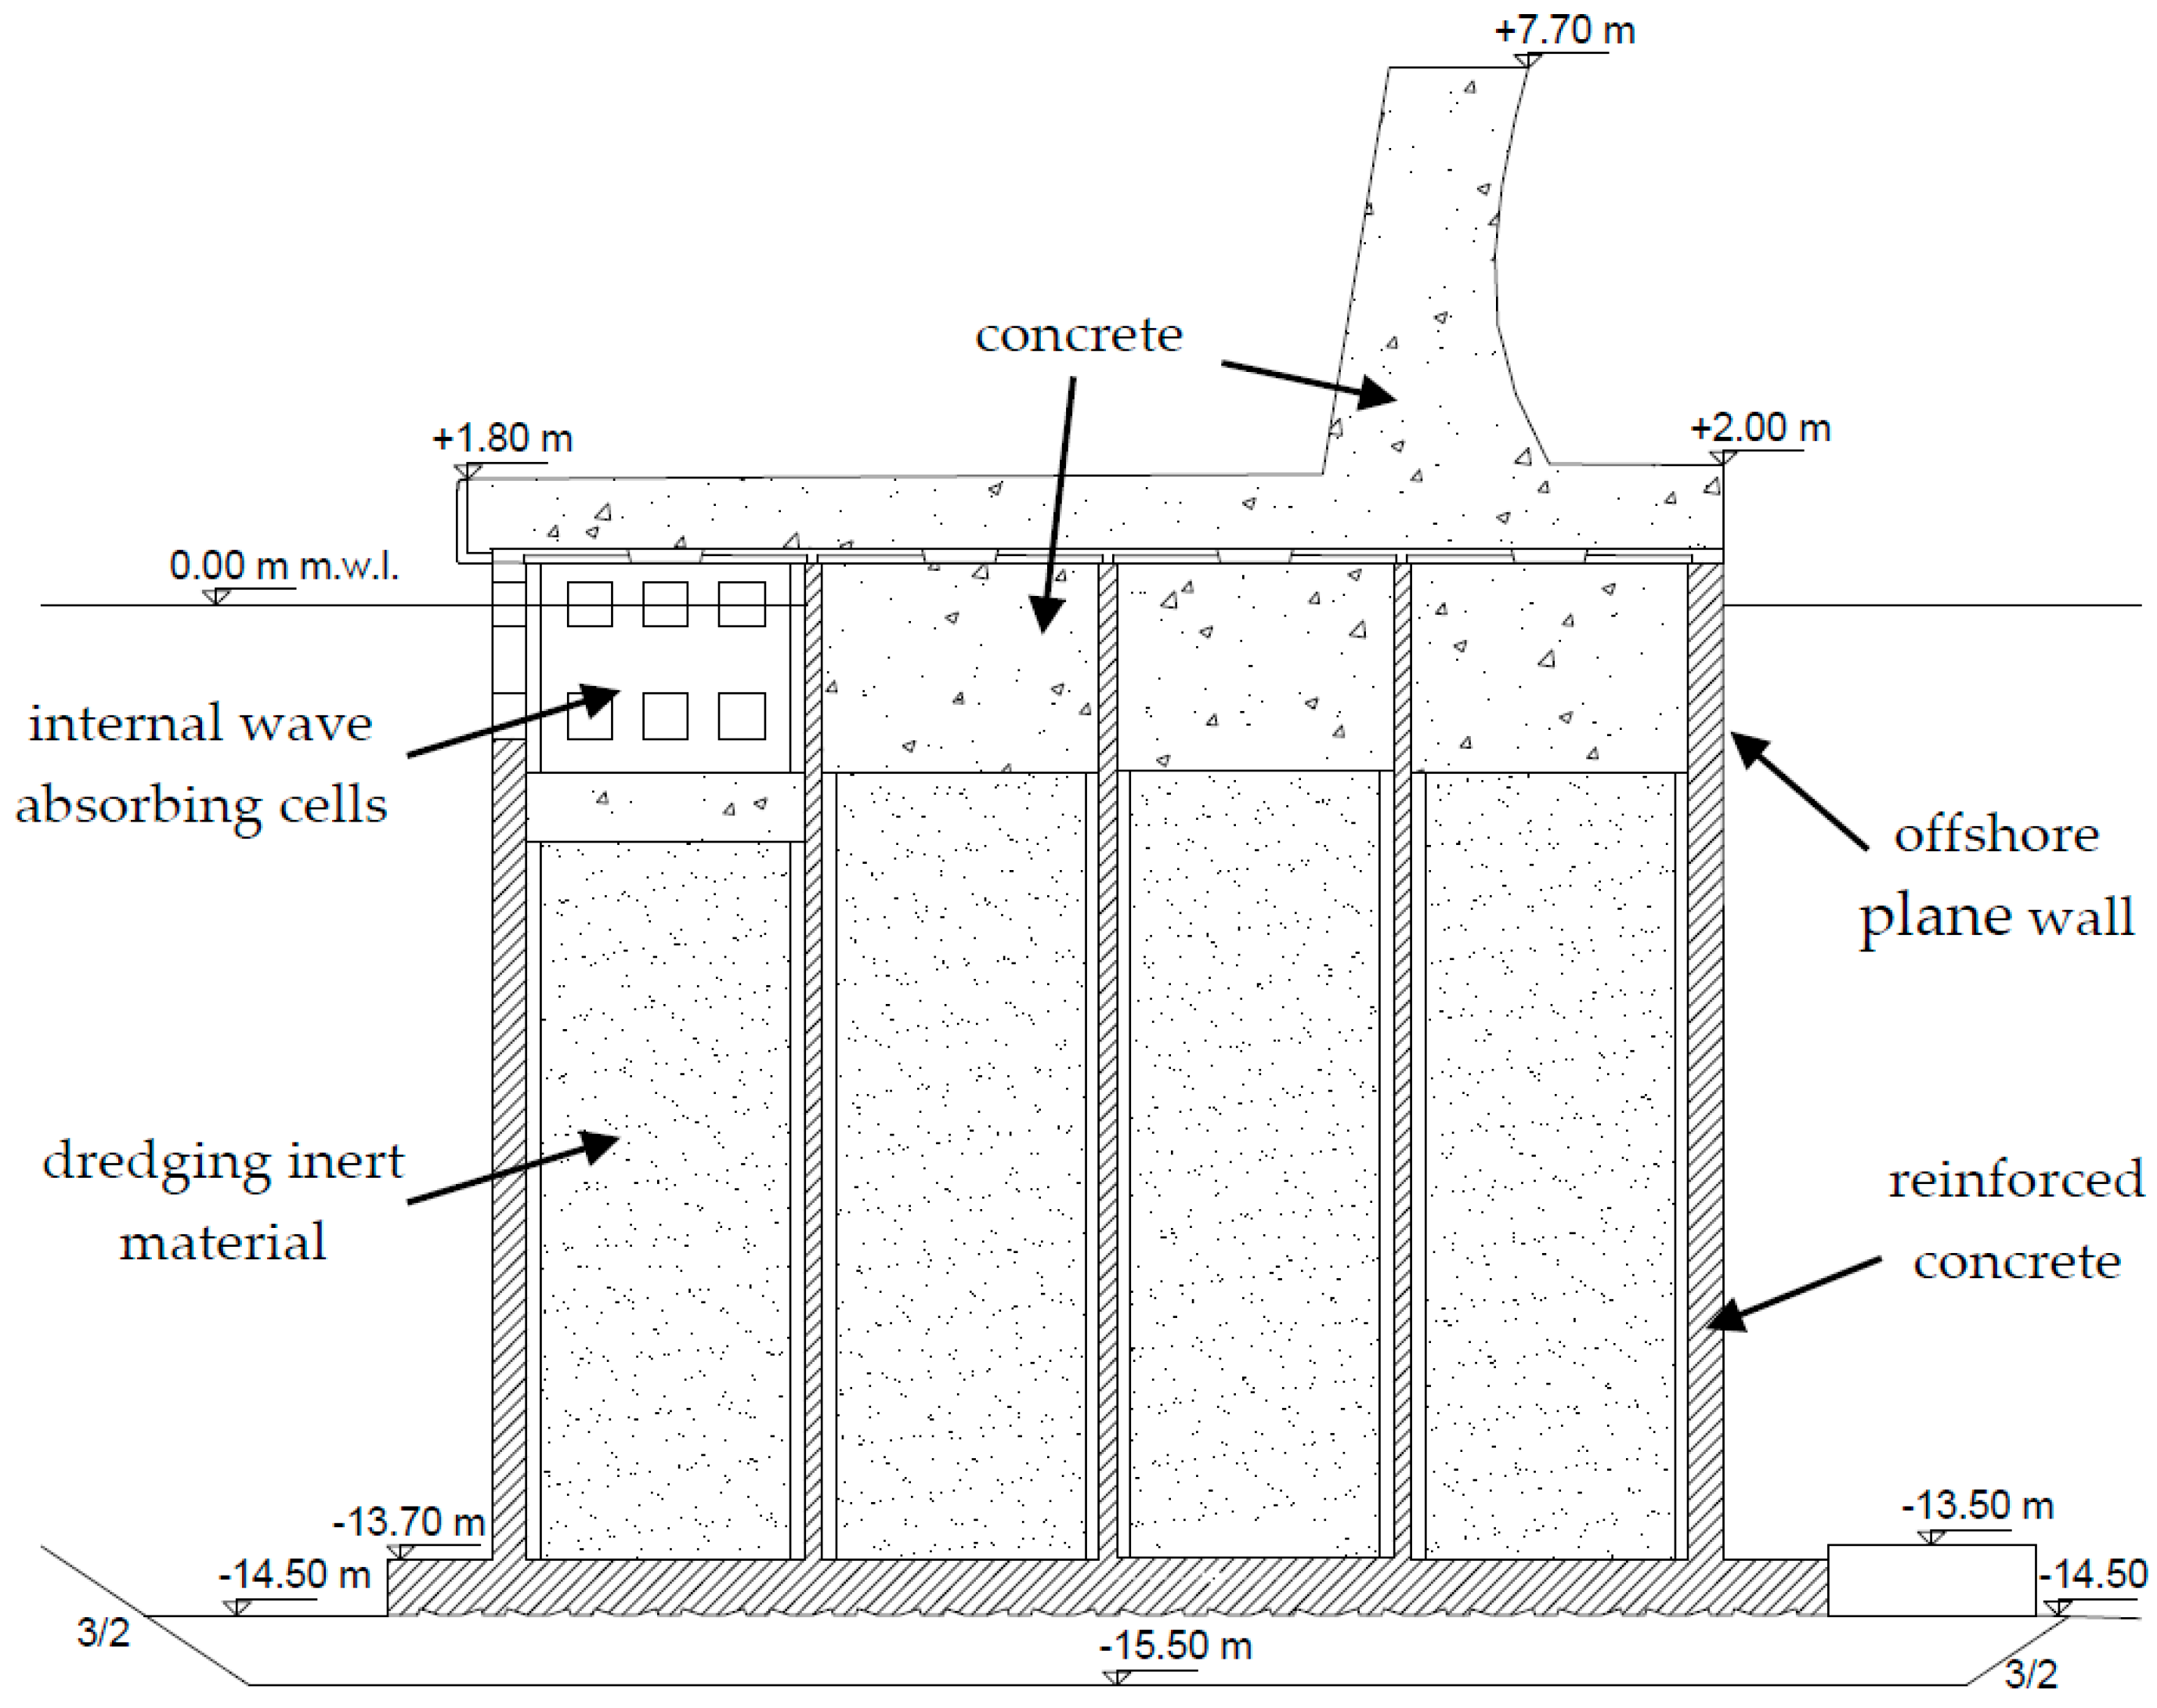
Figure 5 and
Figure 6, the dam extension will be carried out for a length of 176 m, with a plane vertical wall at its offshore side. The caisson will be filled with dredging inert material and with concrete at the top.
Only the first 80 m of the extended part of the dam can contain a WEC, since the final section of the breakwater will include a building which accommodates berthing services for yachts and cruise ships. The WEC system to be located inside that breakwater have been chosen among three types, namely OWC, U-OWC and OBREC, which have been already introduced in
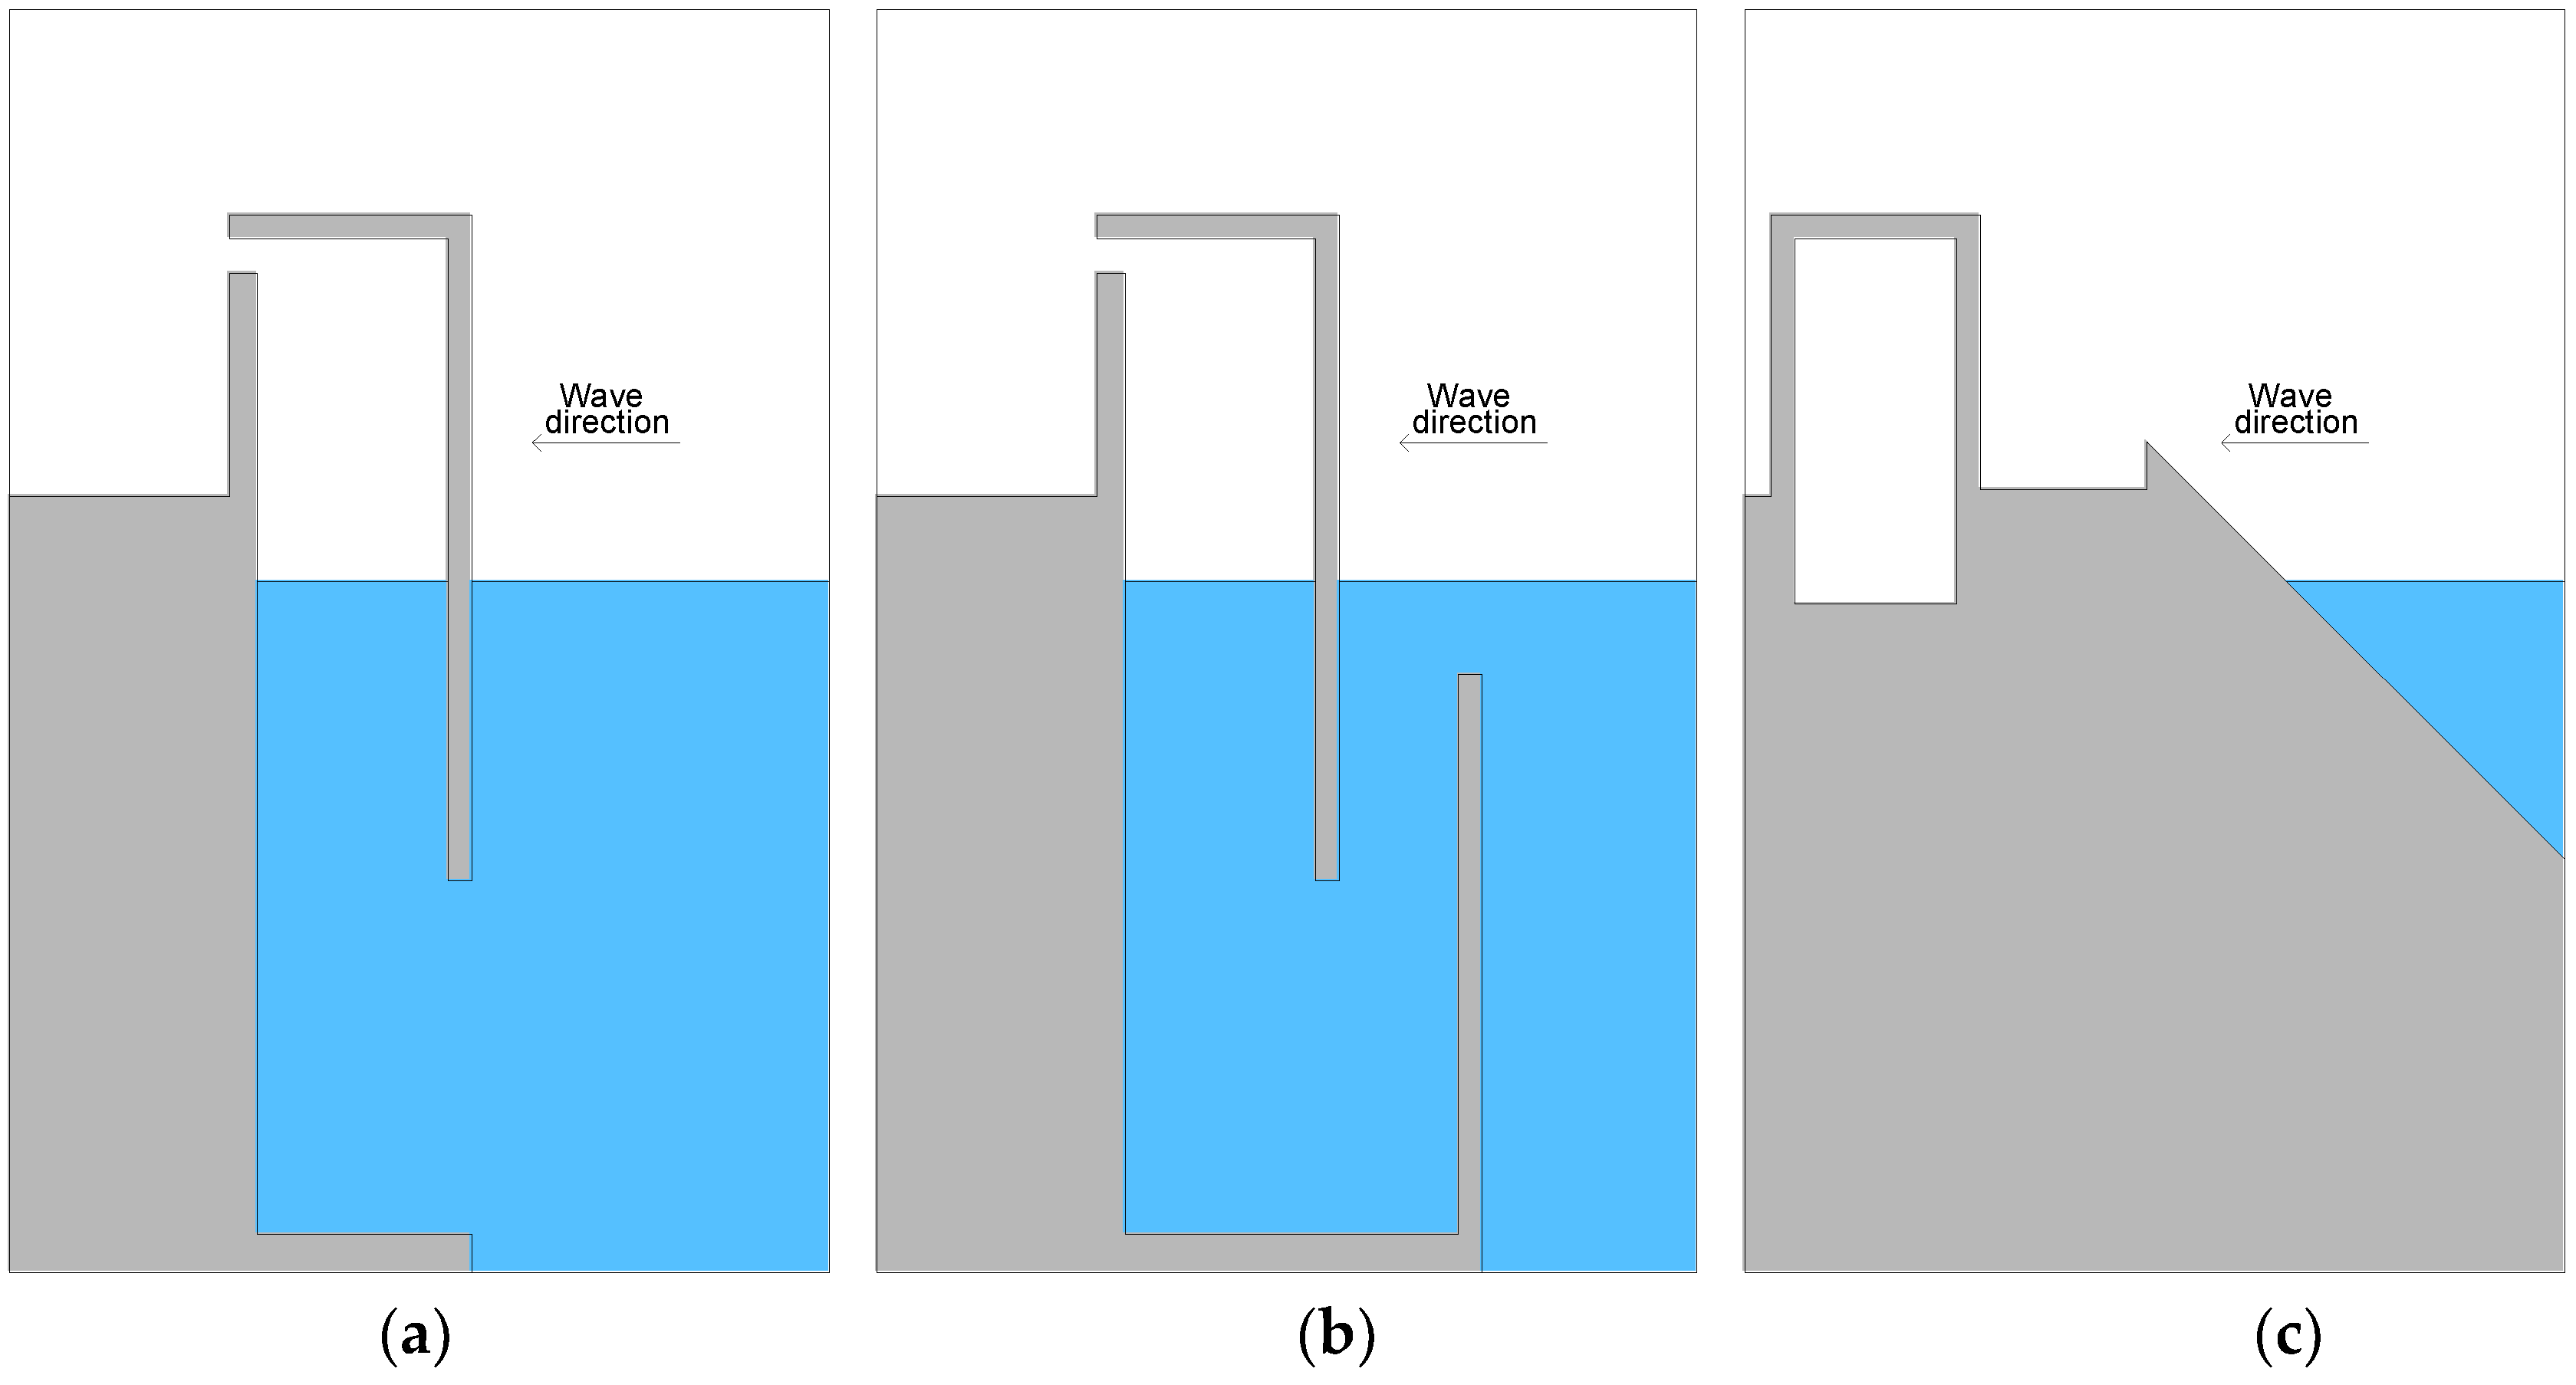
Section 1. The applicability of each system, for the case study, is compared here on the basis of the following consideration and of the sketches shown in
Figure 7.
In particular, rubble mound breakwater cannot be realized in the site of the study, because of the high water depth (greater than 14 m). Furthermore, the development of the port needs to allow for the possibility of provisional docking for large ships at the offshore side of the dam. The point absorber cannot be installed in the site for the same reason. Therefore OWC and U-OWC systems can be installed here much more easily. Moreover the working principle of the OBREC requires the presence of a slope.
The choice between OWC and U-OWC devices is accomplished on the basis of the analysis of the corresponding schematic transverse section, shown in
Figure 7. As specified above, the planned extension of the main breakwater in Giardini Naxos needs a vertical wall under the free surface, for the provisional docking of cruise ships which can have drafts greater than 9 m. Therefore the U-OWC system cannot be used here, for the presence of the submerged U-duct which would impede the large ships to berthing. On the contrary, the choice of the classic OWC system doesn’t require many changes to the planned extension of the port breakwater. Its footprint and maximum height are unchanged, so the increment of the costs for breakwater construction should be limited. The following analysis compares hydrodynamic, structural and economic aspects of embedding the chosen WEC device in the breakwater.
3. Physical Model Setup
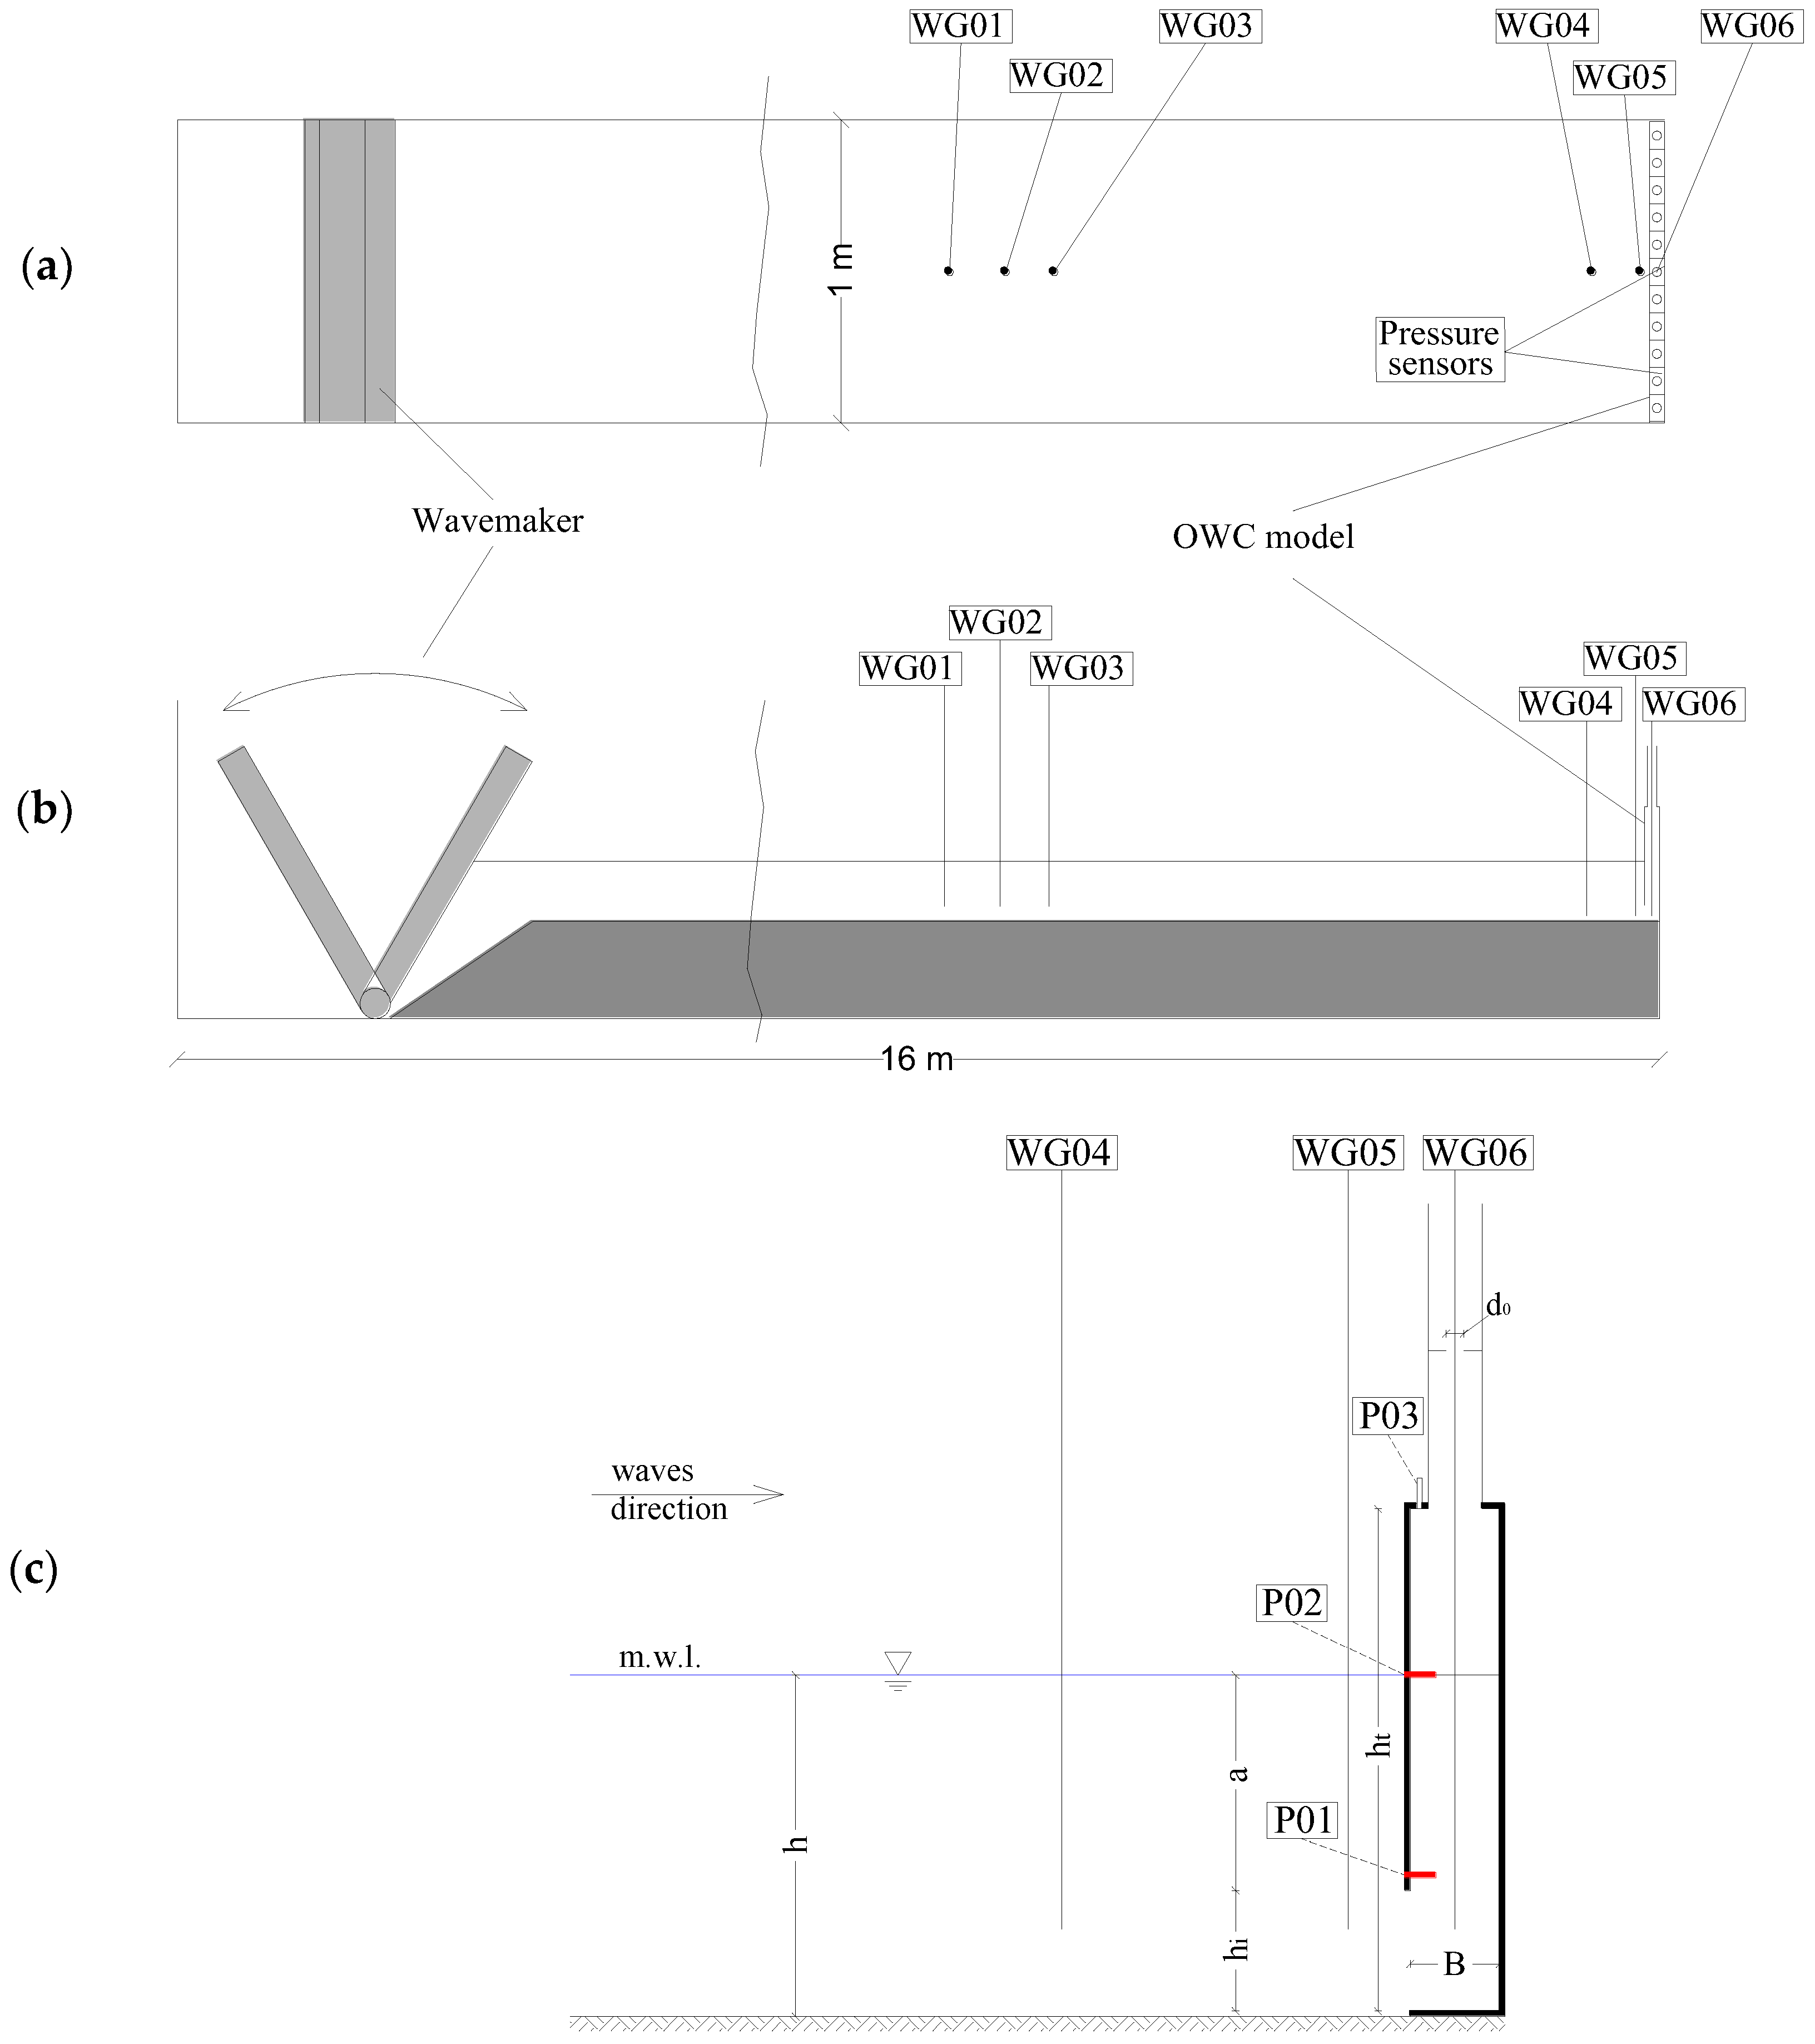
The configuration of the active part of the OWC system is chosen on the basis of physical model tests, carried out in a wave flume at University of Catania, with a scale 1:75 of Giardini Naxos (see
Figure 8). The OWC model is installed at the bottom of the horizontal channel, 16 m far from the wavemaker. Such a model covers the 1 m width of the flume by means of 11 separated chambers, each having internal transversal length
Bt = 0.08 m, height
ht = 0.28 m and longitudinal width
B = 0.05 m. Furthermore, water depth is
h = 0.19 m at still conditions, the anterior wall submergence
a may vary in the range 0.05–0.155 m, the gap opening in vertical wall
hi varies with
a (
hi =
h −
a).
An orifice is inserted inside a vertical conduct, at the top of the caisson, to simulate the air pressure losses due to the installation of a turbine. Two diameters of orifice d0 are tested, i.e., 0.01 m and 0.006 m, giving surface ratio between orifice and chamber (A0/Ac) equal to 1.96% and 0.71%, respectively.
Interactions between waves, front wall and rear air chamber of the model are monitored by means of six wave gauges and three pressure sensor. In detail, three wave gauges (WG01–03) are installed in the center of channel, about 2 m far from the structure. Such gauges are used for the evaluation of the reflection coefficient. Furthermore two gauges (WG04–05) are placed in front of the structure for the evaluation of the wave motion near the front wall. The last wave gauge (WG06) is inserted in the central chamber of the model, in order to furnish data on the air-water interaction inside the OWC.
Three pressure sensors (P01–03) are installed inside the device, each of them being 0.1 m long. P01 and P02 are placed along the front wall, for the evaluation of the loadings. Such sensors are placed in a lateral chamber, in order to avoid their influence on the surface water measurements, since the width of internal chambers is similar to the length of the sensor. The last pressure sensor (P03) is located at the top of the central chamber, and it is used for the study of the air inside the OWC. Data of surface elevation and pressure signal are recorded at frequency 1000 Hz, in order to allow reliable measurements of the peaks for impulsive waves and loadings.
All the wave conditions tested in the laboratory are irregular with mean JONSWAP spectrum with a shape parameter χ
1 = 3.3 and χ
2 = 0.08. The first column of
Table 1 contains tests names, which are defined by considering both wave height and peak period. The following columns contain significant incident wave height
Hm0,i, peak wave period
Tp and the wave steepness
S, ratio between wave height
Hm0,i and wave length
Lp. In particular, the last parameter varies in the range 0.016–0.039.
4. Interactions between OWC and Wave Motion
The available data of the physical model tests are here coupled with wave climate at Giardini Naxos and with literature studies in order to evaluate the main effects of the interaction between wave motion and OWC system, in terms of wave reflection, loadings and noise. In particular, the variability of both front wall submergence and orifice opening has been studied, by means of physical model measurements on wave motion and pressure. The estimation of the noise produced by the system is executed on the basis of a sea state condition representative of the annual wave motion. All the results reported here allow one to carry out the design of the breakwater, with embedded OWC device, for the site of interest.
4.1. Reflection Coefficient
Incident waves interacting with coastal structures are partly reflected by those structures. A reflection coefficient
Cr can be introduced for random waves, defined as the ratio between reflected and incident significant wave heights. Such a coefficient assumes a maximum fixed value for vertical wall breakwaters:
Cr = 0.9 independently from the characteristics of waves [
32]. On the contrary, reflection coefficient assumes lower and variable values for Jarlan type caissons [
33] and combined caisson with internal rubble mound [
34,
35], as function of the characteristics of waves and structures. Reflection coefficient behavior for OWC breakwaters is similar to that of Jarlan type caissons. Furthermore such a coefficient is expected to increase, up to 0.9, with increasing front wall submergence
a, since the OWC would become a vertical wall if submergence was equal to water depth.
The influence of the PTO damping on the energy conversion has been investigated in [
36] for regular waves and in [
37] for irregular waves. The orifice used in the tank test in place of a PTO system may provide constant damping coefficient. Nevertheless, the orifice influences the reflection coefficient, causing a maximum value for the closed duct and a minimum value for the optimized orifice dimension [
38,
39,
40]. In the physical model of Giardini Naxos, PTO is substituted with a restriction, i.e., an orifice.
Reflection coefficient is estimated here by means of three-probes method [
41]. Such a method uses three wave gauges, i.e., WG01, WG02 and WG03 (see
Figure 8), placed at reciprocal positions
x12 = 18.5 cm and
x13 = 34.5 cm, which correspond to the distances WG01-WG02 and WG01-WG03, respectively.
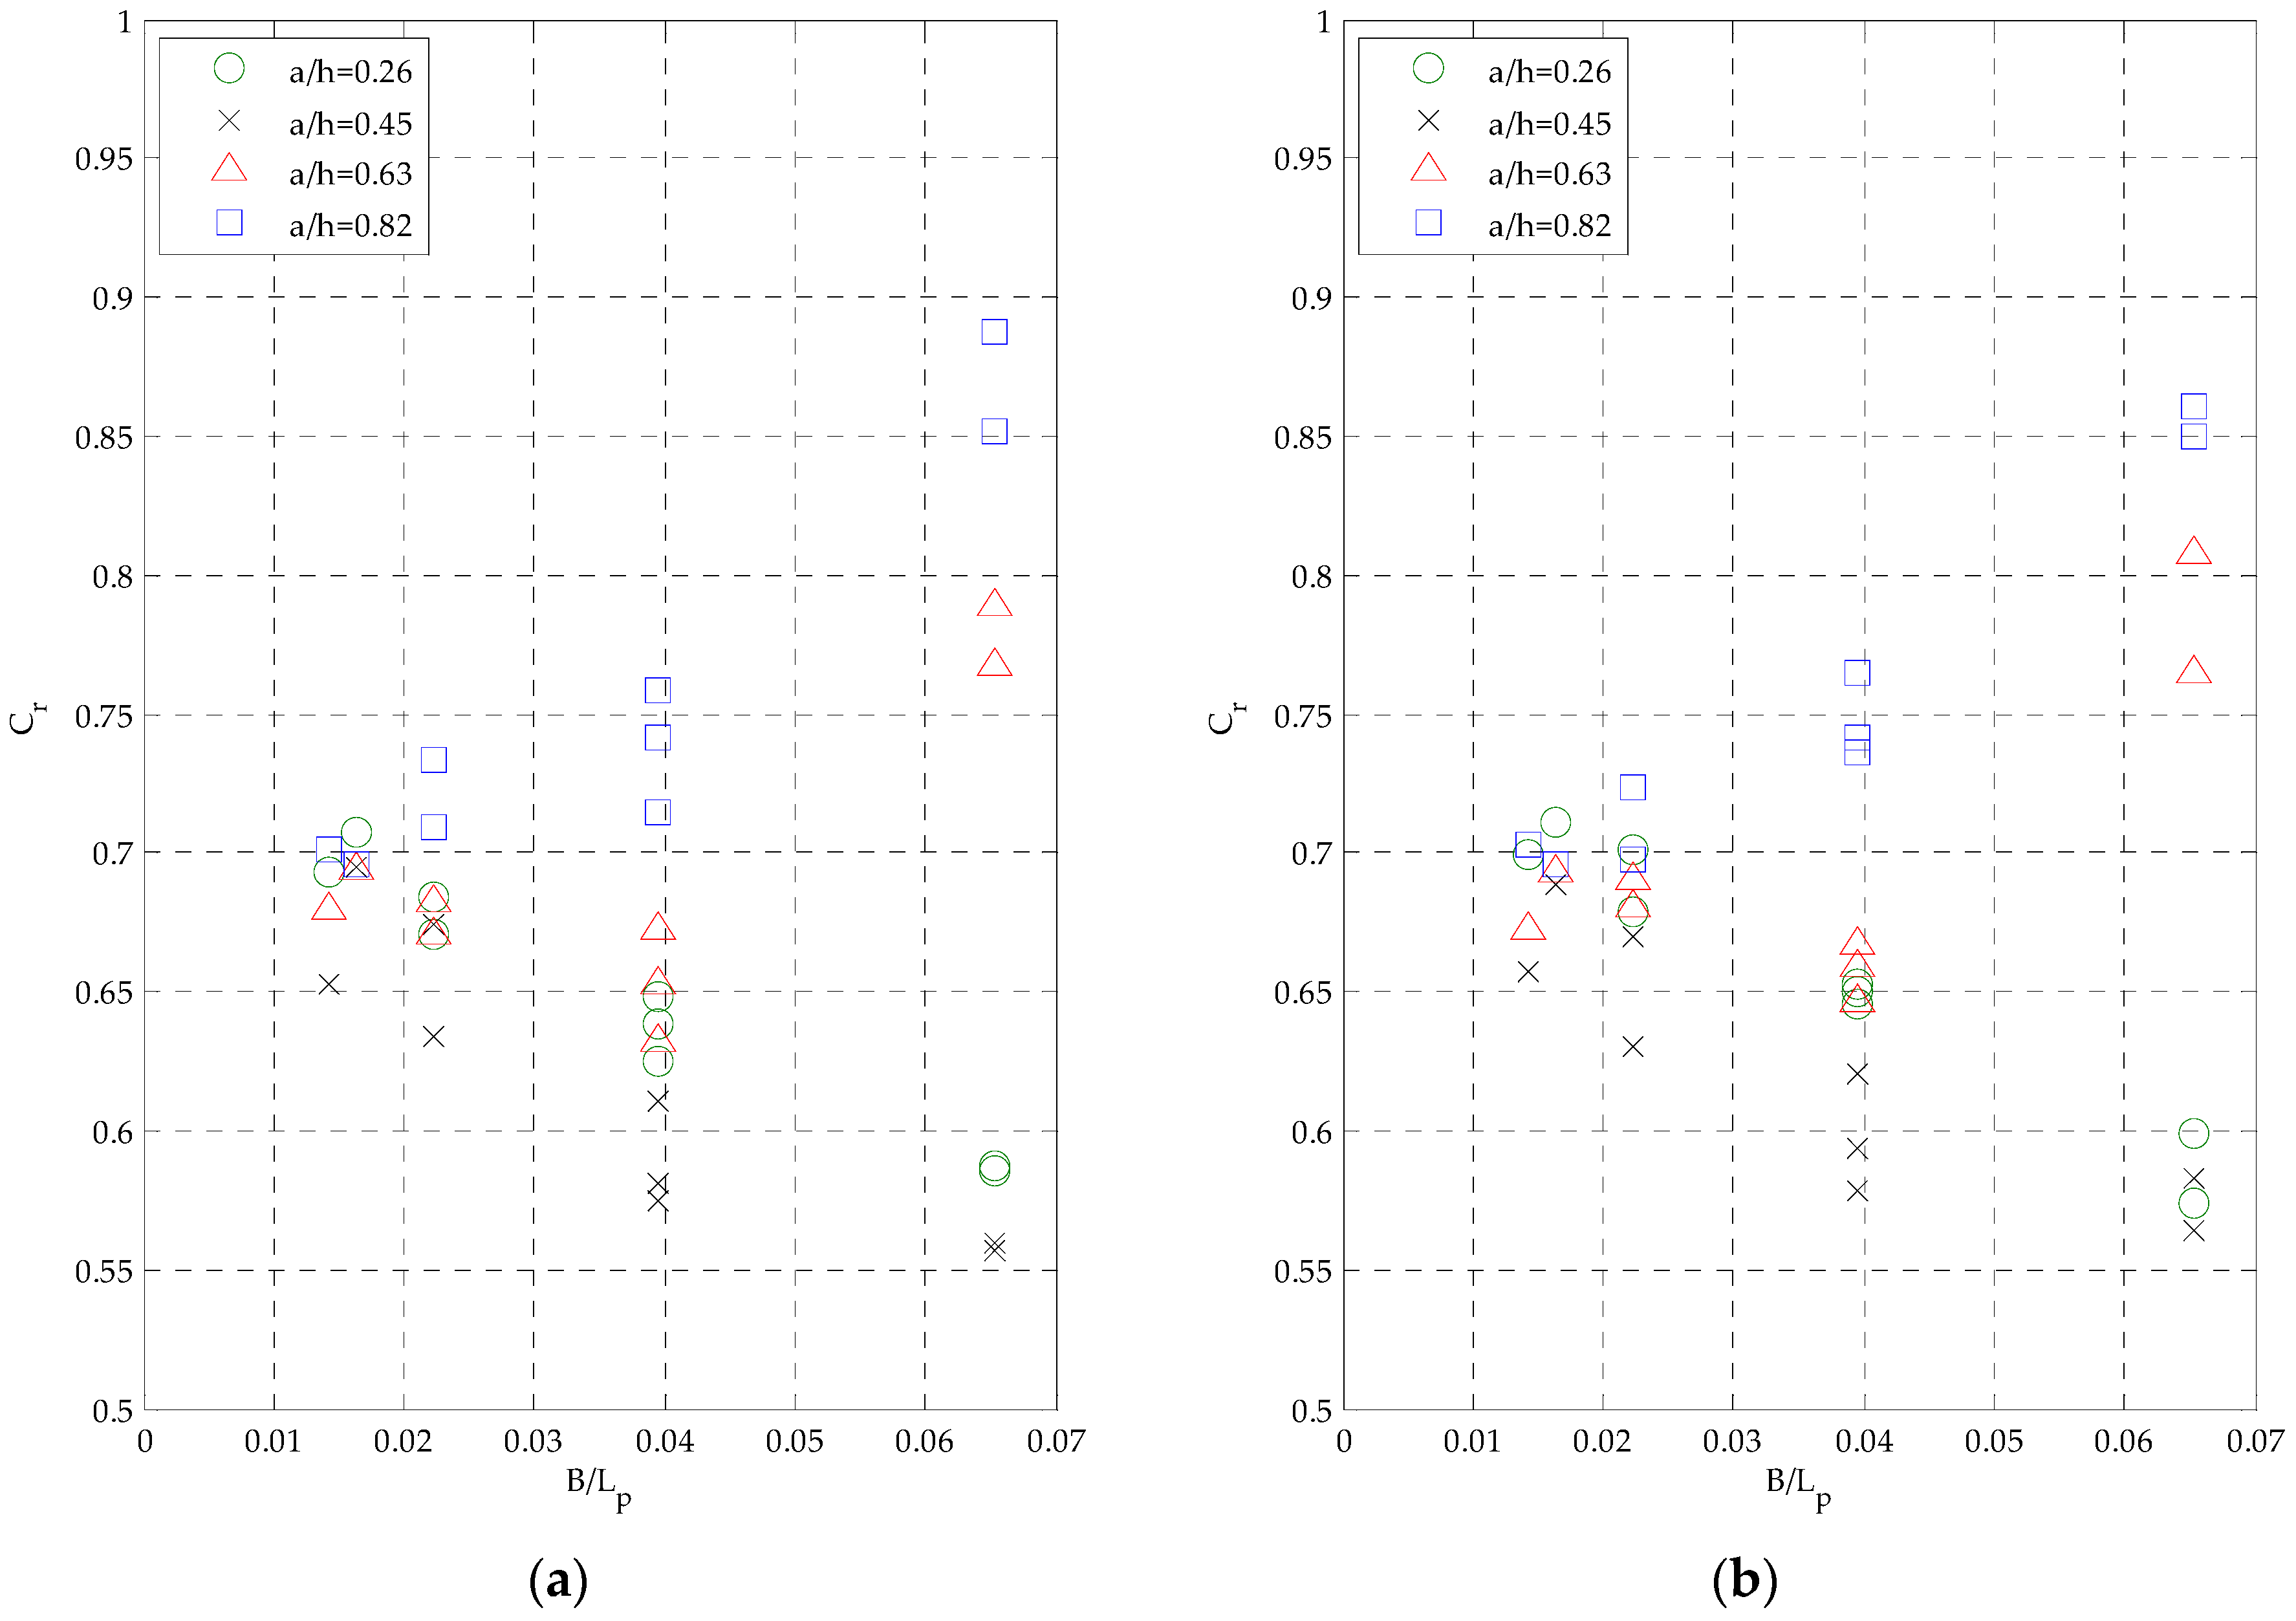
Figure 9 shows the influence of relative front wall submergence
a/
h and of relative orifice section
A0/
Ac, where
A0 = π/4·
d02 is the area of the orifice,
Ac =
B·Bt is the horizontal section of internal chamber. Reflection coefficient is represented as a function of the ratio between the width of internal chamber and the peak wave length
B/
Lp. In particular,
Cr is in the range 0.55–0.9 for the greatest values of
B/
Lp. Furthermore,
Cr tends to converge toward the value 0.7 when
B/
Lp decreases, independently from the geometry of OWC. The variability of orifice diameter does not influence appreciably the reflection coefficient, in this case, because the orifice diameter tested are near the optimum value and are less influential than the wide of the chamber. However it is possible to observe that the
Cr moves toward 0.9 for highest submergence
a and smallest orifice diameter
d0, since in such a condition wave energy conversion is poor and the OWC acts like a vertical breakwaters.
The influence of front wall submergence plays a key role on reflection coefficient when B/Lp > 0.02. In particular, minimum values of Cr are found when the relative submergence a/h = 0.45, independently from orifice diameter. Therefore, such a value of relative submergence represents an optimum for the tested device which can be used to design the OWC breakwater for the case study.
The obtained reflection coefficients are compared with results of large scale tests [
38], giving reflection coefficients about 10% bigger than the large scale experiments, for similar
B/
Lp. Such a difference has been considered fairly acceptable for the tests carried out.
4.2. Loadings
The effects of front wall submergence and orifice opening are investigated by analyzing loadings at the front wall, i.e., the weakest structural part of OWC devices [
29]. The measured loadings are compared with Sainflou formulation for vertical wall breakwaters [
42], with the aim of evaluating the reliability of such a simple formula in the case study.
Pressures on the front wall are recorded by means of sensors P01 and P02 (see
Figure 8), located at the mean water level and at the lower edge of that wall respectively. The signals are sampled at 1000 Hz, in order to allow for a reliable measurement of the peaks for impulsive waves. The analysis of the signal is conducted by filtering only negative values of pressures, in order to exclude peaks due to wet and dry effect on the probes [
38].
Instantaneous forces per unit length are obtained from the filtered signals of pressure, by integrating them along the front wall, up to the free surface elevation. Such an elevation at front wall is estimated by an extrapolation of the signals measured at the closest wave gauges, i.e., WG04 and WG05.
The greatest four peaks of the loadings are extracted from each test of 1000 waves. The average value of such peaks represents the 1/250 maximum value of the signal [
43,
44] that is more reliable than
Fmax on a range of 1000 wave. Such a maximum has been obtained both for force and pressures at the front wall. In particular, the maximum pressure profiles are shown in
Figure 10, for tests having the same incident waves (labeled H50T12 in
Table 1), and different orifice relative section
A0/
Ac, equal to 0.71% and 1.96% respectively. Four different front wall relative submergences
a/
h are also present, varying in the range 0.26–0.82. The highest point of pressure profiles is a 1/250 maximum surface elevation, corresponding to the mean value of free surface registered at the peaks of the loading. The pressure is divided by
ρgHm0,i, so obtaining a dimensionless pressure parameter. Furthermore, the elevations
z are made dimensionless by dividing it by the water depth
h.
The resulting pressure profiles of the Sainflou formulation are also shown in
Figure 10, as a thick line. Such a formulation is applied starting from the wall submergence of each tested geometric configuration of OWC, since it is valid for vertical walls. The Sainflou formula is shown to be fairly reliable here because all the tested wave conditions are far from the breaking limit, and they do not cause impulsive loadings. Nevertheless, the maximum free surface elevation predicted by such a formula show a small underestimation of the measured values. On the contrary, the pressures at the lowest part of the front wall are always overestimated by predictions of Sainflou formula.
The effect of submerged front vertical wall is evident when
a/
h reaches its smallest value, i.e., 0.45. In such a case the maximum pressure (1/250) at mean water level is greater than the one predicted by means of Sainflou formula. The increase of orifice dimension causes a slight reduction of measured pressures, with exception of the greatest submergence configuration, shown in
Figure 10d, for which orifice dimension does not give a clear effect on loadings.
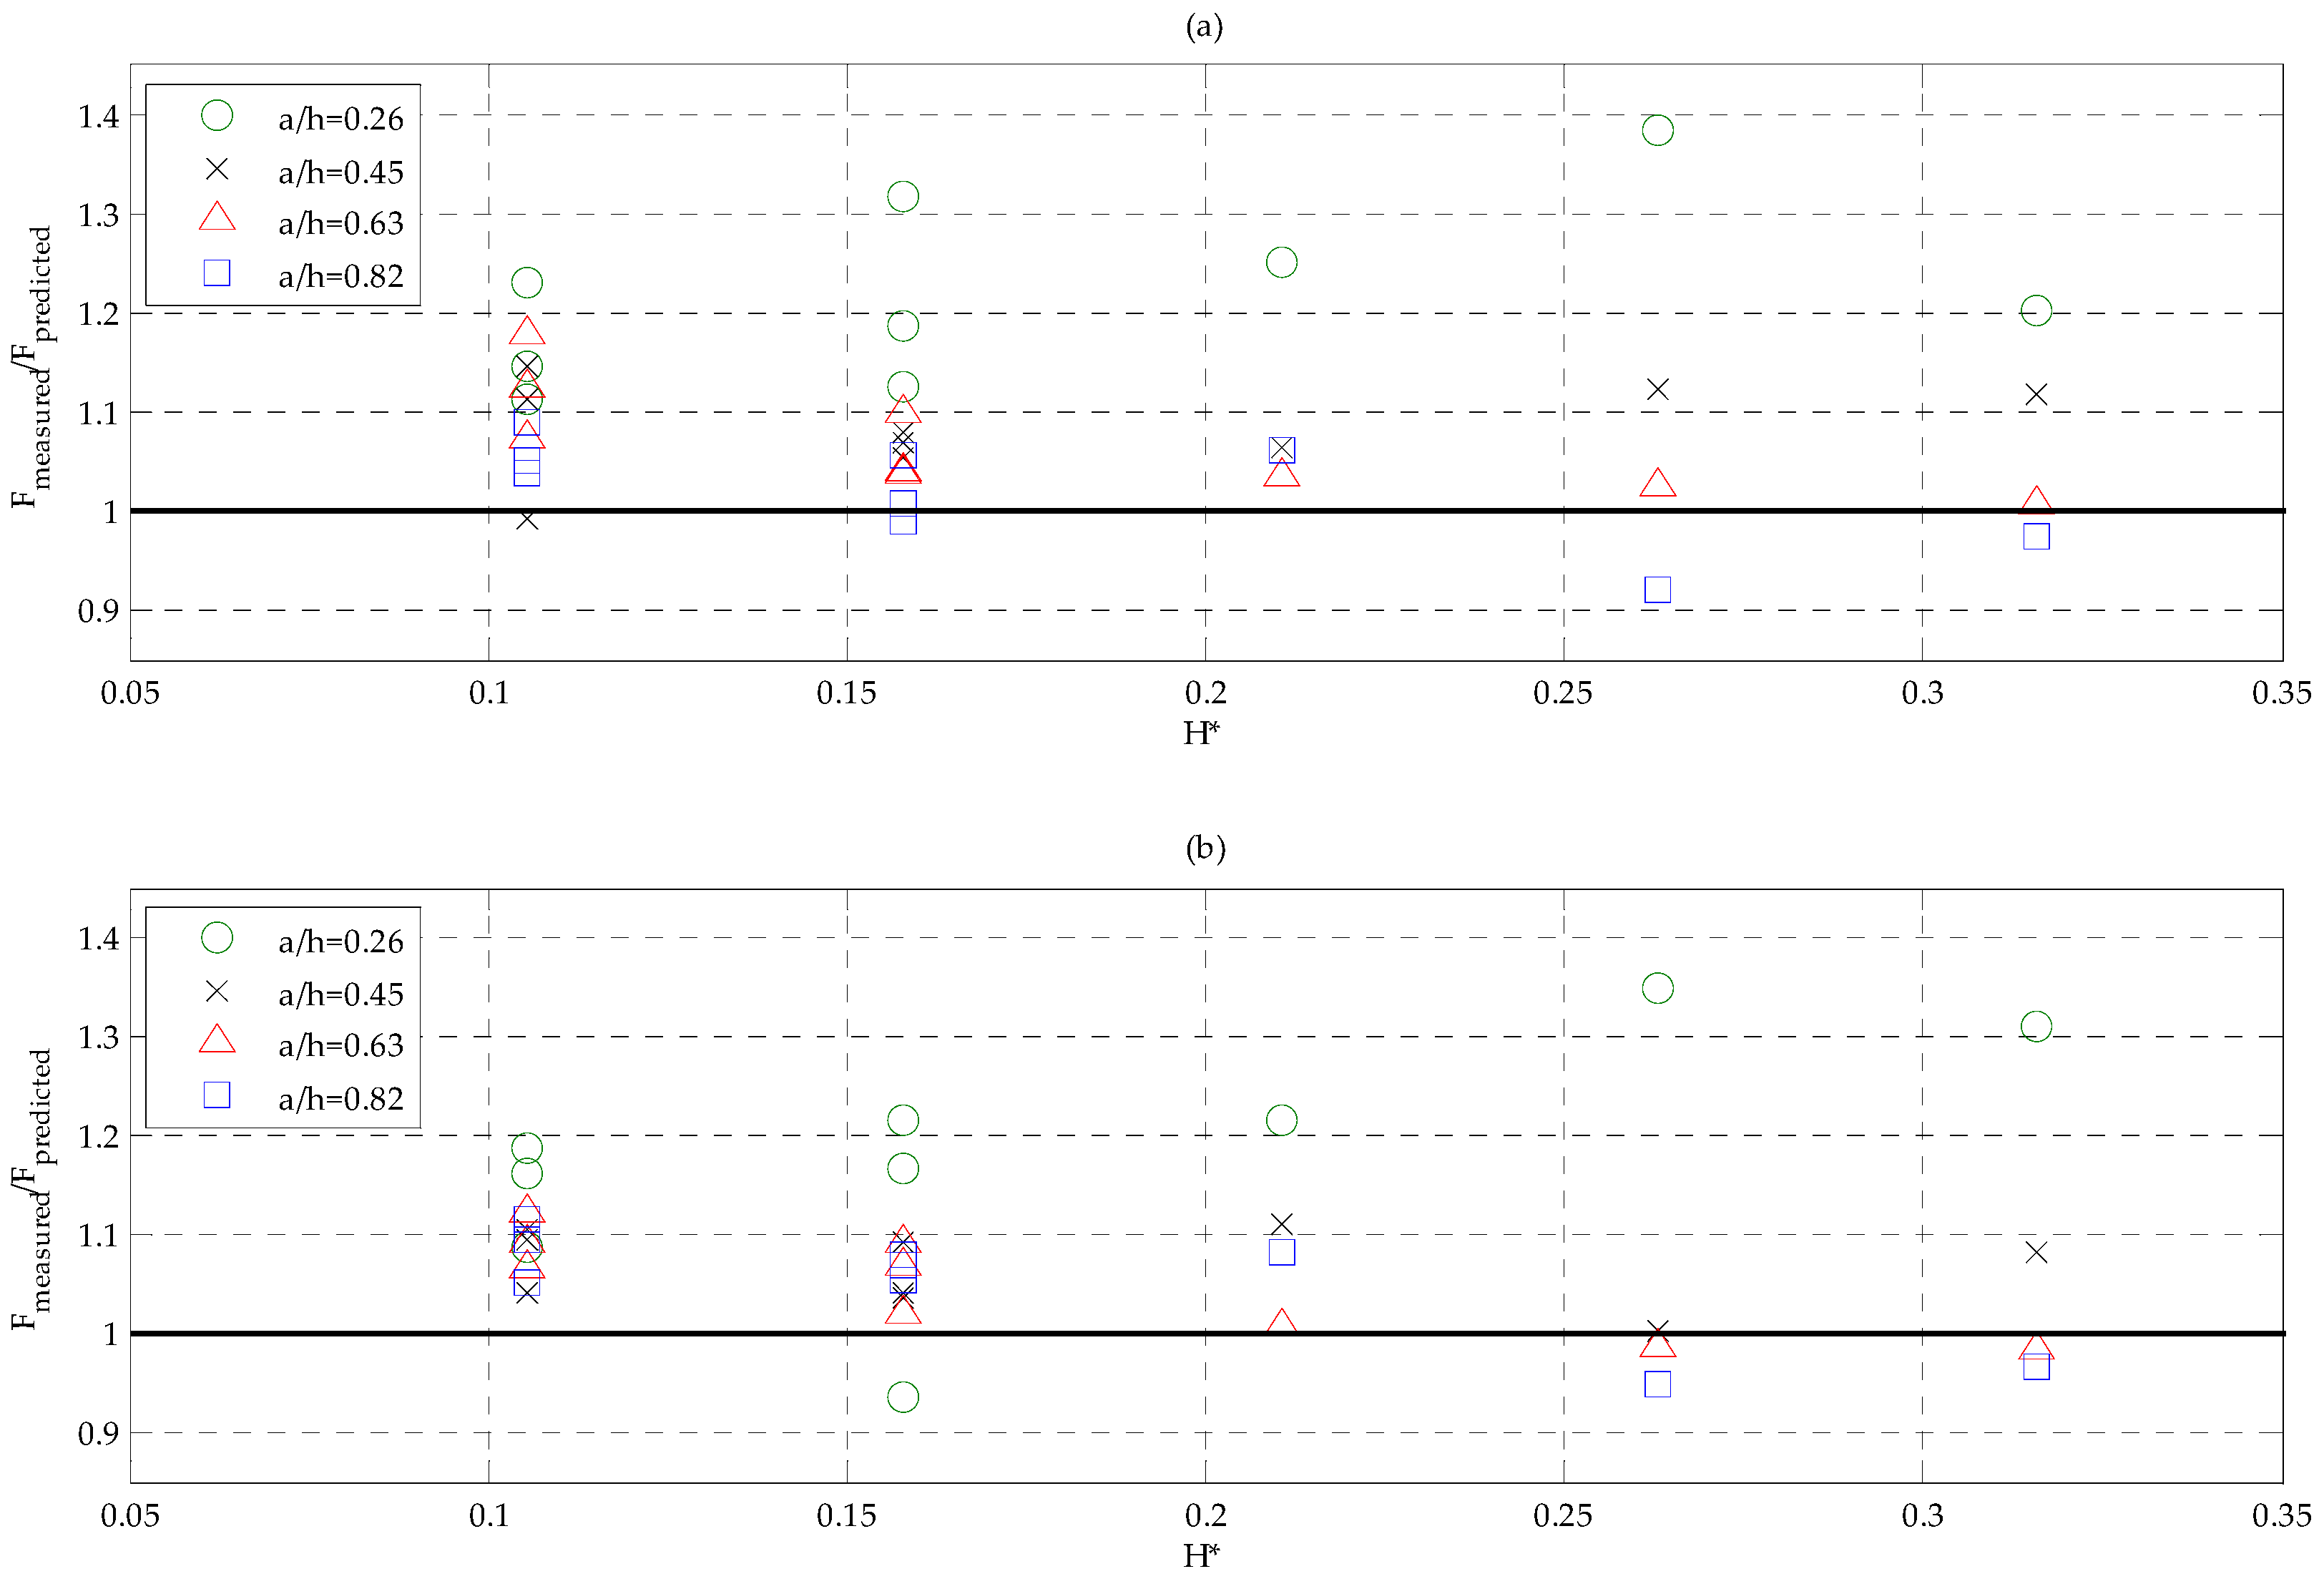
Both measured and predicted maximum pressures (1/250) have been integrated along the front wall in order to find the corresponding 1/250 forces.
Figure 11 shows the forces obtained for all the tests carried out, divided by those predicted using Sainflou formulation [
42]. Therefore, values greater than 1 mean that measured forces are underpredicted. In abscissa the relative wave height
H* =
Hm0,i/
h is reported, in order to investigate the effect of wave magnitude.
The influence of the front wall relative submergence a/h is clear: (i) the smallest tested submergence (a/h = 0.26) causes the greatest underestimation of measured forces, which are nearly 40% greater than predicted; (ii) Sainflou formula becomes even more reliable for increasing wall submergence, and it gives safe values for H* > 0.25 and a/h > 0.6; (iii) for a/h = 0.45, an intermediate condition is achieved since. Sainflou formula furnishes ratios between measured and predicted forces which are all close to 1.1. This last relative submergence analysis corresponds to the optimized configuration found on the basis of the reflection coefficients.
4.3. Turbine Noise
The compressed (and decompressed) air flux at the PTO causes the propagation of pressure waves which in turn produces noise. Such an effect is a function of interaction between waves and pneumatic chamber, and it is highly pronounced with regard to the waves with the most energy. The noise here is assessed on the basis of an experimental study on the full-scale prototype for Wells turbine [
45]. In particular, the noise is usually defined as the sound power level
Lw, expressed in dB. Such a parameter can be written as a function of a specific sound power level
Lw,spec, which has been estimated experimentally:
where
is the volume flow rate;
is the reference flow rate equal to 1 m
3/s; Δ
pts is the pressure total static and Δ
p0 is the reference pressure equal to 1 Pa.
Lw,spec is considered equal to 40 dB, on the basis of experimental tests carried out with different kinds of turbine rotors.
Such a formulation was firstly applied to the full-scale turbine installed in the LIMPET wave power plant, by considering sixteen sea states having different wave heights and periods. The noise caused by the turbine for those sea states increased with the wave height and falls within the range of 120–140 dB [
45].
For the site of Giardini Naxos, the noise has been evaluated by means of the formula obtained for the LIMPET OWC device, since the installation of a similar Wells turbine is assumed. In particular, a characteristic occurrence has been considered for the presented feasibility study, equal to five days per year. The sea state which is exceeded for such a period in Giardini Naxos has a significant wave height equal to 1.5 m. On the basis of the aforementioned methodology, the characteristic annual sound power level, corresponding to 5 days/year sea state, is 120 dB. Such a value is very high if compared to the pain tolerance level, which is equal to 125 dB [
46].
The outcomes of this noise evaluation for the case study highlights the need for a system which might reduce such an extreme sound level. Therefore, the breakwater design must be optimized by also considering such a critical aspect, in order to reduce the sound level of the noise within a range compatible with the current and expected activities of the port.
5. Feasibility Study the OWC Breakwater
The main outcomes from the interactions between waves and OWC are used for the design of the breakwater for the case study, in order to gain: (i) low reflected wave heights; (ii) structural stability; (ii) noise reduction; and (iv) economic return.
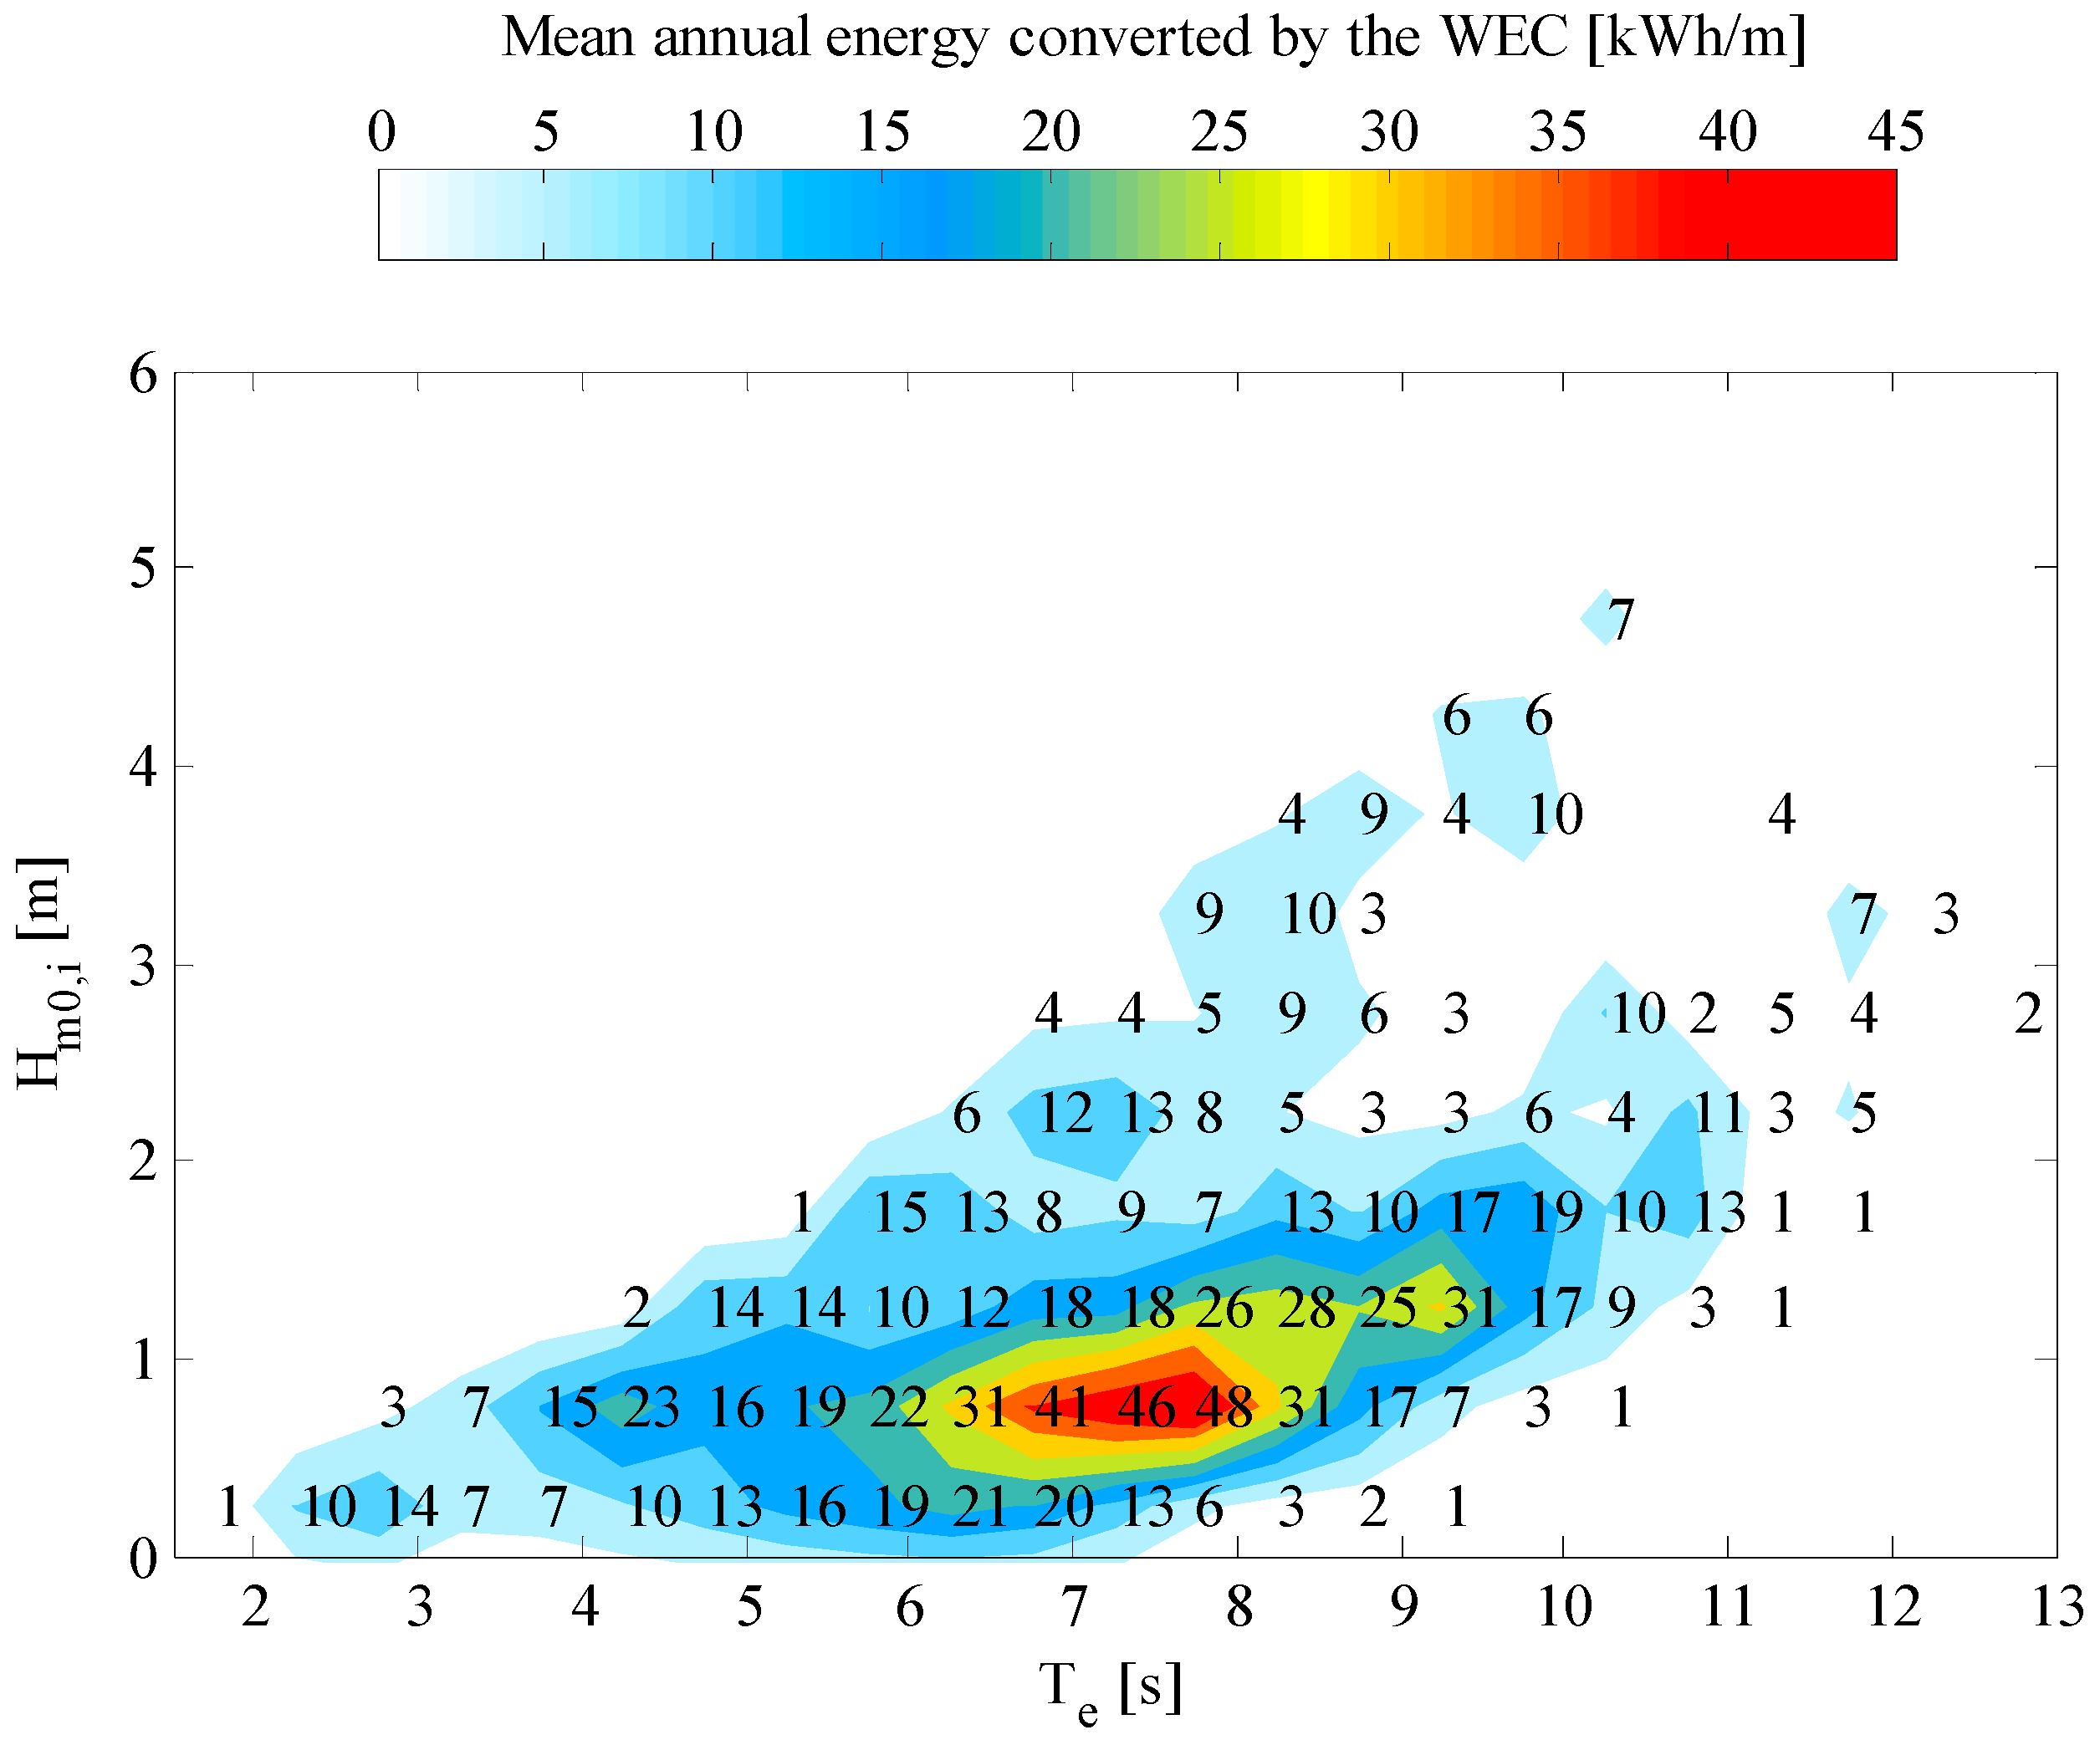
The site of the study was chosen in order to evaluate the feasibility of the OWC system in a low energy site such as the Mediterranean Sea. In
Figure 12, the power matrix of the WEC is shown as function of the energetic period
Te and of the significant wave height
Hm0,i. Such a power matrix is obtained on the basis of the reflection coefficient and of the PTO performance deduced in [
47].
Large scale tests on a generalized OWC showed that the reflection coefficient (
Cr =
Hm0,r/
Hm0,i) is equal to 0.9 when the orifice is closed [
38]. Therefore, the dissipation of energy related to the water sloshing into the chamber is independent from incident waves, and the mean wave energy converted by the PTO can be estimated on the basis of the reflection coefficient:
in which
ηm is the mean performance of the PTO for the sea state, here estimated on the basis of the water level measured inside the chamber of the physical model, by applying the performance characteristics
of the PTO:
where the parameter
(
t) =
V0(
t)/
Ut is obtained from experiments;
V0(
t) =
Ac/
A0dζ/
dt is the axial flow rate at the PTO; ζ(
t) is the free surface elevation inside the chamber;
Ut is the tangent rotor velocity, chosen in order to maximize the performance by achieving
= 0.12 for the mean value of axial flow rate [
47];
tend and
t0 are the final and initial instants of the free surface time trace. In such a way, a value of PTO mean performance is obtained for each pair of
Hm0,i and
Te.
In Giardini Naxos, the breakwater extension is planned to be achieved by means of a reinforced concrete caisson, filled with dredged sand and gravels (see
Figure 6, in
Section 2). The presence of a vertical wall at the offshore side of the breakwater would allow berthing of large ships under extremely calm conditions. Nevertheless, such a breakwater would cause a strong increase of wave magnitude due to the complete reflection of waves in front of its vertical wall.
The presence of a WEC device embedded in the breakwater needs several modification to such a planned section, mainly concentrated at its offshore side. In particular, the first seaward chamber of the caisson becomes the active part of the OWC system, so it is connected to sea at the bottom and forms the pneumatic chamber at the top. Furthermore, the PTO (turbine) could be inserted in the first chamber in order to locate the dock along the remaining shoreward part of breakwater.
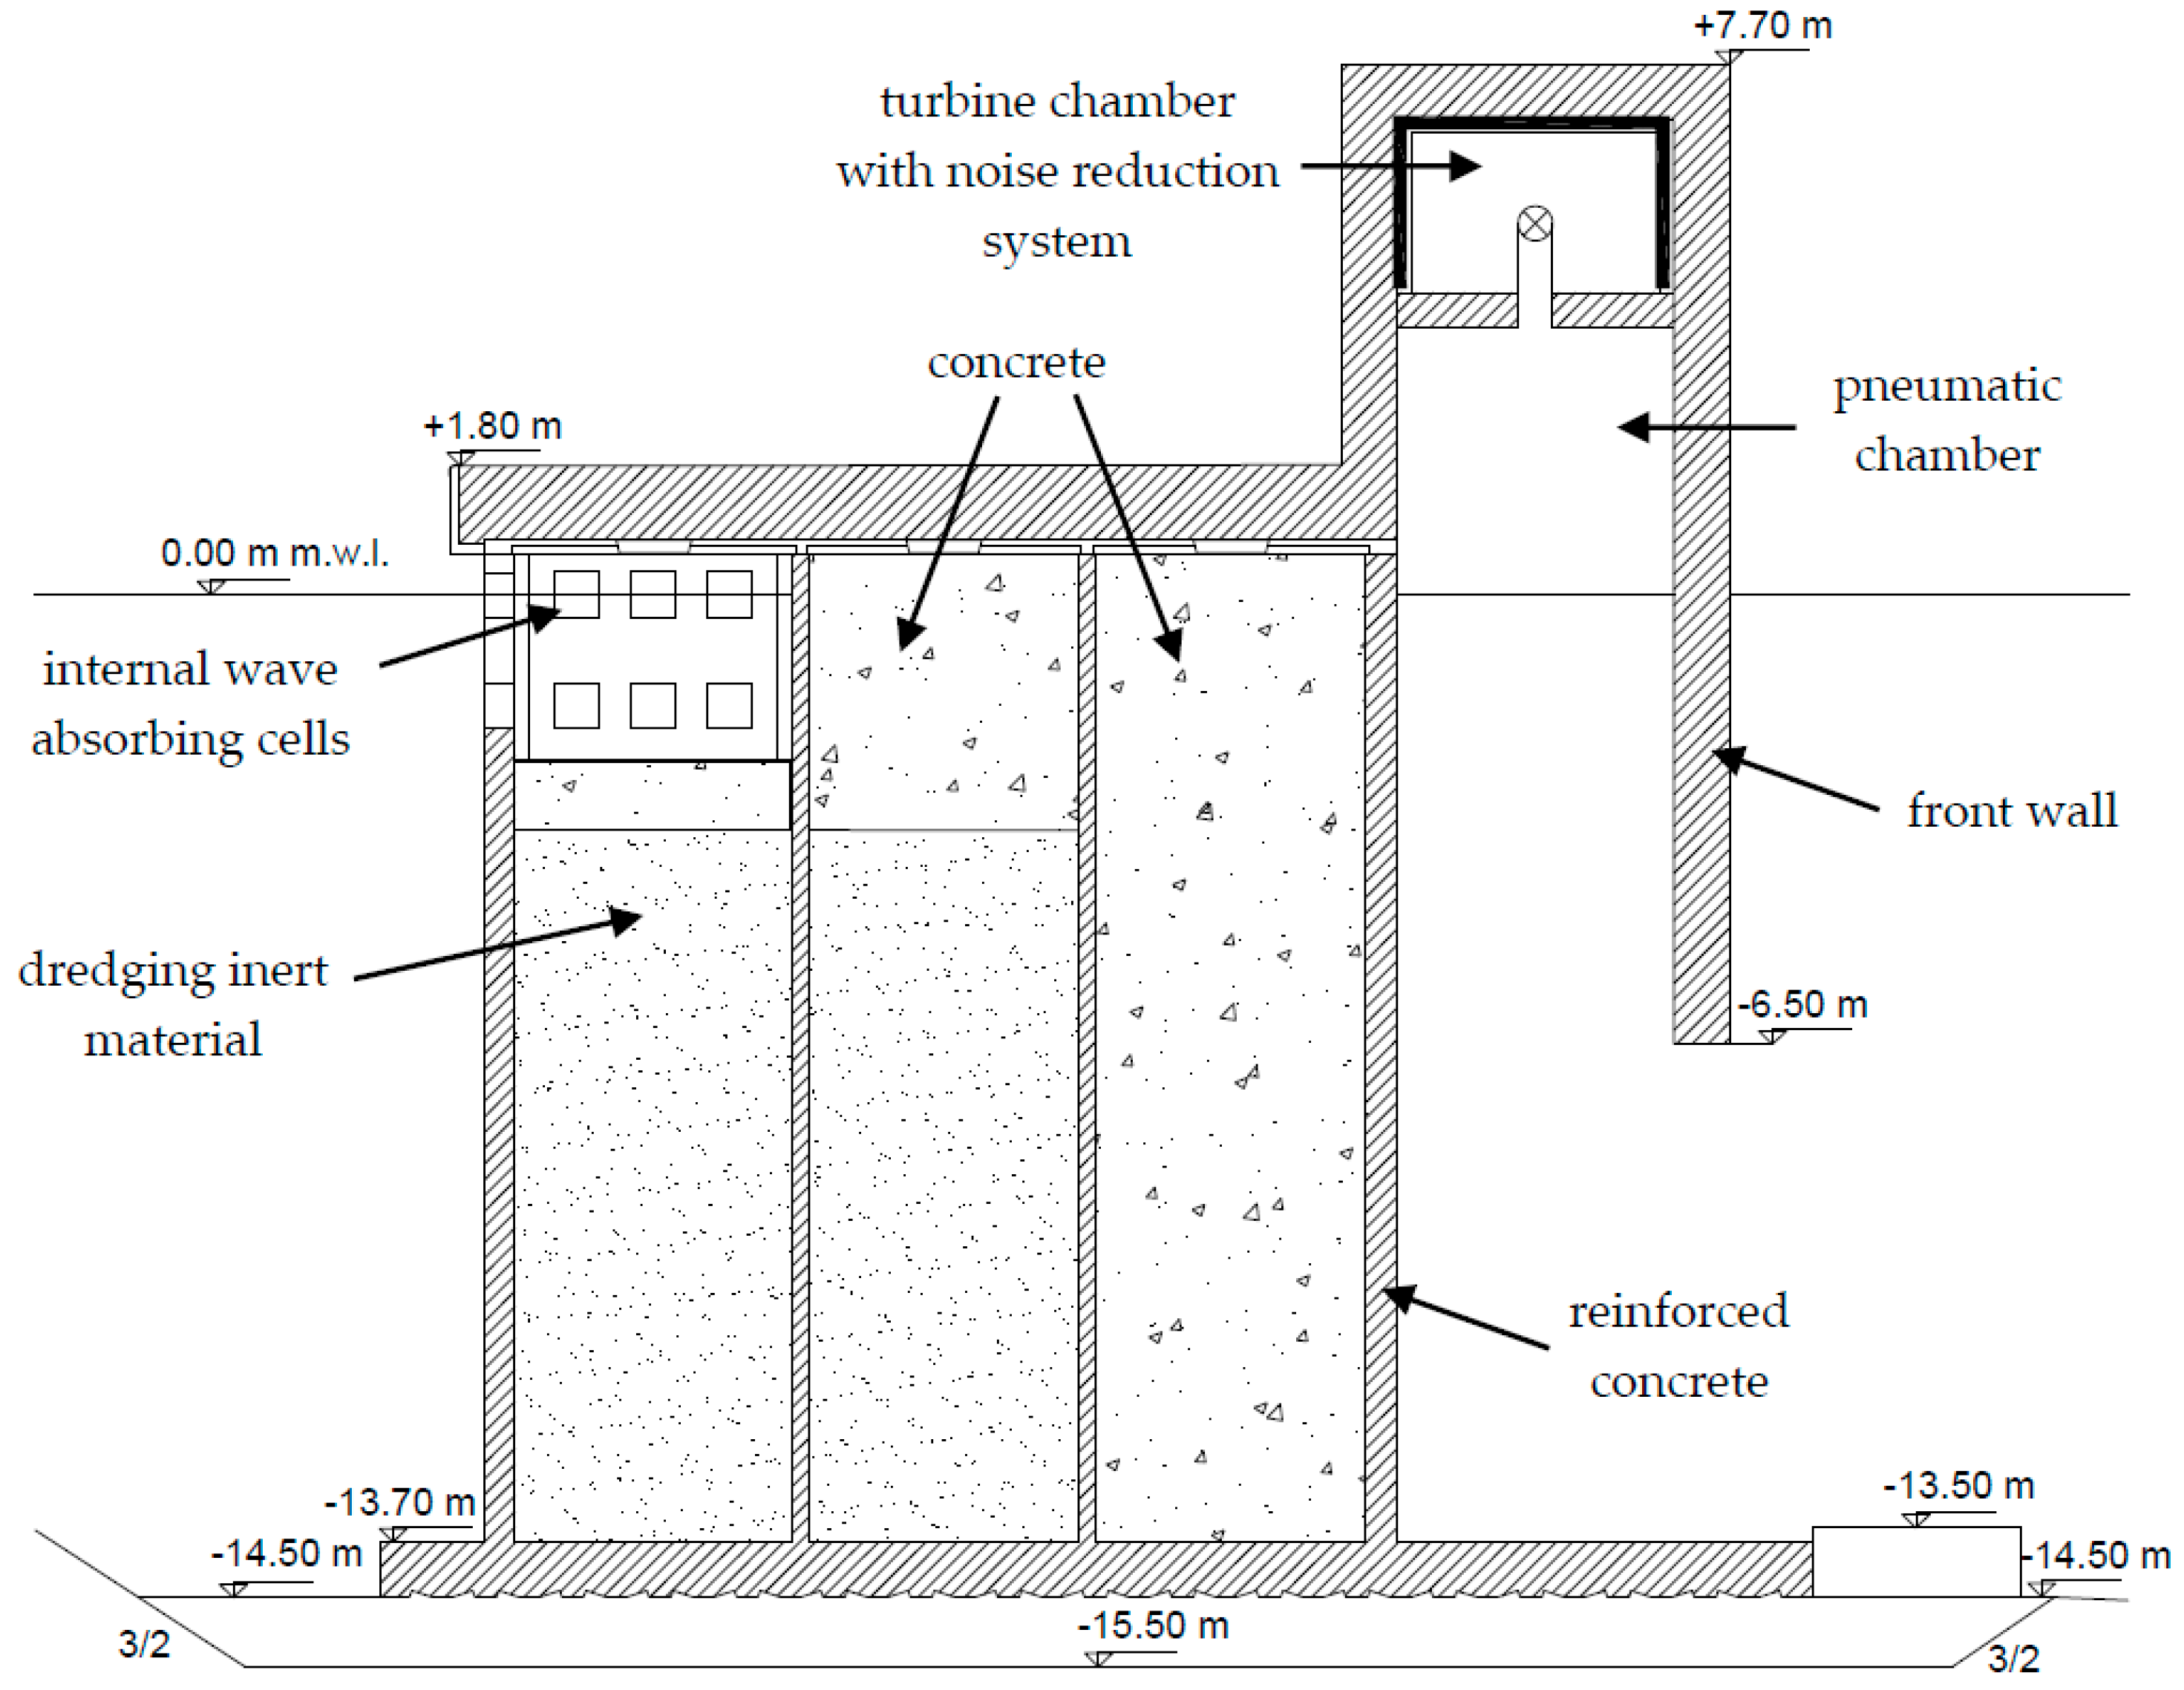
Figure 13 show the new type section for the breakwater in the port of Giardini Naxos, designed for exploiting wave energy. Such a breakwater presents a relative front wall submergence
a/
h = 0.45, which gives the minimum reflection coefficients (i.e., 0.55–0.65) among the configurations tested by means of physical modeling. Therefore, the new OWC breakwater gives an advantage with respect to the planned vertical wall breakwater, independently from the economic exploitation of wave energy. Indeed the reduction of wave height allows for a safer use of the whole harbor.
The structural feasibility of the new breakwater is carried out by focusing the attention on its stability analysis. Such an analysis is executed on the basis of extreme wave loadings (100 year return period), which are evaluated by means of a modified Sainflou formulation. In particular, the chosen OWC configuration causes loadings which are greater than those predicted, by a factor 1.1, independently from the incident wave conditions.
Extreme loadings estimations allow to carry out sliding and overturning tests, which are both satisfied by the new OWC breakwater: (i) the stabilizing horizontal forces are greater than 1.2 times the sliding horizontal forces; and (ii) the stabilizing moments are greater than 1.5 times the overturning moment. The stability of the system under extreme waves action is achieved since the second chamber of the caisson breakwater is entirely filled with concrete instead of dredged materials. Furthermore, the concrete filling at the third chamber of the OWC caisson is incremented of 1 m with respect to the vertical wall breakwater configuration.
Notwithstanding their differences, OWC and vertical wall breakwaters maintain the same transverse extension and height form water level. Therefore, the functionality and visual impact of the structure are not modified due to the presence of the WEC system.
During the design of the OWC breakwater for the case study, particular attention was paid to the reduction of the noise produced by the chosen PTO: a Wells turbine which would cause a sound power level almost intolerable for human beings. The solution adopted here considers putting the turbine inside an attenuation room about the pneumatic chamber, thereby obtaining a configuration similar to that applied in Mutriku [
29]. In particular, the proposed attenuation room implies noise reduction panels on its internal walls. Such panels, on average, allow for a reduction of 40% of the sound level produced by the turbine [
48]. Therefore, the resulting external power sound level is 70 dB which corresponds to that of highly animated discussion volumes. Such a noise is reached, on average, 5 days a year and it is considered acceptable since it takes place under stormy conditions, when the most exposed docks are used for short periods.
On the basis of the designed OWC breakwater characteristics, the economic feasibility of such a green infrastructure can be analyzed by comparing the energetic related profit with the increment of costs of embedding a WEC device in that breakwater (
CWEC). In particular, the total cost of the harbor is increased by 4% due to the building of the 80 m long OWC breakwater. Structural modifications, turbines, generator, electrical connections and noise attenuators are considered in such an analysis, as summarized in
Table 2. The most relevant cost after the structural one is related to PTO, since the chosen air turbines are not yet commercially available and must be optimized for the case study [
49,
50]. In more detail, the cost of the structural change is calculated as the difference between the cost of the OWC breakwater and the cost of the vertical wall breakwater. The cost of the turbine and generator are assessed by means of the relation proposed in [
50] on the basis of the maximum power of the system. The cost for the connection to electric distribution is evaluated by means of the Italian regulations.
The expected economic gain is a function of the annual energy production and of its price. The actual exploitable energy can be derived on the basis of the available wave energy at the site of the study (evaluated in
Section 2) and of the performance of the system. Such a performance is estimated here on the basis of the hydrodynamic efficiency of the physical model, by considering also the performance characteristic of a typical monoplane Wells turbine [
47].
For the design configuration, the pneumatic chamber measurements of the physical model are used for estimating PTO efficiency as a function of wave conditions. Such efficiency values can be used for estimating the mean power related to the annual wave climate at the site of interest. In particular, the overall OWC performance at Giardini Naxos is equal to 0.18. Therefore, the energy exploited each year by the system is about 100 MWh. Such a value of annual energy can be considered an acceptable result for a low energy site and it is achieved because the WEC system is optimized for the waves with most energy during the annual climate.
The economic gain, for the case study, can be computed by considering that the renewable energy produced by sea waves in Italy is valued at 300 €/MWh. Therefore, the annual cash flow
Cy is equal to 30,000 € on average. The payback period
n of the investment can be evaluated by equalizing the costs of embedding the OWC into the breakwater (
CWEC) with the discounted annual cash flow [
51]:
where
k is the generic year from the construction of OWC breakwater;
i is the interest rate, here assumed equal to 2%. The resulting payback period for the WEC device in Giardini Naxos harbor is equal to 19 years, which is similar to the typical service life of an air turbine, i.e., 20 years. Therefore, the installation of such a WEC device would not cause an economic loss, notwithstanding the low level of available wave energy in the site of the study.
6. Conclusions
A WEC device embedded in a port breakwater was designed. The case study was the harbor of Giardini Naxos, in Italy, where only low wave energy levels are available. However, the focusing of annual energy toward few wave classes allowed for a greater optimization of the exploitation system.
Three alternative WEC devices were considered into account, among them the OWC system was chosen on the basis of characteristics of both harbor and sea waves. In particular, such a system easily provides the possibility of obtaining an air chamber connected to the sea, in which the air is compressed and decompressed by wave motion. Therefore, it is not necessary to consider a lot of expensive modifications to the planned breakwater of the port.
The optimization of such an OWC device was achieved by means of physical model tests in which the front wall submergence was varied. The optimized configuration gave the minimum wave reflection and in turn the maximum wave energy conversion. Furthermore, the wave loadings on the front wall for such an optimized configuration were quite accurately predicted by Sainflou formulation for vertical wall, if they were multiplied for a safety coefficient equal to 1.1.
The noise produced by the air Wells turbine was estimated on the basis of literature study, obtaining a 5 days/year value slightly lower than the pain tolerance level. Therefore, the new OWC breakwater was designed by inserting the turbine into a noise absorption room which allows to reducing the noise level within acceptable values.
The economic feasibility of the optimized OWC breakwater identifies a payback period of investment equivalent to a period of 19 years. Such a period is quite extensive for a classic business plan but it can be of interest if the main goal of the investment is to achieve a green infrastructure. Indeed, the slight incremental cost of the whole port, equal to 4%, is recuperated in a time span only slightly less than the service life of the device.
Notwithstanding the site of the study is in a very sheltered zone for the energy conversion, the obtained results demonstrate that the economic feasibility of OWC system integrated into coastal structures is a quite interesting proposal for the Mediterranean basin: it is clear that in other locations the payback period would probably be considerably shorter.
Future works will aim at simulating numerically the OWC behavior, and its interactions with wave motion, by means of an efficient wave propagation modeling [
52,
53]. In such a way, both the energetic efficiency and the wave motion near the structure will be estimated by taking into account the actual shape of the bottom of the sea.


