Article

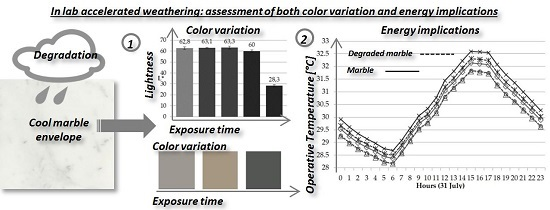
Cool Marble Building Envelopes: The Effect of Aging on Energy Performance and Aesthetics

1
Department of Civil, Construction and Environmental Engineering, Sapienza University of Rome, Via Eudossiana 18, Rome 00184, Italy
2
Department of Engineering, Università di Perugia, Via G. Duranti 93, Perugia 06125, Italy
3
Department of Civil and Urban Engineering & Center for Urban Science and Progress, New York University, 6 Metrotech Center, Brooklyn, NY 11201, USA
*
Authors to whom correspondence should be addressed.
Sustainability 2016, 8(8), 753; https://doi.org/10.3390/su8080753
Submission received: 27 June 2016 / Revised: 28 July 2016 / Accepted: 29 July 2016 / Published: 5 August 2016

Abstract

:
Marble envelopes represent a relatively common architectural solution used in variety of historic, modern and contemporary building facades. White marble envelopes have been shown to reduce solar heat gains, while improving indoor thermal comfort and energy efficiency in summer time. While marble is useful in this context, the urban atmosphere accelerates the degradation of marble elements. This leads to changes in optical characteristics, hence the aesthetics, and affects the energy efficiency benefits offered by white marble facades. These issues are investigated in order to predict the impact of degradation on energy performance and to the aesthetic value, such as change of color and luminosity. In this study, surface degradation of white marble is analyzed by means of accelerated weathering in the laboratory while examining changes to the optical characteristics of the materials. A dynamic simulation is carried out to assess the energy performance of a building as a case study.

Graphical Abstract

1. Introduction

Construction elements for building envelopes influence the energy performance, capital and operation cost of buildings, and impact the environment at the scale of the city with potential climate effects [1,2,3,4].
Exploitation and exhaustion of resources are focal points of research and policy development for the world scientific communities, governments and society. Demand for building materials is expected to double in the near future, increasing the impact resource extraction and materials manufacturing processes have on natural resources. It is worth noting that half of the total employment in the raw materials extraction worldwide is in the construction sector [5]. In this scenario, natural materials such as marble are regarded as sustainable building components as compared to manufactured materials such as concrete [6]. This is due in large part to the lower energy use associated with their production. Natural materials are also easier and less harmful to dispose of and generally retain the possibility of reuse or recycling at the end of their initial life cycle. Moreover, some natural materials possess optimal intrinsic characteristics, which are beneficial for the energy performance of the building: examples include materials for thermal insulation and for passive cooling [7]. Cool materials, i.e., materials able to reflect a large portion of the solar radiation for passive cooling, maintain a lower surface temperature. Use of these materials is one of the strategies identified: (i) to counter the effect of Urban Heat Island [8,9]; reduce energy demand for cooling during summer, while causing almost no major counter effect in winter [10,11,12,13]; and to improve thermal comfort in outdoor urban spaces [14]. This is especially the case with respect to the Mediterranean climate and measures of comfort [15,16]. This positive contribution to the energy balance of construction with a cool envelope or roof depends on the optical and thermal properties of the component material, and more precisely to their high solar reflectance and high thermal emissivity (i.e., around 0.9 such as typical construction materials with no metal components).
In this study, the cool material under consideration is white marble. White marble is (i) a natural material; (ii) has been used in construction for millennia; (iii) has a high solar reflectance; and (iv) high thermal emissivity.
Taking into account the architectural and aesthetic value of such elements, the optimal intrinsic optical characteristics of light stones as cool materials has been reported [10,17]. However, the optical characteristics of marble are influenced over time through degradation [18,19,20,21]. Some research has been carried out on the structural properties and changes to surface optics of marble brought about by the exposure to polluted environments [22,23,24,25,26,27]. Research presented in this article highlights how reflectance is impacted by degradation and the extent to which it impacts the passive cooling capability and building energy performance over time. In our assessment we consider how degradation impacts characteristics such as lightness and color, on its thermal properties and architectural implications of marble as building envelope component. Previous works dealt with: (i) the assessment of lightness, gloss, and Distinctness of Image (DOI) of thin marble used for aesthetic purposes, whereas reflectance was not included in the analysis [18]; and (ii) the thermal-energy performance of marble envelope components, assessing the reduction of cooling energy demand [10], but without verifying modifications due to degradation. In order to verify its sustainability as a cool, natural and durable building material, we will investigate the effect of degradation on: (i) energy performance, by means of dynamic simulation of a case study building; and (ii) the aesthetic quality of white marble when exposed to accelerated weathering.

2. Materials and Methods

The materials considered for the experimental analysis conducted in this research are two types of white marble, namely Bianco Carrara (BC) and Statuario (S), comparable in light of the similarity of their optical characteristics (Figure 1). They are both extracted from the Apuan Alps area, close to Carrara, Italy. The color is milky white, with almost no veins.
These marbles are largely employed in the construction sector, often used as building envelope panels; and they have great variability in dimensions and surface finish. In order to investigate the research question with varying surface finishes, two surface options for the samples are considered in this work: a polished one (P), characterized by a smooth surface, and a rough one, as provided by the factory with a less smooth non-polished surface . The utilized samples were:
(i)
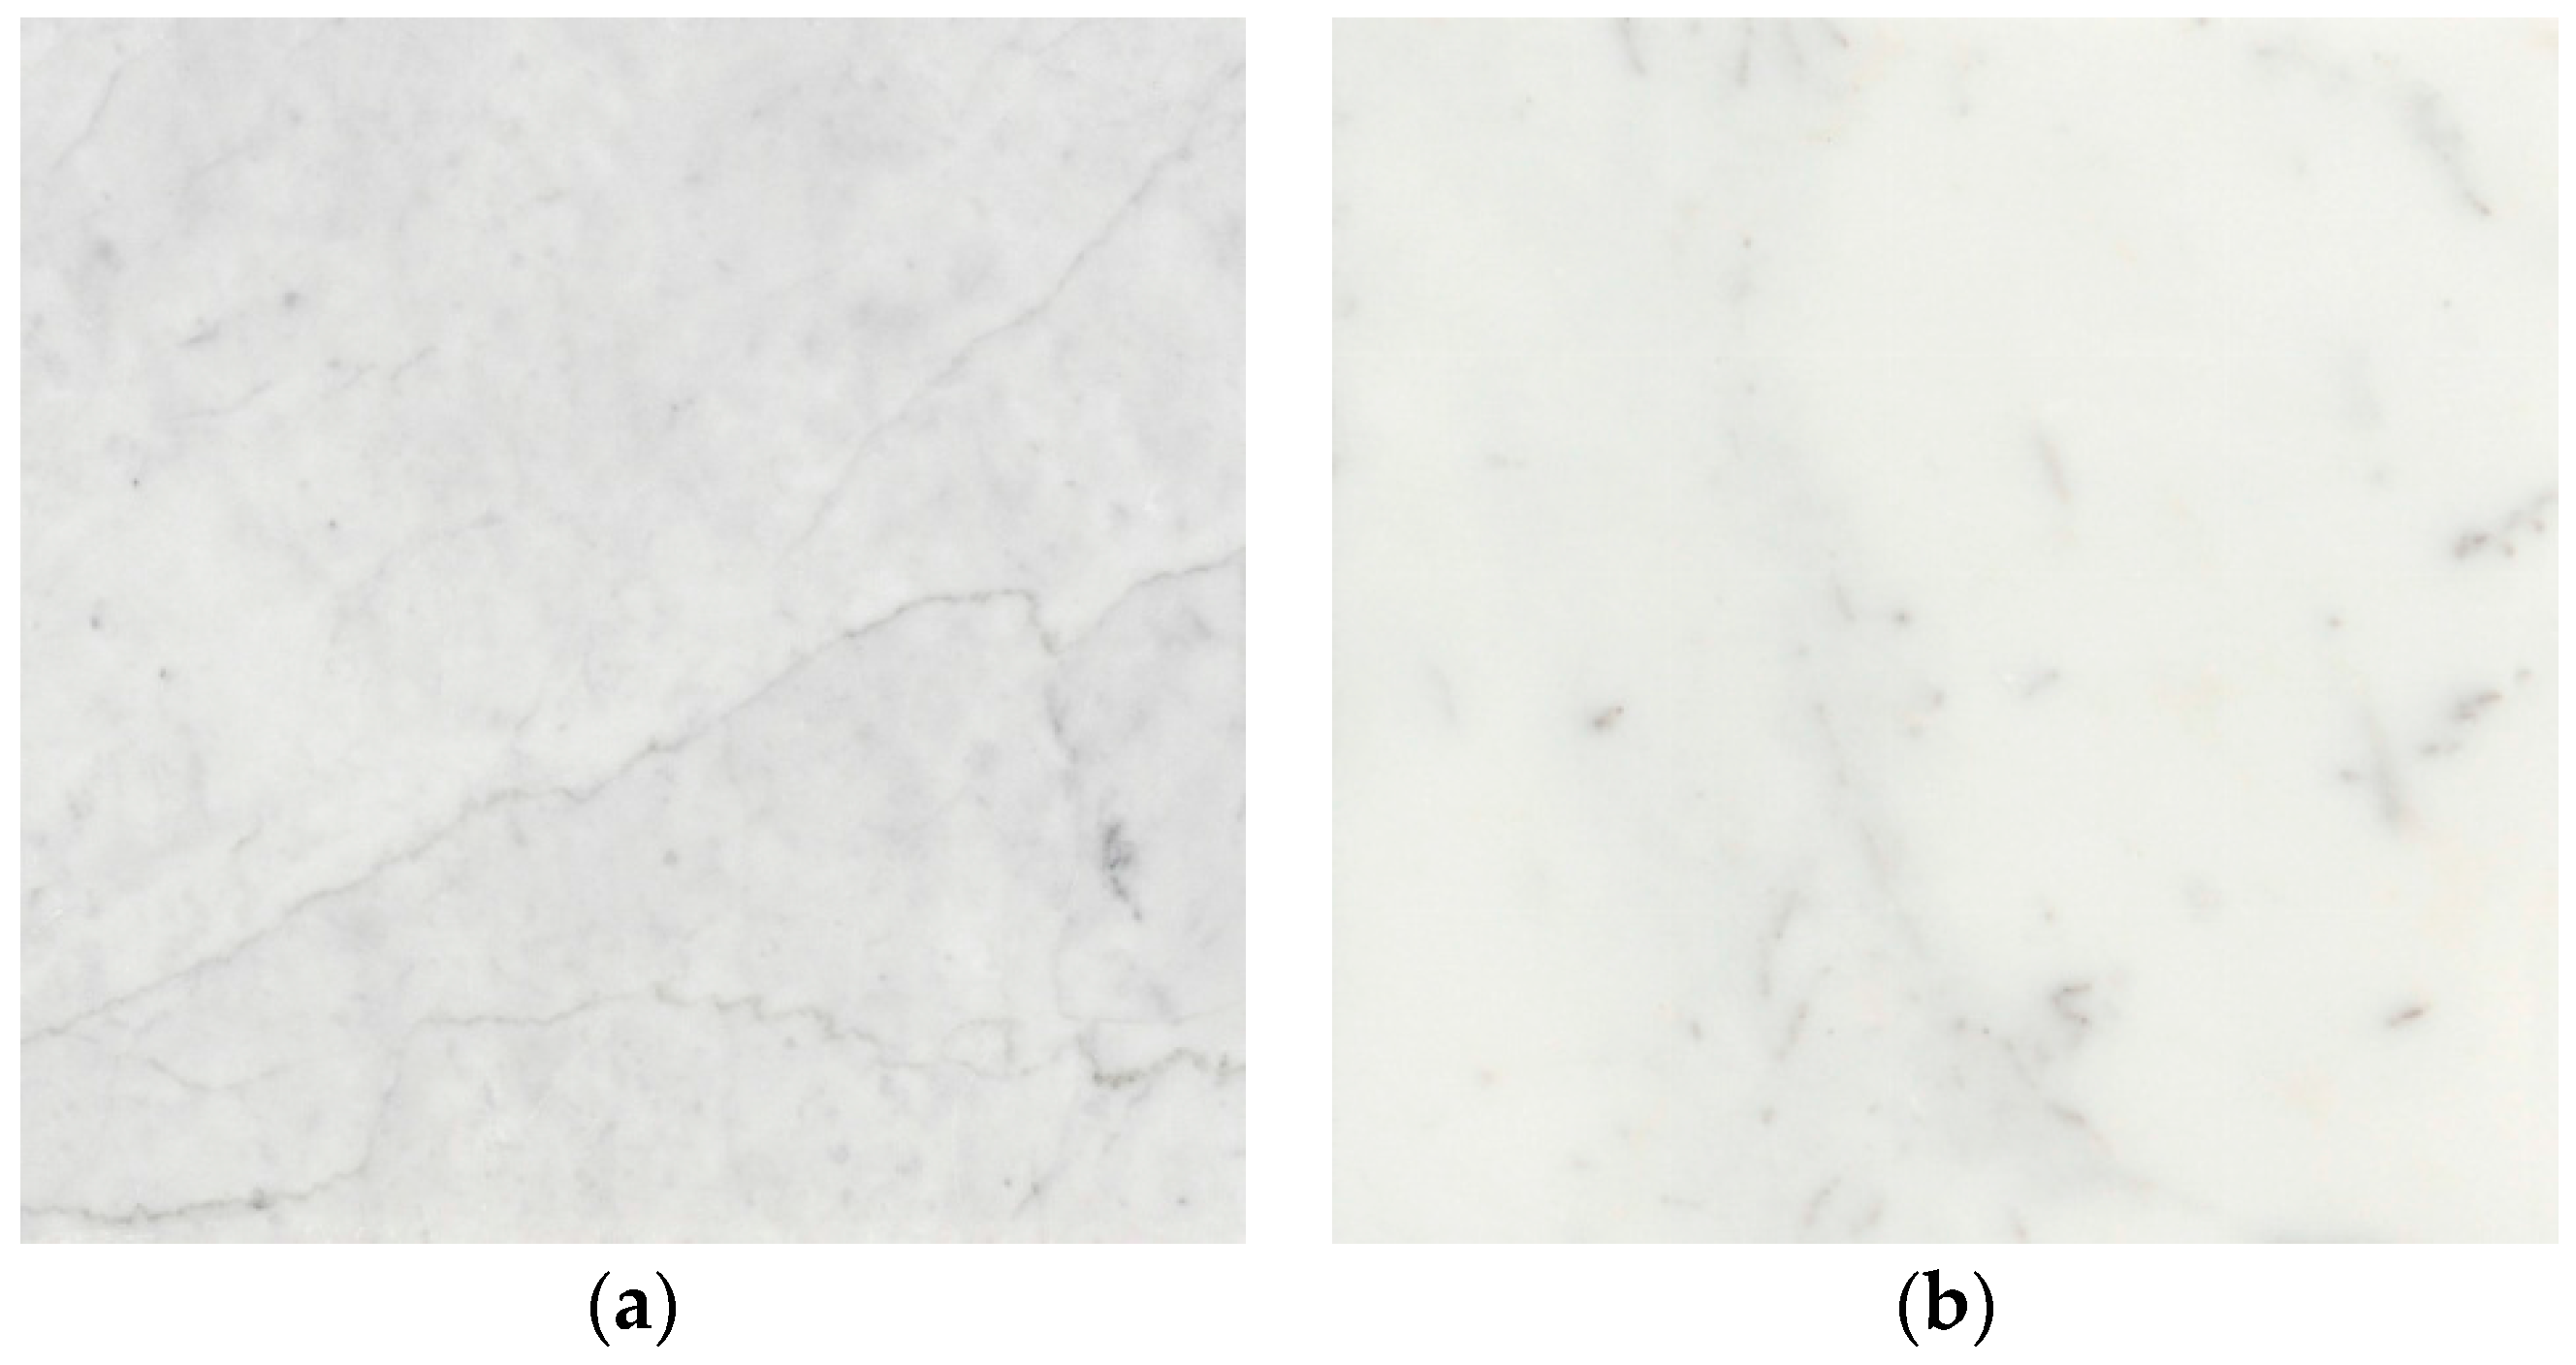
BC, Bianco Carrara marble;
(ii)
BCP, Bianco Carrara polished marble;
(iii)
S, Statuario marble; and
(iv)
SP, Statuario polished marble.
The experimental method employed to study the degradation phenomenon on optical characteristics and consequential energy performance was as follows:
  • Experimental set up:
    Samples preparation: polishing
    Samples’ degradation: weathering via soaking in aggressive acidic environment
  • Samples’ surface investigation measurements:
    Reflectance via spectrophotometer
    Color and lightness via spectrometer
  • Statistical analysis
  • Case study building selection
  • Dynamic simulations with varying levels of envelope degradation
  • Results and discussion of the findings
In the next subsections, the selected methodology is described more in depth.

2.1. Experimental Set up

For each marble, S and BC, there were two types of surface finish, polished (P) and non-polished (NP). To polish the surfaces of each, a P2000 sandpaper pad was employed to mechanically achieve ultrafine level of smoothness according to ISO/Federation of European Producers of Abrasives (FEPA) [28]. The initial procedure of the experiment consisted of soaking in an acid solution as described in [18]. For better examination of the effects of degradation, soaking was done for portion of each sample.
To replicate the exposure condition in a typical urban environment, an acid solution was prepared by mixing the two main byproducts of fossil fuel combustion, SO3 and NO2, found in acid rain. The test solution were prepared with distilled water to achieve a pH level, with greater acidity than real acid rains [29]. This was to accelerate the degradation process and hence reduce the duration of the laboratory experiment. To remain close to real world conditions, the lowest pH tested was pH 3. The lower boundary of acidity found in highly polluted cities is approximately pH 4.5. Given the logarithmic scale, the lowest pH value used in the experiment is up to fifteen times more acidic than normal. This value was chosen with the aim of achieving an acceptable degradation process, where choosing a lower value could lead to results not properly simulating the exposure [30].
Two different tests were carried out, with several exposure times and pH levels, one for the purpose of measuring reflectance, the second one for degradation assessment of color and lightness.
To clarify and simplify the name of the samples, while giving all the necessary information, abbreviations to indicate the sample type, exposure time and pH level were employed; for example, BC-P-4w-4pH is Bianco Carrara Polished, exposed for 4 Weeks of duration to acid solution of pH = 4.

2.1.1. Soaking #1

The test aimed at assessing solar reflectance modifications due to acidic exposure after four weeks (4 w) of in laboratory based immersion at pH 4 (Table 1).

2.1.2. Soaking #2

Soaking regime #2 was carried out to measure changes to color and lightness due to acid rain. It was carried out for two different exposure time (2 w and 4 w) and two different pH values, pH 3 and pH 4, in order to make comparisons about the degradation progress (Table 2).

2.2. Measurement Set up

After degradation, the samples were washed and left to air dry in ambient conditions in order to investigate surface modifications using the optical methods. Reflectance on non-degraded marble samples was already assessed in [10], with the aim of simulating the energy performance of a building with a marble envelope, while in this work the reflectance of weathered samples is quantified by mean of spectrophotometer analyses. The measurements were carried on in accordance with ASTM E 903-96 [31], Standard Test Method for Solar Absorbance, Reflectance, and Transmittance of Materials Using Integrating Spheres Spectrophotometer. The spectrophotometer used was Shimadzu SolidSpec 3700 [32]. Color and lightness analysis was performed by means of spectrometer, utilizing Ocean Optics modular spectrometer USB 2000 [33].

2.3. Statistical Analysis

A statistical analysis was carried out with the purpose of verifying if the change in the investigated optical characteristics is statistically significant. In order to do this, the values of degraded and non-degraded samples’ characteristics were compared. Two tests were performed, with a confidence level of 90%, corresponding to a p-value = 0.1.
Due to the sample size of the experiment, non-parametric tests were used for the comparisons. Therefore, the Wilcoxon matched-pairs signed rank test was performed to test the equality on paired data.
Moreover, linear regression analyses were posed in order to verify how the following four different dependent variables (DVs) are moderated by marble characteristics and exposure to acidic environment as independent variables (IVs). The dependent variables are (1) solar reflectance, analyzed in the Ultraviolet (UV), Visible (Vis), Near Infra-Red (NIR) parts and as synthetic Solar Reflection Index (SRI); (2) Lightness (L*) and color coordinates; (3) a*, representing green to red axis and (4) b*, which indicate yellow to blue axis. The independent variables (IVs) were investigated as to whether they are able to affect optical characteristics include: (i) marble type; (ii) exposure; (iii) pH level of the acid solution used to degrade the samples; and (iv) surface finish (P or NP).

2.4. Case Study Building Selection and Dynamic Simulation

The building selected as case study for the analysis is the same as that considered in previous papers by the authors [10]. It is a multipurpose building, simple in its parallelepiped shape, covered in thin, translucent marble, but complex with respect to interior spaces distribution, since many functions, from public expositions to private residences, are performed inside. The building is located in New York City, N.Y., U.S.A., since acid rain composition has been studied for that area [18], and as a context where new buildings with high aesthetic appeal are prevalent.
Physical characteristics of the building have been defined by modeling the envelope systems [34] (Table 3), the occupancy schedules [35] (Table 4) and the local climate boundary conditions [36] within a dynamic simulation environment.
The dynamic simulation was performed by means of Design Builder Interface [37] operating within Energy Plus environment [38]. The optical and energy characteristics such as solar reflectance, absorbance and thermal emissivity, previously measured in the lab, were employed in the simulation. Different simulations were carried out, with degradation, marble type and surface finish as variables, (Table 5). In order to investigate effect of envelope material on internal temperature, we first simulated a free floating regime. Then, to analyze the effect on energy demand, an HVAC system was considered in order to assess the energy consumptions for cooling.

3. Results

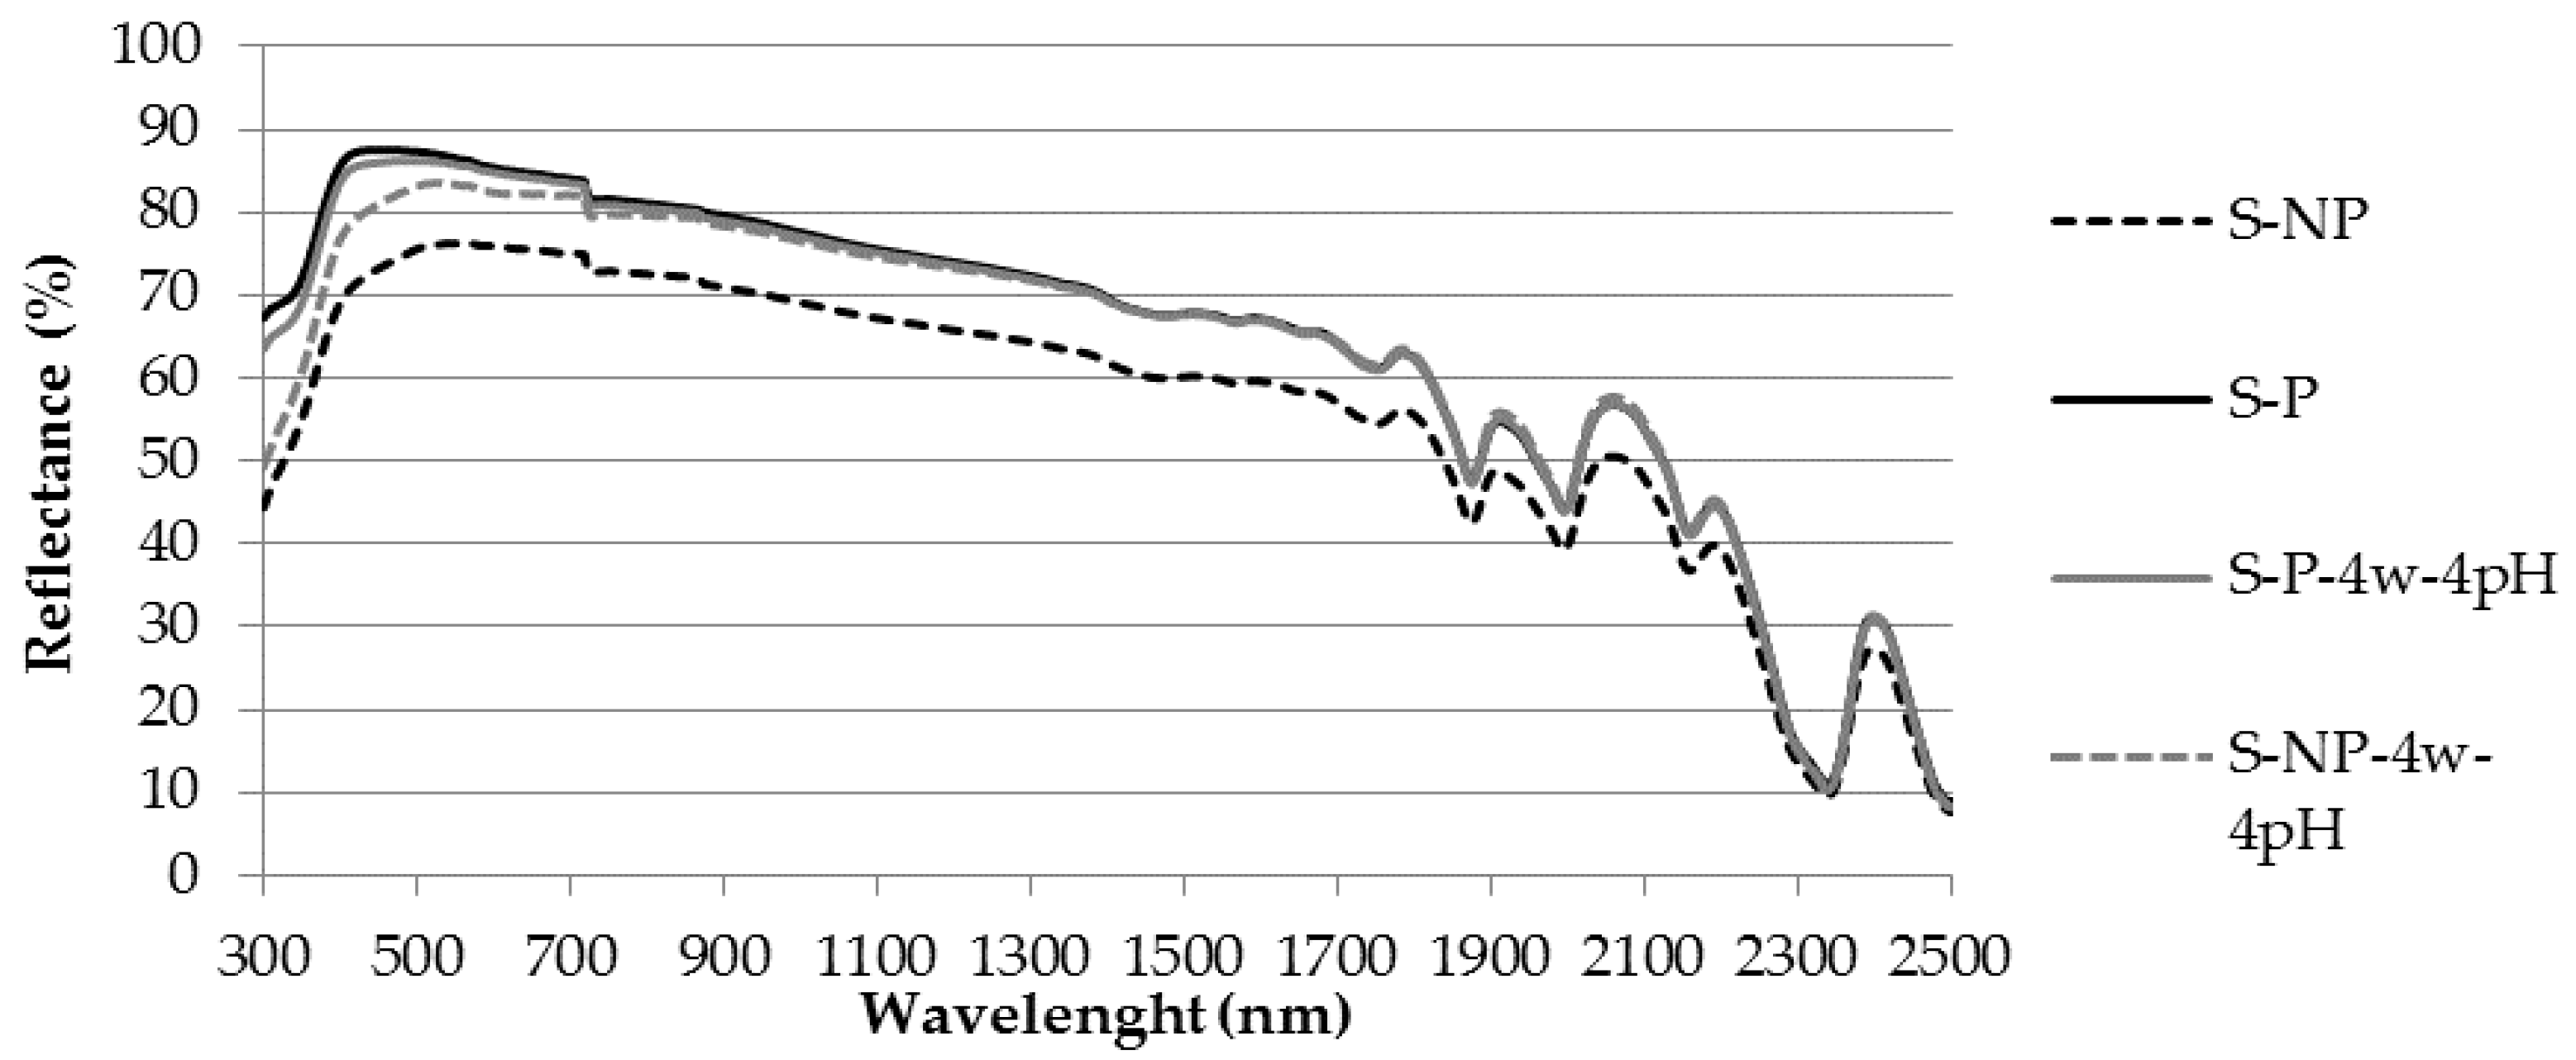
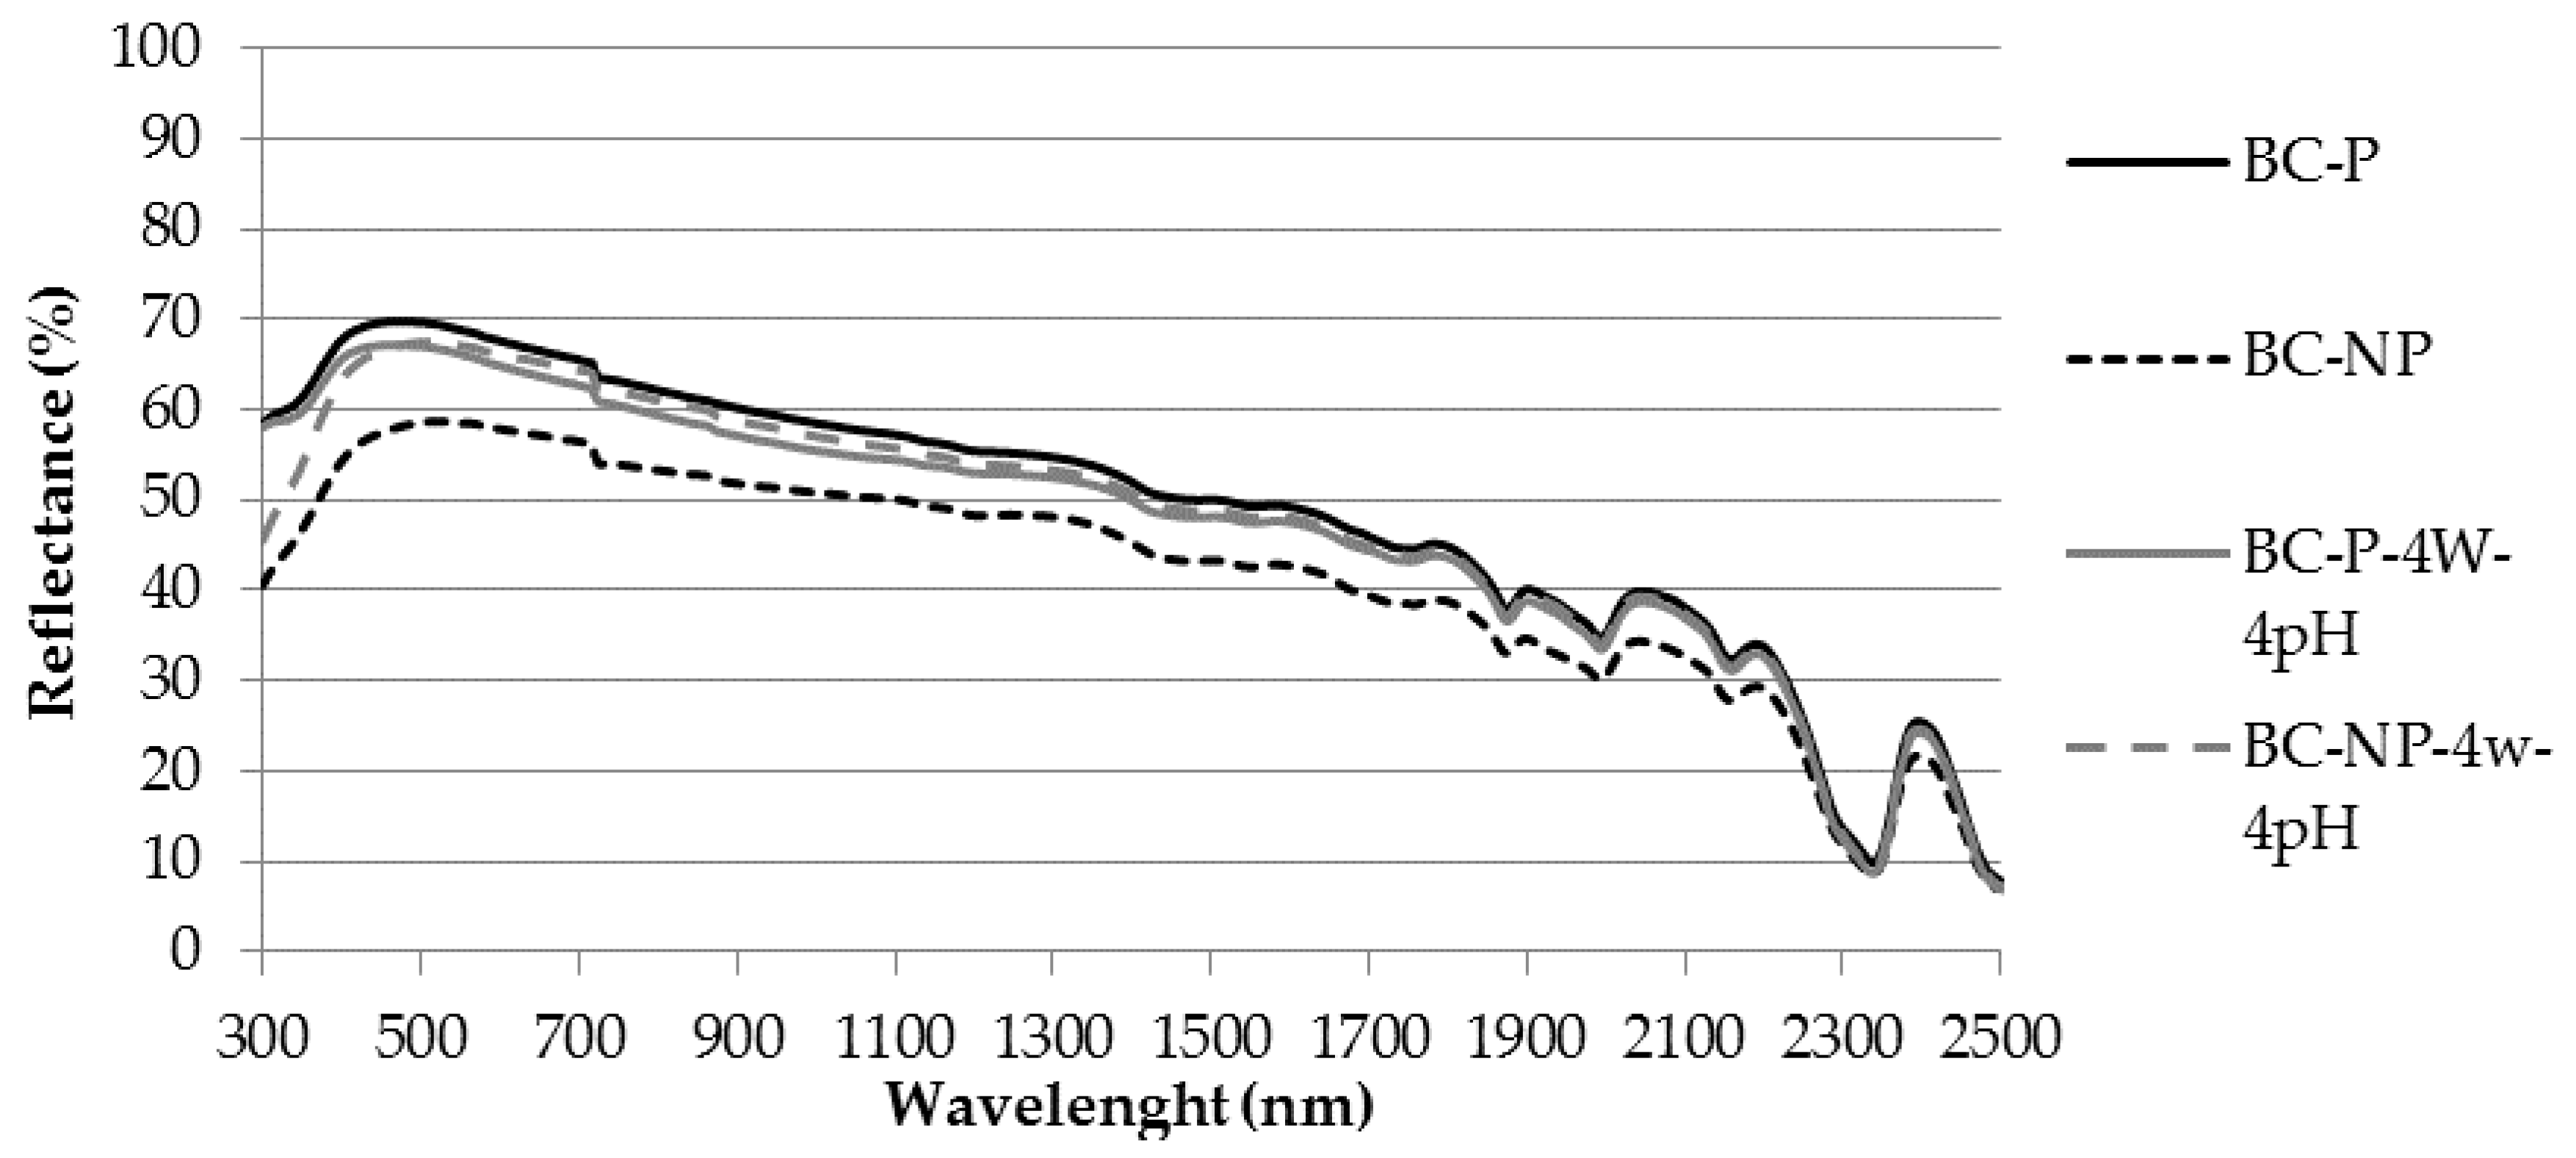
3.1. Spectrophotometer Analysis: Solar Reflectance Change Due to Degradation

The optical reflectance was measured in ultraviolet (UV, from 300 to 380 nm), visible (Vis, from 380 to 780 nm) and near-infrared (NIR, from 780 to 2500 nm). The synthetic solar reflectance index (SRI, from 300 to 2500 nm) was also evaluated accordingly to ASTM E 903-96 [31]. In the case of the S marble (Figure 2), non-polished samples’ (S-NP) reflectance in the UV and Vis part of the spectrum increased (6.03 and 7.24 percentage points) due to degradation. The NIR decreased by 9.67 while the SRI reached 76.9%, an increase of approximately 7.21 due to degradation. On the contrary, in the case of the smoother surface (S-P), UV and Vis reflectance decreased by 2.86 and 1.29 respectively, while NIR increased by 18.24 and SRI decreased slightly, by less than one percentage point (Table 6).
In the case of the BC marble (Figure 3), the same trend was observed (Table 7). Although UV and Vis in BC-NP increased their reflectance by, respectively, 7.42 and 8.52, for BC-P, the degradation lowered both UV (−1.39) and Vis (−4.09). Distinct from the S marble, NIR in BC-NP had an increment of 23.08, while BC-P’s NIR decreased by 16.31. SRI modification is similar to S, experiencing an increase equal to 7.47 for BC-NP and a decrease of 2.40 with respect to BC-P.
In the case of the polished surface samples, the degradation resulted in a moderate decrease in SRI (−0.81 to −2.40), while for non-polished samples it resulted in significant increase in the reflectance, close to +7.5 both for S and BC marbles.
This can be interpreted as the polishing effect of degradation: in fact, Figure 2 and Figure 3 show that S-NP and BC-NP, when degraded, reach the reflectance levels of S-P and S-NP. Further studies on micro-scale analyses would be necessary to verify and assess this observation.
The statistical significance of the difference between degraded and non-degraded samples is determined for the polished and non-polished marbles (p = 0.06 for P, p = 0.03 for NP). The two marbles were also compared. Results indicate that the effect of acid exposure on BC marble is greater than the S marble. Focusing on single UV, Vis and NIR reflectance, the matched pairs test for UV and Vis resulted significant, with p = 0.07 (93% confidence interval), while the results for NIR reflectance showed no significant change.
The regression analysis demonstrated how SRI varied accordingly to the two IVs of marble type and exposure conditions, while this influence is larger for the NP samples. More detail about the regression equations is reported in Appendix A.

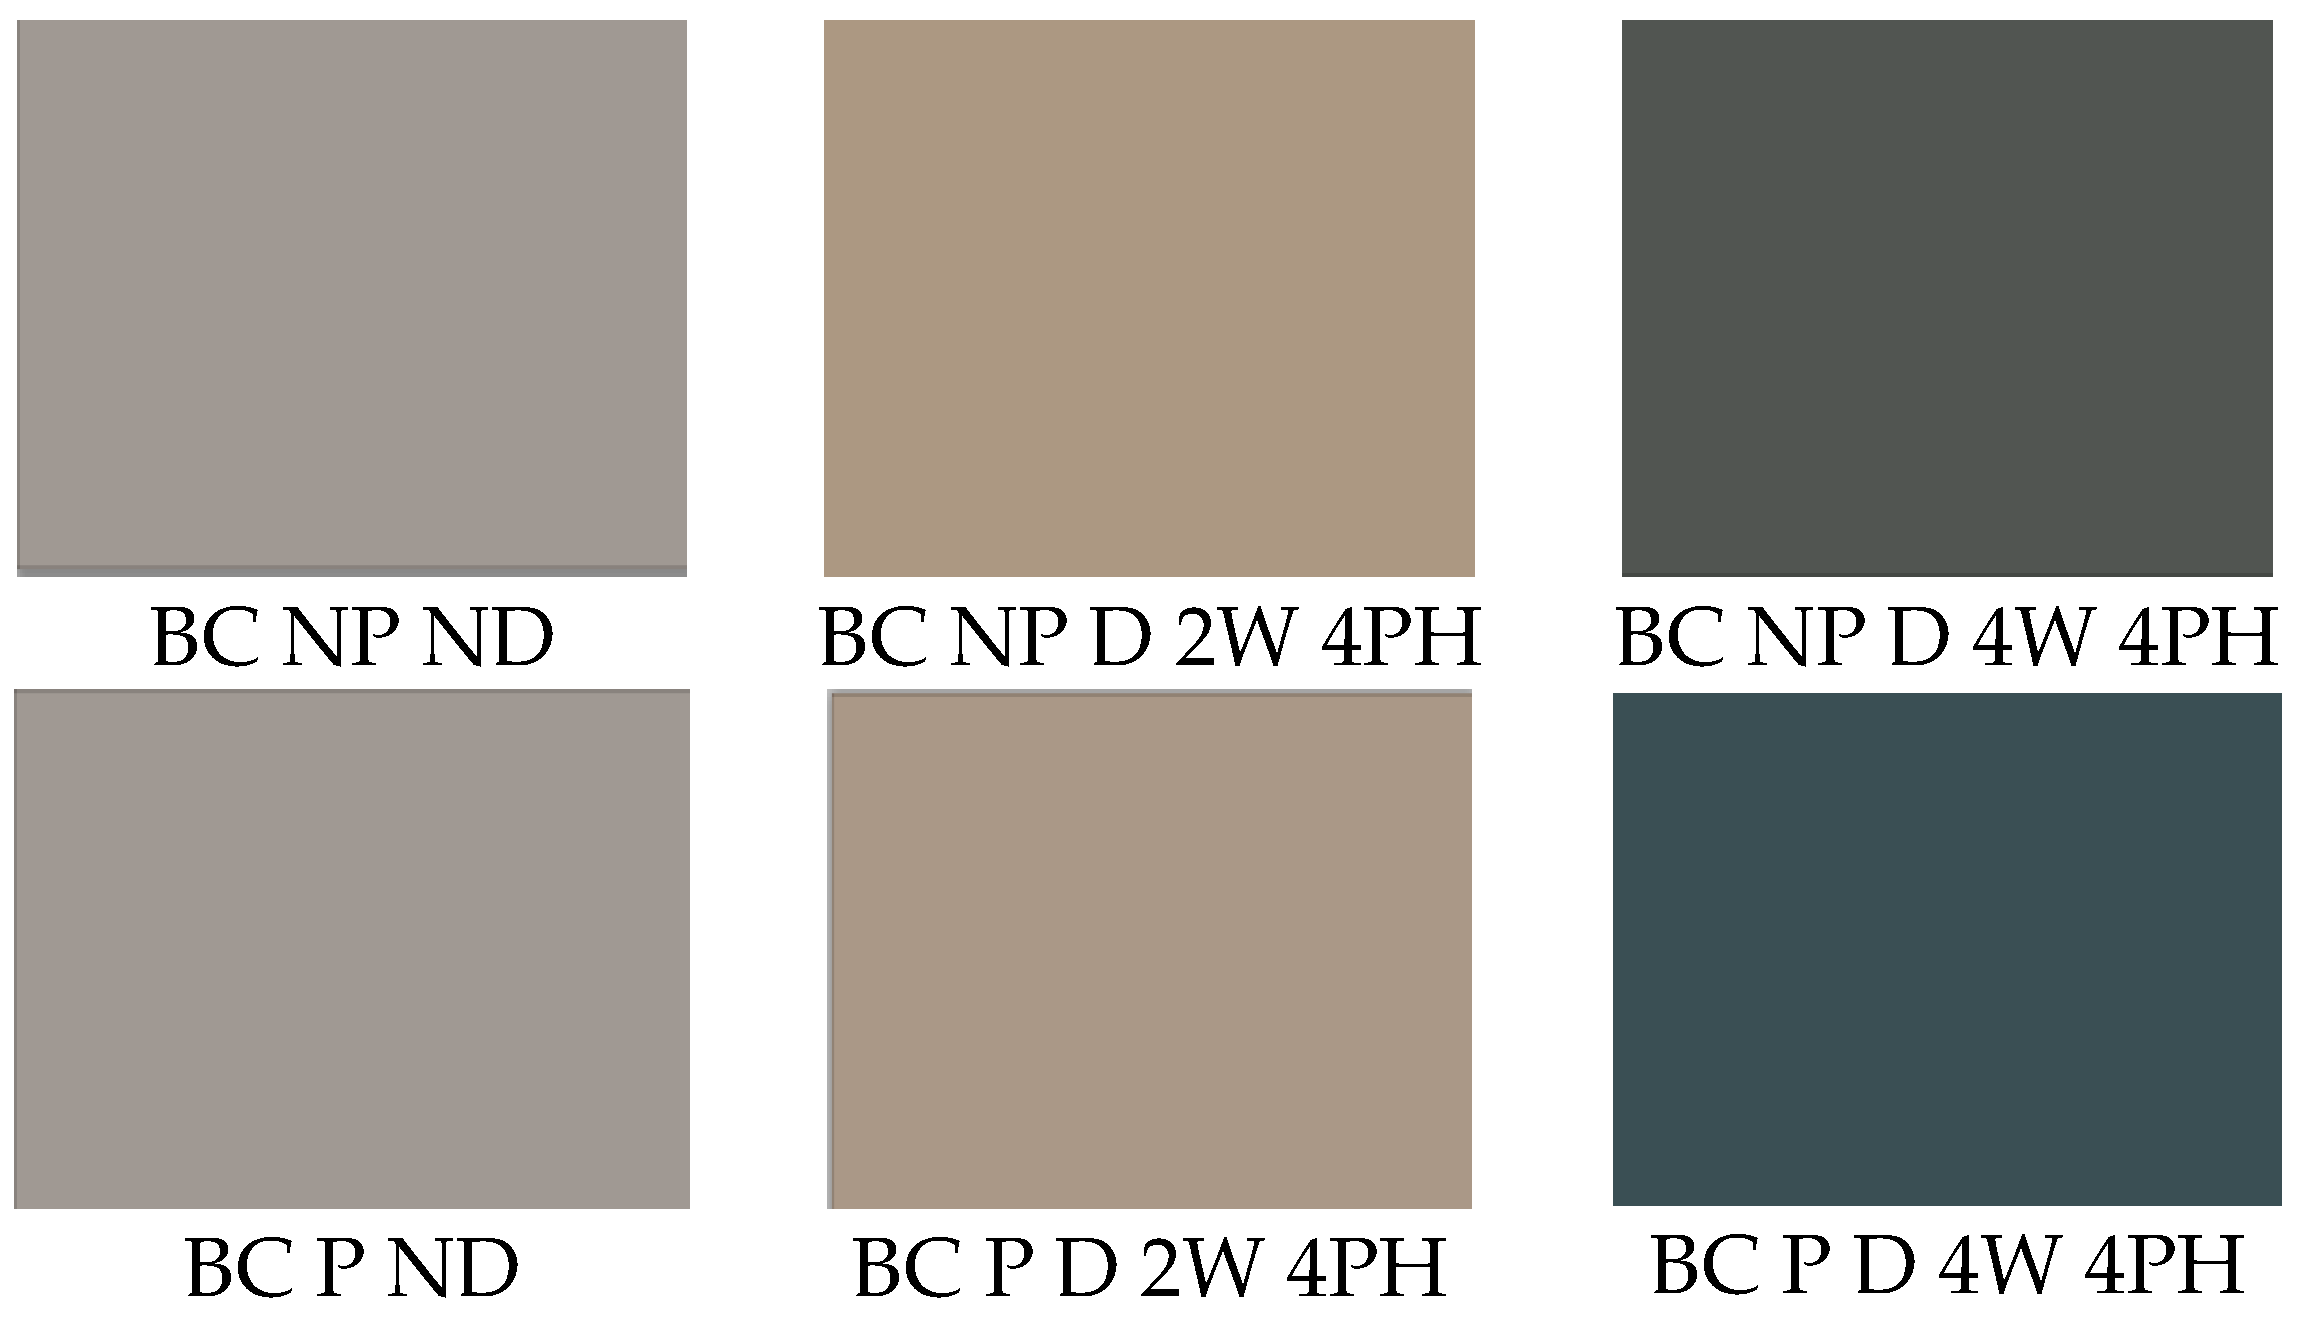
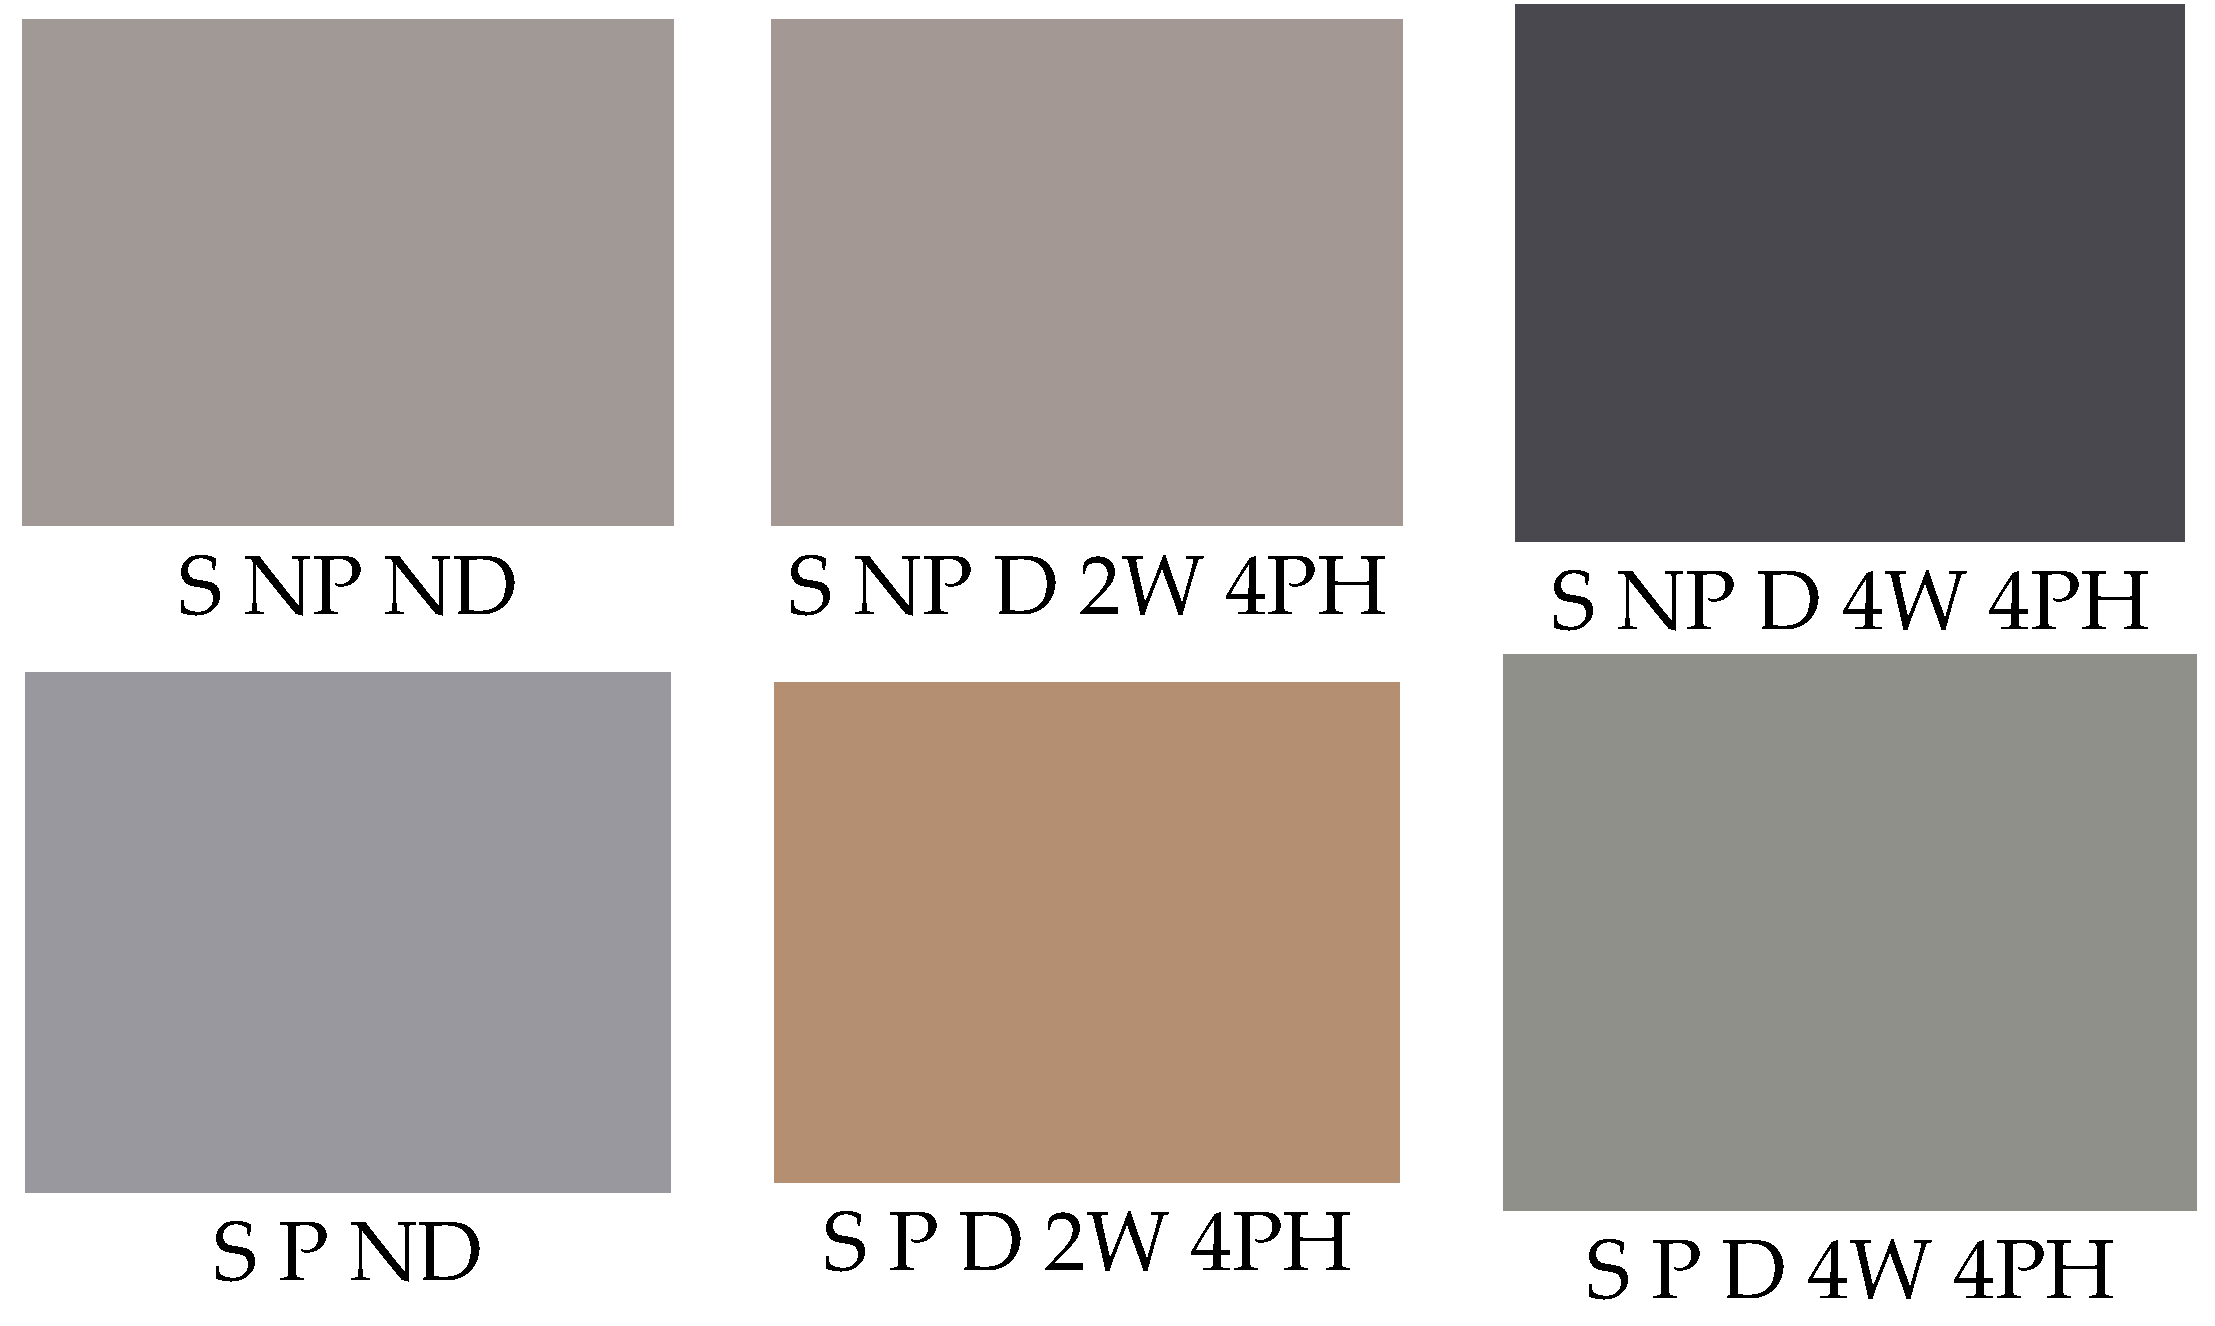
3.2. Spectrophotometer Analysis: Color and Lightness Change Due to Degradation

L*a*b* color scale is used for the color and lightness analysis as defined in the CIE 1976 [39]. This color scale has the advantage of being independent of the device type and incorporates the entire visible spectra. The L* coordinate represents lightness (on a scale from 0 as black, to 100 as white), while a* represent red (positive values) to green (negative values) and b* represents yellow (positive value) to blue (negative value), and 0 represents a neutral tone, gray. This method was chosen to analyze the surface color based on work by Urosevic et al. [40].

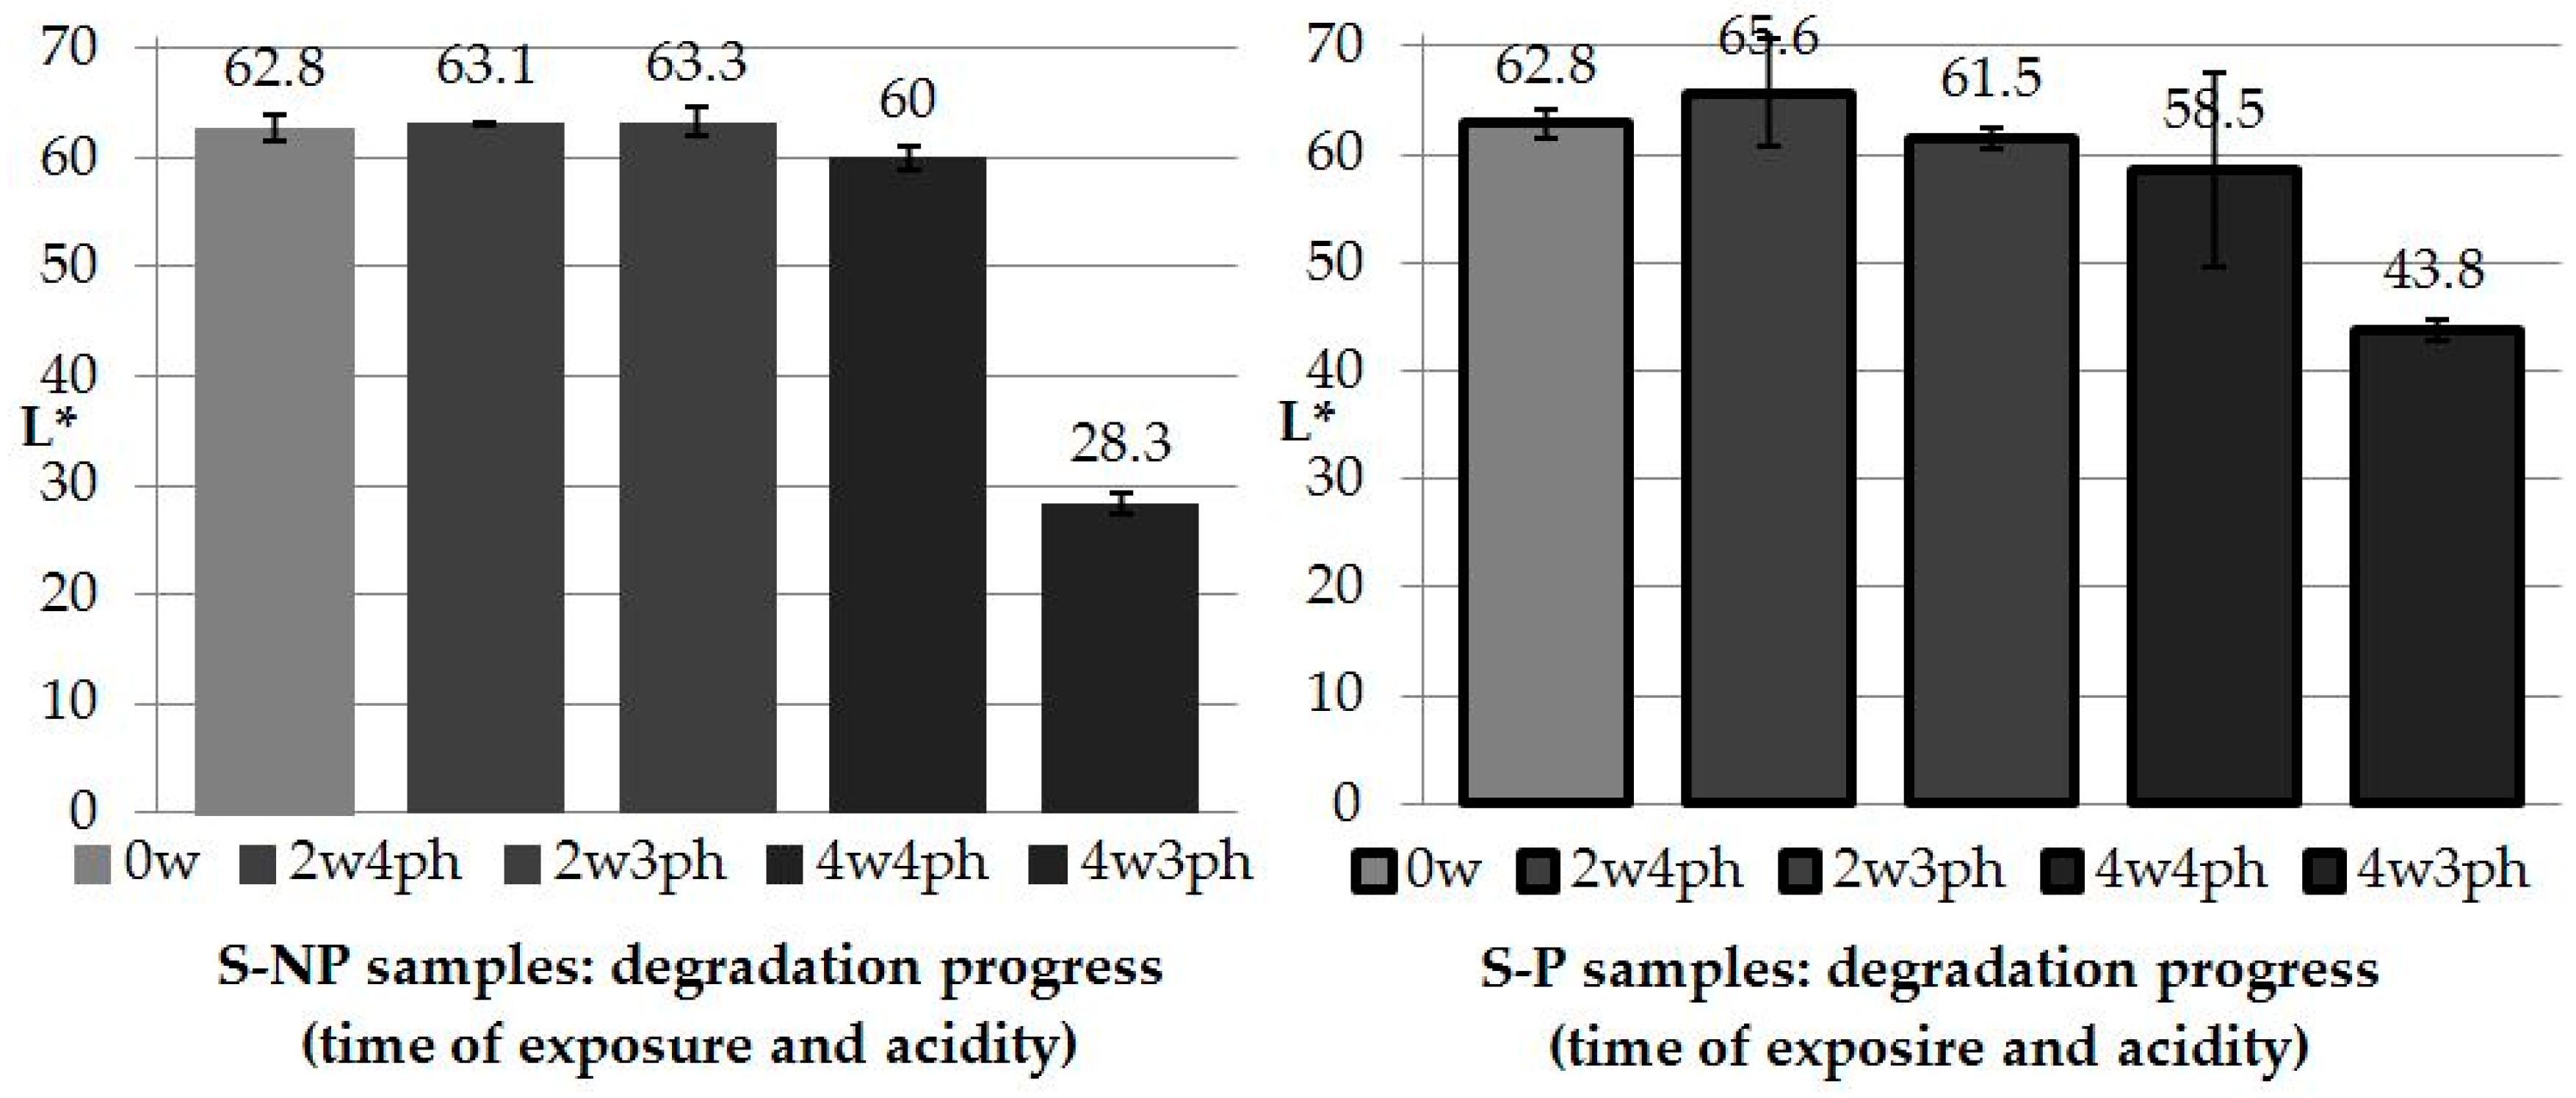
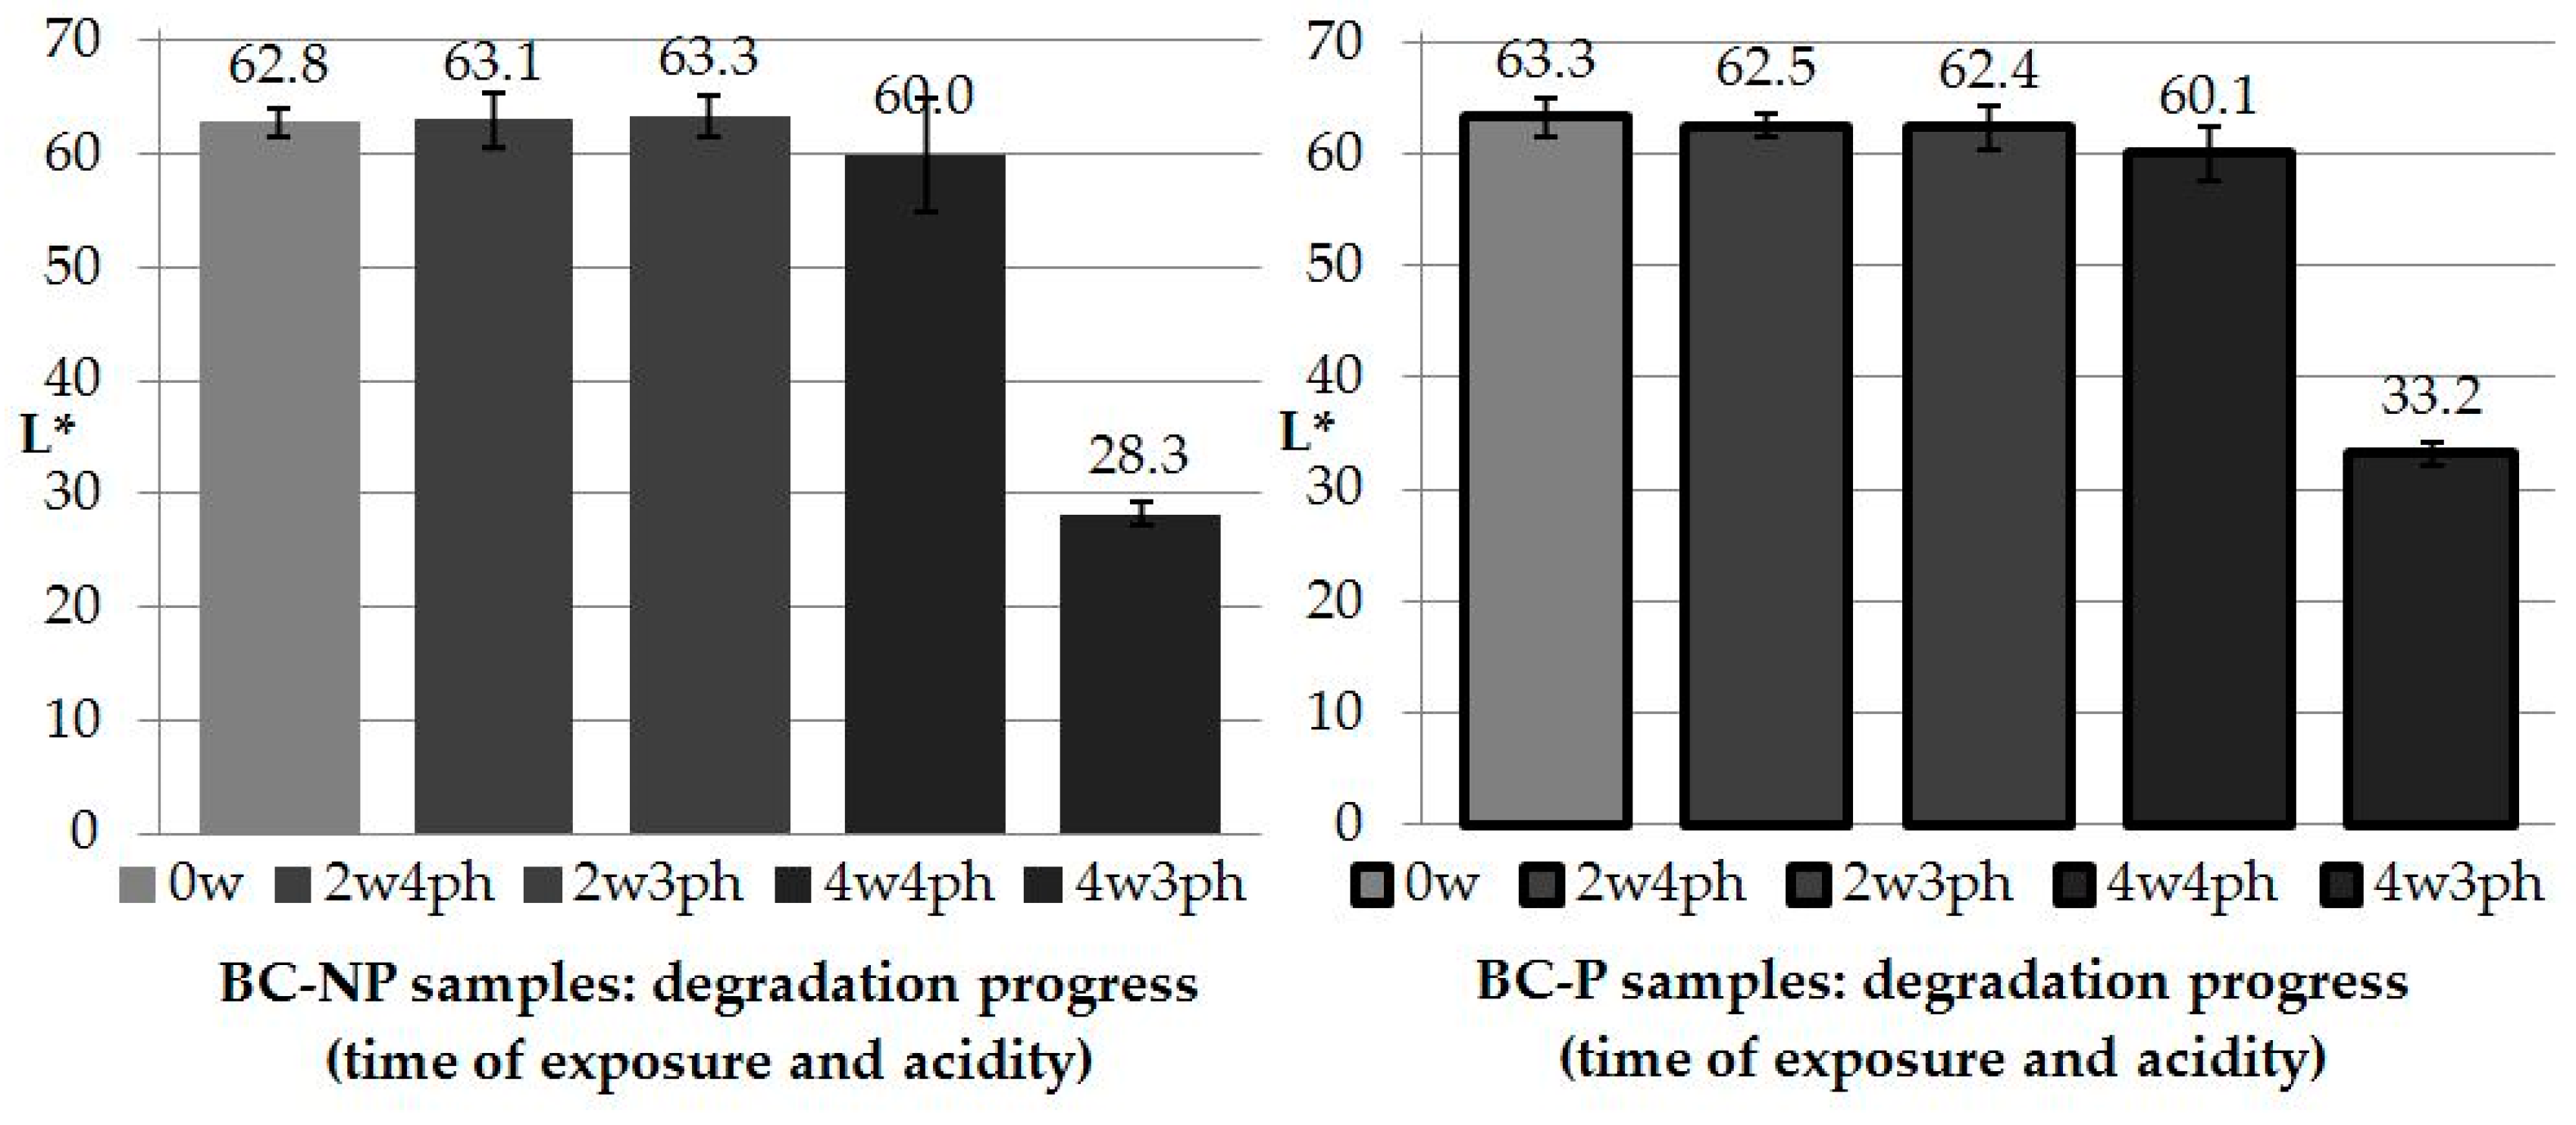
3.2.1. Lightness, L*, Variation

Studies on the lightness of marble samples were carried out in an earlier study using an HD optical microscope [18]. In that study, the samples were subject to degradation for a shorter period, with more aggressive pH level. The measured samples lightness was in the range of 62–63 (Table 8), whereas the classification defines dark a color with L* < 50 and light one with L* > 50. Therefore, as it is expected both BC and S are light in color when not degraded.
The differences between two week degraded and non-degraded samples remained low (+0.26 to −1.39), however, a large difference in the L* values can be noted in the four-week test, especially concerning the exposure to the highly acidic solution (pH 3). In this particular case, L* reached values that were lower than 50, ranging from 28 to 43 and thus demonstrating that the modification darkened the light surface.
The Wilcoxon matched pairs test performed on both marbles by comparing degraded (2 w and 4 w) and non-degraded (0 w) values, confirmed the significance of the above-described difference with a p = 0.01. In particular, while considering just the two-week exposure the difference did not appear significant; however the four-week exposure significantly altered the lightness change with a p = 0.01.
Taking into consideration marble types, BC (Figure 4) appeared to be more impacted by the exposure to low pH levels (Figure 5), thereby affirming previous findings [18]. The change of L* for BC samples’ was significant when degraded (p = 0.04). S marble was less influenced when exposed to the acidic solution, but the 4 w exposure had a significant impact on the L* change (p = 0.07).
The regression analysis demonstrated how samples’ lightness was significantly affected by the exposure time IV (p = 0.05), while pH level and marble type were verified as not significant (p = 0.50 and p = 1.0, respectively; please refer to Appendix B for the equations).

3.2.2. Red to Green (a*) and Yellow to Blue (b*) Variations

Exposure to the acidic environment resulted in significant change in lightness in a* (red to green color coordinate). BC exposed samples showed significant changes to a* when degraded for two weeks (p = 0.07). While S marble was impacted by nearly the same level after four weeks (p = 0.07). Moreover, while BC became greener, S slightly became more red (Table 9).
With respect to b*, which represents the yellow to blue coordinate in the L*a*b* color space, only BC samples exposed for two weeks were significantly impacted, with a significance of p = 0.07, varying towards the blue (Table 9).
Linear regression analysis suggested differences for a* but not for b*. This was particularly true for changes in exposure time and pH level, but not the marble type. Therefore, results demonstrated how BC is affected in color by the degradation, tending to turn to cooler colors (green and blue). On the contrary S, which was less impacted by degradation, displayed a slight tendency toward warmer colors (towards red).

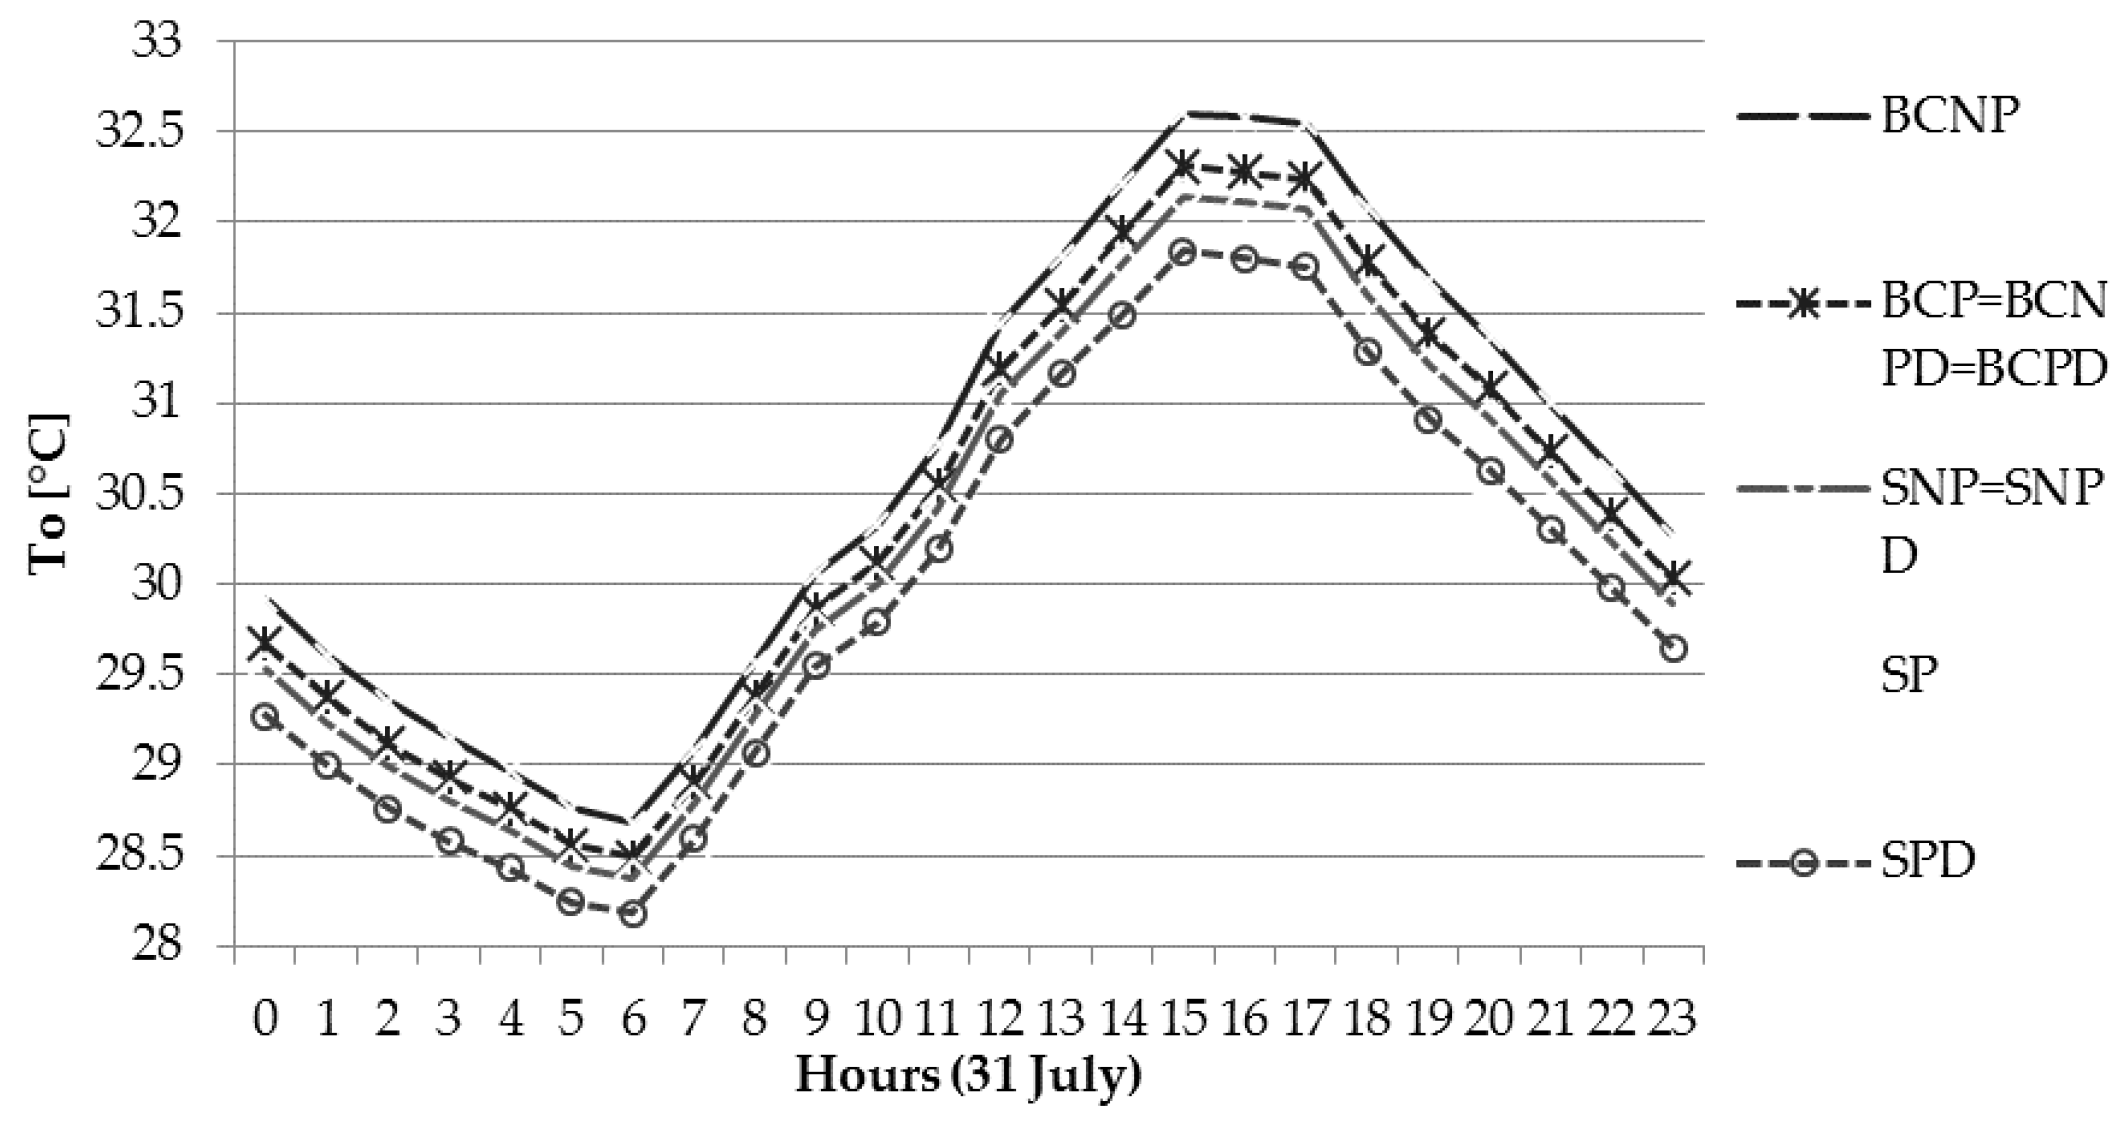
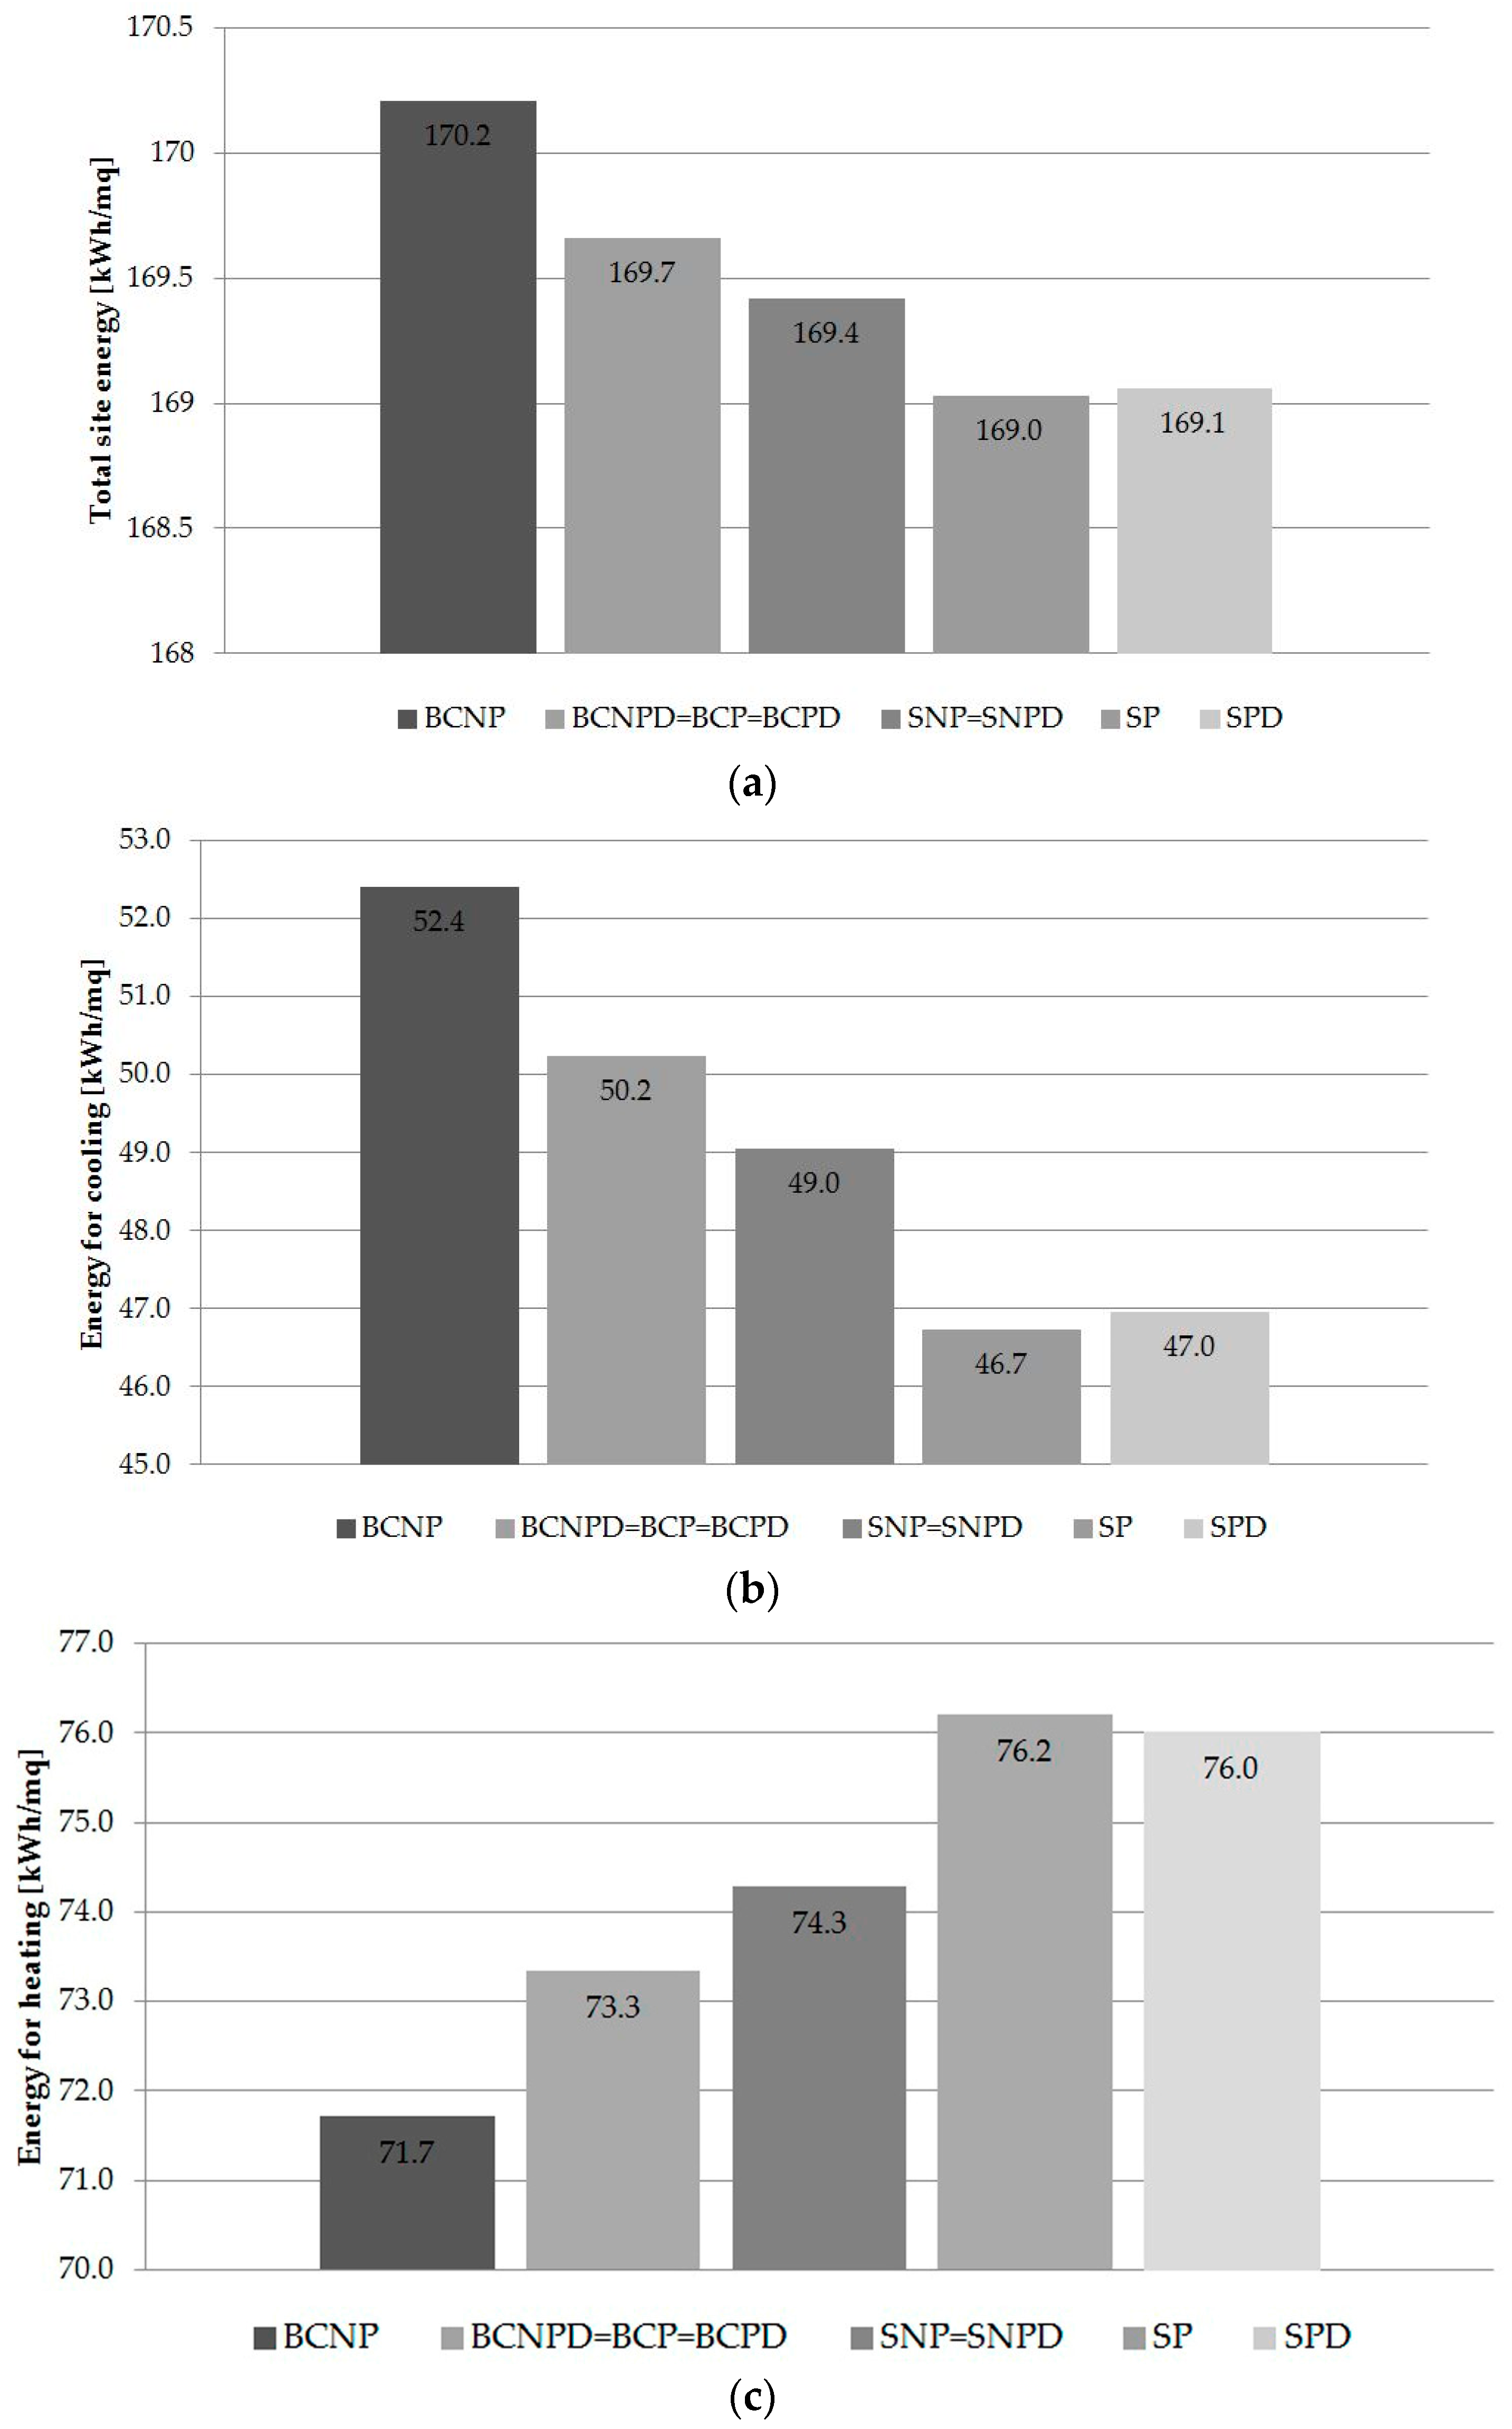
3.3. Energy and Architectural Implications

Optical characteristics can alter the energy performance of materials and construction elements as well as their use in buildings. Characteristics of envelope materials change due to the interaction with the environment. Therefore, the energy performance varies as time passes, leading to imprecise assessment and previsions. In previous work [10], the impact of marble reflectance on the energy consumption of a case study building was shown to lower the energy demand for cooling by 18% when compared to common concrete tiles. That analysis was carried out using new construction elements, not those exposed to the external environment. Degradation due to exposure to acidic environment can be an important consideration, particularly for buildings in industrialized urban areas suffering of high levels of pollution.
By considering the findings of the above work, a 43% increase in reflectance of marble was found, compared to cement-based material, resulting in the 18% decrease in energy consumption for cooling. Therefore, the degradation could affect energy performance by modifying energy consumption depending on marble type and surface finish. The assessed modifications in SRI due to degradation and surface smoothness were equal to 7.2 and 7.5, respectively, for SNP and BCNP, while they were negative for SP (0.8) and BCP (2.4).
Operation temperatures are assessed by considering free-running conditions in the building, to evaluate the differences brought by degradation during a typical summer day (31 July). Results show different behaviors for BC and S marbles (Figure 6). Temperature, in the case of BC envelope, change with degradation, only for rough surface samples, by approximately −0.5 °C increase in SRI. Such performance is equal to the polished samples, both degraded and non-degraded (Figure 7). For the S marble, significant difference in operation temperatures were was caused by varying surface finish: smoother samples (both degraded and not) are able to decrease temperatures by almost 0.5 °C (Figure 7).
In order to investigate the implications that degradation has on energy consumption, operation of HVAC is considered in the second set of dynamic simulations. Results for energy consumptions confirm the trend found for temperatures: the degradation performed in lab affects BCNP performance, by reducing building’s energy demand for cooling by 4.3%. BCNP degraded performance is equal to smoother sample. In the case of the smoother surface, degradation does not affect energy performance (Figure 7). For S marble, surface finish does have an effect, as the smoother surface is able to decrease energy consumption by 5% (Figure 7). More in depth analysis on the behavior brought by surface finishing at the microstructural scale level, would be useful for better understanding of these phenomena.
While the above features are benefitial during the hot season, the increased reflectance is not beneficial during the cold season where the energy required to reach thermal comfort conditions is larger. The assessment of the energy need for heating during the cold season shows that winter penalties are lower than corresponding summer benefits (Table 10). This is also confirmed by the Total Site Energy requirement for the case study building, which decreases when reflectance increases (Table 10). The corresponding penalty for heating energy consumptions due to increase in reflectance are approximately +4000 to 5000 kWh, approximately 25% to 50% smaller than the decrease in cooling energy need. These findings are in line with previous work [10]. The lower solar radiation intensity during winter compared to hot season is also considerable.
The following conclusions can be made: (i) energy consumption decreases when non-polished samples are degraded; and (ii) energy consumption decreases when surface finish is smooth.
To quantify color change, ∆E [39,41] (12) was used taking into account different values are reported in the literature to indicate the threshold of perceivable differences [40,42,43]. Considering the largest threshold (∆E > 5), the measured ∆E appears as perceivable by human eye in almost all cases, ranging from 1.5 for SP (minimal color difference) to above 30.0 (perceived as two different colors). BCNP was again the most affected. It also experienced the largest modification with respect to other optical characteristics (i.e., reflectance) (Figure 8 and Figure 9).
Δ E = Δ L 2 + Δ a 2 + Δ b 2
Therefore, the interaction with the aggressive acid environment, i.e., weathering, was verified by means of laboratory experiments demonstrating how marble samples’ degradation has implications both on buildings’ energy performance and on aesthetics.

4. Conclusions and Future Developments

The effect of weathering of marble by accelerated exposure to acidic environment was evaluated. This was done by assessing the materials optical properties including solar reflectance, lightness; and, color change. Additionally, the impact of such changes on a building’s energy performance and was investigated.
Changes to the reflectance of both Statuario marble and Bianco Carrara marble were assessed and the evaluation of the factors influencing these modifications were quantified in a linear regression model. The reflectance of both marbles was affected when exposed to the acidic environment. Bianco Carrara was more sensitive to the degradation than Statuario, while the latter exhibited higher reflectance. Polished and non-polished samples were compared. After the exposure, the Solar Reflectance Index increased with exposure to acids in non polished samples, while the index decreased on polished samples. The polished materials had higher reflectance when undegraded, consequently cooler. However after the degradation, the reflectance of polished and non-polished samples where comparable. Reflectance was a key element given its cooling effect. The focus of this work paper is to assess the effect of degradation on energy demand modification in buildings with marble envelopes.
How changes to the solar reflection index affects energy demand is evaluated by means of the building dynamic simulation, incorporating experimentally assessed optical properties of the i marbles. Simulations were carried out in order to compare the behavior of each marble versus exposure level and surface finish: Results show that degradation results in an increase in reflectance leading to a consequent improvement of the building energy performance for Bianco Carrara non-polished marbles. When used as building envelope this allows energy demand reduction of more than 4% for cooling. For the polished samples, the decrease in reflectance, which is smaller, has insignificant effect on energy consumption: For the Statuario marble, while the degradation behavior was the same, energy consumption is not affected by degradation in this kind of marble, meanwhile smoother surface finish-induced increase in reflectance results in reduction of energy demand for cooling up to 5%.
Color analysis gave an idea of aesthetic modifications of the marble envelopes, with respect to both lightness and color perception. The greater impact of degradation on Bianco Carrara marbles is verified for lightness. Color analysis demonstrated the importance of exposure time, marble type; exposure conditions. pH in modifying a* coordinate (red to green). ∆E difference in colors was quantified as perceivable in almost every case, leading to the perception of two different colored samples for the degraded and the non-degraded samples. While degraded samples turned darker, Bianco Carrara tended to cooler tones (i.e., greener and bluer), while Statuario marble varied slightly towards warmer red tones.
The assessment confirmed the results of previous work by authors [18], where Bianco Carrara was more sensitive to the aggressive solutions with low pH, compared to Statuario marble. However, degradation increased the cooling potential of non-polished Bianco Carrara Marble. Therefore, for the investigated time span, this led to slightly improved energy performance (−4.3% energy demand for cooling). This improvement was equal to the effect of polishing process in increasing reflectance, which permitted the same energy reduction for non polished degraded samples and polished samples. Polished samples also demonstrated the advantage of being less sensitive to degradation: the degradation process did not significantly impact their aesthetics performance. With respect to temperatures, the increased solar reflectance capability in degraded samples resulted in decrease of indoor operation temperatures by 0.5 °C, as well as the contribution of the surface polishing.
This research provided preliminary conclusion that degradation of marble construction elements by means of exposure to simulated acid rains leads to modified energy performance and aesthetics, i.e., change in color perception (∆E > 5), and consequent change in energy performance (−4% up to −5% reduction of cooling energy due to the degradation). This was similar to the result obtained by the polishing process. The indoor operation temperatures were up to 0.5 °C lower in non-polished marble after degradation and in the polished marble without degradation.

Acknowledgments

The authors would like to thank the H2CU, Honors Center of Italian Universities, which sponsored the international collaboration among the authors, and IMM Carrara and Calvasina Spa for providing support and samples. A.L. Pisello’s acknowledgments are due to the “CIRIAF program for UNESCO” in the framework of the UNESCO Chair “Water Resources Management and Culture”, for supporting her research. Finally, the Authors would like to thank the Anonymous Reviewers for their detailed and constructive feedback, which has helped improving the work and its presentation.

Author Contributions

The Authors equally contributed to the development of this manuscript, with particular reference to the first and the corresponding Authors.

Conflicts of Interest

The authors declare no conflict of interest.

Appendix A

Linear regression equations were found to describe and quantify the relation between the IVs and the DVs, where x is marble type (=0 for BC and =1 for S) and y is exposure to the acid environment (=0 when non-exposed and =1 when exposed). Equation (A1) describes the general trend of SRI among all the S and BC samples, both P and NP:
S R I = 57.8 + 11.7 x + 6.7 y + 1.9 z
Fischer test p for the model = 0.01; px < 0.01; py = 0.06; pz = 0.51 (not significant).
Therefore, SRI, starting from a 57.8 value, increases by +11.7 when the selected marble is S and +6.7 as degradation proceeds (in this case, for four weeks at 4 pH). Finally, the observed change due to surface finish, polished (y = 1) or not polished (y = 0), is +1.9 when the surface is polished; however, the last term is not significant, with a p = 0.51.
Equation (A2) assessed more in particular the behavior of non-polished samples, whereas no significant relation was found for polished samples SRI change due to degradation.
S R I , n p = 57.8 + 16.4 x + 2.0 y
plinear model < 0.01; px < 0.01; py = 0.13 (not significant, but further analyses are needed).
The modification on SRI, starting again from a value of 57.8, for non-polished samples is due to marble type: S has +16.4 higher SRI, while exposure to acid environment implied an increase of +2.0 in SRI, which is slightly significant.
In addition, UV and Vis modifications can be related to linear equations:
U V = 52.2 + 9.4 z + 6.4 x + 2.78 y
plinear model < 0.01; px < 0.01; py = 0.17 (not significant but further analyses are needed); pz < 0.01.
V i s = 63.1 + 11.7 x + 6.2 y + 2.1 z
plinear model < 0.01; px = 0.02; py = 0.09; pz = 0.49 (not significant).
V i s , n p = 63.18 + 15.8 x + 2.1 y
plinear model < 0.01; px < 0.01; py = 0.15 (not significant but further analyses are needed).
For UV (Equation (A3)), analysis showed that while exposure is not significant in defining the modification in UV reflectance, both surface finish and marble type implied an increase in this portion of the spectrum, respectively, of +9.4 when the surface is polished and of 6.4 when the chosen marble is S.
Exposure is instead significant in defining Vis modifications Equation (A4): in addition to marble type (+11.7 when S), the degradation caused a +6.2 increment in Vis. Similarly, for Vis reflectance in non-polished samples (Equation (A5)), S provided a +15.8 while exposure resulted in an increase of 2.1, which was slightly significant. Polished samples did not show any linear relation, which was significant in assessing UV, Vis and SRI, while for NIR it was not possible to find a relation for P and NP samples.
Considering now the marbles individually, SRI and Vis modifications for S marble can be described with linear regressions.
S R I / V i s , S , n p = 75.9 + 3.3 y
plinear model = 0.06; py = 0.06.
S R I / V i s , S , n p = 82.1 + 1.3 y
plinear model = 0.4; py = 0.4 (not significant).
While for S-NP samples the exposure brought significantly higher SRI and Vis (Equation (A6)) values, the degradation for P samples was not significant (Equation (A7)).
S R I / V i s , B C , p = 50.3 + 15.3 y
plinear model < 0.01; py < 0.01.
S R I / V i s , B C , p = 61.7 2.0 y
plinear model < 0.01; py = 0.02.
BC analysis showed the same trend than for S, but the significance and the modifications were larger than for S marble (Equations (A8) and (A9)).

Appendix B

The linear regression for lightness (L*) results gave the following Equation (B1):
L * = 68.7 + 0.26 x 8.0 y 2.6 w
plinear model = 0.03; px = 1.00 (not significant); py = 0.05; pw = 0.50 (not significant). Where x represents marble type (=0 is BC, =1 is S), not significantly affecting L*, while y is exposure time (significant) and w is pH level (=0 when non-exposed, =1 when pH is 4, and =2 when pH is 3, the most acidic), not statistically significant in affecting L*.
The linear regression equation considering color coordinates a* and b* could be found slightly significant, just for a*, explaining the changes due to the considered IVs:
a * = 1.19 2.5 x 4.5 y + 4.7 w
plinear model = 0.23 (not significant, but further investigation needed); px = 0.40 (not significant); py = 0.09; pw = 0.08.
In Equation (B2), x again represents marble type (not significant for a*); y is exposure time (0 = non-exposed, 1 = 2 w, and 2 = 4 w), found significant with a p = 0.09; and w indicates pH level of the acid solution employed to degrade the samples, and this IV was found significant with a p = 0.08.

References

  1. Pérez-Lombard, L.; Ortiz, J.; Pout, C. A review on buildings energy consumption information. Energy Build. 2008, 40, 394–398. [Google Scholar] [CrossRef]
  2. Ürge-Vorsatz, D.; Cabeza, L.F.; Serrano, S.; Barreneche, C.; Petrichenko, K. Heating and cooling energy trends and drivers in buildings. Renew. Sustain. Energy Rev. 2015, 41, 85–98. [Google Scholar] [CrossRef]
  3. Oke, T.R. The energetic basis of the urban heat island. Q. J. R. Meteorol. Soc. 1982, 108, 1–24. [Google Scholar] [CrossRef]
  4. Santamouris, M.; Cartalis, C.; Synnefa, A.; Kolokotsa, D. On the impact of urban heat island and global warming on the power demand and electricity consumption of buildings—A review. Energy Build. 2015, 98, 119–124. [Google Scholar] [CrossRef]
  5. Pacheco-Torgal, F.; Labrincha, J.A. The future of construction materials research and the seventh UN Millennium Development Goal: A few insights. Constr. Build. Mater. 2013, 40, 729–737. [Google Scholar] [CrossRef] [Green Version]
  6. Pisello, A.L.; Rosso, F. Natural Materials for Thermal Insulation and Passive Cooling Application. Key Eng. Mater. 2015, 666, 1–16. [Google Scholar] [CrossRef]
  7. Pisello, A.L.; Castaldo, V.L.; Rosso, F.; Piselli, C.; Ferrero, M.; Cotana, F. Traditional and Innovative Materials for Energy Efficiency in Buildings. Key Eng. Mater. 2016, 678, 14–34. [Google Scholar] [CrossRef]
  8. Santamouris, M. Using cool pavements as a mitigation strategy to fight urban heat island—A review of the actual developments. Renew. Sustain. Energy Rev. 2013, 26, 224–240. [Google Scholar] [CrossRef]
  9. Santamouris, M.; Synnefa, A.; Karlessi, T. Using advanced cool materials in the urban built environment to mitigate heat islands and improve thermal comfort conditions. Sol. Energy 2011, 85, 3085–3102. [Google Scholar] [CrossRef]
  10. Rosso, F.; Pisello, A.; Cotana, F.; Ferrero, M. Integrated Thermal-Energy Analysis of Innovative Translucent White Marble for Building Envelope Application. Sustainability 2014, 6, 5439–5462. [Google Scholar] [CrossRef]
  11. Salata, F.; Golasi, I.; Vollaro, A.D.L.; Vollaro, R.D.L. How High Albedo and Traditional Buildings’ Materials and Vegetation Affect the Quality of Urban Microclimate. A Case Study. Energy Build. 2015, 99, 32–49. [Google Scholar] [CrossRef]
  12. Doya, M.; Bozonnet, E.; Allard, F. Experimental measurement of cool facades’ performance in a dense urban environment. Energy Build. 2012, 55, 42–50. [Google Scholar] [CrossRef]
  13. Salata, F.; Golasi, I.; Vollaro, E.L.; Bisegna, F.; Nardecchia, F.; Coppi, M.; Gugliermetti, F.; Vollaro, A.L. Evaluation of different urban microclimate mitigation strategies through a PMV analysis. Sustainability 2015, 7, 9012–9030. [Google Scholar] [CrossRef]
  14. Rosso, F.; Pisello, A.L.; Pignatta, G.; Castaldo, V.L.; Piselli, C.; Cotana, F.; Ferrero, M. Outdoor Thermal and Visual Perception of Natural Cool Materials for Roof and Urban Paving. Procedia Eng. 2015, 118, 1325–1332. [Google Scholar] [CrossRef]
  15. Salata, F.; Golasi, I.; Vollaro, R.L.; Vollaro, A.L. Outdoor thermal comfort in the Mediterranean area. A transversal study in Rome, Italy. Build. Environ. 2016, 96, 46–61. [Google Scholar] [CrossRef]
  16. Gaitani, N.; Spanou, A.; Saliari, M.; Synnefa, A.; Vassilakopoulou, K.; Papadopoulou, K.; Pavlou, K.; Santamouris, M.; Papaioannou, M.; Lagoudaki, A. Improving the microclimate in urban areas: A case study in the centre of Athens. Build. Serv. Eng. Res. Technol. 2011, 32, 53–71. [Google Scholar] [CrossRef]
  17. Castaldo, V.L.; Coccia, V.; Cotana, F.; Pignatta, G.; Pisello, A.L.; Rossi, F. Thermal-energy analysis of natural “cool” stone aggregates as passive cooling and global warming mitigation technique. Urban Clim. 2015, 14, 301–314. [Google Scholar] [CrossRef]
  18. Rosso, F.; Jin, W.; Pisello, A.L.; Ferrero, M.; Ghandehari, M. Translucent marbles for building envelope applications: Weathering effects on surface lightness and finishing when exposed to simulated acid rain. Constr. Build. Mater. 2016, 108, 146–153. [Google Scholar] [CrossRef]
  19. Camuffo, D. Atmospheric Water and Stone Weathering. In Microclimate for Cultural Heritage; Elsevier Science: New York, NY, USA, 2014; pp. 203–243. [Google Scholar]
  20. Careddu, N.; Marras, G. The effects of solar UV radiation on the gloss values of polished stone surfaces. Constr. Build. Mater. 2013, 49, 828–834. [Google Scholar] [CrossRef]
  21. Paolini, R.; Zinzi, M.; Poli, T.; Carnielo, E.; Mainini, A.G. Effect of ageing on solar spectral reflectance of roofing membranes: Natural exposure in Roma and Milano and the impact on the energy needs of commercial buildings. Energy Build. 2014, 84, 333–343. [Google Scholar] [CrossRef]
  22. Lopez-Arce, P.; Varas-Muriel, M.J.; Fernandez-Revuelta, B.; Allvarez de Buergo, M.; Fort, R.; Perez-Soba, C. Artificial weathering of Spanish granites subjected to salt crystallization tests: Surface roughness quantification. Catena 2010, 83, 170–185. [Google Scholar] [CrossRef] [Green Version]
  23. Borges, M.I.; Simão, J.; Silva, Z.; Simão, J.; Ioannou, I.; Theodoridou, M. Artificial Weathering of Portuguese Granites Exposed to Salt Atmosphere: Variations of Physico-Mechanical Properties. In Proceedings of the Conference “Salt Weathering on Buildings and Stone Sculptures”, Limassol, Cyprus, 19–22 Octerber 2011; pp. 241–248.
  24. Kirkitsos, P.; Sikiotis, D. Deterioration of Pentelic marble, Portland limestone and Baumberger sandstone in laboratory exposures to NO2: A comparison with exposures to gaseous HNO3. Atmos. Environ. 1996, 30, 941–950. [Google Scholar] [CrossRef]
  25. Sikiotis, D.; Delopoulou, P. The corrosion of pentelic marble by the dry deposition of nitrates and sulphates. Sci. Total Environ. 1992, 120, 213–224. [Google Scholar] [CrossRef]
  26. Cardell, C.; Benavente, D.; Rodríguez-Gordillo, J. Weathering of limestone building material by mixed sulfate solutions. Characterization of stone microstructure, reaction products and decay forms. Mater. Charact. 2008, 59, 1371–1385. [Google Scholar] [CrossRef]
  27. Eren Sarici, D. Thermal deterioration of marbles: Gloss, color changes. Constr. Build. Mater. 2016, 102, 416–421. [Google Scholar] [CrossRef]
  28. Federation of European Producers of Abrasives (FEPA). Available online: http://www.fepa-abrasives.com/ (accessed on 1 August 2016).
  29. National Atmospheric Deposition Program. Available online: http://nadp.sws.uiuc.edu/ (accessed on 3 March 2016).
  30. Franzoni, E.; Sassoni, E. Correlation between microstructural characteristics and weight loss of natural stones exposed to simulated acid rain. Sci. Total Environ. 2011, 412–413, 278–285. [Google Scholar] [CrossRef] [PubMed]
  31. ASTM. E903—12 Standard Test Method for Solar Absorptance, Reflectance, and Transmittance of Materials Using Integrating Spheres; American Society of Testing Materials: West Conshohocken, PA, USA, 1996. Available online: http://www.astm.org/Standards/E903.htm (accessed on 7 December 2015).
  32. SolidSpec-3700/3700DUV UV-VIS-NIR Spectrophotometer, SHIMADZU (Shimadzu Corporation). Available online: http://www.shimadzu.com/an/spectro/uv/solidspec/solid.html (accessed on 7 December 2015).
  33. Ocean Optics. USB2000+VIS-NIR—Ocean Optics. 830 Douglas Avenue, Dunedin, FL, USA. Available online: http://oceanoptics.com/product/usb2000vis-nir/ (accessed on 3 March 2016).
  34. Pisello, A.L.; Cotana, F. The thermal effect of an innovative cool roof on residential buildings in Italy: Results from two years of continuous monitoring. Energy Build. 2014, 69, 154–164. [Google Scholar] [CrossRef]
  35. Xu, X.; Taylor, J.E.; Pisello, A.L. Network synergy effect: Establishing a synergy between building network and peer network energy conservation effects. Energy Build. 2014, 68, 312–320. [Google Scholar] [CrossRef]
  36. Pisello, A.L.; Castaldo, V.L.; Taylor, J.E.; Cotana, F. Expanding Inter-Building Effect modeling to examine primary energy for lighting. Energy Build. 2014, 76, 513–523. [Google Scholar] [CrossRef]
  37. Design Builder. Available online: http://www.designbuilder.co.uk/ (accessed on 1 August 2016).
  38. EnergyPlus. Available online: https://energyplus.net/ (accessed on 1 August 2016).
  39. Wyszecki, G.; Stiles, W.S. Color Science. Concepts and Methods, Quantitative Data and Formulae, 2nd ed.; John Wiley and Sons: Hoboken, NJ, USA, 1982. [Google Scholar]
  40. Urosevic, M.; Sebastian-Pardo, E.; Cardell, C. Rough and polished travertine building stone decay evaluated by a marine aerosol ageing test. Constr. Build. Mater. 2010, 24, 1438–1448. [Google Scholar] [CrossRef]
  41. Witzel, R.F.; Burnham, R.W.; Onley, J.W. Threshold and suprathreshold perceptual color differences. J. Opt. Soc. Am. 1973, 63, 615–625. [Google Scholar] [CrossRef] [PubMed]
  42. Benavente, D.; Martínez-Verdú, F.; Bernabeu, A.; Viqueira, V.; Fort, R.; Garcia del Cura, M.A.; Illueca, C.; Ordóñez, S. Influence of surface roughness on color changes in building stones. Color Res. Appl. 2003, 28, 343–351. [Google Scholar] [CrossRef]
  43. Grossi, C.M.; Brimblecombe, P.; Esbert, R.M.; Alonso, F.J. Color changes in architectural limestones from pollution and cleaning. Color Res. Appl. 2007, 32, 320–331. [Google Scholar] [CrossRef]
Figure 1. Bianco Carrara (a) and Statuario (b) marbles.
Sustainability 08 00753 g001
Figure 2. S samples reflectance spectrum (300 to 2500 nm wavelength).
Sustainability 08 00753 g002
Figure 3. BC samples reflectance spectrum (300 to 2500 nm wavelength).
Sustainability 08 00753 g003
Figure 4. S marble lightness (L*) change with degradation progress.
Sustainability 08 00753 g004
Figure 5. BC marble lightness (L*) change with degradation progress.
Sustainability 08 00753 g005
Figure 6. Operative temperatures with varying envelope: (i) degradation progress; and (ii) surface finish.
Sustainability 08 00753 g006
Figure 7. (a) Yearly total site energy; (b) energy for cooling; and (c) energy for heating, with varying: (i) envelope; (ii) degradation progress; and (iii) surface finish.
Sustainability 08 00753 g007
Figure 8. Bianco Carrara (BC) colors during the experiment.
Sustainability 08 00753 g008
Figure 9. Statuario (S) colors during the experiment.
Sustainability 08 00753 g009
Table 1. Soaking #1 set up.
SampleWeeks of Exposure (w)pH
BC44
BCP44
S44
SP44
Table 2. Soaking #2 set up.
SampleWeeks of Exposure (w)pHSampleWeeks of Exposure (w)pH
BC24BC44
BCP24BCP44
S24S44
SP24SP44
BC23BC43
BCP23BCP43
S23S43
SP23SP43
Table 3. Envelope system characteristics.
Envelope System
Vertical EnvelopeThickness (m)
Bianco Carrara marble layer0.01
or Statuario marble layer
epoxy resin0.001
glass0.01
air gap0.25
internal glass0.02
U-value2.6 W/m2·K
RoofThickness (m)
Asphalt membrane0.01
mineral wool rolls0.14
air gap0.03
plasterboard0.02
cement slab0.2
U-value0.2 W/m2·K
Table 4. Envelope system characteristics.
ApplicationThermal Zones
PublicHall, lecture theatreDisplay and public areasExposition areas
Density:0.2 people/m20.15 people/m20.05 people/m2
Activity, metabolic rate:standing and walking, 140 W/personlight manual work, 180 W/personlight work 160, W/person
Target illuminance:300 lux200 lux300 lux
Equipment gain:2 W/m2, radiant fraction 20%30 W/m2, radiant fraction 20%
Schedule:8:00 a.m. to 6:00 p.m., 7 days/week8:00 a.m. to 6:00 p.m., 6 days/week8:00 a.m. to 1:00 p.m. and 6:00–9:00 p.m., 7 days/week
Domestic dining roomDomestic kitchen
PrivateDensity:0.17 people/m20.05 people/m2
Activity, metabolic rate:eating and drinking, 110 W/personlight work, 160 W/person
Target illuminance:150 lux300 lux
Equipment gain:3 W/m2, radiant fraction 20%30 W/m2, radiant fraction 20%
Schedule:8:00 a.m. to 1:00 p.m. and 6:00 p.m. to 9:00 p.m., 7 days/week8:00 a.m. to 1:00 p.m. and 6:00 p.m. to 9:00 p.m., 7 days/week
Table 5. Performed dynamic simulations.
Simulations 1
#Envelope Material#Envelope Material
Non DegradedDegraded
1BCNP1DBCNPD
2BCP2DBCPD
3SNP3DSNPD
4SP4DSPD
1 All performed twice, once with operating HVAC and once with non-operating HVAC.
Table 6. S reflectance (%) measured values and differences between degraded and non-degraded samples.
Statuario (S)0 Weeks4 Weeks∆R(NPD-NP)∆R(PD-P)
NPPNPP
UV (%)56.3173.7362.3470.876.03−2.86
VIS (%)74.4385.3481.6784.057.24−1.29
NIR (%)64.7554.455.0872.64−9.6718.24
SRI (%)69.6979.5676.978.757.21−0.81
Table 7. BC reflectance measured values and differences between degraded and non-degraded samples.
Bianco Carrara (BC)0 Weeks4 Weeks∆R(NPD-NP)∆R(PD-P)
NPPNPP
UV (%)47.3762.0454.7960.657.42−1.39
VIS (%)57.1167.4065.6363.318.52−4.09
NIR (%)47.5570.9670.6354.6523.08−16.31
SRI (%)52.6961.8460.1659.447.47−2.40
Table 8. Lightness L* mean values for BC and S samples.
SamplesL* at 0 Weeks ExposureL* at 2–4 Weeks Exposure∆L*(4 w–0 w)
2 w4phBCNP62.7963.050.26
BCP63.3462.54−0.80
SNP61.8062.260.46
SP62.8565.652.80
3phBCNP62.7963.310.52
BCP63.3462.38−0.96
SNP61.8063.021.22
SP62.8561.46−1.39
4 w4phBCNP62.7959.98−2.81
BCP63.3460.08−3.26
SNP61.8049.91−11.89
SP62.8558.55−4.30
3phBCNP62.7928.25−34.54
BCP63.3433.19−30.15
SNP61.8032.15−29.65
SP62.8543.82−19.03
Table 9. Color a* and b* mean values for BC and S samples.
Samplesa* at 0 wa* at 2/4 w∆a*(2/4 w–0 w)b* at 0 wb* at 2/4 w∆b*(2/4 w–0 w)
2 w4phBCNP1.012.611.604.4913.312.90
BCP1.232.941.713.779.542.06
SNP1.372.571.212.431.701.22
SP−1.68−8.07−6.39−0.09−19.386.30
3phBCNP1.011.700.694.4924.673.81
BCP1.235.304.073.7714.01−0.30
SNP1.372.150.782.433.151.65
SP−1.686.838.52−0.0917.53−8.61
4 w4phBCNP1.01−17.87−18.884.49−34.6523.38
BCP1.234.253.023.7712.730.75
SNP1.37−5.11−6.482.43−10.318.90
SP−1.68−2.27−0.59−0.092.600.50
3phBCNP1.0116.8115.804.49107.94−11.31
BCP1.23−3.59−4.833.77−5.338.59
SNP1.370.33−1.042.43−3.363.47
SP−1.68−6.37−4.69−0.09−6.034.60
Table 10. Case study building’s consumptions: total site energy, energy for cooling and heating.
Envelope MaterialReflectance (%)Total Site Energy (kWh)∆ (BCNP-BCNPD)/(SNP-SP)Energy for Cooling (kWh)∆ (BCNP-BCNPD)/(SNP-SP)Energy for Heating (kWh)∆ (BCNP-BCNPD)/(SNP-SP)
BCNP52.7513,920.34-158,209-216,562-
BCNPD = BCP = BCPD60.2/61.8/59.4512,249.44−1670.9151,668−6540.9221,4324870
SNP = SNPD69.7511,523.01−726.43148,093−3575.73224,2822849.3
SP79.6510,355.34−1167.67141,117−6975.31230,0895807.64
SPD78.75510,457.22101.88141,812694.28229,497−592.4

