Review

Experimental Research on Primary and Secondary Conversion Efficiencies in an Oscillating Water Column-Type Wave Energy Converter

1
Institute of Ocean Energy, Saga University, 1, Honjo, 840-8502 Saga, Japan
2
Department of Mechanical Engineering, Matsue National College of Technology, 14-4, Nishiikuma, Matsue, 690-8518 Shimane, Japan
*
Author to whom correspondence should be addressed.
Sustainability 2016, 8(8), 756; https://doi.org/10.3390/su8080756
Submission received: 29 June 2016 / Revised: 26 July 2016 / Accepted: 2 August 2016 / Published: 5 August 2016
(This article belongs to the Special Issue Wave Energy Converters)

Abstract

:
For the practical application of a fixed oscillating water column (OWC)-type wave energy converter, it is necessary to develop a design method which can consider the characteristics of incident wave motion, the motion of the internal free surface affected in the structure such as a partly submerged wall, the fluctuation of air pressure in an air chamber, and the rotation of the air turbine. On the other hand, the impulse turbine as the secondary conversion device in the OWC unit is expected to achieve high efficiency. In this paper, firstly, the steady air flow tests for a single-impulse turbine were conducted to grasp the characteristics of the turbine without the effect of water waves. Secondly, the 2-dimensional wave tank tests in regular waves for the performance evaluation of the fixed OWC-type wave energy converter with the same impulse turbine were conducted to obtain the data needed to make this design method. As the results, the effects of the air chamber length and the guide vane’s setting angle on the primary and secondary conversion efficiencies are clarified experimentally.

1. Introduction

For the next leap in power technologies to become a sustainable society, we are under obligation not only to cope with the warming of the global environment but also to conserve the natural ecosystem and coexist with nature. As for the renewable energy resources in the world, we can newly exploit the mini-/micro-hydro, the wind, the solar and the ocean energy, etc. Wave energy which is one of the renewable energies attracts attention as a promising resource that can reduce CO2 emissions. Therefore, the wave energy converter (WEC) which converts wave power into electric power has been developed all over the world and many types of WECs [1,2,3] such as the Oyster WEC as the movable body type [4] and the Sea-wave Slot-cone Generator (SSG) WEC as the overtopping waves type [5] are proposed.
There is an oscillating water column (OWC)-type wave energy converter as one of the WECs. This device is composed of an air chamber, an air turbine and a generator and is considered to be safe even under storm conditions. Many studies on this device [6,7,8] have been performed experimentally and theoretically since the early 1970s.
Toyota et al. [9,10] carried out research with the aim of the practical application of the Backward Bent Duct Buoy (BBDB), which is one of the OWC-type WECs. This device consists of an air chamber, an L-shaped duct, a buoyancy chamber and an air turbine. The BBDB has some advantages, which are that the primary conversion efficiency is higher than that of other floating OWCs, and the mooring cost is low because it is able to advance to the weather side by itself.
Takahashi et al. [11] designed a fixed pneumatic-type wave power extractor. This extractor is a special type of concrete caisson, and it has an air chamber where wave power is extracted and is converted into air power. Besides, Takahashi et al. [12] conducted the field test by installing the Wells turbine and a generator. Lin et al. [13] installed the Savonius rotor turbine in an OWC. In this research, turbine efficiency was evaluated while changing the wave period and turbine rotation speed. In the results, a turbine conversion rate of about 20% was shown experimentally.
In the performance evaluation of the OWC-type WEC, it is necessary to consider the characteristics of the incident wave motion, the motion of the internal free surface affected in the structure such as a partly submerged wall, the fluctuation of air pressure in an air chamber, and the rotation of the air turbine. However, most of the past studies were carried out by dividing the test into two steps of wave tank tests and air turbine tests.
Liu et al. [14] simulated the performance of the OWC without the turbine numerically. In this study, the nozzle effects of the chamber-duct system on the relative amplitudes of the inner free water surface and air flow rate in the duct were investigated. Korde [15] proposed the reactive loading circuit for the control of the natural frequency in the OWC, and it was shown that a high performance associated with resonant oscillations could be obtained.
On the other hand, by means of the test rig having a piston-cylinder to generate the oscillating air flow, the performance of the air turbine was evaluated in a series of studies. Setoguchi et al. [16,17] reviewed a variety of experimental results concerning the performances of the Wells turbine and the impulse turbine. Takao et al. [18] show that the impulse turbine with a fixed guide vane was superior to the Wells turbine in the actual sea with irregular waves.
This paper discusses the primary and the secondary conversion efficiencies of the fixed OWC-type WEC equipped with an impulse turbine. Firstly, the performance of the impulse turbine with fixed guide vanes in the model OWC is confirmed by the steady air flow test without the effect of water waves. Secondly, the effects of the air chamber length and the guide vane’s setting angle on the primary and secondary conversion efficiencies are examined with the 2-dimensional wave tank tests in regular waves, although there are other geometric parameters such as the curtain wall shape and the rotor inlet/outlet angle having an impact on the efficiency.

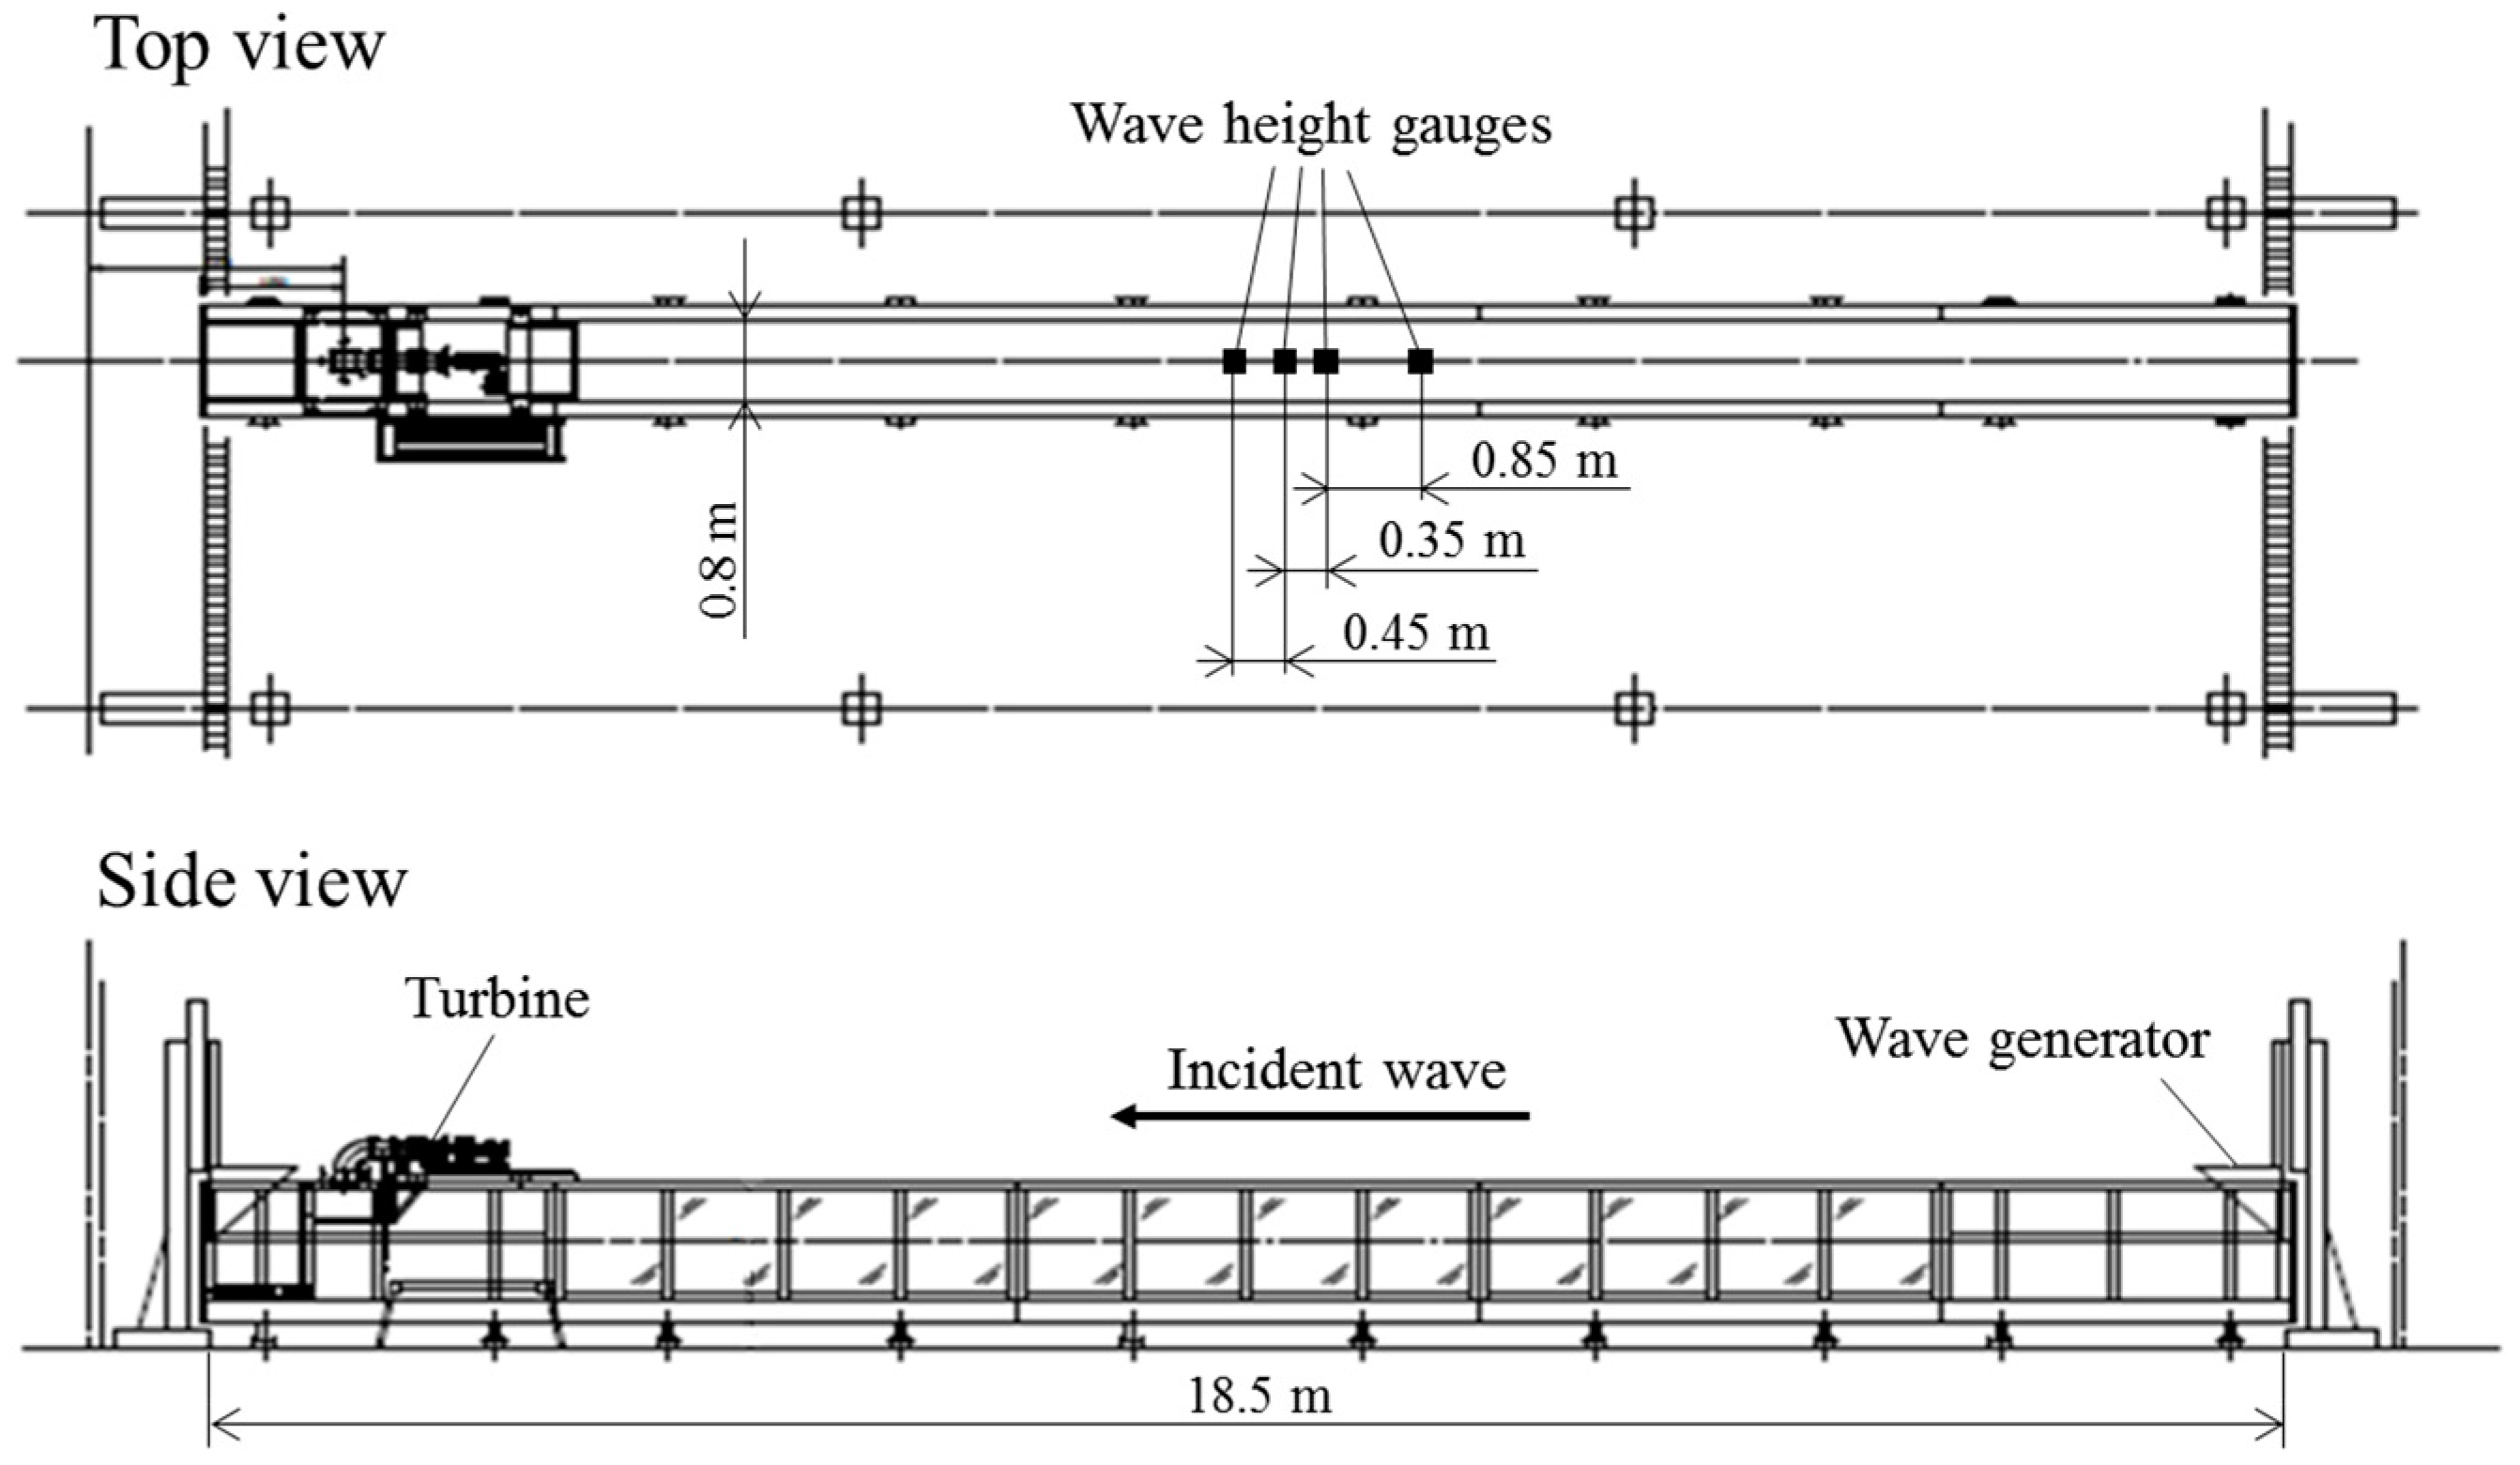
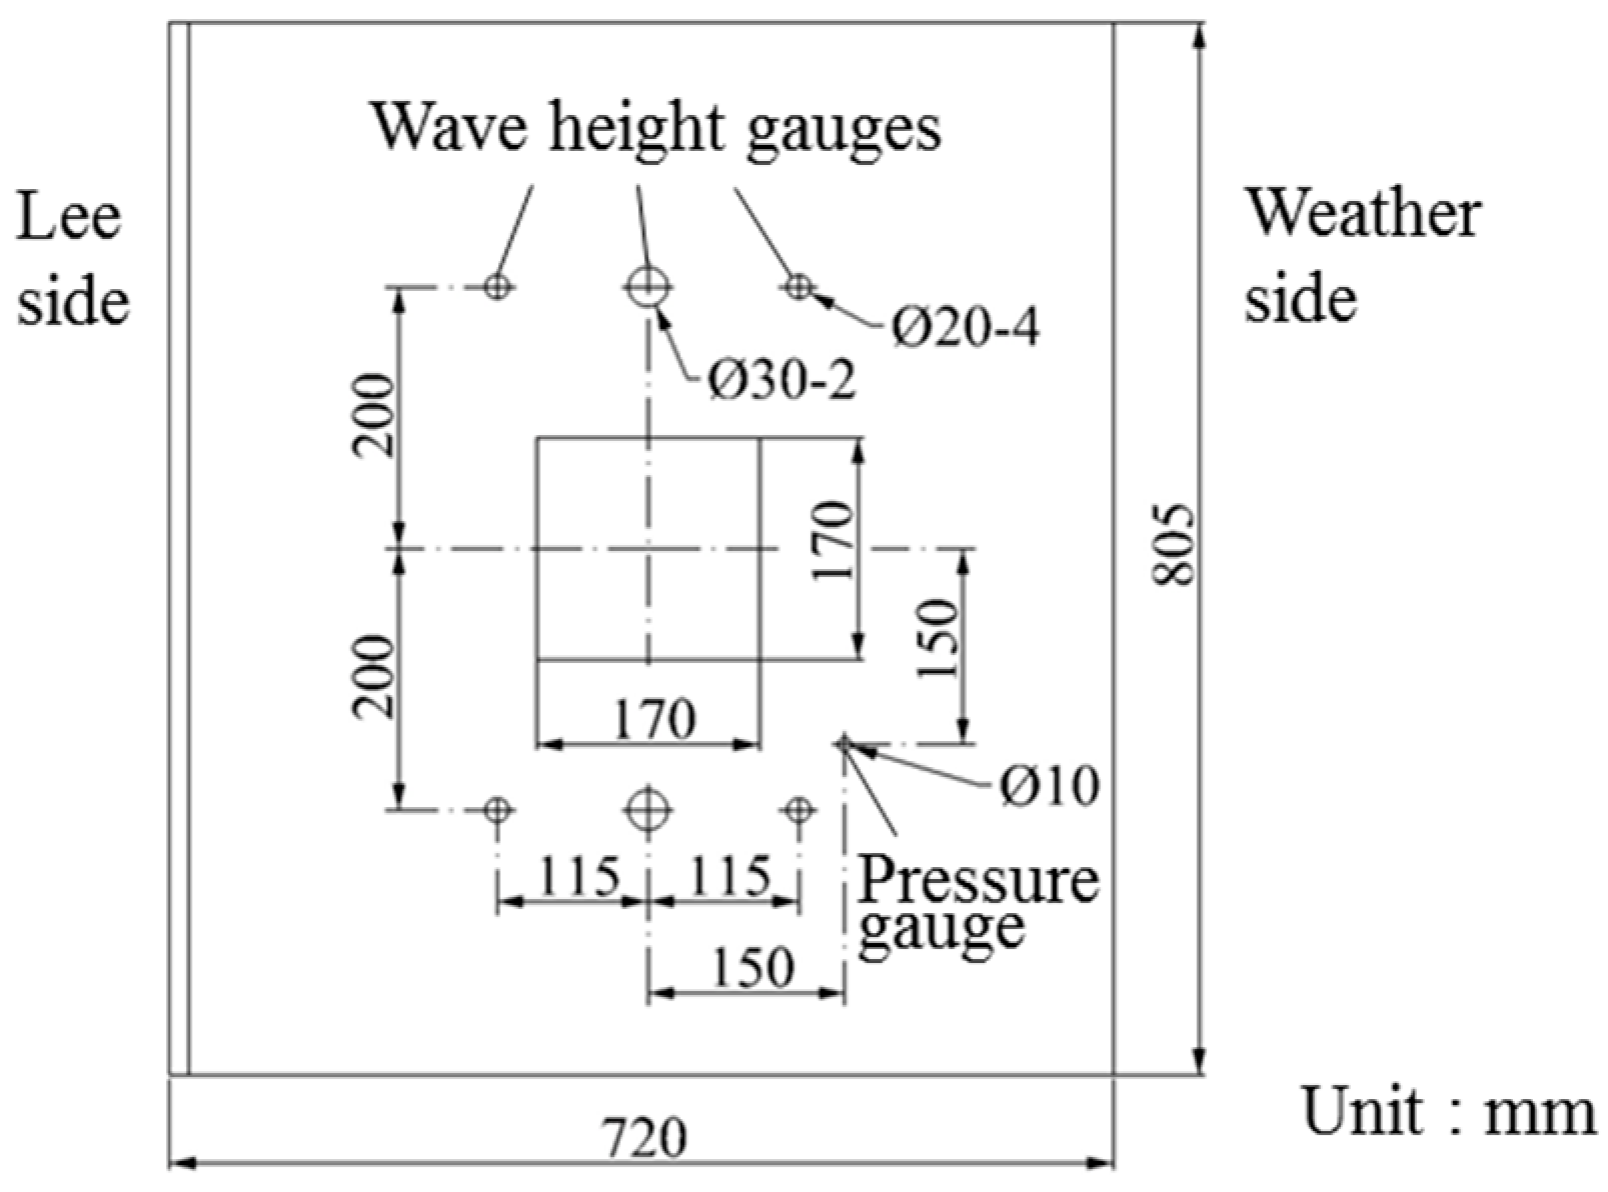
2. Experimental Apparatus

The wave tank test was carried out using regular waves, though real sea waves are irregular, because it is difficult to completely absorb the reflected wave with the wave generator in the case of irregular waves. Besides, it seems that the test with regular waves is acceptable because one of the research objectives is to confirm the highest value of efficiency while changing the wave length and the rotational speed of the turbine. Figure 1 shows the arrangement of the experimental devices in the 2-dimensional wave tank. This tank is 18.5 m long, 0.8 m wide and contains a 0.8 m water depth. An absorbing wave generator was installed at the end of the tank and the model turbine was located at the other end of the tank. Four wave height gauges (TS-DWG) produced by TECHNO SERVICE Co. Ltd. (Kumamoto, Japan) were arranged in order to measure the amplitudes of the incident wave and reflected wave accurately [19]. The wave data is fed into the computer through the analog-to-digital converter (PCI-3165) from the Interface Corporation (Hiroshima, Japan). The incident wave height was configured as high as possible in this wave tank, and the value was 0.1 m.
Figure 2 shows the model OWC-type wave energy converter with the impulse turbine. In the experiments, the turbine was driven by the alternating-current synchronous motor (HG-JR73) manufactured by the Mitsubishi Electric Corporation (Tokyo, Japan). The torque transducer (SS-005) and the electromagnetic rotation detector (MP-981) produced by ONO SOKKI Co. Ltd. (Yokohama, Japan) were located at the end of the turbine shaft. The basic chamber length is 0.7 m, the curtain wall depth is 0.1 m and the thickness of the curtain wall is 0.005 m. The schematic design of the air chamber was conducted in a series of numerical studies [20].
Figure 3 indicates the locations of the pressure gauge (AP-10S) and the wave height gauges (FW-H07 and UD320) made by the KEYENCE CORPORATION (Osaka, Japan) at the top of the air chamber. The rectangular orifice of the air chamber is located at the center and three wave height gauges were set up at the starboard side and portside, respectively. The data of waves, the turbine output torque, the turbine rotational speed, the pressure and the water surface elevation in the air chamber were measured simultaneously. The sampling frequency is 50 Hz, and the 30 s data after starting the wave generator was appropriately neglected to evaluate the OWC performance.
Figure 4 shows the basic configuration of the rotor and the fixed guide vanes. The rotor consists of the 2D blades. The numbers of the rotor blades and the single-stage guide vanes are 26, respectively. The inlet/outlet angle γ of the rotor is 60 degrees and the setting angle θ of the guide vane is 30 degrees. The turbine configuration was adopted on the basis of the air turbine test results [16].
The inner diameter D of the casing is 170 mm, the hub ratio ν is 0.7 and the clearance between the rotor blade tip and the casing is 0.3 mm. The inner diameter D of the turbine casing was calculated by the following equations.
ε = S N / S
Δ p N = 0.5 C p ρ v N 2
Δ p = 0.5 ψ ρ v a 2
C p = ( 1 ε ) ( 2.75 1.56 ε )
where ε, SN, S, ΔpN, Cp, ρ, vN, Δp, ψ and va denote the nozzle ratio (=1/100), the cross-section area of the nozzle, the cross-section area of the air chamber, the total pressure difference at the nozzle, the pressure loss coefficient of the nozzle, the air density, the axial flow velocity in the nozzle, the total pressure drop at the turbine, the turbine pressure coefficient, and the axial flow velocity in the turbine.
Firstly, the pressure loss coefficient of Cp containing the S corresponding to the product of the tank width and the air chamber length can be calculated by Equation (4), and the turbine pressure coefficient of ψ is determined by Equation (3) which is composed of the total pressure drop Δp and the axial flow velocity va. The Δp and va are the experimental results obtained by the preliminary turbine test [18]. Moreover, the total pressure difference at the nozzle is equal to the total pressure drop at the turbine (ΔpN = Δp), and the flow rate in the turbine is the same as in the case of the nozzle (Q = vaST = vNSN). These relations result in the following equation.
S T / S N = ( ψ / C p ) 0.5
where ST is the flow passage area of the turbine. Therefore, the inner diameter D as the hub ratio ν = 0.7 is derived from the known SN, ψ and Cp.

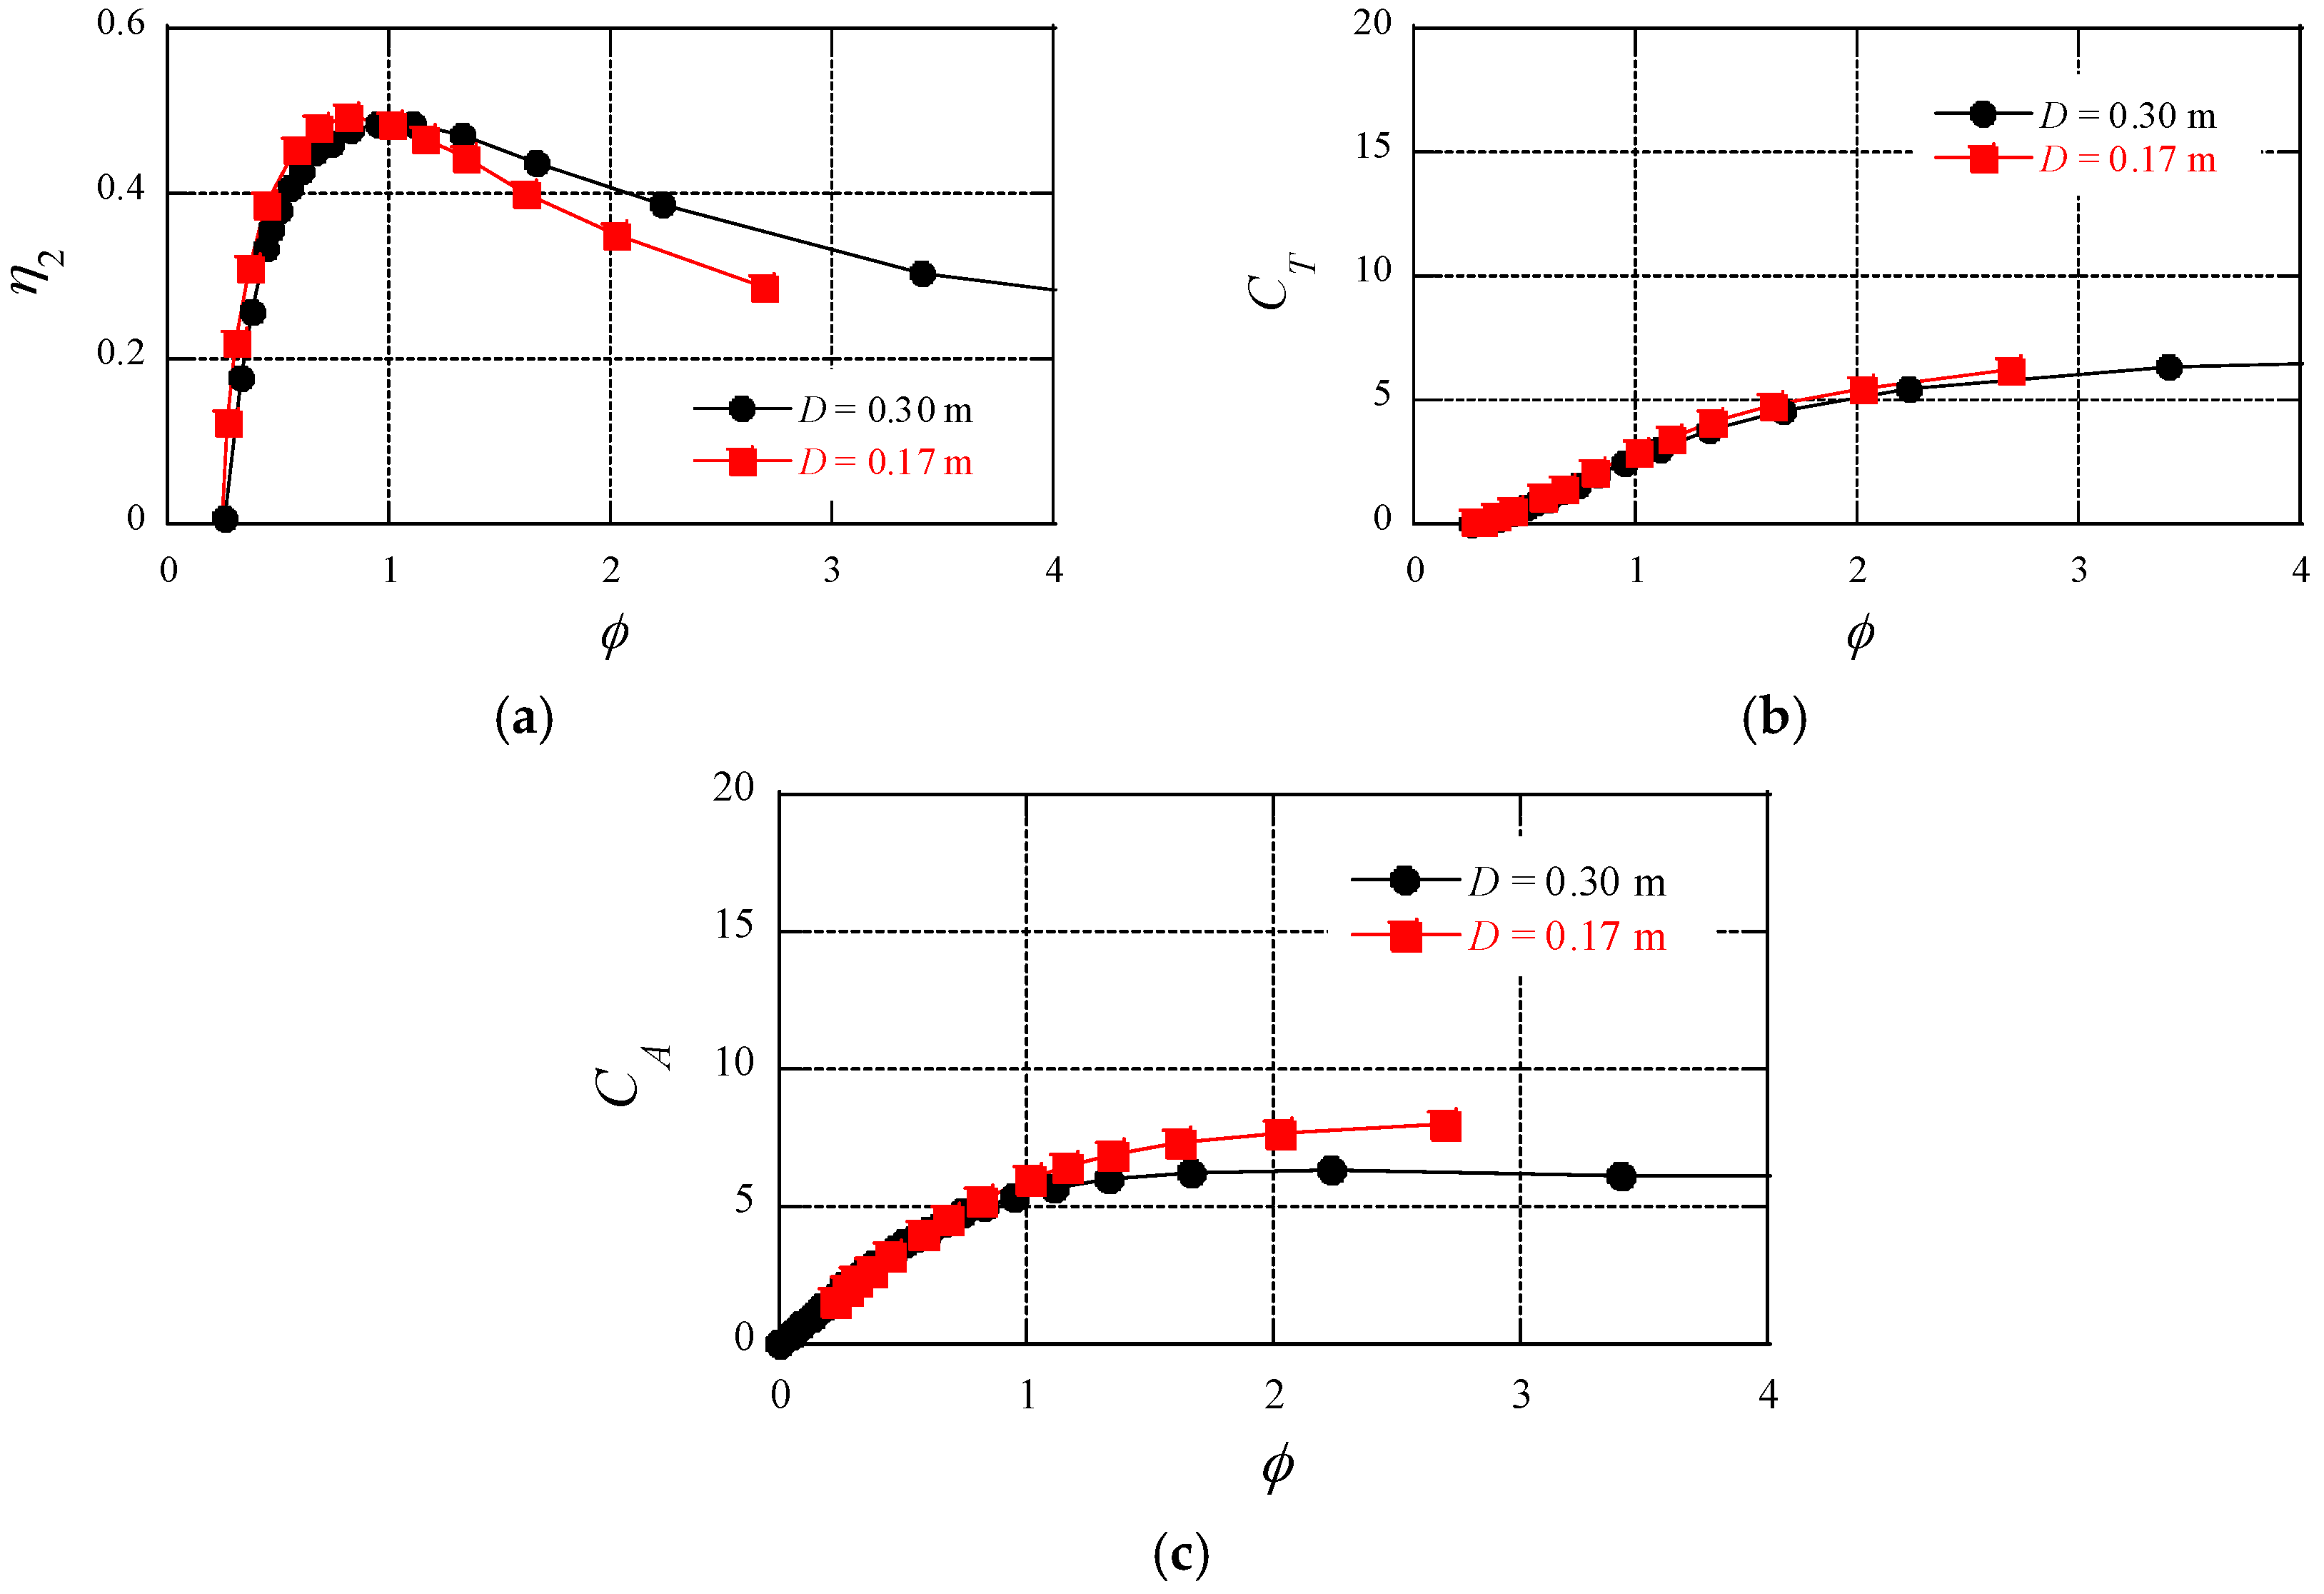
3. Steady Air Flow Test

To grasp the turbine’s performance, we conducted a steady flow test. The bottom of the air chamber in Figure 2 was closed and the steady air flow was generated by a centrifugal fan. Figure 5 shows the experimental results of the turbine performance where η2 is the secondary conversion efficiency, CT is the torque coefficient, CA is the input coefficient and the abscissa φ is the flow coefficient. The definitions of these parameters are as follows:
η 2 = T 0 ω / ( Δ p Q )
C T = T 0 / [ 0.5 ρ ( v a 2 + U 2 ) S T r ]
C A = Δ p Q / [ 0.5 ρ ( v a 2 + U 2 ) S T r ]
ϕ = v a / U
where T0, ω, Q and U denote the turbine output torque, the angular velocity of the rotor, the flow rate and the circumferential velocity at mean radius r [= D(1 + ν)/4], respectively. The flow rate Q was measured by the velocity meter (KANOMAX 6501) at the fan duct.
In Figure 5, D = 0.30 m denotes the result of the conventional turbine test without the air chamber and the elbow measured by Takao et al. [16,18]. The turbine with D = 0.17 m prepared for this study is geometrically similar to the case of D = 0.30 m. In the case of D = 0.17 m, it is noticed that the maximum η2 of 0.48 is achieved which is as high as the case of D = 0.30 m, although the values are low at the high flow rate due to the increase of CA.

4. Oscillating Air Flow Tests by Water Waves

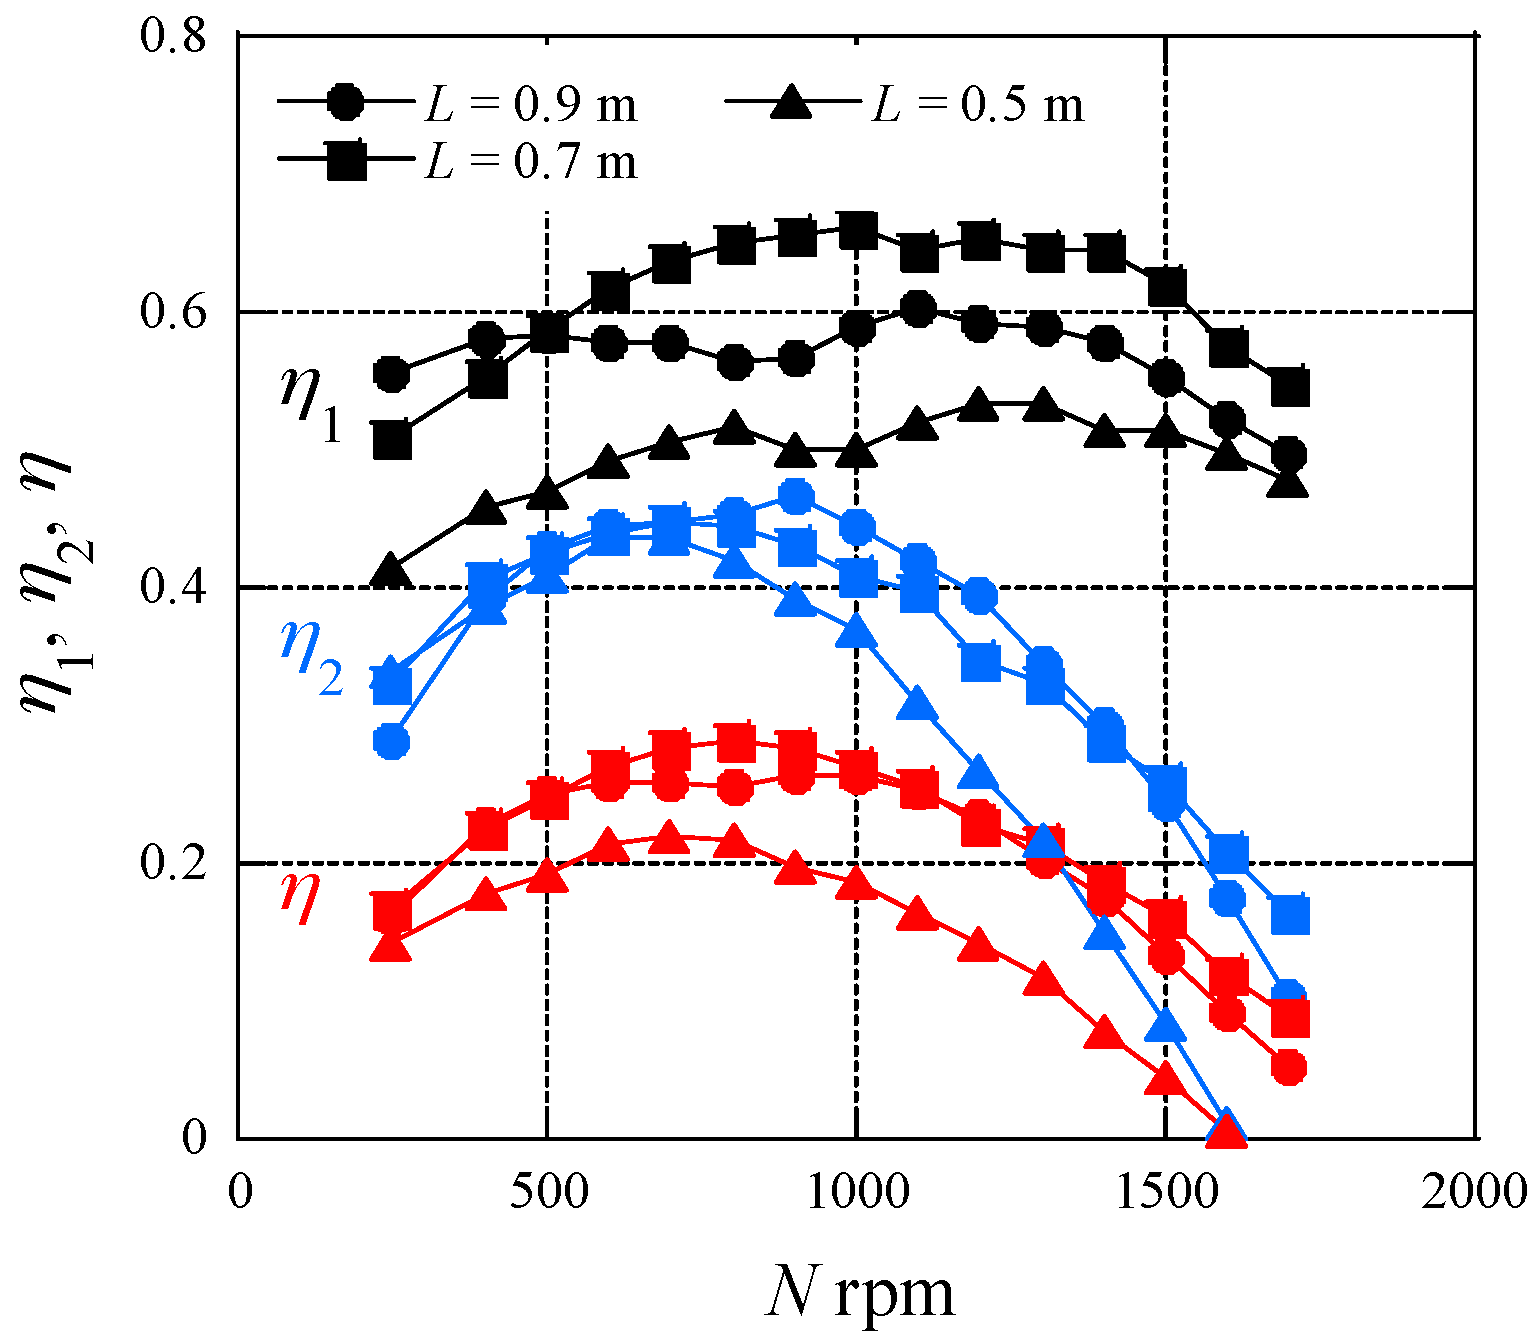
4.1. Effect of Air Chamber Length

To know the effects of the air chamber length L on the primary and secondary conversion efficiencies, the length was changed from L = 0.7 m to 0.5 m and 0.9 m as shown in Figure 6.
η 1 = P a i r / P w a v e
η 2 = P t o r q u e / P a i r
η = P t o r q u e / P w a v e
where Pair is the time-averaged power of the compressed air, Pwave is the time-averaged power of the incident wave and Ptorque is the turbine output. The definitions of these parameters are as follows:
P a i r = S T 0 T p ( t ) ζ t d t
P w a v e = 0.5 ρ w g ζ i 2 C g W
P t o r q u e = 1 T 0 T T 0 ω d t
where T, p, ζ, ρw, g, ζi, Cg and W denote the period of the incident wave, the pressure, the six averaged water level in the air chamber, the water density, the gravitational acceleration, the incident wave amplitude, the group velocity and the chamber width, respectively.
Figure 7 shows the variations of the primary conversion efficiency η1, the secondary conversion efficiency η2 and the generating efficiency η due to the rotational speed N of the turbine. The wave length λ was kept constant at about λ/L = 6.3. In the three cases of L = 0.5 m, 0.7 m and 0.9 m, the wave periods corresponding to about λ/L = 6.3 are T = 1.50 s, 1.87 s and 2.30 s, respectively. The generating efficiency η is defined as the product of η1 and η2. The efficiencies η1, η2 and η are calculated by the following equations.
As shown in Figure 7, the maximum η was achieved at about N = 700 rpm in all three cases of L = 0.5 m, 0.7 m and 0.9 m, and the maximum value of 0.28 was shown in the case of L = 0.7 m. Meanwhile, the maximum η was decreased in the case of L = 0.5 m because the η1 was decreased. The remarkable difference of the maximum η2 between the three cases was not seen.
Figure 8 shows a comparison between the steady air flow test and the oscillating air flow test on the turbine performance. The abscissa is the flow coefficient φ. It is noticed that the trends in the three cases of the oscillating air flow tests are similar to the one of the steady air flow test, although the maximum η2 = 0.45 in the case of the wave tank test is slightly low because of the CA increase.
Next, the incident wave length λ was changed while keeping the rotational speed N = 700 rpm to make clear the maximum efficiencies derived from the configuration of the above model OWC. The wave periods are T = 1.00 s, 1.15 s, 1.30 s, 1.41 s, 1.50 s, 1.56 s, 1.65 s, 1.73 s, 1.87 s, 2.03 s, 2.30 s and 2.63 s. Figure 9 shows the variations of the efficiencies due to the λ/L. The λ/L as the measurement points become small with the increase of L because of the same wave period T, as shown in the cases L = 0.7 m and 0.9 m. In all three cases of L = 0.5 m, 0.7 m and 0.9 m, the maximum η2 is almost the same value. On the other hand, the maximum η of L = 0.5 m was decreased due to the deterioration of η1. Besides, the peaks of η1 appeared at λ/L = 6.3 and 4.4 in the cases of L = 0.7 m and 0.9 m, and the value was η1 = 0.63 in both cases.
Figure 10 is a comparison of the reflection coefficient kr (reflected wave amplitude/incident wave amplitude) in the three cases of L = 0.5 m, 0.7 m and 0.9 m. The values in the cases of L = 0.7 m and 0.9 m became low at λ/L = 6.3 and 4.4, respectively. In addition, in the case of L = 0.5 m, the kr at λ/L = 8.9, giving the maximum η1 which is high compared with the above values of L = 0.7 m and 0.9 m. This increase of kr causes the decrease of η1 in the case of L = 0.5 m as shown in Figure 9.

4.2. Effect of Setting Angle of the Guide Vane

The θ was varied from the base case of 30.0 degrees to 37.5 degrees and 22.5 degrees to investigate the effects of the setting angle θ of the guide vane on the primary and secondary conversion efficiencies.
Besides, the number of rotor blades was changed from 26 to 30 in order to suppress the rotor–guide vane interaction that causes the noise and the vibration based on the same number of rotor blades and guide vanes, but the effect is not clarified in this paper. In Figure 11, the efficiencies are compared between the three cases θ = 22.5 degrees, 30.0 degrees and 37.5 degrees. The chamber length L is 0.7 m. The ratio λ/L was kept constant at 6.3, corresponding to the wave period T = 1.87 s. As shown in Figure 11, the effect of the θ on the η1 is small at about N = 700 rpm giving the maximum η. Besides, the maximum value of η = 0.28 is obtained at θ = 30.0 degrees.
Figure 12 shows the amplitudes of the pressure and the water surface elevation in the air chamber. It seems that the pressure increases at smaller θ based on the drag increase. Meanwhile, the amplitude of the water surface elevation decreases inversely with the pressure increase.
Figure 13 shows the turbine performance. In Figure 13a, the maximum η2 of 0.48 was obtained at φ = 0.71 in the case of θ = 30.0 degrees. On the other hand, in both cases θ = 37.5 degrees and 22.5 degrees, the maximum η2 was decreased slightly. In addition, the flow coefficient giving the maximum η2 became small by the reduction of the θ from 30.0 degrees to 22.5 degrees. Furthermore, in the case of θ = 22.5 degrees, the CA increased markedly at around φ = 0.45, giving the maximum η2 compared to the other two cases as shown in Figure 13c. This fact corresponds to the pressure rise in Figure 12a. In the case of θ = 22.5 degrees, along with the pressure rise, the turbine output torque becomes higher at a small flow rate due to the increase of the whirl velocity of the flow from the upstream guide vane, as shown in Figure 13b. This is the reason why the peak of η2 appeared in the small flow rate in the case θ = 22.5 degrees.

5. Conclusions

This present paper shows the impulse turbine performance under a steady air flow condition, and the effects of the air chamber length L and the setting angle θ of the guide vane on the energy conversion efficiency of the fixed OWC-type wave energy converter under the oscillating air flow condition. The chamber length was changed between the three cases L = 0.5 m, 0.7 m and 0.9 m, and the setting angle of the guide vane was varied from θ = 30.0 degrees to 22.5 degrees and 37.5 degrees. In the experiments, the maximum efficiencies of the primary conversion and the secondary conversion were measured by changing the wave length and the rotational speed of the turbine. The following concluding remarks are obtained.
(1)
The reflected wave is suppressed by changing the chamber length from L = 0.5 m to 0.7 m, resulting in the achievement of the high primary conversion efficiency;
(2)
Almost the same high generating efficiency is achieved in the two cases of L = 0.7 m and 0.9 m because the reflection coefficient is equally low;
(3)
The effect of the setting angle θ of the guide vane on the primary conversion efficiency is small, within the range of θ = 22.5 degrees to 37.5 degrees;
(4)
The recommended setting angle of the guide vane is θ = 30 degrees in the case of the rotor inlet/outlet angle γ = 60 degrees.
The authors will confirm the successful electricity generation by replacing the AC synchronous motor with the generator, along with the improvement of the primary conversion efficiency, in the near future.

Acknowledgments

This investigation was carried out under the “Program for the Promotion of New Energy Infrastructure Development”, supported by the Mitsubishi Research Institute (MRI)/the Ministry of Economy, Trade and Industry (METI), Japan. It was also supported by a research grant of the Hatakeyama Culture Foundation.

Author Contributions

Yasutaka Imai, Shuichi Nagata, Manabu Takao and Toshiaki Setoguchi conceived and designed the experiments; Tengen Murakami performed the experiments and wrote the paper.

Conflicts of Interest

The authors declare no conflict of interest.

References

  1. Falcão, A.F.O. Wave Energy Utilization: A Review of the Technologies. Renew. Sustain. Energy Rev. 2010, 14, 899–918. [Google Scholar] [CrossRef]
  2. Lasa, J.; Antolin, J.C.; Angulo, C.; Estensoro, P.; Santos, M.; Ricci, P. Design, Construction and Testing of a Hydraulic Power Take-off for Wave Energy Converters. Energies 2012, 5, 2030–2052. [Google Scholar] [CrossRef] [Green Version]
  3. Mehrangiz, S.; Emami, Y.; Sadigh, S.H.S.; Etemadi, A. Various Technologies for Producing Energy from Wave: A Review. Int. J. Smart Grid Clean Energy 2013, 2, 289–294. [Google Scholar] [CrossRef]
  4. Cameron, L.; Doherty, R.; Henry, A.; Doherty, K.; Van’t Hoff, J.; Kaya, D.; Naylor, D.; Bourdier, S.; Whittaker, T. Design of the Next Generation of the Oyster Wave Energy Converter. In Proceedings of the 3rd International Conference on Ocean Energy, Bilbao, Spain, 6–8 October 2010; pp. 1–12.
  5. Vicinanza, D.; Margheritini, L.; Kofoed, J.P.; Buccino, M. The SSG Wave Energy Converter: Performance, Status and Recent Developments. Energies 2012, 5, 193–226. [Google Scholar] [CrossRef]
  6. Falcão, A.F.O.; Henriques, J.C.C. Oscillating-Water-Column Wave Energy Converters and Air Turbines: A Review. Renew. Energy 2016, 85, 1391–1424. [Google Scholar] [CrossRef]
  7. Henriques, J.C.C.; Gomes, R.P.F.; Gato, L.M.C.; Falcão, A.F.O.; Roble, E.; Ceballos, S. Testing and Control of a Power Take-off System for an Oscillating-water-column Wave Energy Converter. Renew. Energy 2016, 85, 714–724. [Google Scholar] [CrossRef]
  8. Ning, D.; Wang, R.; Zou, Q.; Teng, B. An Experimental Investigation of Hydrodynamics of a Fixed OWC Wave Energy Converter. Appl. Energy 2016, 168, 636–648. [Google Scholar] [CrossRef]
  9. Toyota, K.; Nagata, S.; Imai, Y.; Setoguchi, T. Effects of Hull Shape on Primary Conversion Characteristics of a Floating OWC “Backward Bent Duct Buoy”. J. Fluid Sci. Technol. 2008, 3, 458–465. [Google Scholar] [CrossRef]
  10. Nagata, S.; Toyota, K.; Imai, Y.; Setoguchi, T.; Mamum, M.A.H. Numerical Analysis on Primary Conversion Efficiency of Floating OWC-Type Wave Energy Converter. In Proceedings of the Twenty-First International Offshore and Polar Engineering Conference, Maui, HI, USA, 19–24 June 2011; pp. 578–585.
  11. Takahashi, S.; Ojima, R.; Suzumura, S. Air Power Pneumatic-Type Wave Power Extractors Due to Irregular Wave Actions—A Study on Development of Wave Power, 3rd Report. Port Harb. Res. Inst. 1985, 24, 3–41. [Google Scholar]
  12. Takahashi, S.; Nakada, H.; Ohneda, H.; Shikamori, M. Wave Power Conversion by a Prototype Wave Power Extracting Caisson in Sakata Port. Coast. Eng. 1992, 3440–3453. [Google Scholar] [CrossRef]
  13. Lin, C.C.; Dorrell, D.G.; Hsieh, M. A Small Segmented Oscillating Water Column Using a Savonius Rotor Turbine. In Proceedings of the IEEE International Conference on Sustainable Energy Technologies (ICSET), Singapore, 24–27 November 2008; pp. 508–513.
  14. Liu, Z.; Hyun, B.; Hong, K. Application of Numerical Wave Tank to OWC Air Chamber for Wave Energy Conversion. In Proceedings of the Eighteenth International Offshore and Polar Engineering Conference, Vancouver, BC, Canada, 6–11 July 2008; pp. 350–356.
  15. Korde, U.A. Development of a Reactive Control Apparatus for a Fixed Two-dimensional Oscillating Water Column Wave Energy Device. Ocean Eng. 1991, 18, 465–483. [Google Scholar] [CrossRef]
  16. Setoguchi, T.; Santhakumar, S.; Maeda, H.; Takao, M.; Kaneko, K. A Review of Impulse Turbines for Wave Energy Conversion. Renew. Energy 2001, 23, 261–292. [Google Scholar] [CrossRef]
  17. Setoguchi, T.; Takao, M. Current Status of Self Rectifying Air Turbines for Wave Energy Conversion. Energy Convers. Manag. 2006, 47, 2382–2396. [Google Scholar] [CrossRef]
  18. Takao, M.; Setoguchi, T. Air Turbines for Wave Energy Conversion. Int. J. Rotating Mach. 2012, 2012, 717398. [Google Scholar] [CrossRef]
  19. Goda, Y.; Suzuki, Y. Estimation of Incident and Reflected Waves in Random Wave Experiments. Coast. Eng. 1976, 828–845. [Google Scholar] [CrossRef]
  20. Koirala, P.; Nagata, S.; Imai, Y.; Murakami, T. A Numerical Study on Multi-chamber Oscillating Water Columns. J. Jpn. Soc. Civ. Eng. 2015, 3, 93–104. [Google Scholar] [CrossRef]
Figure 1. Arrangements of model turbine and wave height gauges in 2D wave tank.
Sustainability 08 00756 g001
Figure 2. Model OWC with impulse turbine.
Sustainability 08 00756 g002
Figure 3. Positions of pressure gauge and wave height gauges at top of air chamber.
Sustainability 08 00756 g003
Figure 4. Configuration of rotor and guide vane.
Sustainability 08 00756 g004
Figure 5. Turbine performances on steady air flow conditions. (a) Secondary conversion efficiency; (b) Torque coefficient; (c) Input coefficient.
Sustainability 08 00756 g005
Figure 6. Air chamber configuration.
Sustainability 08 00756 g006
Figure 7. Primary conversion, secondary conversion and generating efficiencies.
Sustainability 08 00756 g007
Figure 8. Comparison between steady air flow and oscillating air flow on turbine performance. (a) Secondary conversion efficiency; (b) Torque coefficient; (c) Input coefficient.
Sustainability 08 00756 g008
Figure 9. Change in efficiencies at time-averaged rotational speed N = 700 rpm.
Sustainability 08 00756 g009
Figure 10. Variation of reflection coefficient due to chamber length.
Sustainability 08 00756 g010
Figure 11. Effect of setting angle of guide vane on efficiencies.
Sustainability 08 00756 g011
Figure 12. Changes in amplitudes of pressure and water surface elevation. (a) Pressure amplitude; (b) Water surface elevation.
Sustainability 08 00756 g012
Figure 13. Variation of turbine performance due to setting angle of guide vane. (a) Secondary conversion efficiency; (b) Torque coefficient; (c) Input coefficient.
Sustainability 08 00756 g013

