
Scenarios of Carbon Emissions from the Power Sector in Guangdong Province

School of Electric Power, South China University of Technology, Guangzhou 510641, China
*
Author to whom correspondence should be addressed.
Sustainability 2016, 8(9), 863; https://doi.org/10.3390/su8090863
Submission received: 24 July 2016
/
Revised: 21 August 2016
/
Accepted: 25 August 2016
/
Published: 29 August 2016
(This article belongs to the Special Issue Sustainable Electric Power Systems Research)
Abstract
:The electricity power sector plays an important role in both CO2 emissions as well as the target contribution of non-fossil energy. Although the target for the reduction of CO2 emission intensity in Guangdong (GD) has not been released by the central government, GD has set a goal for increasing the share of non-fossil energy in total energy consumption to 25% in the provincial 13th Five-Year Plan. In this study, the CO2 emissions from the electric power sector and the corresponding share of non-fossil fuels in total energy consumption between 2005 and 2014 were analyzed. The logarithmic mean Divisia index (LMDI) technique was applied for investigating the factors affecting the changes in CO2 emissions. The main results are as follows: in 2014, the CO2 emissions from the electric power sector were 286.54 Mt, of which the net purchased electricity accounted for 22.4%. Economic growth is the main contributor for the increase in CO2 emissions from the electric power sector. Electricity intensity, thermal generation efficiency, CO2 emission coefficient, and electricity supply mix slowed the growth of CO2 emissions. Several energy scenarios were developed, and results showed that the provincial target for the share of non-fossil fuels by 2020 would be achieved by all of the scenarios.
1. Introduction
It is well known that China has officially pledged to reduce the national carbon intensity by 40%–45% of 2005 levels, as well as increase the share of non-fossils in primary energy consumption to 15% by 2020, in November 2009 [1]. This commitment has been incorporated as “binding goals” into the national economic and social development medium- and long-term plans. In November 2014, China released another goal of achieving the peak of CO2 emissions around 2030 and to make the best efforts to peak early, along with raising the share of non-fossils in primary energy consumption to about 20% by 2030 [2].
As a province with a large population, surging economy, and high energy consumption, Guangdong (GD) is supposed to take a leading responsibility towards the reduction of carbon emissions. During the 12th Five-Year Plan from 2011 to 2015, GD was required to decrease the CO2 emission intensity by 19.5% [3]. Although the target for the reduction of CO2 emission intensity in GD has not been released by the central government, GD has set a goal for increasing the share of non-fossil energy in total energy consumption to 25%, which is aimed to advance the national goal in 10 years [4]. Hence, it is important to analyze the feasibility of this goal.
Similar to the remaining provinces of China and several other countries, a significant percentage of CO2 emissions in GD have originated from the electric power sector. Moreover, most of the non-fossil fuel is used for power; hence, the electric power sector plays a decisive role in achieving the targeted contribution of non-fossil energy. Nowadays, more and more researchers have been focusing on the investigation of carbon emissions from electric power. Among various index methods used for investigating the driving forces of energy consumption and CO2 emission, the LMDI method has become the preferred way because it is easy to use, does not produce residual value, and has some other advantages [5]. To handle zero values in the LMDI decomposition approach, Ang and Liu presented eight strategies in the following study [6]. So far, the LMDI method was adopted by most of the studies to investigate the factors affecting the changes in CO2 emissions and CO2 emission factor of electricity consumption [7,8,9] as well as the aggregate carbon intensity (ACI) for electricity at the global and country levels [10]. Scenario analysis of emission reduction in the regional and global electricity sector has gradually become the research focus [11,12,13].
Thus far, to the best of our knowledge, most of the previous studies only investigated CO2 emissions of electric power from electricity generation. In some sub-nation areas, such as China and the US, cross-border electricity takes up a considerable share of power supply, and failure to account for it can lead to misunderstanding of emissions from the power sector [14,15]. Due to the lack of knowledge of Chinese sub-national level energy statistics, studies on Chinese provincial energy and carbon intensity have encountered several difficulties, with some of the studies significantly different from the data published by the government. In this study, a model for evaluating carbon emissions from the power sector based upon GD characteristics was established. In addition, the impact of different factors affecting emissions from GD’s power sector from 2005 to 2014 was also considered, with considerations of emissions from cross-border electricity. The LMDI method was applied to quantify the contributions of different factors, including economic growth, electricity intensity, thermal generation efficiency, CO2 emission coefficient, and electricity supply mix.
The current paper is organized as follows: Section 2 describes the decomposition methodology and the data sources in this study. Section 3 discusses the results of factor decomposition analysis and the related policies during the study period; Section 4 predicts the CO2 emissions and non-fossil fuel share in 2020; and Section 5 summarizes the key findings of the present study and major policy recommendations.
2. Methods
Although several studies have involved GD, only that by Andrews-Speed [16] has provided a detailed overview of the electric power in GD. Nevertheless, the majority of data was reported before 2005. Since then, the electric power industry has experienced both quantitative and qualitative growth in GD. By the end of 2015, the installed power capacity, such as coal-fired power, natural gas power, nuclear power, pumped storage and hydroelectric, as well as other renewables (such as wind power and solar power), was 98.8 GW in GD. Meanwhile, the reception capacity of west-to-east electricity of GD increased to 35.4 GW in 2015. With electricity sold to Hong Kong and Macau, it is quite complex and difficult to account for the CO2 emissions of GD’s electric power sector.
2.1. Gross CO2 Emissions from Electricity Consumption
The different methodology used to calculate the CO2 emissions of cross-boundary electricity might lead to different policy decisions on emissions reduction. With increasing inter-provincial trade of electricity, this issue has become prevalent in China. Following the 2006 Intergovernmental Panel on Climate Change (IPCC) Guidelines for National Greenhouse Gas Inventories, the National Development and Reform Commission (NDRC) of China has issued the Provincial Guidelines for the Preparation of Greenhouse Gas Inventories (for trial implementation) in May 2011. Under these guidelines, the gross carbon emissions from electric power consumption can be estimated using Equation (1):
where C represents the gross CO2 emissions of electric power sector (t), subscripts G and P represent electricity generated in the province and net purchased electricity, respectively; subscript m represents the fuel type; Em denotes energy consumption based upon the fuel type m (TJ); Fm is the carbon emission factor of the mth fuel (tC/TJ); Om is the fraction of the carbon oxidized based upon the fuel type i; and M is the molecular weight ratio of carbon dioxide to carbon (44/12). Qp represents the net purchased electricity of GD (GWh); and CIp represents the average CO2 emission factor of the southern power grid (kg CO2/MWh), which corresponds to the regional power grid supplying electricity to GD [17].
2.2. Share of Non-Fossil Fuels in Total Energy Consumption
The electricity supply of GD can be categorized into three types: thermal power, non-fossil fuel power, and net purchased electricity. As almost all of the fuel for thermal power is fossil-based, while non-fossil energy is used as power, the share of non-fossil fuels in total energy consumption in GD is equal to the sum of the non-fossil power and net purchased electricity contribution to regional energy consumption. Various methods are available for assessing the energy content of nuclear energy, hydropower, and wind power [18,19]. This study chooses the method adopted for calculating the provincial energy consumption and energy intensity in China. Primary electricity from hydro, nuclear, wind, solar, and net purchased electricity was compared with typical conventional energy sources. Primary electricity is valued in terms of the fuel input required by the conventional thermal power production. The provincial average thermal power efficiency changes annually, which also makes its precise calculation difficult.
where λ represents the share of non-fossil fuel in the total energy consumption in GD and the subscripts T, N, and P represent thermal power generation, non-thermal power generation, and net purchased electricity, respectively. S represents the proportion of total electricity supply. E represents the province’s total energy consumption (tons of coal equivalent, tce). bT represents the gross coal consumption rate of thermal power generation (gce/kWh).
2.3. Decomposition of CO2 Emissions
Gross carbon emissions from electric power consumption can be expressed by Equation (3):
where A represents the gross domestic product (GDP) (Yuan, at a constant price of 2005) and I represents the electricity intensity which is defined as the ratio of total electricity consumption (GWh) to total GDP (GWh/Yuan). Subscript i represent the type of electricity supply, while T, N, and P represent thermal power generation, non-thermal power generation, and net purchased electricity, respectively. fi represents the CO2 emission coefficient of the ith electricity supply (tCO2/tce), fN is zero, while fT and fP can be calculated using Equations (4) and (5) respectively:
LMDI can be used to decompose the change in CO2 emissions between year t and a base year 0 into five driving factors (as given below):
where ΔC refers to the changes in CO2 emissions of the electric power sector of GD. ΔCA represents the change in CO2 emissions, which are attributed to the economic performance. ΔCI represents the change in CO2 emissions, which are attributed to the electricity intensity factor. ΔCb represents the change in CO2 emissions, which are attributed to the thermal power efficiency. ΔCf represents the change in CO2 emissions attributed to changes in the coefficient of ith electricity supply, while ΔCs represents the change in CO2 emissions attributed to the electricity supply mix.
2.4. Data Sources
The time-series GDP of GD is obtained from the GD Statistical Yearbook [20]. The time-series data used in the quantification of historical trends of CO2 emissions originate from the Energy Balance Table By Region in the China Energy Statistical Yearbook [21], and corresponds to the provincial balancing of energy supply and consumption, which includes data on electricity production from thermal power, non-thermal power production, and inter-provincial electricity trade movements, as well as the fuels used for thermal power generation.
The power grid of mainland China is divided into six regional power grids and one provincial power grid, whereas the GD province belongs to the south regional power grids [22]. The average CO2 emission factors of the south regional power grids are obtained from the documents issued by NDRC [23,24], which provides the average CO2 emission factors of the southern power grids from 2010, 2011, and 2012. In the present study, the data used for the remaining years were calculated by the method provided in the documents. The data resulting from the power exchanges of inter-regional power grids are obtained from the China Electric Power Yearbook [25].
3. Results and Discussion
3.1. Evolution of CO2 Emissions
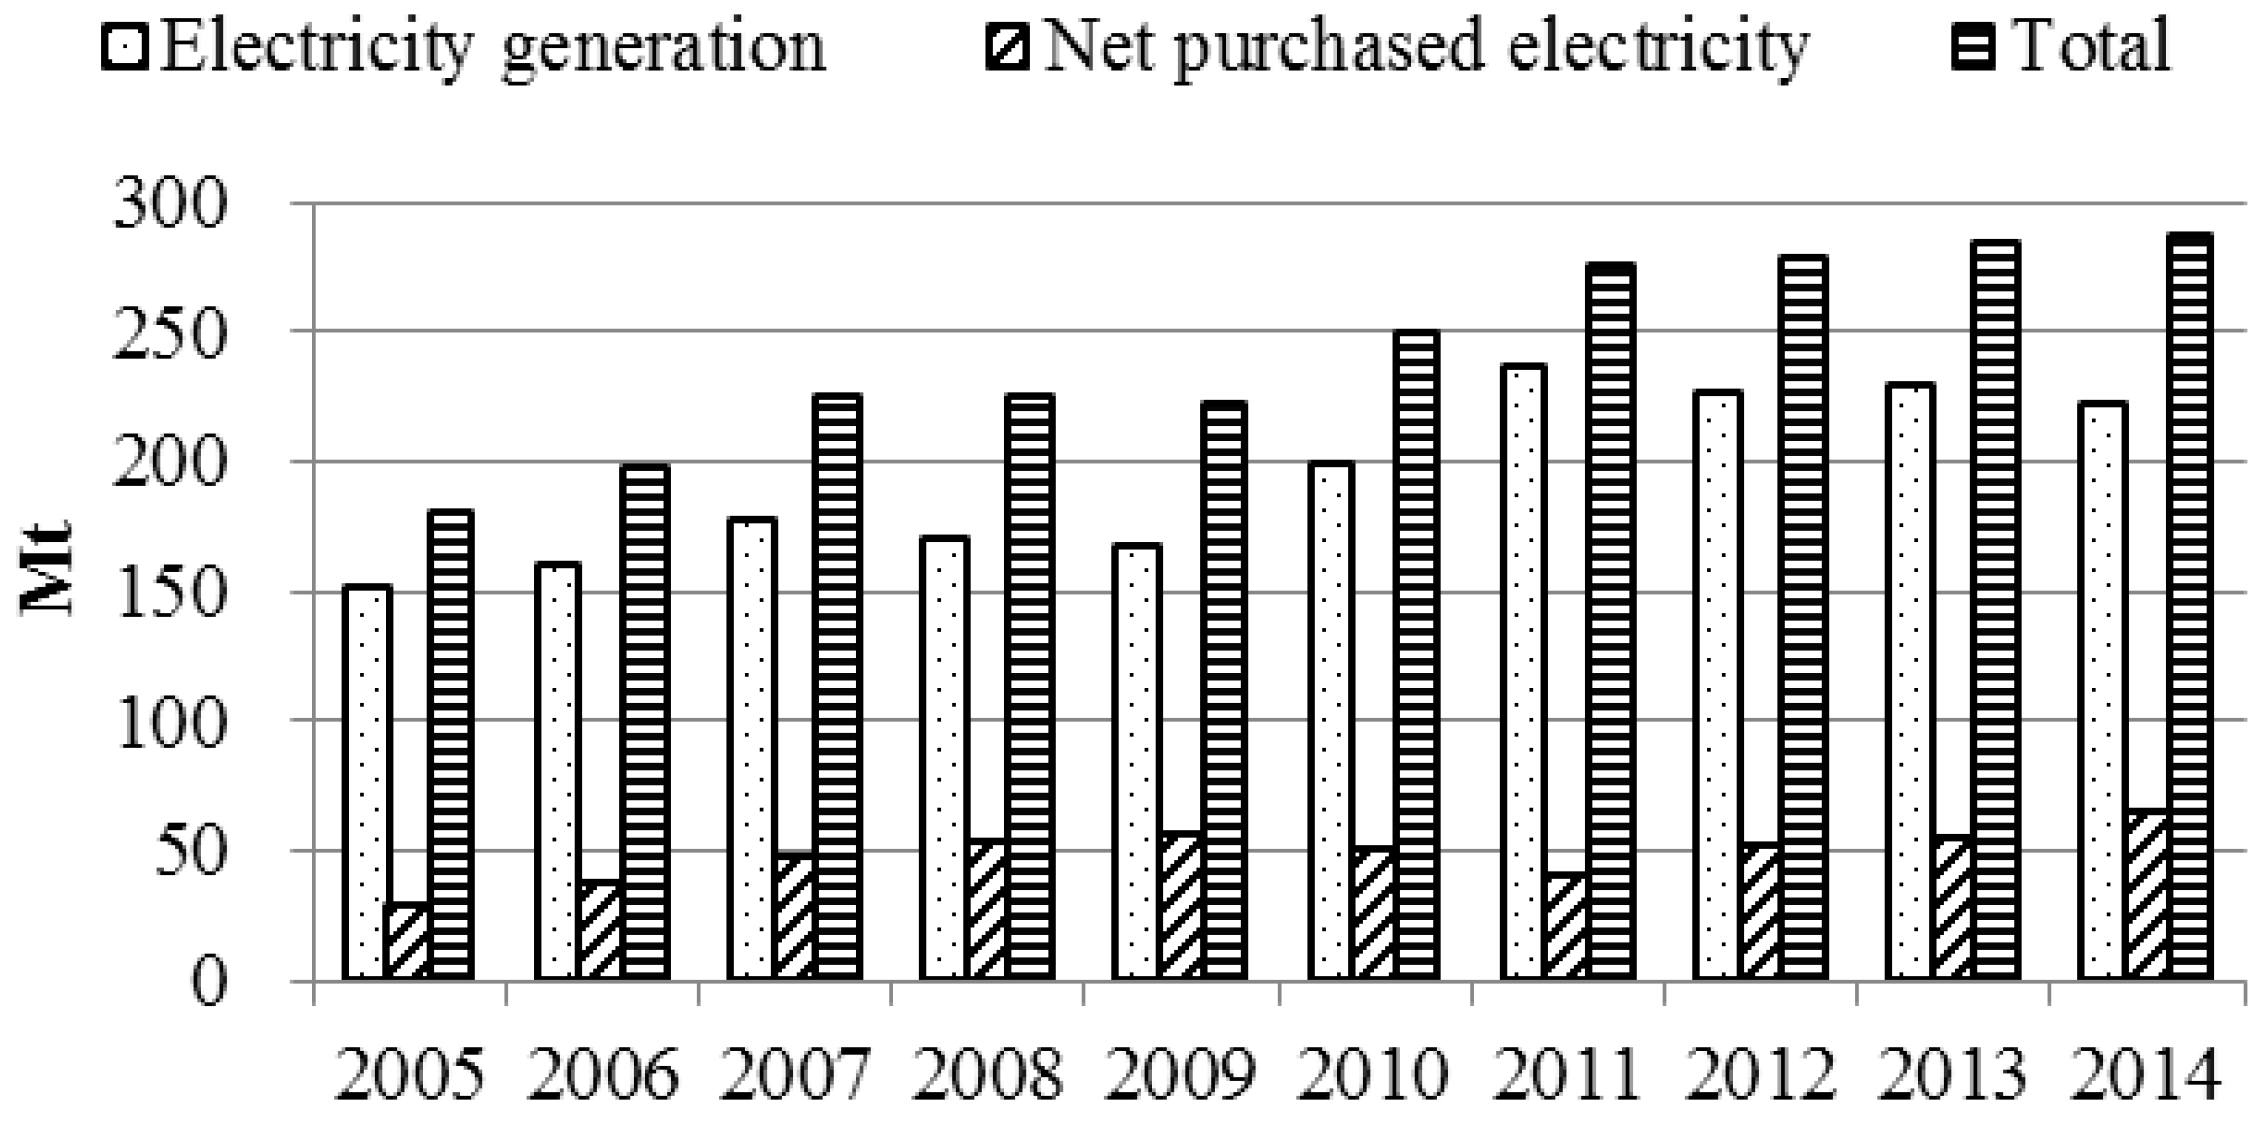
CO2 emissions resulting from the electricity consumption of GD province increased from 180.3 Mt in 2005 to 286.6 Mt in 2014, with an annual growth rate of 5.3%. As shown in Figure 1, the CO2 emissions’ growth rate widely fluctuated between 2005 and 2014. CO2 emissions increased by 9.3%, 13.9%, 12.3%, and 10.5% in 2006, 2007, 2010, and 2011, respectively, while the growth rates were only 0.6%, 2.3%, and 0.9% in 2012, 2013, and 2014, respectively. CO2 emissions decreased to 0.9% in 2009 and almost leveled those in 2008.
CO2 emissions resulting from electricity generation in the province accounted for 77.6% of the gross CO2 emissions from the electric power sector in 2014, which decreased to 6.8% compared to those from 2005. On the other hand, the net purchased share of electricity increased from 15.6% to 22.4% in the same period.
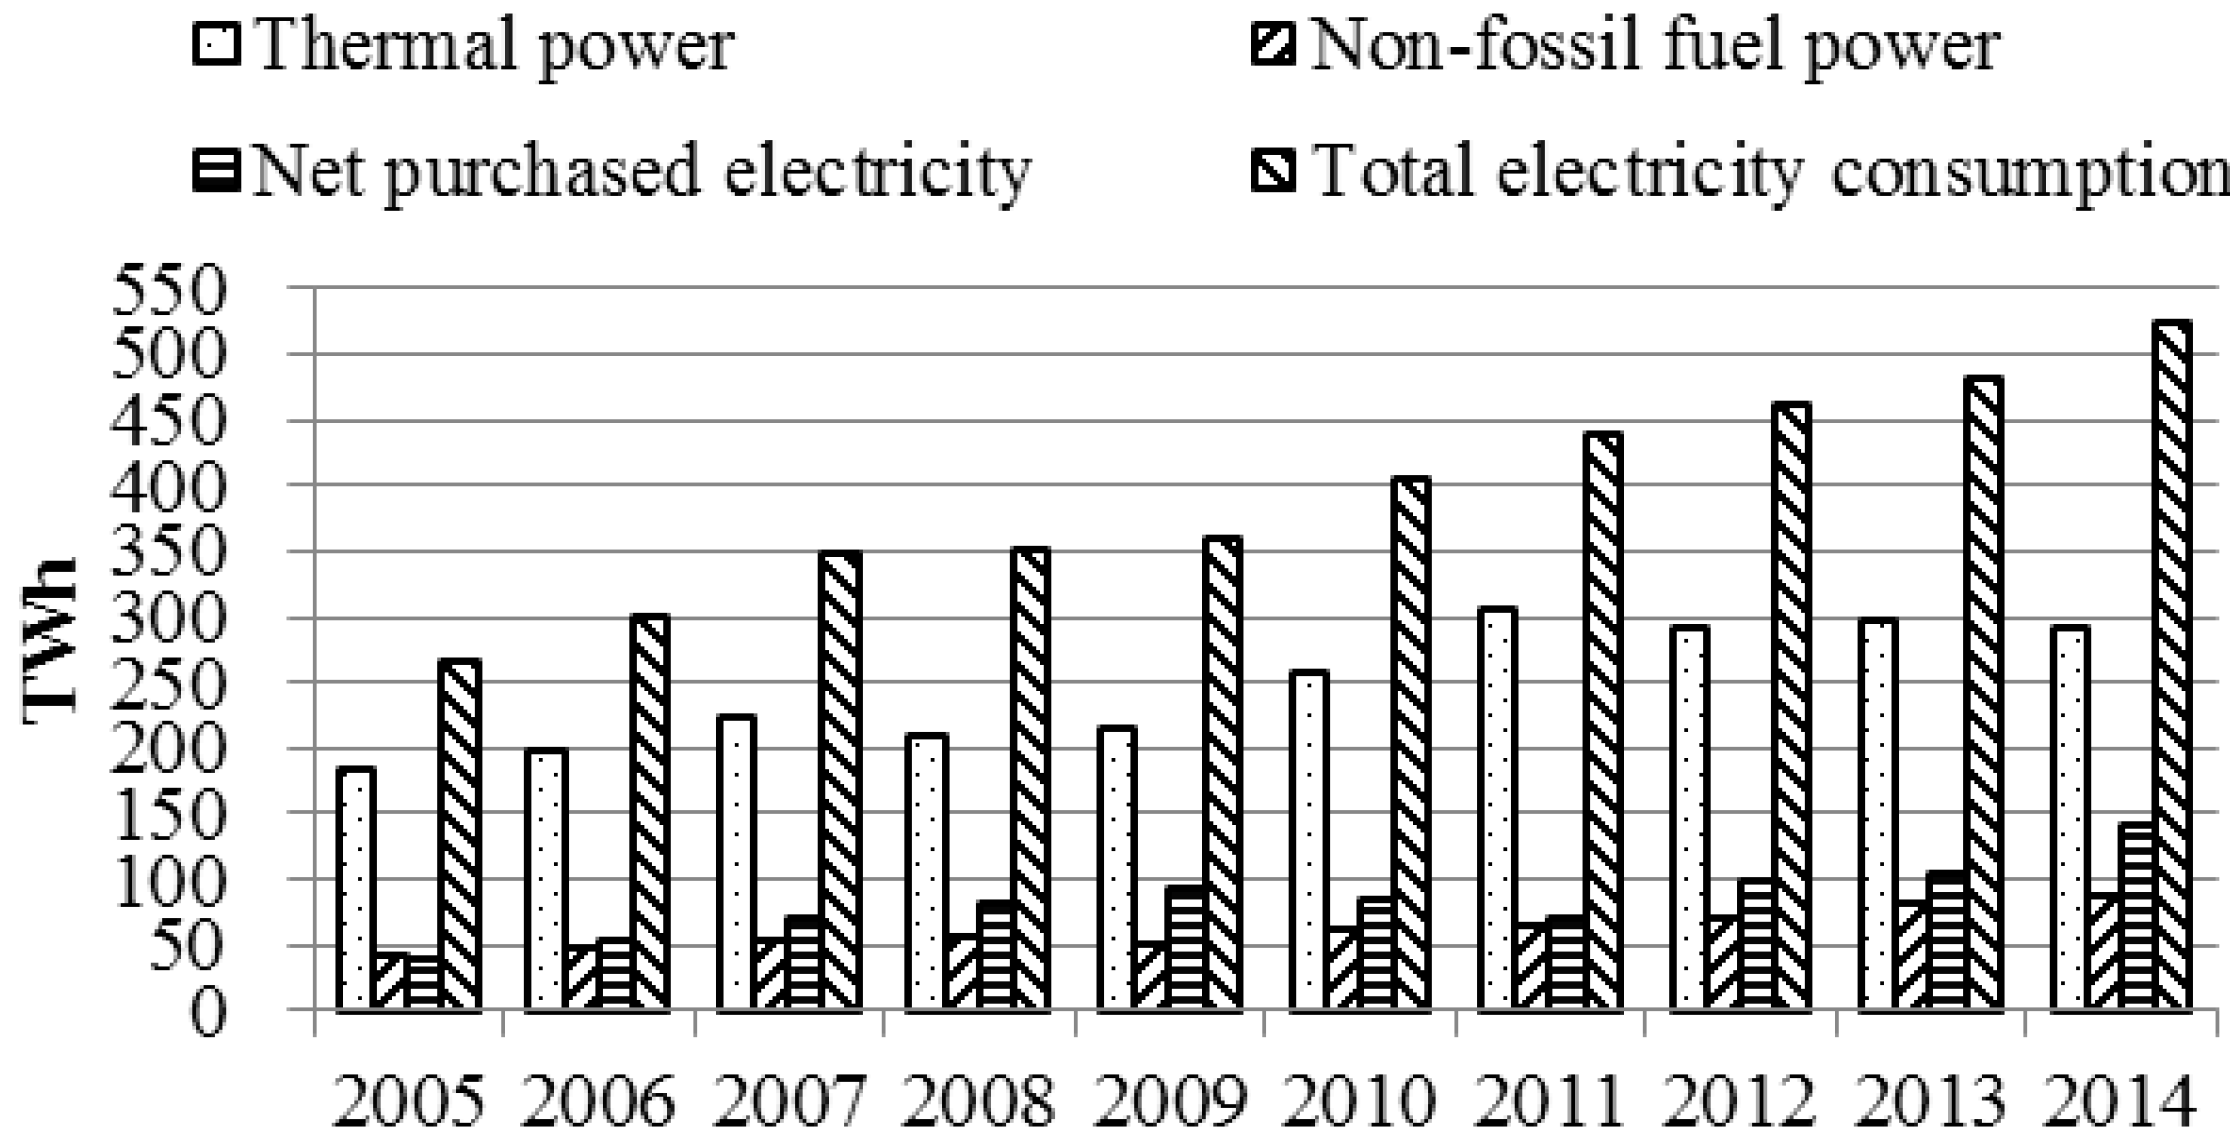
Figure 2 shows the supply mix of electricity consumed in GD between 2005 and 2014. The net purchased electricity was 142.9 TWh in 2014, which increased by 261% from 2005. In 2014, the non-fossil fuel power generation was 87.35 TWh, which has almost doubled in the past nine years. The fossil fuel power generation only increased by 59% during the past nine years, reaching 293.28 TWh in 2014. Currently, the west-to-east electricity is sold according to the on-grid benchmark power tariffs for coal-fired power plants, and the rapid increase in the net purchased electricity leads to a decrease in utilization hours of local coal-fired power, which decreases the tax revenue in GD, resulting in disputes about whether to significantly increase the west-to-east electricity between 2016 and 2020. Net purchased electricity plays an important role in the electricity supply of GD and a failure to account for its emissions might lead to erroneous results and wrong decisions [26].
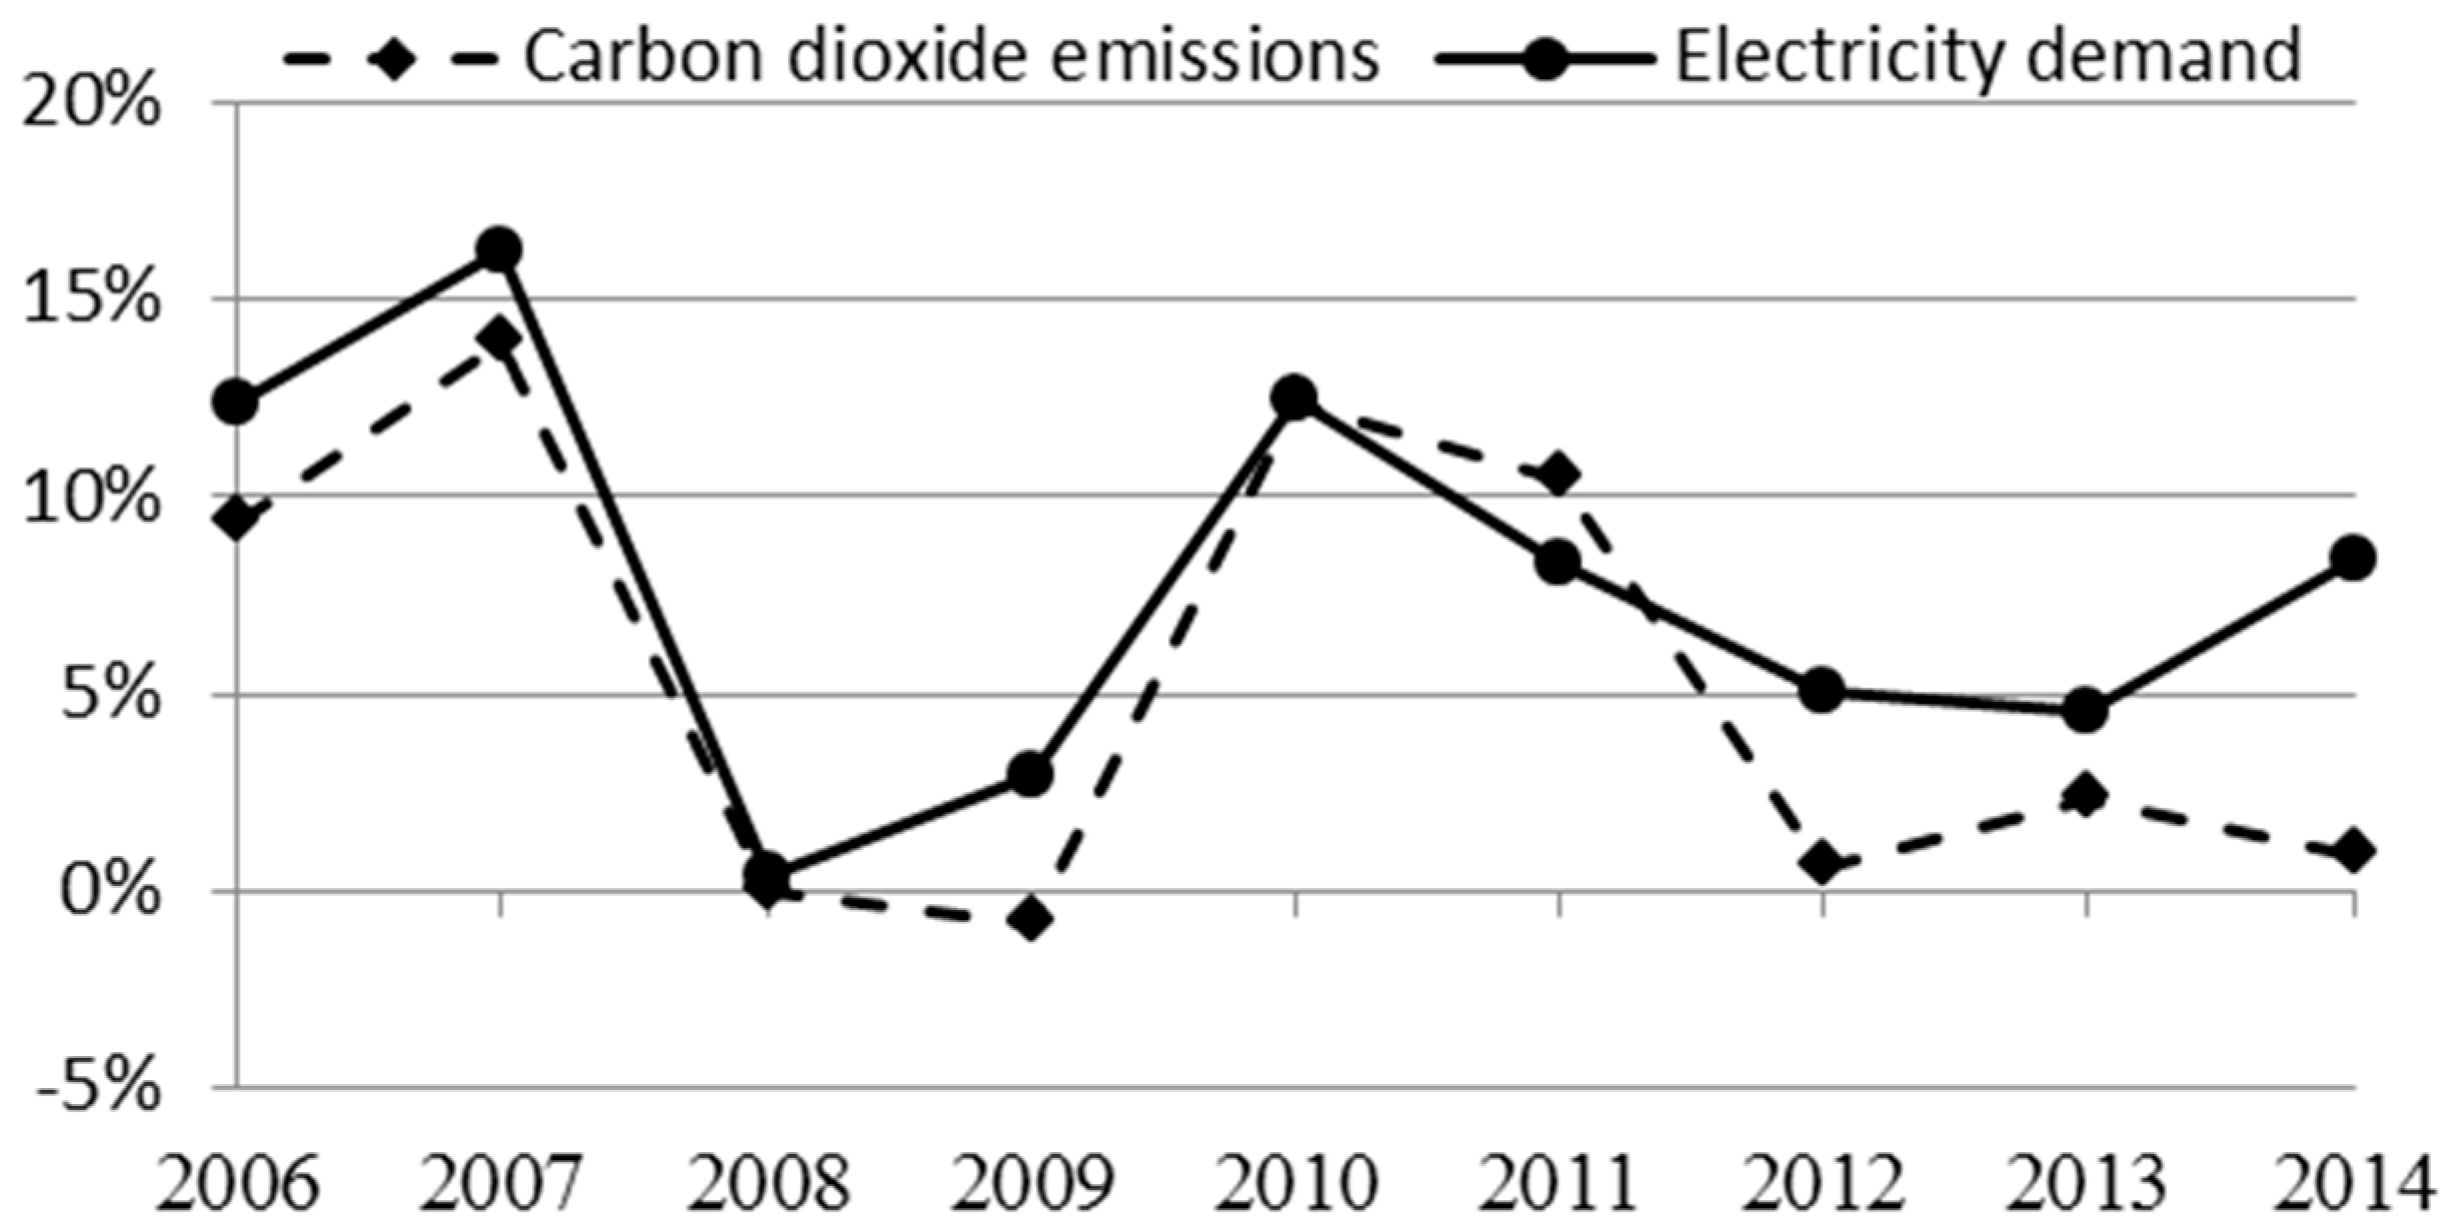
As shown in Figure 3, a very close relationship and a relatively consistent trend between the rate of change of CO2 emissions and electricity demand were observed between 2006 and 2014. However, despite the decrease of electricity demand growth rate, the rate of CO2 emissions increased in 2013. On the other hand, a reverse situation occurred in 2014, and the distinction was more notable. Overall, the growth rate of CO2 emissions was less than the electricity demand during the study period, revealing a reduction in the CO2 intensity of electricity consumed in GD.
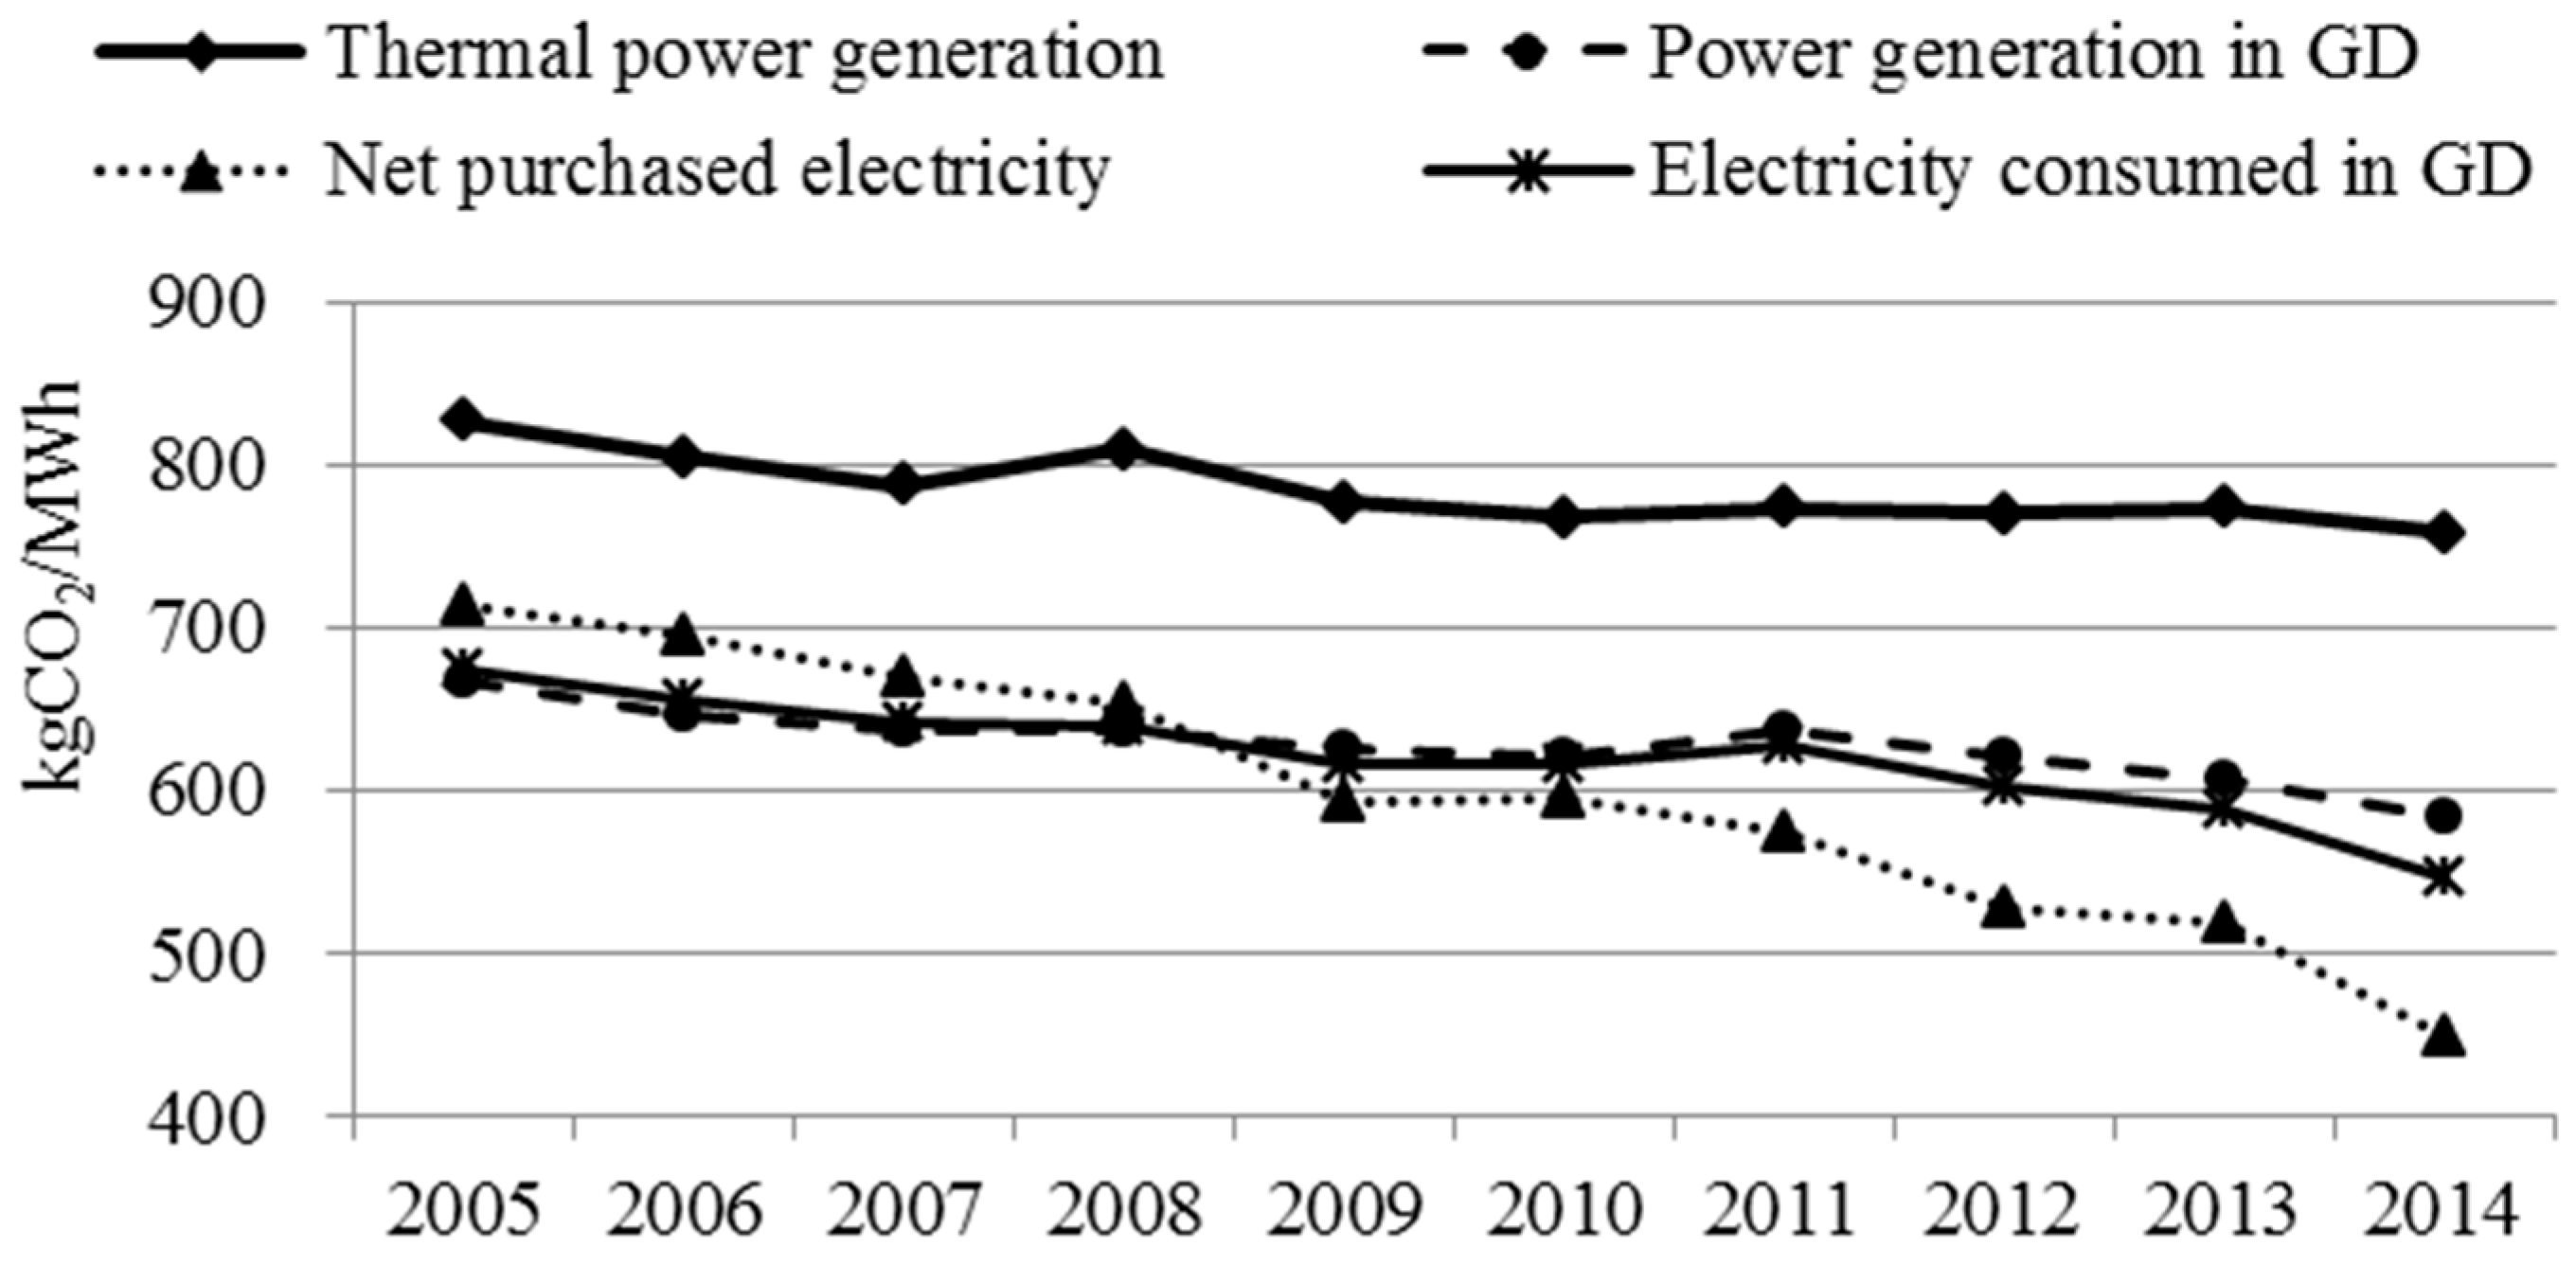
Figure 4 shows the CO2 emission intensity of the electricity supply of GD. The CO2 emission intensity of thermal power generation was 758.1 kg/MWh in 2014, which decreased by 8.3% compared to 2005. The CO2 emission intensity of net purchased electricity was only 449.3 kg/MWh in 2014, which has decreased by 37.1% in the past nine years. Before 2009, the CO2 emission intensity of net purchased electricity was greater than the electricity generated in GD, while the additional share of the net purchased electricity did not result in the abatement of CO2 emission intensity of electricity supply in GD. Since 2009, the CO2 emission intensity of net purchased electricity has declined more rapidly compared to the electricity generated in GD, which accelerated the reduction in CO2 emission intensity of electricity supply in GD.
3.2. Share of Non-Fossil Fuel Energy to the Total Energy Consumption
Table 1 summarizes the results and related data for calculating the share of non-fossil fuels in total energy consumption.
In 2014, the total energy consumption in GD was 295.93 million tons of coal equivalent (Mtce), including 71.55 Mtce non-fossil fuel power and net purchased power, which accounted for 24.2% of the total energy consumption [27]. As shown in Table 1, the share of non-fossil fuel in the total energy consumption is 15.8%, corresponding to an additional 8.4% in 2014.
3.3. LMDI Decomposition Results
The GDP of GD increased from 2255.7 billion Yuan in 2005 to 5636.25 billion Yuan (calculated at constant prices in 2005) in 2014, with an annual average growth rate of 10.7%. As can be observed from Table 2, the economy always contributed to the increase in CO2 emissions during the study period. The accumulated effect resulted to nearly 216.7 Mt of CO2 emissions in total emissions, which accounted for 204% of the total change in the absolute value.
As one of the results of efforts on energy efficiency made by the GD government, electricity intensity experienced a 21.6% decrease between 2005 and 2014. Nevertheless, electricity intensity still increased in some years, such as in 2007, 2010, and 2014, while the energy intensity of GD experienced a steady decline during the study period. The impact of decreasing electricity intensity on the reduction of total CO2 emissions reached 57.87 Mt, accounting for 54% of the reduction of total CO2 emissions over the whole periods of 2005 and 2014. Notably, the growth of electricity intensity in 2007 and 2010 was accompanied with high economic growth rate, boosted by the strong expansion of energy-intensive industries. On the other hand, the electricity intensity increase in 2014 occurred with a low economic growth.
The gross coal consumption rate of thermal power generation declined from 339.2 gce/kWh in 2005 to 310.8 gce/kWh in 2014. Improvements of thermal power efficiency reduced the CO2 emissions in most of the years except in 2008. The impact of the improved gross coal consumption rate of thermal power generation led to the reduction of CO2 emissions by 19.97 Mt, accounting for 19% of the reduction in the total CO2 emissions over the whole periods of 2005 and 2014. The efficiency improvement of thermal power is attributed to a combination of factors, such as the substitution of small-sized inefficient plants with new high-profile high-efficiency generation plants, as well as innovation with efficient technologies. Currently, the 1000 and 600 MW capacities per power facility accounted for 59.8% of the coal-fired installed capacity, while none of them were in operation in 2005. Another factor leading to the thermal efficiency improvement is the use of combined cycle gas turbine (CCGT) plants. In 2014, the capacity of the installed CCGT was 14,266 MW, whereas the 13,450 MW oil-fired power plants in 2005 were completely shut down in 2014.
Although the emission coefficient effect decreased the CO2 emissions only in 2007, 2009, 2012, and 2014, its effect in absolute value was relatively high (as can be observed in Table 3). The accumulated effect resulted in the decrease of nearly 18.49 Mt of CO2 emissions, accounting for 18% of the total change in the absolute value. Despite slight fluctuation in the CO2 emission coefficient of thermal power fuel during the study period, the CO2 emission coefficient of net purchased electricity sharply decreased from 2.1 tCO2/tce in 2005 to 1.45 tCO2/tce in 2014, mainly due to the increased share of non-fossil fuel electricity of the south power grid (such as large capacity hydropower and nuclear power put into operation).
With the decreased share of thermal power electricity, the supply mix effect played a positive role in the reduction of CO2 emissions. The growth rate of CO2 emissions of net purchased electricity was significantly greater than those of thermal power and non-fossil fuel power during the same period. Figure 3 shows the electricity supply structure of GD. With the rapid growth of electricity demand as well as the dry weather (abatement in hydropower generation), the share of generated thermal power increased in 2010 and 2011, simultaneously increasing the CO2 emissions. The CO2 emission intensity from the generated thermal power was greater than that from net purchased electricity, while the non-fossil electricity was constant at zero. Overall, the effect of electricity supply structure accumulated (period-wise) a decrease of 11.24 Mt, accounting for 10.6% of the change in total CO2 emissions in the absolute value. The electricity supply mix did not always result in the reduction of CO2 emissions during the study period, implying that the net purchased electricity also did not reduce the CO2 emissions as presumed.
4. 2020 Scenario Analysis
4.1. Data Sources
For the scenario settings, basic data were collected from the following sources:
(1). Planning data with respect to the installed capacity of electric power in GD were mainly obtained from the “Provincial Energy Development Planning for the 13th Five-Year Plan” [28].
(2). Data related to energy consumption and efficiency of thermal power generation were obtained from “Study on 13th Five-Year Plan of Energy Conservation and Emission Reduction in GD” [29].
(3). In 2020, the values for CO2 emissions per unit electricity produced in the south region’s power grids were obtained from “Development Planning of South Power Grid (2013–2020)” [30]. In 2020, it is expected that electricity demand of the five south provinces will account for 1.363 trillion kWh, while the ratio of the installed non-fossil fuel would reach 51.6%. On the other hand, the planned non-fossil electricity generating will account for 50% of the electricity generated in the five southern provinces, and the average emission factors of the southern power grids will reach 4.22 tCO2/kWh in 2020.
4.2. GDP and Total Energy Consumption of GD
In 2015, the GDP of GD was 7.28 trillion Yuan. GD has set a target of annual average GDP growth rate at 7% in the provincial 13th Five-Year Plan for Economic and Social Development, implying that the government will take every effort to achieve and exceed this goal. Hence, the annual average GDP growth rate is estimated to be between 7% and 8%.
In 2015, the total energy consumption was 301.45 Mtce. A 17% reduction in energy intensity has been set to be the likely energy saving target by the central government from 2015 to 2020. Hence, in 2020, the total energy consumption will be 350.93 Mtce, 359.21 Mtce, and 367.64 Mtce at average annual GDP growth rates of 7%, 7.5%, and 8%, respectively.
4.3. Policies to Promote Energy Efficiency and Non-Fossil Power Generation
In the past 10 years, China has adopted a range of major policy measures to mitigate and adapt to climate change, and has achieved remarkable results. For example, the energy saving power dispatch (ESPD) operation was introduced in five provinces, including GD in 2007, and has been implemented ever since. According to China’s Renewable Energy Law, a systemic incentive policies were put into force to promote renewable energy power generation (REPG), such as tax reduction and financial subsidy, feed-in tariff, full guaranteed purchase of REP, providing financial support for research and development projects and institutions; and reinforcing market regulation and market-making planning [31]. In 2015, China launched a new round of power sector reforms by issuing State Council Document #9, which puts much more emphasis on energy efficiency and environmental concerns. This was followed by a newly mandated measurement of full guaranteed purchase of REPG in March 2016. Carbon emission trading in GD also helps the REPG and nuclear power become more competitive. It can be anticipated that the investment in REPG and nuclear power will accelerate with the implementation of national carbon emission trading system, as well as more incentive policies on energy saving and carbon emission.
4.4. Electricity Demand and Supply
The electricity demand is driven by several factors, such as socio-economic situation and energy-saving efforts. In this study, it is assumed that the demand scenarios are 4.5% in the first scenario, 5% in the second scenario, 5.5% in the third scenario, and 6% in the fourth scenario.
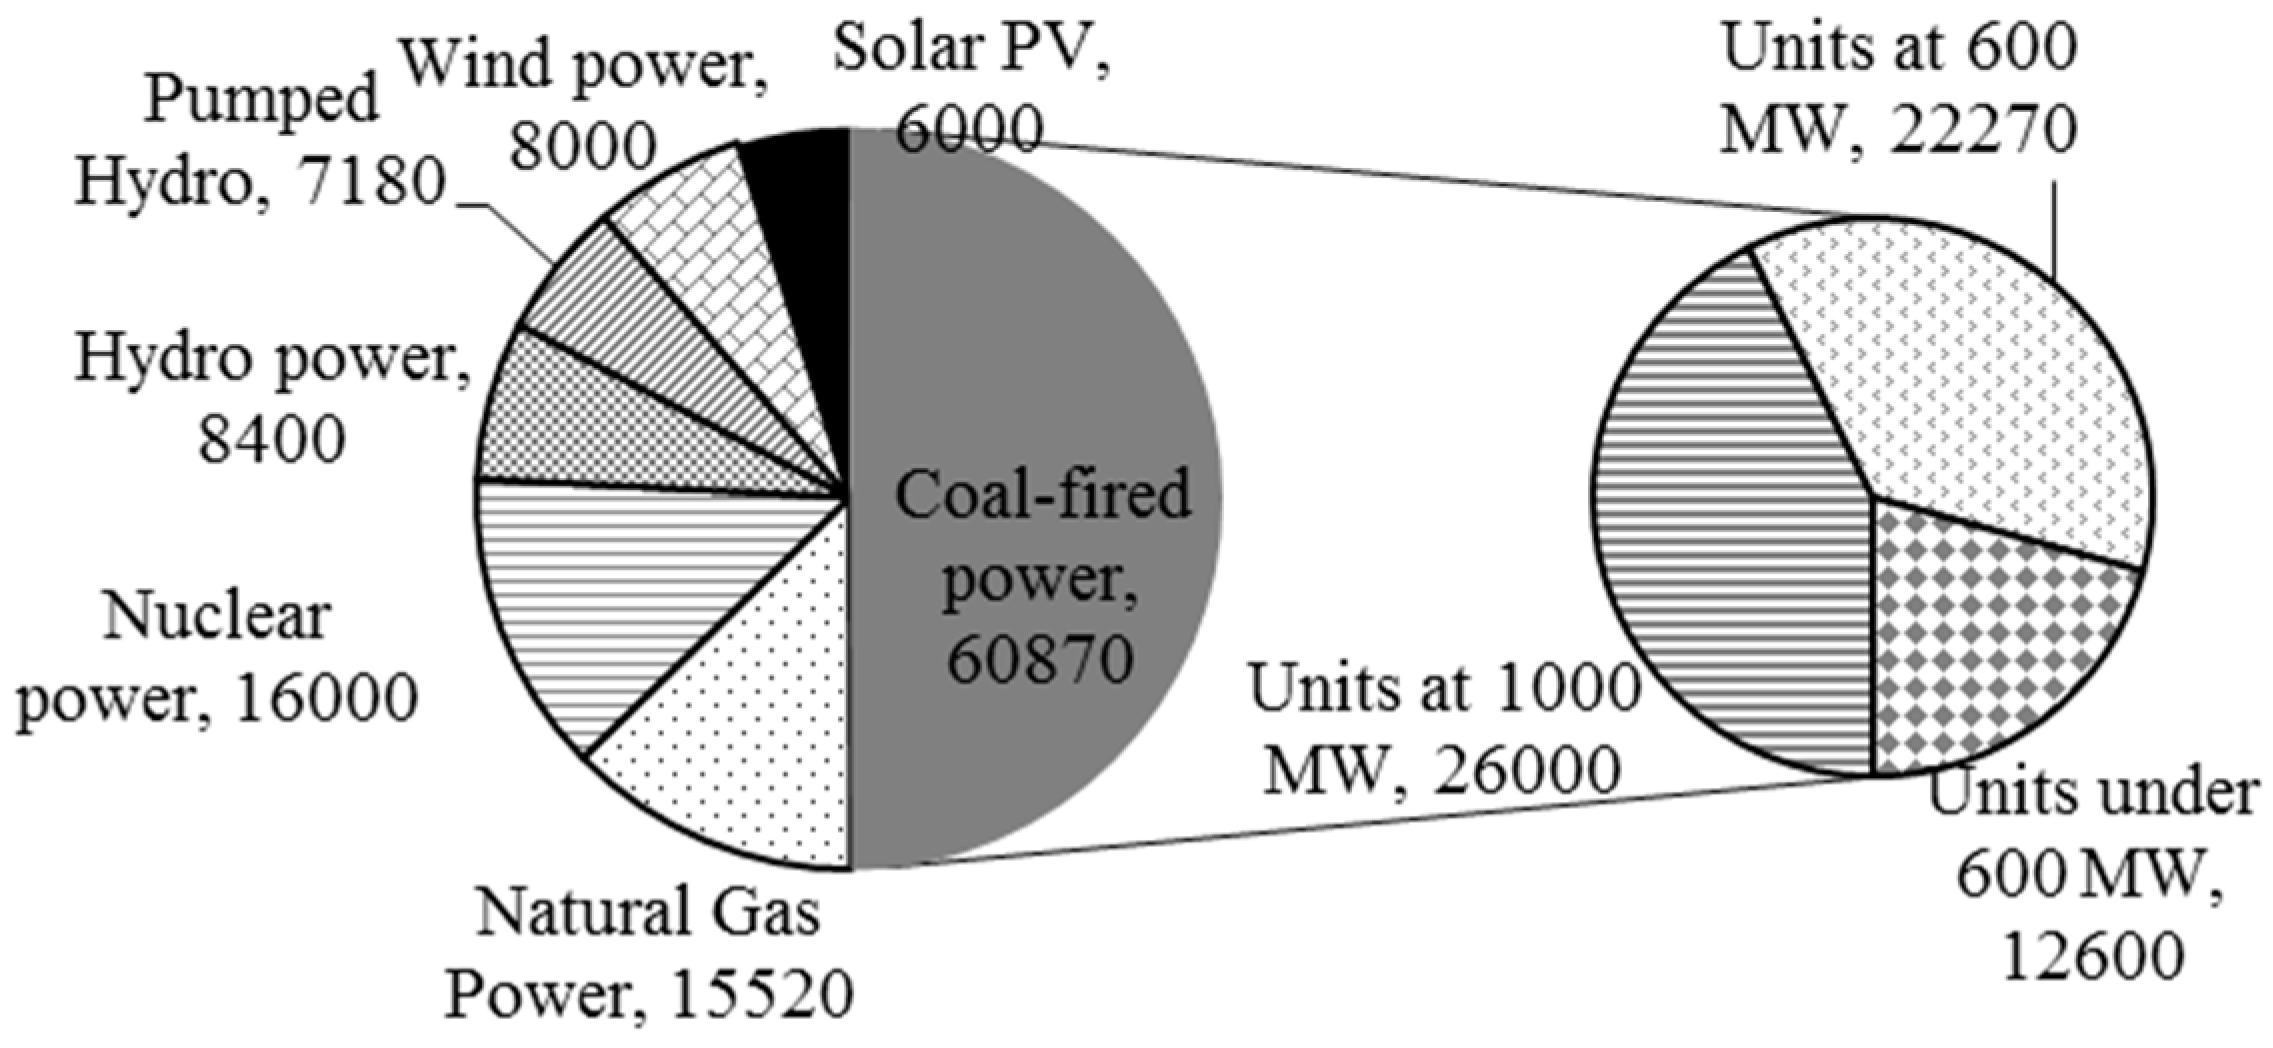
The installed power capacities in GD are scheduled to reach 132 GW in 2020. The detailed installed capacity is shown in Figure 5.
The maximum receptive capacity of west-to-east electricity will reach 40 GW. According to the electricity trade agreement between the GD, Yunnan, and Guizhou provinces, the net purchased electricity of GD will approximately be 160 TWh by 2020, which is almost 12% more than the corresponding value in 2014.
The actual electricity production significantly varies depending upon the resource, type of generation technology, and purpose of use. In this study, the annual utilization hours of hydropower are assumed to be 3200 h, while the actual number varied from 2049 h to 3376 h between 2005 and 2014. The annual utilization hours of nuclear power are uniformly set at a value of 7800 h. The annual utilization hours of wind energy are assumed to be 2500 h by 2020 [32]. The average annual utilization hours of solar PV are assumed to be 1300 h [33]. Since the gas-based power plants always serve as the peak-load shaving in GD, their annual utilization hours are set to be 2800 h. The pumped storage hydropower was used to meet the peak load, with annual utilization hours set at 520 h, equal to the baseline in 2014. Based upon above scenarios, the electricity supply from disregarded coal-fired power in GD will reach 194.19 TWh by the end of 2020. Coal-fired power generation is supposed to fill the gap between the demand and the remaining supply; thus, the annual utilization hours will vary with electricity demand. ESPD will be well implemented during 2015 and 2020. In this study, it has been assumed that the annual utilization hours of 1000 MW and 600 MW facilities are 50 and 20 h, respectively, which are greater than the annual average utilization hours of a coal-fired plant.
4.5. Thermal Power Generation Efficiency
According to the Action Plan for the Transformation and Upgrading of Coal Power Energy Conservation and Emission Reduction (2014–2020) [34], the average net coal consumption rate of newly built coal-fired generating units nationwide will be less than 300 g of standard coal per kilowatt hour (“g/kwh”). Additionally, by 2020, the average net coal consumption rate of coal-fired generating units in service, upon upgrading, will be less than 310 g/kwh, of which the average net coal consumption rate of units in service at greater than or equal to 0.6 million kilowatts (except for air cooling units) will be less than 300 g/kwh [35]. The average net coal consumption rate of units in service at 1000 MW, 600 MW levels and remaining are estimated to be 285 gce/kWh, 295 gce/kWh, and 305 gce/kWh, respectively. The average net coal consumption rate of gas-fired power generation will be 240 gce/kWh. In this study, the efficiency is not affected by the annual utilization hours. Thus, the thermal power generation efficiency changes with electricity demand is shown in Table 4.
Under each scenario, the natural gas stabilizes, while the coal increases with the electricity demand, which will increase the gross coal consumption rate and emission coefficient of thermal power generation.
4.6. Carbon Emission Scenarios
Following the scenarios set above, Table 5 summarizes the variation of CO2 emissions with the annual growth rate of electricity demand.
The CO2 emissions from the electric power sector would be 284.96 Mt by 2020, with an annual electricity demand growth rate of 4.5%, which is 0.6% less than that in 2014. Under this scenario, or a lesser electricity demand scenario, the CO2 emissions from the electric power sector in GD might reach their peak in 2014. The installed coal-fired power capacity was 57,524 MW by the end of 2015, and the annual average utilization hours of coal-fired power generation decreased from 4739 h in 2014 to 4250 h in 2015. Under this scenario, the installed coal-fired power capacity in 2015 will be in excess of the demand until 2020. The planned expansion of coal-fired generation indicates a serious overcapacity problem and poses a significant financial risk to GD’s electricity industry.
In scenario 2, the CO2 emissions in 2020 would be 296.91 Mt with an increase of 3.6% as compared to the corresponding value in 2014. Under this scenario, the proportion of CO2 emissions from net purchased electricity would be 23.2%, which shows an increase of 0.8% compared to the corresponding value in 2014. The installed coal-fired power capacity by the end of 2015 is adequate to meet demand by 2020.
In scenario 3, the CO2 emissions in 2020 would be 309.12 Mt with an increase of 7.9% as compared to that in 2014. Under this scenario, the proportion of CO2 emissions from net purchased electricity would be 22.3%, a corresponding decrease of around 0.1% compared to the value in 2014. By the end of 2015, the installed coal-fired power capacity is adequate to meet the demand by 2020. No new coal-fired power plant is needed under this scenario.
In scenario 4, the CO2 emissions would be 321.57 Mt in 2020, with a 12.2% increase compared to that in 2014. Under this scenario, the installed coal-fired power capacity by the end of 2015 is adequate to meet the demand, with annual average utilization hours of 5287 h. With the planned coal-fired generation, the value for annual average utilization hours would be 4996 h, which is far from the optimum hours of coal-fired power plants. Nevertheless, the proportion of CO2 emissions from net purchased electricity was 21.4%, which shows a decrease of 1% compared to that in 2014.
This result indicates that an increase in the share of thermal power in electricity supply contributes to the growth of CO2 emissions. With the limited supply of non-fossil power, the CO2 emissions peak would arrive sooner provided the growth rate of electricity demand is slower. The planned coal-fired power plants will be excessive with an annual electricity demand growth rate of no greater than 6% between 2015 and 2020.
4.7. Contribution of the Non-Fossil Fuel Energy
According to the 13th FYP of GD, the target for the share of non-fossil fuels will be 25% by 2020.
The GDP will grow by a 7%–8% rate between 2015 and 2020. Then, the share of non-fossil fuels in total energy consumption by 2020 can be calculated using Equation (2).
As can be observed in Table 6, the provincial target for the share of non-fossil fuels by 2020 will be achieved by all of the scenarios. Under certain economic growth, the total energy consumption decreases with the declining energy consumption per unit GDP. The higher the proportion of electricity consumption in the total energy consumption in the province is, the larger would be the share of non-fossil energy consumption. Under a certain power growth, and the condition when energy consumption per unit GDP decreases, the lower power growth results in a smaller share of non-fossil energy in the total energy consumption. Apart from the increase in supply of non-fossil fuel power for achieving the target of non-fossil energy share, efforts should also be focused on the reduction of provincial electricity and energy intensity.
5. Conclusions and Policy Implications
In this study, a decomposition model was developed and applied for quantifying various factors affecting the amount of CO2 emissions of GD’s electric power sector. Based upon the plans released by authoritative departments, several energy scenarios were developed for predicting the CO2 emissions from the electric power sector as well as the non-fossil fuel share in GD in 2020. The conclusions are as follows.
Firstly, the analysis demonstrated that the most significant factor affecting emissions is economic growth. The second factor contributing to the reduction of emissions is electricity intensity. The third factor helping to reduce the emissions is the efficiency improvement of thermal power plants. The increase in the percentage of electricity generated from coal would lead to an increase in CO2 emissions. Therefore, the emission reduction effects of the CO2 emission coefficient and electricity supply mix are not always positive during the study period.
Secondly, net purchased electricity from west-to-east can contribute to the reduction of emissions. According to the current provincial-level carbon accounting rules, net purchased electricity is calculated by the average CO2 emission factor of China’s southern power grid. Thus, if the average CO2 emission factor of power generation in GD is greater than that of China’s southern power grid, an increase in net purchased electricity helps to abate CO2 emissions from the electricity sector in GD. This type of a situation will last from 2009 to 2020 with the development of large-sized hydropower in China’s southern power grid.
Thirdly, the share of non-fossil fuel in the total energy consumption was 24.2% in 2014. The CO2 emissions from the electric power sector would peak in 2014 with an annual growth rate of electricity demand of no greater than 4.5% between 2015 and 2020. The provincial target for the share of non-fossil fuel by the 2020 will be achieved by all of the scenarios.
Finally, based upon the above conclusions, the authors would like to make the following policy recommendations to the GD government: in addition to making efforts to lower the electricity emission factors, GD should also make greater efforts on reducing electricity demand, including better demand-side management. Scenario analysis indicates that the planning capacity of coal-fired power may exceed the demand. Therefore, improvement on the planning and approval processes of coal-fired power is needed. In the 13th FYP period, GD should purchase as much electricity as possible from west-to-east with the viewpoint of reducing the CO2 emissions in the power sector.
Acknowledgments
The authors are grateful for the financial support provided by the China Prosperity Fund Programme (PSF LCHG 0667) and the Energy Foundation (G-1309-18987). The authors would also like to thank Yang Shu from the China Quality Certification Center Guangzhou Branch for reviewing the paper.
Author Contributions
Zhong-Hua Tian wrote the paper, designed the study and analysis of the data with significant contributions by Ze-Liang Yang, who are the first author’s thesis advisors.
Conflicts of Interest
The authors declare no conflict of interest.
References
- Yuan, J.; Xu, Y.; Zhang, X.; Hu, Z.; Xu, M. China’s 2020 clean energy target: Consistency, pathways and policy implications. Energy Policy 2014, 65, 692–700. [Google Scholar] [CrossRef]
- Xinhuanet. China-U.S. joint announcement on climate change. Xinhuanet, 12 November 2014. (In Chinese) [Google Scholar]
- Yu, S.; Wei, Y.; Wang, K. Provincial allocation of carbon emission reduction targets in China: An approach based on improved fuzzy cluster and Shapley value decomposition. Energy Policy 2014, 66, 630–644. [Google Scholar] [CrossRef]
- People’s Government of Guangdong Province. The Provincial 13th Five-Year Plan for Economic and Social Development of Guangdong. Available online: http://zwgk.gd.gov.cn/006939748/201605/t20160509_654321.html (accessed on 26 August 2016). (In Chinese)
- Ang, B.W. Decomposition analysis for policymaking in energy: Which is the preferred method? Energy Policy 2004, 32, 1131–1139. [Google Scholar] [CrossRef]
- Ang, B.W.; Liu, N. Handling zero values in the logarithmic mean Divisia index decomposition approach. Energy Policy 2007, 35, 238–246. [Google Scholar] [CrossRef]
- Malla, S. CO2 emissions from electricity generation in seven Asia-Pacific and North American countries: A decomposition analysis. Energy Policy 2009, 37, 1–9. [Google Scholar] [CrossRef]
- Zhang, M.; Liu, X.; Wang, W.; Zhou, M. Decomposition analysis of CO2 emissions from electricity generation in China. Energy Policy 2013, 52, 159–165. [Google Scholar] [CrossRef]
- Karmellos, M.; Kopidou, D.; Diakoulaki, D. A decomposition analysis of the driving factors of CO2 (Carbon dioxide) emissions from the power sector in the European Union countries. Energy 2016, 94, 680–692. [Google Scholar] [CrossRef]
- Ang, B.W.; Su, B. Carbon emission intensity in electricity production: A global analysis. Energy Policy 2016, 94, 56–63. [Google Scholar] [CrossRef]
- Özer, B.; Görgün, E.; İncecik, S. The scenario analysis on CO2 emission mitigation potential in the Turkish electricity sector: 2006–2030. Energy 2013, 49, 395–403. [Google Scholar] [CrossRef]
- Hawkes, A.D. Long-run marginal CO2 emissions factors in national electricity systems. Appl. Energy 2014, 125, 197–205. [Google Scholar] [CrossRef]
- Pineda, S.; Bock, A. Renewable-based generation expansion under a green certificate market. Renew. Energy 2016, 91, 53–63. [Google Scholar] [CrossRef]
- Jiusto, S. The differences that methods make: Cross-border power flows and accounting for carbon emissions from electricity use. Energy Policy 2006, 34, 2915–2928. [Google Scholar] [CrossRef]
- Tao, X.; Wang, P.; Zhu, B. Measuring the Interprovincial CO2 Emissions Considering Electric Power Dispatching in China: From Production and Consumption Perspectives. Sustainability 2016, 8, 5066. [Google Scholar] [CrossRef]
- Andrews-Speed, P.; Dow, S.; Oberheitmann, A.; Ramsay, B.; Smith, V.; Wei, B. First steps in power sector reform the case of China’s Guangdong Province. Util. Policy 2003, 11, 169–183. [Google Scholar] [CrossRef]
- Wang, J.; Dong, Y.; Jiang, H. A study on the characteristics, predictions and policies of China’s eight main power grids. Energy Convers. Manag. 2014, 86, 818–830. [Google Scholar] [CrossRef]
- Segers, R. Three options to calculate the percentage renewable energy: An example for a EU policy debate. Energy Policy 2008, 36, 3243–3248. [Google Scholar] [CrossRef]
- Modahl, I.S.; Raadal, H.L.; Gagnon, L.; Bakken, T.H. How methodological issues affect the energy indicator results for different electricity generation technologies. Energy Policy 2013, 63, 283–299. [Google Scholar] [CrossRef]
- Statistics Bureau of Guangdong Province, Guangdong Survey Office of National Bureau of Statistics. Guangdong Statistical Yearbook, 2006–2015; China Statistical Press: Beijing, China, 2006–2015. (In Chinese)
- National Bureau of Statistics of China. China Energy Statistical Yearbook, 2006–2015; China Statistical Press: Beijing, China, 2006–2015. (In Chinese)
- Chen, Q.; Kang, C.; Ming, H.; Wang, Z.; Xia, Q.; Xu, G. Assessing the low-carbon effects of inter-regional energy delivery in China’s electricity sector. Renew. Sustain. Energy Rev. 2014, 32, 671–683. [Google Scholar] [CrossRef]
- Climate Change Division of the National Development and Reform Commission of China. Average CO2 Emission Factor for Provincial and Regional Power Grids in 2010 in China; Climate Change Division of the National Development and Reform Commission of China: Beijing, China, 2013. (In Chinese)
- Climate Change Division of the National Development and Reform Commission of China. Average CO2 emission Factor for Regional Power Grid in 2011 and 2012 in China; Climate Change Division of the National Development and Reform Commission of China: Beijing, China, 2014. (In Chinese)
- China Electrical Power Press. China Electric Power Yearbook, 2006–2015; China Electrical Power Press: Beijing, China, 2006–2015. (In Chinese) [Google Scholar]
- Tian, Z.-H.; Yang, Z.-L.; Cai, R.-X. Study on Contribution of Power Industry for Regional Energy Conservation and Carbon Intensity Reduction Goal. Electr. Power 2015, 48, 150–155. [Google Scholar]
- Tian, Z.-H.; Yang, Z.-L.; Cai, R.-X. Analysis of Guangdong carbon emissions from energy consumption and the driving factors of its intensity change. China Environ. Sci. 2015, 35, 1885–1891. [Google Scholar]
- Guangdong Provincial Development and Reform Commission. Energy Development Planning for the 13th Five-Year Plan of Guangdong Province; Guangdong Provincial Development and Reform Commission: Guangzhou, China, 2016. (In Chinese) [Google Scholar]
- Tian, Z.-H.; Zhang, L. Study on 13th Five-Year Plan of Energy Conservation and Emission Reduction in GD; Guangdong Energy Conservation Center: Guangzhou, China, 2016. (In Chinese) [Google Scholar]
- National Energy Administration. Development Planning of South Power Grid (2013–2020); National Energy Administration: Beijing, China, 2013. (In Chinese)
- Zhao, Z.; Chen, Y.; Chang, R. How to stimulate renewable energy power generation effectively? China’s incentive approaches and lessons. Renew. Energy 2016, 92, 147–156. [Google Scholar] [CrossRef]
- Hong, L.; Zhou, N.; Fridley, D.; Raczkowski, C. Assessment of China’s renewable energy contribution during the 12th Five Year Plan. Energy Policy 2013, 62, 1533–1543. [Google Scholar] [CrossRef]
- Wu, J.; Huang, Y. Electricity portfolio planning model incorporating renewable energy characteristics. Appl. Energy 2014, 119, 278–287. [Google Scholar] [CrossRef]
- National Development and Reform Commission of China. Action Plan for the Transformation and Upgrading of Coal Power Energy Conservation and Emission Reduction (2014–2020); National Development and Reform Commission of China: Beijing, China, 2014. (In Chinese)
- Zhao, X.; Ma, C. Deregulation, vertical unbundling and the performance of China’s large coal-fired power plants. Energy Econ. 2013, 40, 474–483. [Google Scholar] [CrossRef]
Figure 1.
CO2 emissions of electric power sector in GD.

Figure 2.
Supply mix of electricity consumed in GD.

Figure 3.
Annual change rate of CO2 emission and electricity demand.

Figure 4.
CO2 emissions intensity of electricity in GD.

Figure 5.
The planned installed power capacity in GD by 2020 (MW).


| Year | Total Energy Consumption (Mtce) | Fuels Consumed by Thermal Power | bT (gce/kWh) | fT (tCO2/tce) | λ | ||||
|---|---|---|---|---|---|---|---|---|---|
| Total (Mtce) | Coal Products Share | Oil Products Share | Natural Gas Share | Others Share | |||||
| 2005 | 179.21 | 62.43 | 76.7% | 21.5% | 0.2% | 1.7% | 339.2 | 2.436 | 15.8% |
| 2006 | 199.71 | 65.62 | 80.9% | 15.6% | 1.6% | 1.9% | 330.2 | 2.439 | 16.8% |
| 2007 | 222.17 | 73.23 | 82.7% | 9.7% | 5.8% | 1.7% | 325. | 2.424 | 18.2% |
| 2008 | 234.76 | 69.24 | 83.9% | 7.5% | 6.8% | 1.8% | 328.7 | 2.464 | 19.6% |
| 2009 | 246.54 | 69.51 | 84.4% | 4.3% | 9.0% | 2.3% | 324.4 | 2.396 | 19.3% |
| 2010 | 249.72 | 82.38 | 87.1% | 1.8% | 9.0% | 2.0% | 318.1 | 2.414 | 18.7% |
| 2011 | 264.31 | 96.76 | 89.3% | 0.6% | 8.8% | 1.3% | 317.0 | 2.440 | 16.1% |
| 2012 | 277.53 | 92.61 | 88.2% | 0.7% | 8.0% | 3.0% | 315.9 | 2.439 | 19.2% |
| 2013 | 284.80 | 93.47 | 90.4% | 0.6% | 7.7% | 1.3% | 314.3 | 2.461 | 20.5% |
| 2014 | 295.93 | 91.14 | 87.3% | 0.6% | 9.3% | 2.7% | 310.8 | 2.440 | 24.2% |
| Years | ∆CA | ∆CI | ∆Cb | ∆Cf | ∆Cs | ∆C |
|---|---|---|---|---|---|---|
| 2005–2006 | 2602 | −406 | −508 | 16 | −30 | 1674 |
| 2006–2007 | 2916 | 257 | −326 | −204 | 97 | 2740 |
| 2007–2008 | 2226 | −2138 | 242 | 111 | −442 | −1 |
| 2008–2009 | 2069 | −1423 | −293 | −924 | 377 | −194 |
| 2009–2010 | 2765 | 7 | −461 | 268 | 166 | 2744 |
| 2010–2011 | 2500 | −397 | −90 | 82 | 520 | 2613 |
| 2011–2012 | 2175 | −822 | −98 | −383 | −708 | 163 |
| 2012–2013 | 2281 | −1029 | −136 | 130 | −612 | 634 |
| 2013–2014 | 2132 | 164 | −326 | −964 | −756 | 250 |
| 2005–2014 | 21,665 | −5786 | −1997 | −1869 | −1389 | 10,624 |
| Years | ∆CA | ∆CI | ∆Cb | ∆Cf | ∆Cs |
|---|---|---|---|---|---|
| 2005–2006 | 155% | −24% | −30% | 1% | −2% |
| 2006–2007 | 106% | 9% | −12% | −7% | 4% |
| 2007–2008 | −242,924% | 233,267% | −26,412% | −12,108% | 48,277% |
| 2008–2009 | −1068% | 735% | 151% | 477% | −195% |
| 2009–2010 | 101% | 0% | −17% | 10% | 6% |
| 2010–2011 | 96% | −15% | −3% | 3% | 20% |
| 2011–2012 | 1331% | −503% | −60% | −234% | −433% |
| 2012–2013 | 360% | −162% | −21% | 21% | −97% |
| 2013–2014 | 853% | 66% | −131% | −386% | −302% |
| 2005–2014 | 204% | −54% | −19% | −18% | −13% |
| Fuels Consumed by Thermal Power (Mtce) | Gross Coal Consumption Rate (gce/kWh) | Emission Coefficient (tCO2/tce) | |||||
|---|---|---|---|---|---|---|---|
| Total | Coal Products | Oil Products | Natural Gas | Others | |||
| Scenario 1 | 90.05 | 73.58 | 0.05 | 15.35 | 1.08 | 282.12 | 2.40 |
| Scenario 2 | 94.72 | 78.19 | 0.05 | 15.35 | 1.14 | 282.60 | 2.41 |
| Scenario 3 | 99.49 | 82.90 | 0.05 | 15.35 | 1.19 | 283.07 | 2.42 |
| Scenario 4 | 104.35 | 87.70 | 0.05 | 15.35 | 1.25 | 283.51 | 2.42 |
| Scenario 1 | Scenario 2 | Scenario 3 | Scenario 4 | |
|---|---|---|---|---|
| Electricity generated in GD | 216.16 | 228.11 | 240.32 | 252.77 |
| Net purchased electricity | 68.80 | 68.80 | 68.80 | 68.80 |
| Total | 284.96 | 296.91 | 309.12 | 321.57 |
Table 6.
Contribution of non-fossil fuel energy in GD’s power sector by 2020 under various annual GDP growth rates.
| Annual GDP Growth Rate | Scenario 1 | Scenario 2 | Scenario 3 | Scenario 4 |
|---|---|---|---|---|
| 7.0% | 27.5% | 27.6% | 27.6% | 27.7% |
| 7.5% | 26.9% | 27.0% | 27.0% | 27.0% |
| 8.0% | 26.3% | 26.3% | 26.4% | 26.4% |
© 2016 by the authors; licensee MDPI, Basel, Switzerland. This article is an open access article distributed under the terms and conditions of the Creative Commons Attribution (CC-BY) license (http://creativecommons.org/licenses/by/4.0/).
Share and Cite
MDPI and ACS Style
Tian, Z.-H.; Yang, Z.-L. Scenarios of Carbon Emissions from the Power Sector in Guangdong Province. Sustainability 2016, 8, 863. https://doi.org/10.3390/su8090863
AMA Style
Tian Z-H, Yang Z-L. Scenarios of Carbon Emissions from the Power Sector in Guangdong Province. Sustainability. 2016; 8(9):863. https://doi.org/10.3390/su8090863
Chicago/Turabian StyleTian, Zhong-Hua, and Ze-Liang Yang. 2016. "Scenarios of Carbon Emissions from the Power Sector in Guangdong Province" Sustainability 8, no. 9: 863. https://doi.org/10.3390/su8090863
Note that from the first issue of 2016, this journal uses article numbers instead of page numbers. See further details here.