
Economic and Environmental Benefits of Optimized Hybrid Renewable Energy Generation Systems at Jeju National University, South Korea


Abstract
:1. Introduction
Acts for Renewable Energy Facilities in South Korea
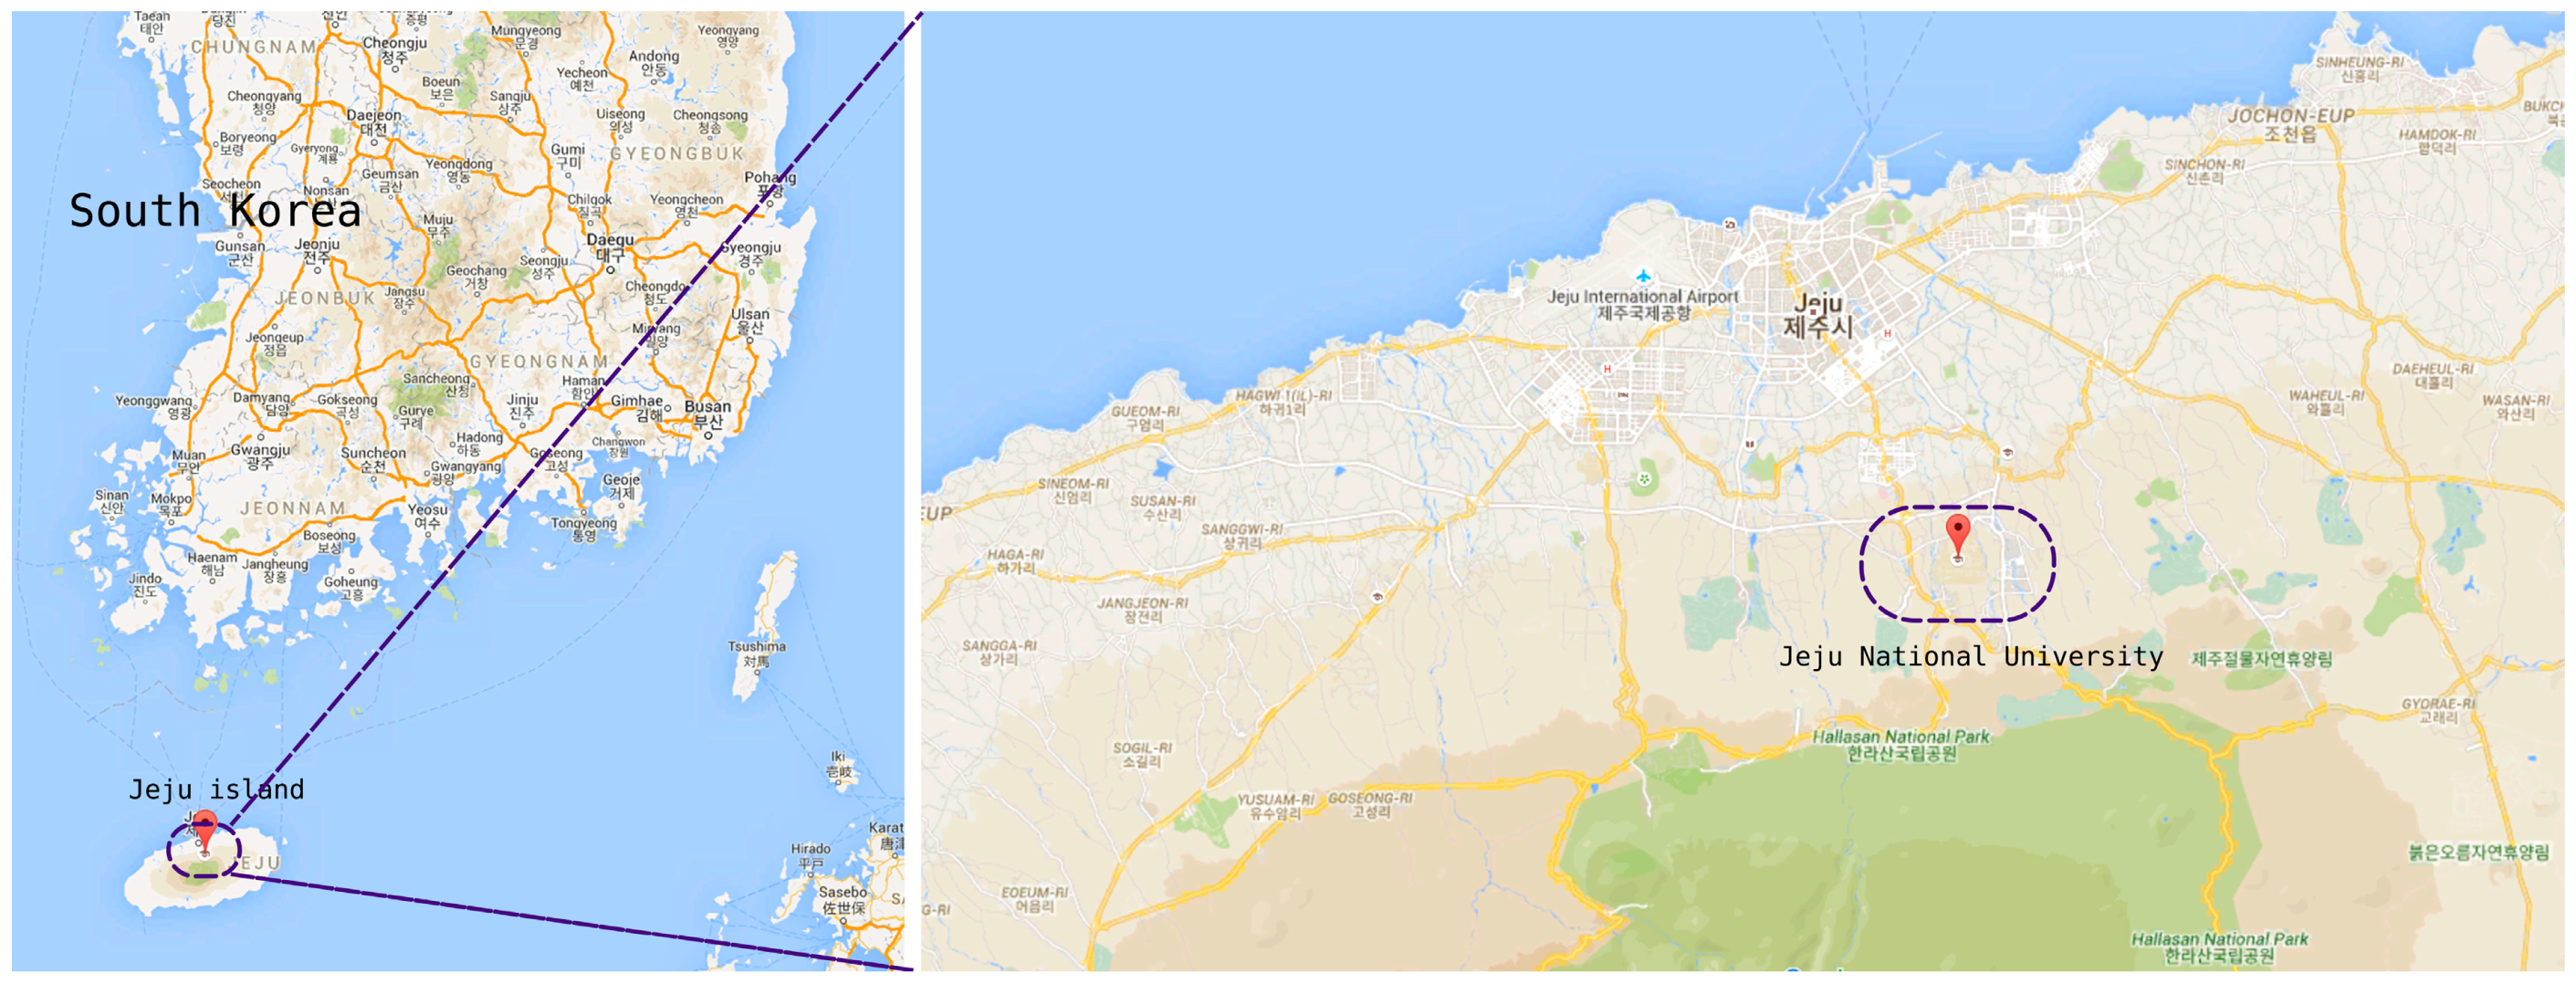
2. Status of Jeju National University
2.1. University Location and Population
2.2. University Load Information
2.3. University Solar Energy Information
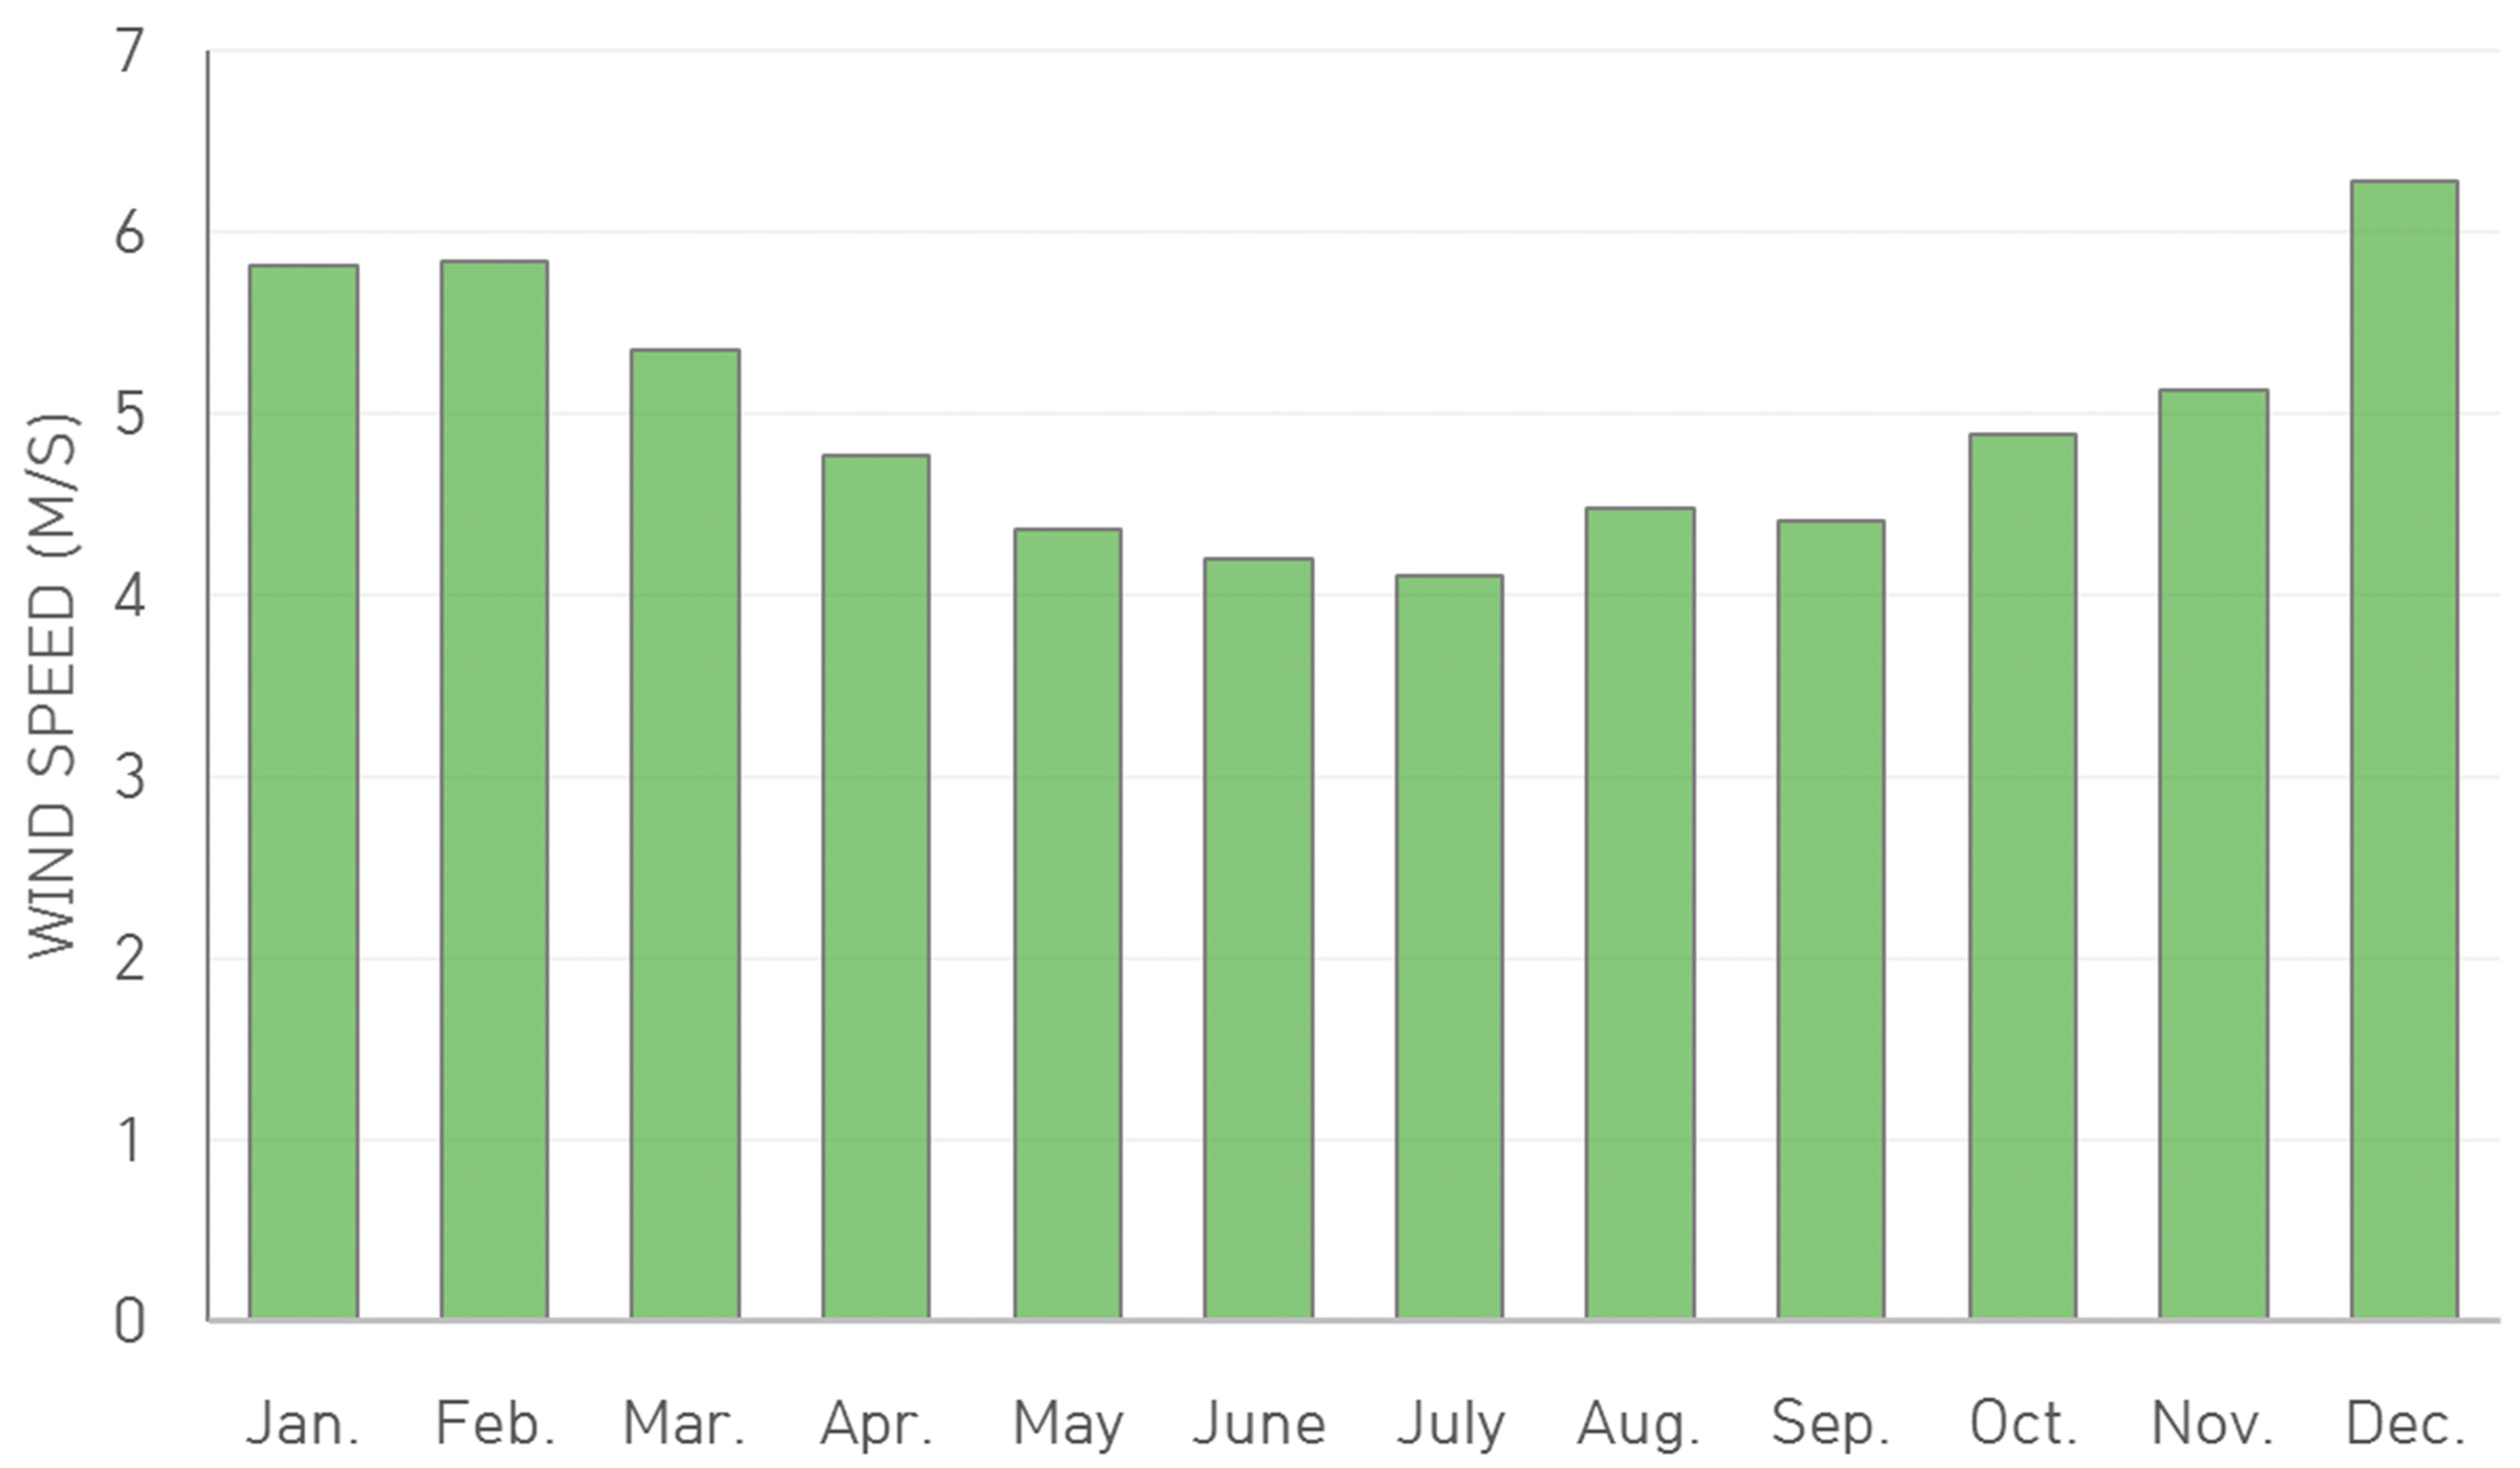
2.4. University Wind Energy Information
3. Key Parameters for the Economic and Environmental Analysis
3.1. South Korea’s Annual Real Interest Rate
3.2. Three Evaluation Guidelines
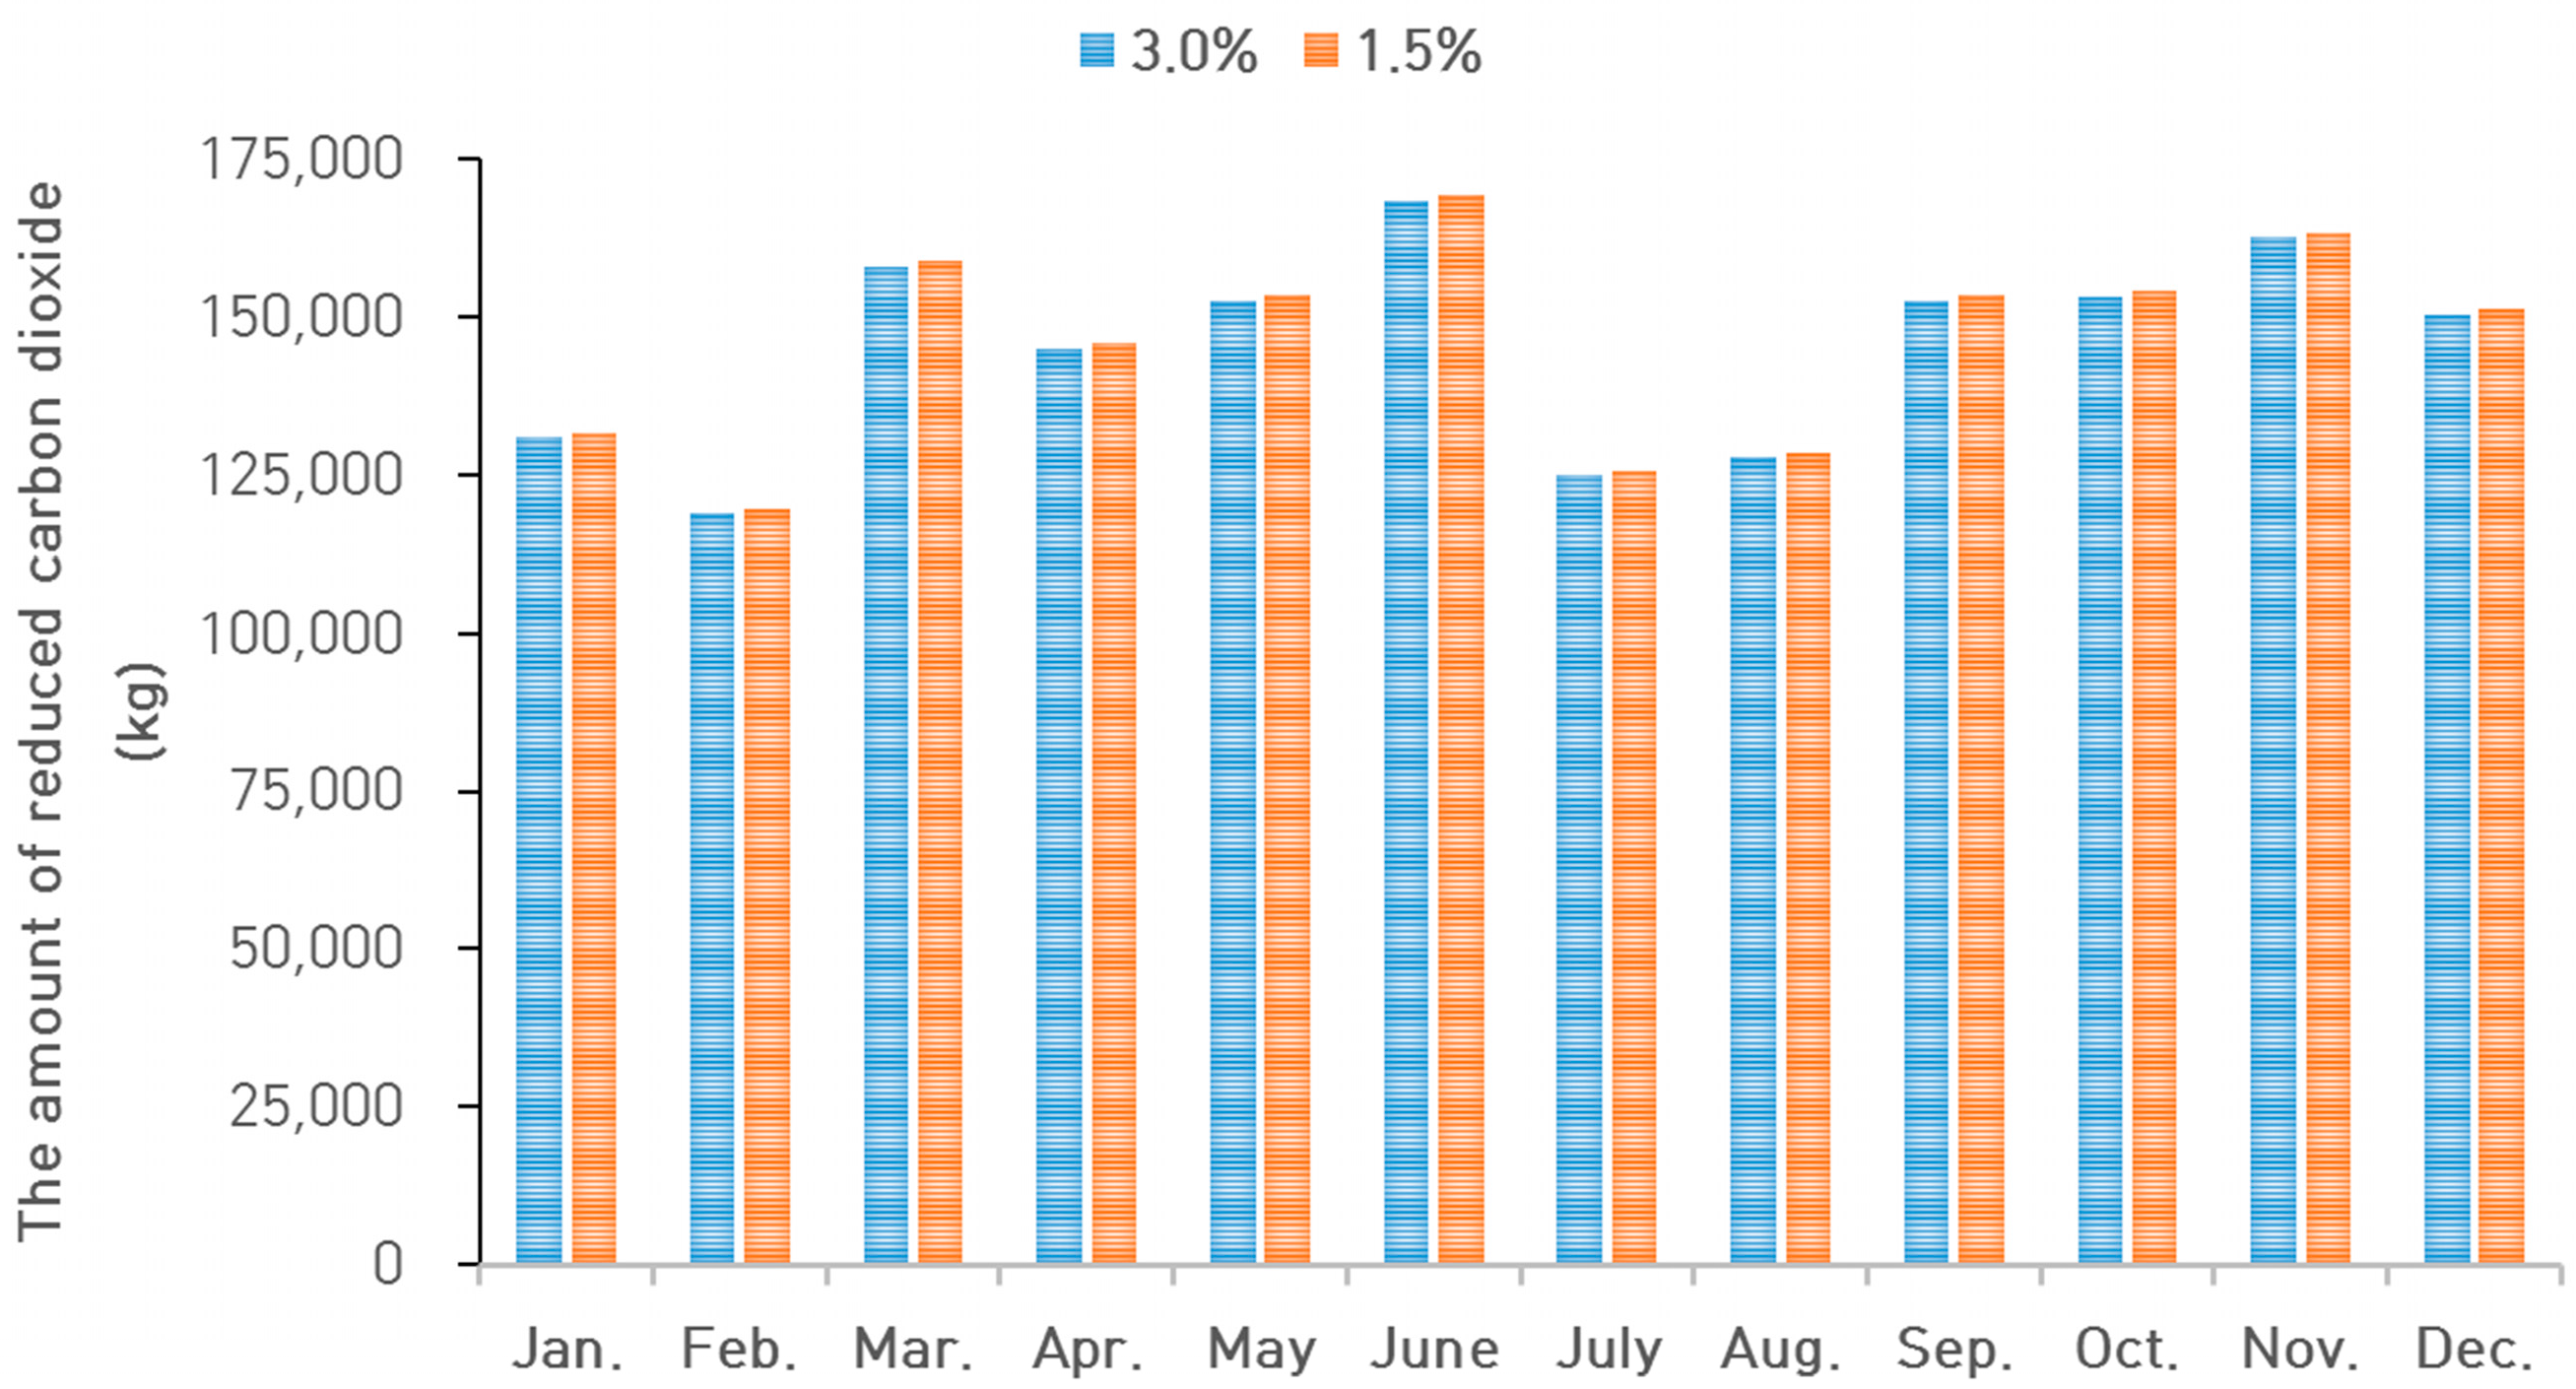
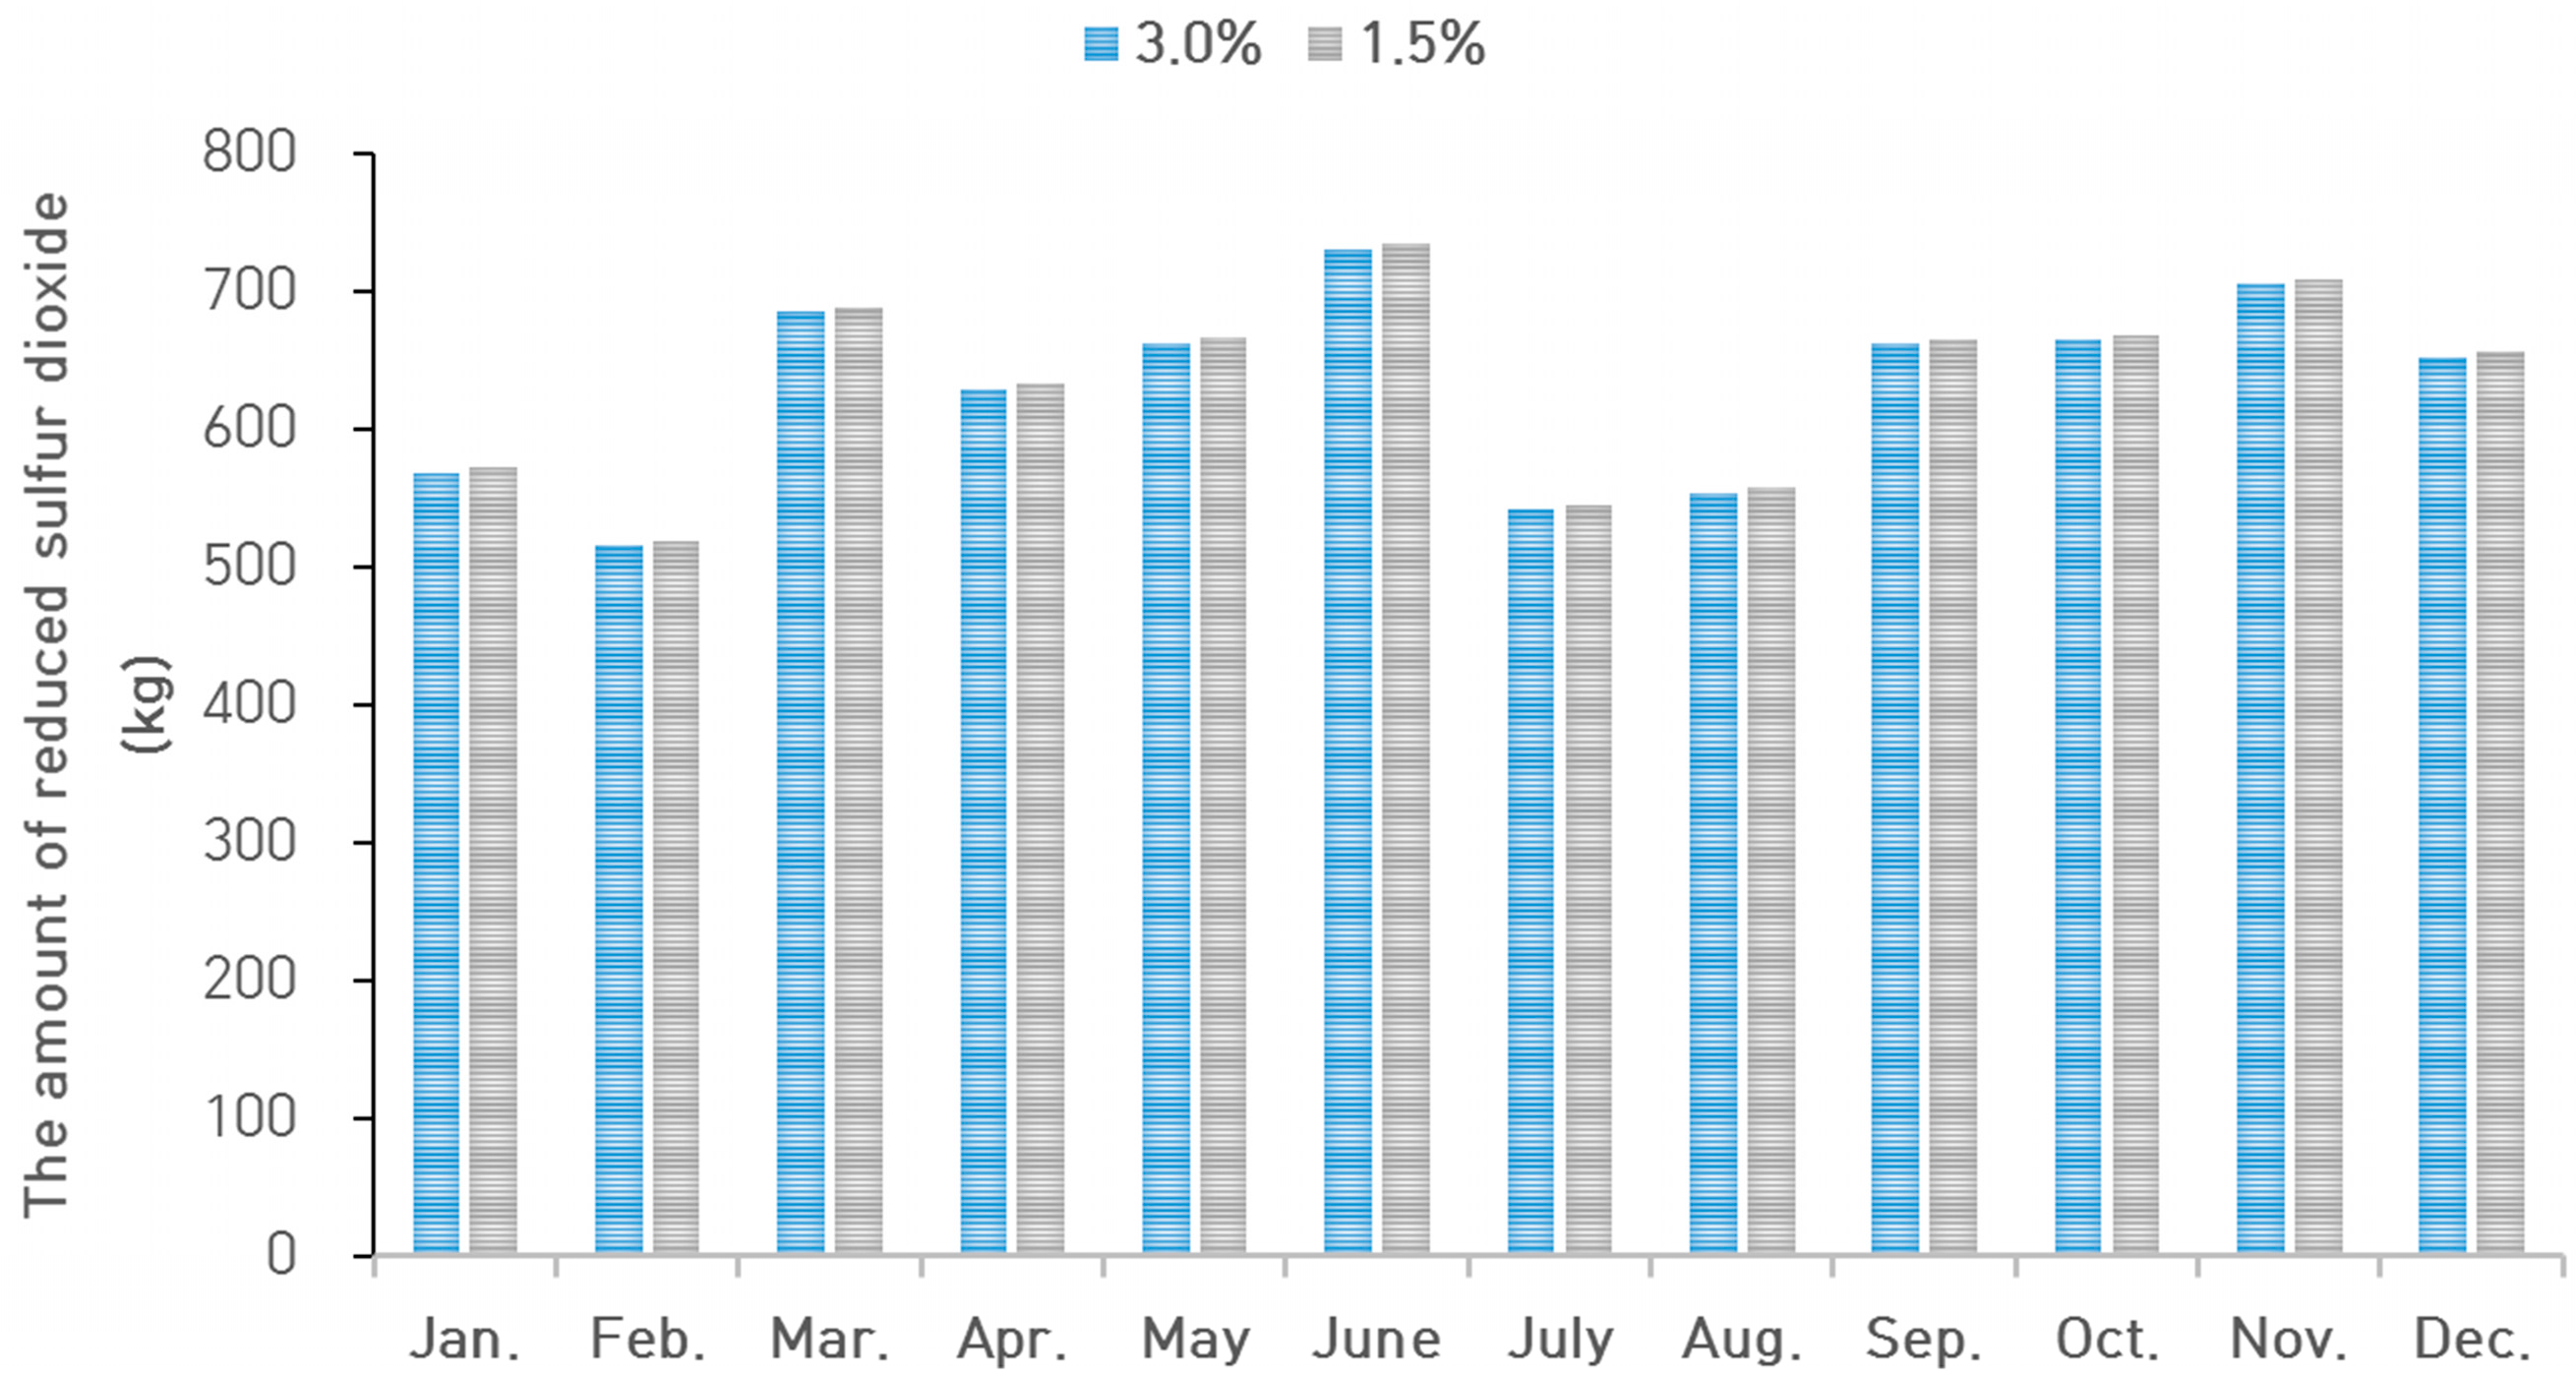
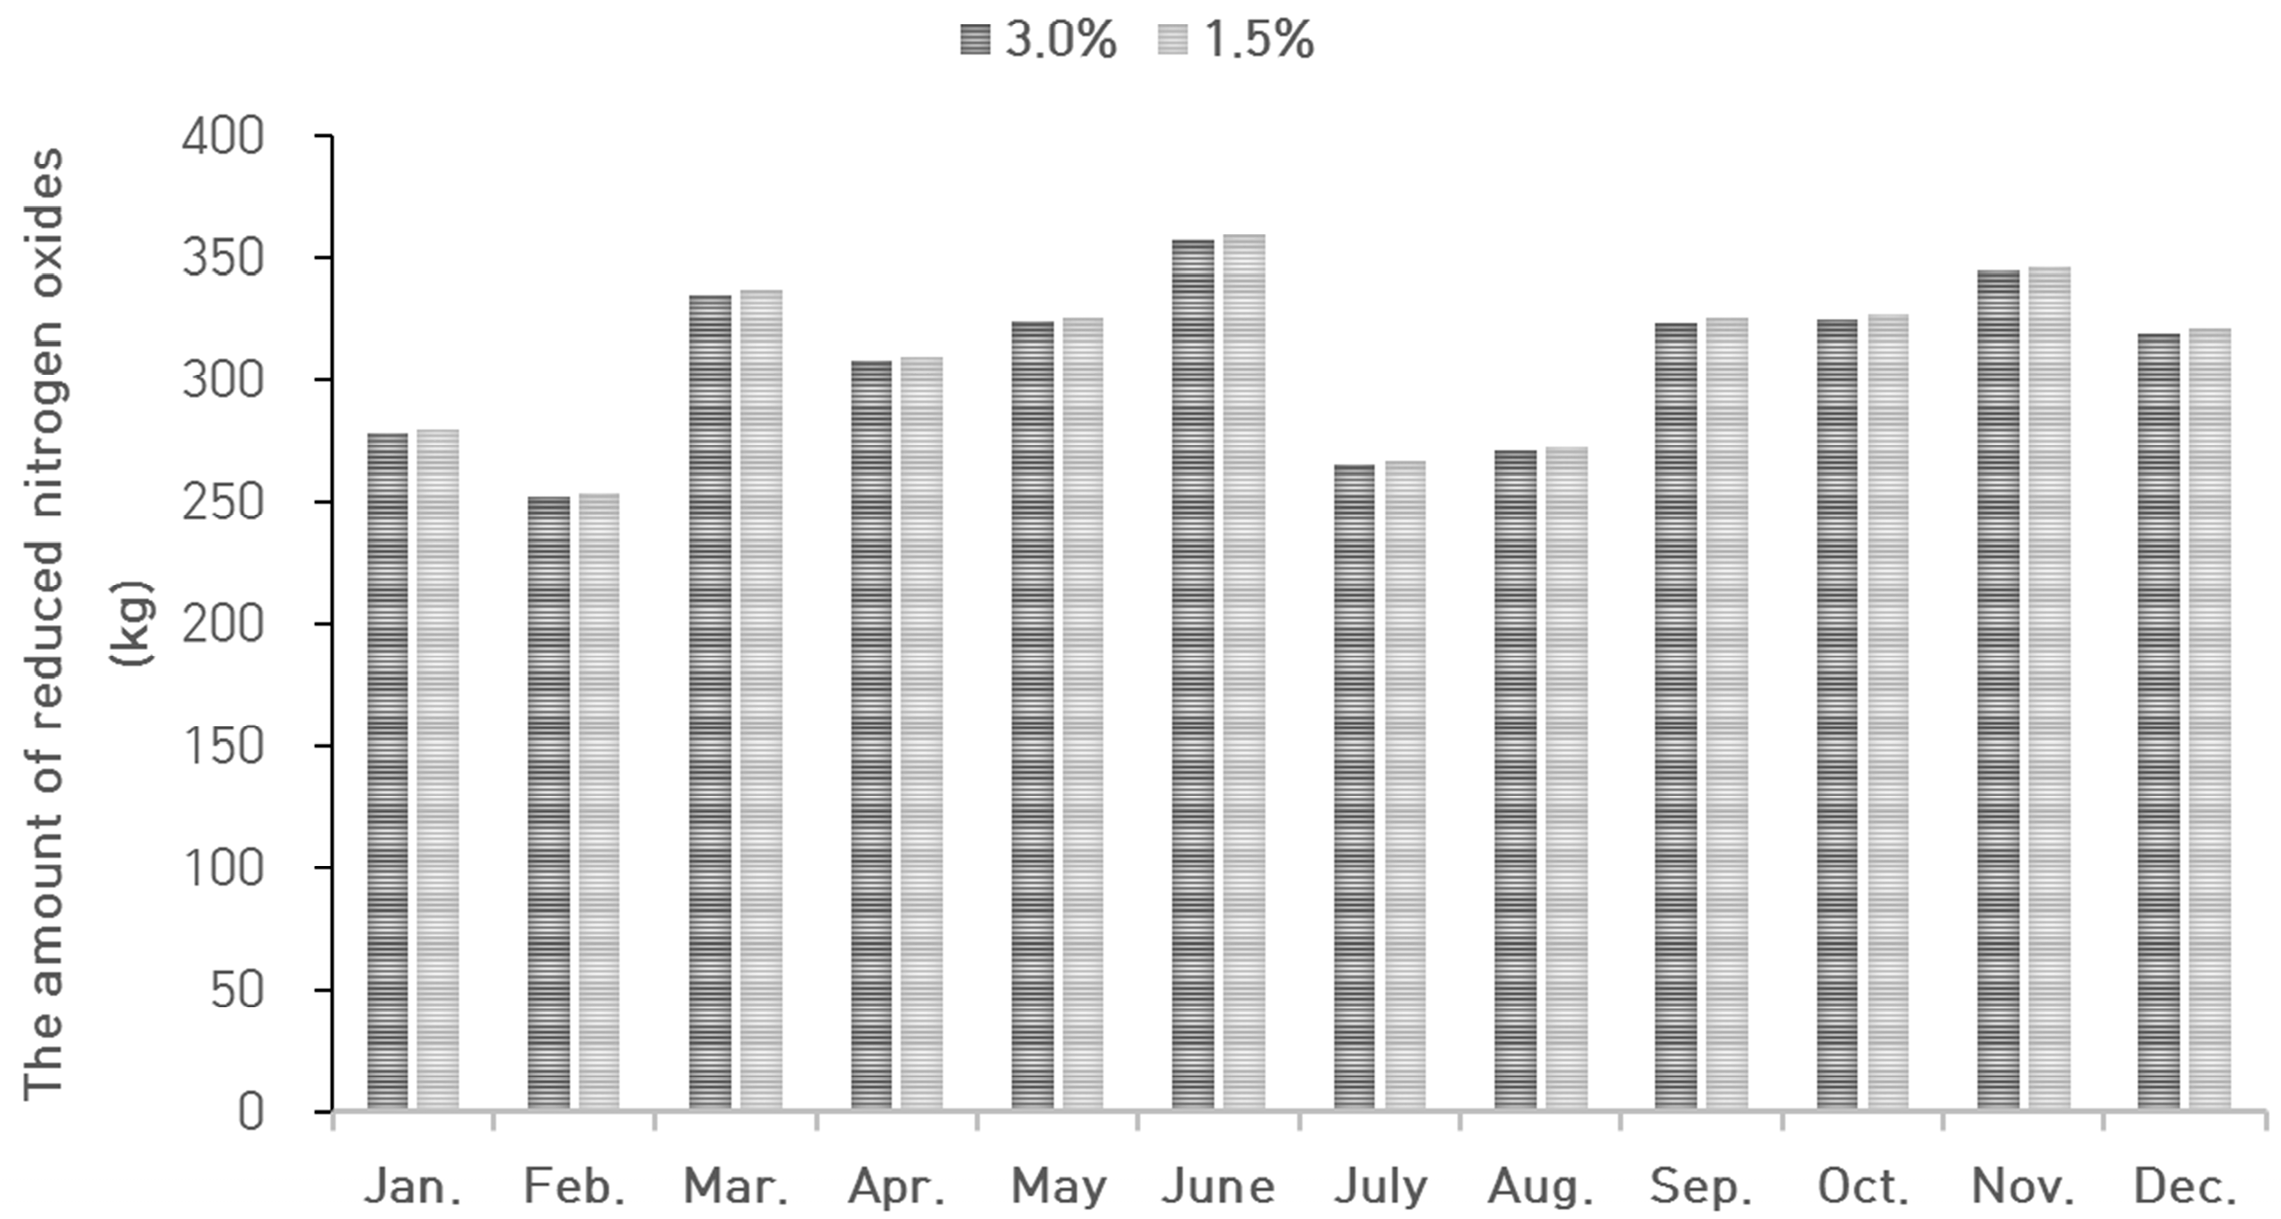
3.3. Environmental Parameters
4. Renewable Electricity Generation Systems
5. Results
6. Discussion
- Stages for gradually installing the suggested components in the system should be planned.
- The supporting plans and policies operated by South Korean and local governments should be considered and applied.
- The dependence on renewable electricity generation components will be gradually increased when the dependence of the grid system is reduced.
7. Limitations
Acknowledgments
Author Contributions
Conflicts of Interest
References
- Kharecha, P.A.; Hansen, J.E. Prevented mortality and greenhouse gas emissions from historical and projected nuclear power. Environ. Sci. Technol. 2013, 47, 4889–4895. [Google Scholar] [CrossRef] [PubMed]
- Steinhauser, G.; Brandl, A.; Johnson, T.E. Comparison of the Chernobyl and Fukushima nuclear accidents: A review of the environmental impacts. Sci. Total Environ. 2014, 470, 800–817. [Google Scholar] [CrossRef] [PubMed]
- Hoornweg, D.; Sugar, L.; Gómez, C.L.T. Cities and greenhouse gas emissions: Moving forward. Environ. Urban. 2011, 23, 207–227. [Google Scholar] [CrossRef]
- Panwar, N.L.; Kaushik, S.C.; Kothari, S. Role of renewable energy sources in environmental protection: A review. Renew. Sustain. Energy Rev. 2011, 15, 1513–1524. [Google Scholar] [CrossRef]
- Park, E.; Ohm, J.Y. Factors influencing the public intention to use renewable energy technologies in South Korea: Effects of the Fukushima nuclear accident. Energy Policy 2014, 65, 198–211. [Google Scholar] [CrossRef]
- The Ministry of Trade, Industry and Energy in South Korea. Energy and Green Energy. Available online: http://www.motie.go.kr/motie/py/fe/greenenergy/greeneneregyvision/greenenergyvision.jsp (accessed on 25 June 2016).
- The Ministry of Trade, Industry and Energy in South Korea. Promotion of New and Renewable Energy. Available online: http://english.motie.go.kr/?p=5444 (accessed on 25 June 2016).
- Korea Energy Agency. 2015 Energy Statistics Handbook. Available online: http://www.kemco.or.kr/web/kem_home_new/info/statistics/data/kem_view.asp?sch_key=&sch_value=&c=305&h_page=1&q=19337 (accessed on 25 June 2016).
- Shin, J.; Woo, J.; Huh, S.Y.; Lee, J.; Jeong, G. Analyzing public preferences and increasing acceptability for the Renewable Portfolio Standard in Korea. Energy Econ. 2014, 42, 17–26. [Google Scholar] [CrossRef]
- Kwon, T.H. Rent and rent-seeking in renewable energy support policies: Feed-in tariff vs. renewable portfolio standard. Renew. Sustain. Energy Rev. 2015, 44, 676–681. [Google Scholar] [CrossRef]
- The Ministry of Trade, Industry and Energy in South Korea. How to Response Industrial Resource Policies. Available online: http://www.prism.go.kr/homepage/researchCommon/retrieveResearchDetailPopup.do;jsessionid=464647D8ECEC787DE2E38E8223852529.node02?research_id=1411000-201200033 (accessed on 25 June 2016).
- Jänicke, M. “Green growth”: From a growing eco-industry to economic sustainability. Energy Policy 2012, 48, 13–21. [Google Scholar] [CrossRef]
- Kim, S.E.; Kim, H.; Chae, Y. A new approach to measuring green growth: Application to the OECD and Korea. Futures 2014, 63, 37–48. [Google Scholar] [CrossRef]
- Sonnenschein, J.; Mundaca, L. Decarbonization under green growth strategies? The case of South Korea. J. Clean. Prod. 2016, 123, 180–193. [Google Scholar] [CrossRef]
- Moon, J.H.; Lee, J.W.; Lee, U.D. Economic analysis of biomass power generation schemes under renewable energy initiative with Renewable Portfolio Standards (RPS) in Korea. Bioresour. Technol. 2011, 102, 9550–9557. [Google Scholar] [CrossRef]
- Koo, J.; Park, K.; Shin, D.; Yoon, E.S. Economic evaluation of renewable energy systems under varying scenarios and its implications to Korea’s renewable energy plan. Appl. Energy 2011, 88, 2254–2260. [Google Scholar] [CrossRef]
- Yoo, S.H.; Kwak, S.Y. Willingness to pay for green electricity in Korea: A contingent valuation study. Energy Policy 2009, 37, 5408–5416. [Google Scholar] [CrossRef]
- Ahn, J.; Woo, J.; Lee, J. Optimal allocation of energy sources for sustainable development in South Korea: Focus on the electric power generation industry. Energy Policy 2015, 78, 78–90. [Google Scholar] [CrossRef]
- Mathews, J.A. Green growth strategies—Korean initiatives. Futures 2012, 44, 761–769. [Google Scholar] [CrossRef]
- Lee, S.K.; Mogi, G.; Kim, J.W. Energy technology roadmap for the next 10 years: The case of Korea. Energy Policy 2009, 37, 588–596. [Google Scholar] [CrossRef]
- Chen, W.M.; Kim, H.; Yamaguchi, H. Renewable energy in eastern Asia: Renewable energy policy review and comparative SWOT analysis for promoting renewable energy in Japan, South Korea, and Taiwan. Energy Policy 2014, 74, 319–329. [Google Scholar] [CrossRef]
- Park, E.; Yoo, K.; Ohm, J.Y.; Kwon, S.J. Case study: Renewable electricity generation systems on Geoje Island in South Korea. J. Renew. Sustain. Energy 2016, 8, 015904. [Google Scholar] [CrossRef]
- Chang, Y.; Fang, Z.; Li, Y. Renewable energy policies in promoting financing and investment among the East Asia Summit countries: Quantitative assessment and policy implications. Energy Policy 2016, 95, 427–436. [Google Scholar]
- Park, Y.C.; Kim, D.S.; Huh, J.C.; Kim, Y.G. New and Renewable Energy Policies of Jeju Island in Korea. Available online: http://www.ep.liu.se/ecp/057/vol10/022/ecp57vol10_022.pdf (accessed on 25 June 2016).
- Jeju Special Self-Governing Province. Carbon Free Island Jeju by 2030. Available online: http://www.ksga.org/down/down.asp?file=Carbon%20Free%20Island%20Jeju%20by%202030.pdf (accessed on 25 June 2016).
- Jeju Energy Corporation. For Carbon-Free Island. Available online: http://www.jejuenergy.or.kr/index.php/contents/reference/press?act=view&seq=399&bd_bcid=press&q_wops=like&q_wcols=bd_content&q_wvals1=%C8%AE%B4%EB&page=1 (accessed on 25 April 2016).
- Park, J.; Kim, S. Low Carbon Green Growth Era Effective Renewable Energy of University Sacilities. Available online: http://www.auric.or.kr/user/rdoc/DocRdoc.aspx?returnVal=RD_R&dn=238543#.U8ZhXPl_up9 (accessed on 25 July 2016).
- National Law Information Center. Energy Management Act. Available online: http://www.law.go.kr/lsInfoP.do?lsiSeq=169&ancYd=19740104&ancNo=02673&efYd=19740701&nwJoYnInfo=N&efGubun=Y&chrClsCd=010202#0000 (accessed on 25 April 2016).
- National Law Information Center. Energy Use Rationalization Act. Available online: http://www.moleg.go.kr/english/korLawEng?pstSeq=57721 (accessed on 25 April 2016).
- Lee, M.K.; Park, H.; Noh, J.; Painuly, J.P. Promoting energy efficiency financing and ESCOs in developing countries: Experiences from Korean ESCO business. J. Clean. Prod. 2003, 11, 651–657. [Google Scholar] [CrossRef]
- National Law Information Center. Alternative Energy Development and Promotion Act. Available online: http://www.law.go.kr/lsInfoP.do?lsiSeq=166&ancYd=19871204&ancNo=03990&efYd=19880101&nwJoYnInfo=N&efGubun=Y&chrClsCd=010202#0000 (accessed on 25 April 2016).
- National Law Information Center. Act on the Promotion of the Development, Use and Diffusion of New and Renewable Energy. Available online: http://www.law.go.kr/lsInfoP.do?lsiSeq=66131&ancYd=20041231&ancNo=07284&efYd=20050701&nwJoYnInfo=N&efGubun=Y&chrClsCd=010202#0000 (accessed on 25 April 2016).
- National Law Information Center. Renewable Energy Act. Available online: http://www.law.go.kr/lsInfoP.do?lsiSeq=181833&ancYd=20160322&ancNo=14079&efYd=20160923&nwJoYnInfo=N&efGubun=Y&chrClsCd=010202#0000 (accessed on 25 April 2016).
- Yoo, K.; Park, E.; Kim, H.; Ohm, J.Y.; Yang, T.; Kim, K.J.; Chang, H.J.; del Pobil, A.P. Optimized renewable and sustainable electricity generation systems for Ulleungdo Island in South Korea. Sustainability 2014, 6, 7883–7893. [Google Scholar] [CrossRef]
- Park, E.; Kwon, S.J. Solutions for optimizing renewable power generation systems at Kyung-Hee University’s Global Campus, South Korea. Renew. Sustain. Energy Rev. 2016, 58, 439–449. [Google Scholar] [CrossRef]
- Park, E.; Kwon, S.J. Towards a Sustainable Island: Independent optimal renewable power generation systems at Gadeokdo Island in South Korea. Sustain. Cities Soc. 2016, 23, 114–118. [Google Scholar] [CrossRef]
- Hafez, O.; Bhattacharya, K. Optimal planning and design of a renewable energy based supply system for microgrids. Renew. Energy 2012, 45, 7–15. [Google Scholar] [CrossRef]
- Baek, S.; Park, E.; Kim, M.G.; Kwon, S.J.; Kim, K.J.; Ohm, J.Y.; del Pobil, A.P. Optimal renewable power generation systems for Busan metropolitan city in South Korea. Renew. Energy 2016, 88, 517–525. [Google Scholar] [CrossRef]
- Park, E.; Kwon, S.J. Renewable electricity generation systems for electric-powered taxis: The case of Daejeon metropolitan city. Renew. Sustain. Energy Rev. 2016, 58, 1466–1474. [Google Scholar] [CrossRef]


| Category | Description | Sources |
|---|---|---|
| Political |
| [12,13,14] |
| Economic |
| [15,16] |
| Socio-cultural |
| [17,18,19] |
| Technological |
| [20,21] |
| Act | Description | |
|---|---|---|
| Energy Use Rationalization Act | Energy Use Rationalization Act | Article 8 (Measures for Efficient Use of Energy by State and Local Governments) (1) Persons falling under any of the following subparagraphs shall promote measures necessary for efficiently using energy in accordance with the purposes of this Act and reducing GHG emissions: 1. State; 2. Local governments; 3. Public institutions under Article 4 (1) Of the Act on the Management of Public Institutions. (2) Details of measures necessary for efficiently using energy and reducing GHG emissions, which shall be promoted by the State and local governments under paragraph (1), shall be prescribed by Presidential Decree. |
| Decree of Energy Use Rationalization Act | Article 15 (Contents of act on efficiency of energy use) In accordance with the Act (Article 8 (1)), the specific contents of necessary acts is as following subparagraphs for efficient use and reduction of GHG emissions by the national and local governments. 1. The provision and maintenance of the system and measures to save energy and reduce GHG emissions 2. Public relation and education related with energy saving and reduction of GHG emissions 3. The rationalization of energy use and reduction of GHG emissions in buildings and transport sectors | |
| Regulation on promotion of energy use rationalization by public bodies, | Article 6 (promotion of energy use efficiency in new buildings) In accordance with the Article 14 of Green Building Composition Support Act and the Article 10 of the Decree of the same Act, among buildings to submit an energy saving plan, if it has total floor area of more than 3000 m2 and a building which is designed as the standard of Building Energy Efficiency Rating Certification (usually announced by the Ministry of Trade, Industry and Energy and the Ministry of Land, Infrastructure and Transport) is built newly or if it is expanded as a separate building which has total floor area of more than 3000 m2, it must obtain grade 1 or higher according to the standard of building energy efficiency rating certification. However, newly built buildings of market or quasi-market type of public enterprises must obtain grade 1++ or higher of Building Energy Efficiency from 2017. | |
| Act on the Promotion of the Development, Use and Diffusion of New and Renewable Energy | Act on the Promotion of the Development, Use and Diffusion of New and Renewable Energy | Article 12 (Investment Recommendation and Mandatory Use, etc. of New and Renewable Energy) (1) Where the Minister of Trade, Industry and Energy deems it necessary to promote the technological development, use, and distribution of new and renewable energy, he/she may recommend that a person carrying on energy-related business conduct invest in, or contribute to any of the projects referred to in the subparagraph of Article 10. <Amended by Act No. 11690, 23 March 2013> (2) Where the Minister of Trade, Industry and Energy deems it necessary to facilitate the use or distribution of new and renewable energy, and to vitalize the new and renewable energy industry, he/she may require any of the following entities to mandatorily install new and renewable energy facilities in a building newly built, extended, or remodeled by such entities in order to use energy supplied utilizing new or renewable energy over a certain percentage of the estimated amount of energy used computed as at the time of its design, as prescribed by Presidential Decree: <Amended by Act No. 11690, 23 March 2013; Act No. 13087, 28 January 2015> 1. The State and a local government; 2. A public institution; 3. A government-contributed institution to which the Government has contributed at least an amount prescribed by Presidential Decree; 4. A government-invested corporation defined in subparagraph 6 of Article 2 of the State Property Act; 5. A corporation to which a local government, public institution, government-contributed institution, or government-invested corporation referred to in subparagraphs 2 through 4 has invested at a ratio or at least an amount prescribed by Presidential Decree; 6. A corporation incorporated under any special Act. (3) The Minister of Trade, Industry and Energy may recommend that any factory, place of business, collective housing complex, etc., deemed appropriate use new and renewable energy as designated by him/her to use such energy or install facilities for using such energy. <Amended by Act No. 11690, 23 March 2013> [This Article Wholly Amended by Act No. 10253, 12 April 2010] |
| Components | Index | |
|---|---|---|
| Annual real interest rate | 1.5% | 3.0% |
| PV panel (kW) | 4855 | 4855 |
| Wind turbine (#) | 888 | 884 |
| Battery unit (#) | 10,920 | 10,945 |
| Converter (kW) | 1885 | 1875 |
| Grid connection (kW) | 0 | 0 |
| Operating cost (annually; $ per year) | 854,247 | 856,344 |
| Initial capital cost ($) | 36,920,680 | 36,883,404 |
| Total NPC ($) | 54,620,352 | 51,795,040 |
| COE ($ per kWh) | 0.356 | 0.402 |
| Renewable fraction | 1.00 | 1.00 |
| Annual Real Interest Rate | Component | Capital ($) | Replacement ($) | Operation & Management ($) | Salvage ($) | Total ($) |
|---|---|---|---|---|---|---|
| 3.00% | PV | 8,739,000 | 6,488,451 | 2,514,843 | −4,517,229 | 13,225,068 |
| Wind turbine | 12,876,000 | - | 3,679,804 | - | 16,555,804 | |
| Grid | - | - | −6,328,446 | - | −6,328,446 | |
| Battery | 13,420,680 | 20,613,248 | 2,262,582 | −8,478,813 | 27,817,700 | |
| Converter | 1,885,000 | 1,507,720 | 390,565 | −433,051 | 3,350,234 | |
| System | 36,920,680 | 28,609,418 | 2,519,349 | −13,429,093 | 54,620,356 | |
| 1.50% | PV | 8,739,000 | 4,838,575 | 2,113,522 | −3,130,349 | 12,560,749 |
| Wind turbine | 12,818,000 | - | 3,078,646 | - | 15,896,647 | |
| Grid | - | - | −5,288,761 | - | −5,288,761 | |
| Battery | 13,451,405 | 16,051,752 | 1,905,870 | −5,889,098 | 25,519,932 | |
| Converter | 1,875,000 | 1,203,492 | 326,497 | −298,504 | 3,106,485 | |
| System | 36,883,404 | 22,093,820 | 2,135,773 | −9,317,950 | 51,795,040 |
| Annual Real Interest Rate | Component | Capital ($) | Replacement ($) | O & M ($) | Salvage ($) | Total ($) |
|---|---|---|---|---|---|---|
| 3.00% | PV | 421,774 | 313,155 | 121,375 | −218,017 | 638,287 |
| Wind turbine | 621,440 | - | 177,600 | - | 799,040 | |
| Grid | - | - | −305,433 | - | −305,433 | |
| Battery | 647,728 | 994,867 | 109,200 | −409,217 | 1,342,578 | |
| Converter | 90,977 | 72,768 | 18,850 | −20,901 | 161,694 | |
| System | 1,781,920 | 1,380,789 | 121,592 | −648,134 | 2,636,167 | |
| 1.50% | PV | 501,862 | 277,869 | 121,375 | −179,769 | 721,337 |
| Wind turbine | 736,110 | - | 176,800 | - | 912,911 | |
| Grid | - | - | −303,722 | - | −303,722 | |
| Battery | 772,486 | 921,818 | 109,450 | −338,198 | 1,465,555 | |
| Converter | 107,677 | 69,114 | 18,750 | −17,142 | 178,399 | |
| System | 2,118,136 | 1,268,801 | 122,653 | −535,110 | 2,974,479 |
| 3.0% of Real Interest Rate | Production (kWh/Year) | Fraction | 1.5% of Real Interest Rate | Production (kWh/Year) | Fraction |
| PV array | 6,227,571 | 31% | PV array | 6,227,571 | 31% |
| Wind turbines | 13,554,660 | 69% | Wind turbines | 13,615,956 | 69% |
| Grid purchases | 0 | 0% | Grid purchases | 0 | 0% |
| Total | 19,782,230 | 100% | Total | 19,843,526 | 100% |
| Load | Consumption (kWh/Year) | Fraction | Load | Consumption (kWh/Year) | Fraction |
| AC primary load | 7,403,611 | 73% | AC primary load | 7,403,606 | 73% |
| Grid sales | 2,761,111 | 27% | Grid sales | 2,776,660 | 27% |
| Total | 10,164,722 | 100% | Total | 10,180,266 | 100% |
| Quantity | Value (kWh/Year) | Quantity | Value (kWh/Year) | ||
| Excess electricity | 7,794,651 | Excess electricity | 7,839,553 | ||
| Unmet load | 5840 | Unmet load | 5845 | ||
| Capacity shortage | 7395 | Capacity shortage | 7400 | ||
| Renewable fraction | 1.00 | Renewable fraction | 1.00 |
| 3.0% of Real Interest Rate | Energy Sold (kWh) | Energy Charge ($) | 1.5% of Real Interest Rate | Energy Sold (kWh) | Energy Charge ($) |
|---|---|---|---|---|---|
| January | 315,753 | −34,733 | January | 316,334 | −34,797 |
| February | 320,229 | −35,225 | February | 320,814 | −35,290 |
| March | 295,690 | −32,526 | March | 297,781 | −32,756 |
| April | 222,805 | −24,509 | April | 224,242 | −24,667 |
| May | 160,620 | −17,668 | May | 162,134 | −17,835 |
| June | 100,808 | −11,089 | June | 102,353 | −11,259 |
| July | 187,910 | −20,670 | July | 188,652 | −20,752 |
| August | 211,874 | −23,306 | August | 212,542 | −23,380 |
| September | 153,819 | −16,920 | September | 154,920 | −17,041 |
| October | 232,600 | −25,586 | October | 233,785 | −25,716 |
| November | 195,519 | −21,507 | November | 197,609 | −21,737 |
| December | 363,484 | −39,983 | December | 365,494 | −40,204 |
| Annual | 2,761,111 | −303,722 | Annual | 2,776,660 | −305,433 |
| 3.0% of Real Interest Rate | 1.5% of Real Interest Rate | ||
|---|---|---|---|
| Pollutants | Emissions (kg per Year) | Pollutants | Emissions (kg per Year) |
| Carbon dioxide | 1,745,022 | Carbon dioxide | 1,754,849 |
| Sulfur dioxide | 7565 | Sulfur dioxide | 7608 |
| Nitrogen oxides | 3700 | Nitrogen oxides | 3721 |
© 2016 by the authors; licensee MDPI, Basel, Switzerland. This article is an open access article distributed under the terms and conditions of the Creative Commons Attribution (CC-BY) license (http://creativecommons.org/licenses/by/4.0/).
Share and Cite
Park, E.; Han, T.; Kim, T.; Kwon, S.J.; Del Pobil, A.P. Economic and Environmental Benefits of Optimized Hybrid Renewable Energy Generation Systems at Jeju National University, South Korea. Sustainability 2016, 8, 877. https://doi.org/10.3390/su8090877
Park E, Han T, Kim T, Kwon SJ, Del Pobil AP. Economic and Environmental Benefits of Optimized Hybrid Renewable Energy Generation Systems at Jeju National University, South Korea. Sustainability. 2016; 8(9):877. https://doi.org/10.3390/su8090877
Chicago/Turabian StylePark, Eunil, Taeil Han, Taehyeong Kim, Sang Jib Kwon, and Angel P. Del Pobil. 2016. "Economic and Environmental Benefits of Optimized Hybrid Renewable Energy Generation Systems at Jeju National University, South Korea" Sustainability 8, no. 9: 877. https://doi.org/10.3390/su8090877