1. Introduction
The concept of kinetic façade is that buildings are designed to allow parts of the envelope to move in order to respond to environmental conditions. One of the building elements which are widely used to form a kinetic façade is the exterior movable shading devices. These devices are used on buildings and, with designated control strategies, control the solar radiation entering through the building façade, which can result in impact on energy load of a building [
1,
2]. In particular, the use of such devices can potentially affect the heating and cooling energy demand and lighting energy requirement within a building [
3,
4].
Many studies have been carried out to assess the impact of movable shading devices on energy demand. In early studies, heat and energy performances have been assessed when a building is fitted with roll blinds, horizontal shading devices, vertical shading devices, and Venetian shading devices. By using a simulation program that can selectively apply a basic shading device to the façade of a building, relatively accurate and quantitative energy performance analysis was possible as the simulation programs use numerical analysis methods [
5,
6,
7,
8,
9]. However, most programs used only climate data as input parameters and not using any parameters related to the movement of the shading devices.
More recently, there have been efforts to consider elements caused by various movements of shading devices when one calculates the building’s heating and cooling load and lighting energy requirement. The dynamic energy simulation programs such as EnergyPlus allows the user to set the control strategies of movable shading devices when calculating the heating and cooling energy demand of a building. The driving parameters in establishing control strategies of shading devices include solar radiation, illuminance, temperature, thermal demand, and glare indices. The user can select one of these and the relevant operational scenario of the shading device is reflected in the energy calculation. However, the program only allows the shading position to be either “fully closed” or “fully open” [
10], and this can result in excessive heat energy or light energy. For example, if a shading device is set to be fully closed with the reference to the solar radiation, although the solar heat gain during the cooling period can decrease, lighting energy demand can be excessive.
Various parameters allowing the operation of shading devices were defined and various control strategies were developed in order to describe the changes of shading position [
10,
11,
12,
13]. A. Tzempelikos et al. [
11] compared the differences in thermal and lighting energy performance of a façade depending on various shading device control strategies such as solar radiation, illuminance, and glare. The study showed that a maximum difference of 50% can occur, depending on the control strategies of a shading device, in the annual lighting energy requirement of a façade where roll blinds are installed. In other studies [
12,
13,
14], a method of dividing the movements of a shading device into several steps having equal intervals has been used to describe the position changes by the operation of a shading device.
In the study carried out by C. du Montier et al. [
12], the position changes of three shading devices, i.e., sliding panel, vertical folding panel, and horizontal folding panel, were divided into four steps, and through the Integrated Environmental Solutions’ Virtual Environment (IES VE) program, the thermal and lighting energy consumptions were derived for each shading device. In addition, through the derived thermal and lighting energy performance evaluation, optimal operation scenario guidelines were proposed for each shading device type according to the change in time. Therefore, when the energy performance of a movable shading device is taken into consideration, the control strategies of the shading device must be established by considering both shading performance for controlling solar heat gain and daylight performance for using natural lighting. To optimally control the thermal and lighting energy of a shading device, the position changes by the operation of the shading device have to be described, and the operation scenario of the shading device according to the change in time must be reflected in the calculation equations of annual heating and cooling and lighting energy requirements.
The purpose of the study described in this paper is to propose a calculation methodology which can evaluate the thermal and lighting energy performance of movable shading devices, which can be used to facilitate the development of optimal operation scenario. Firstly, a calculation method was proposed which can assess the primary energy of annual heating/cooling and lighting taking the movements of shading devices into account. In the next stage, a solar heat gain calculation method and lighting energy requirement calculation method were derived which consider five key variables describing the movable shading device. Then an optimal operation scenario method of a movable shading device was suggested which can minimize the solar heat gain and lighting energy requirement. Finally, the calculation process was developed which can evaluate the primary energy consumption of thermal and lighting at the façade where a movable shading device is installed, considering heat transfer, heat gain, and infiltration heat gain. The effectiveness of the calculation methods proposed in this paper was reviewed by comparing the annual primary energy consumptions of heat and light depending on three control strategies of a drop awning.
2. Effect of Shading Devices on Thermal and Lighting Energy
An external movable shading device controls the solar radiation entering through windows and affects the solar heat gain and the lighting energy requirement. In order to take the position changes of a movable shading device into account when calculating the solar heat gain and lighting energy requirement, variables that describe the shading position changes must be defined. In this section, calculation methods are presented which considers the solar heat gain and lighting energy requirement through the façade where an external movable shading device is installed. Variables defining the position and the materials of the shading device were also defined and the calculation equations were established using these parameters.
2.1. Solar Heat Gain
When solar radiation is incident on a glass surface of a window, the resistance performance of the glass surface for the solar heat gain is called the Solar Heat Gain Coefficient,
, and it is expressed as a dimensionless number having a value between 0 and 1. Solar radiation is incident on the glass surface in the form of direct solar radiation having directivity and of diffuse solar radiation having no directivity.
is divided into two types according to the type of solar radiation. The
for direct solar radiation is expressed as
, and
for diffuse solar radiation as
. Therefore, the calculation of solar heat gain through a window where no shading device is installed is as follows:
where
is solar heat gain through the window.
and
are direct and diffuse radiation on the façade.
When a movable shading device is installed outside of a window, the heat gain by direct and diffuse solar radiation varies depending on the type of device according to shading position changes and material properties. The variables relevant to the types and the material properties of shading devices include unshaded fraction (
) and exterior solar attenuation coefficient (
EAC), which have been proposed by the American Society of Heating, Refrigerating, and Air-Conditioning Engineers (ASHRAE) [
15], as follows:
Unshaded fraction (
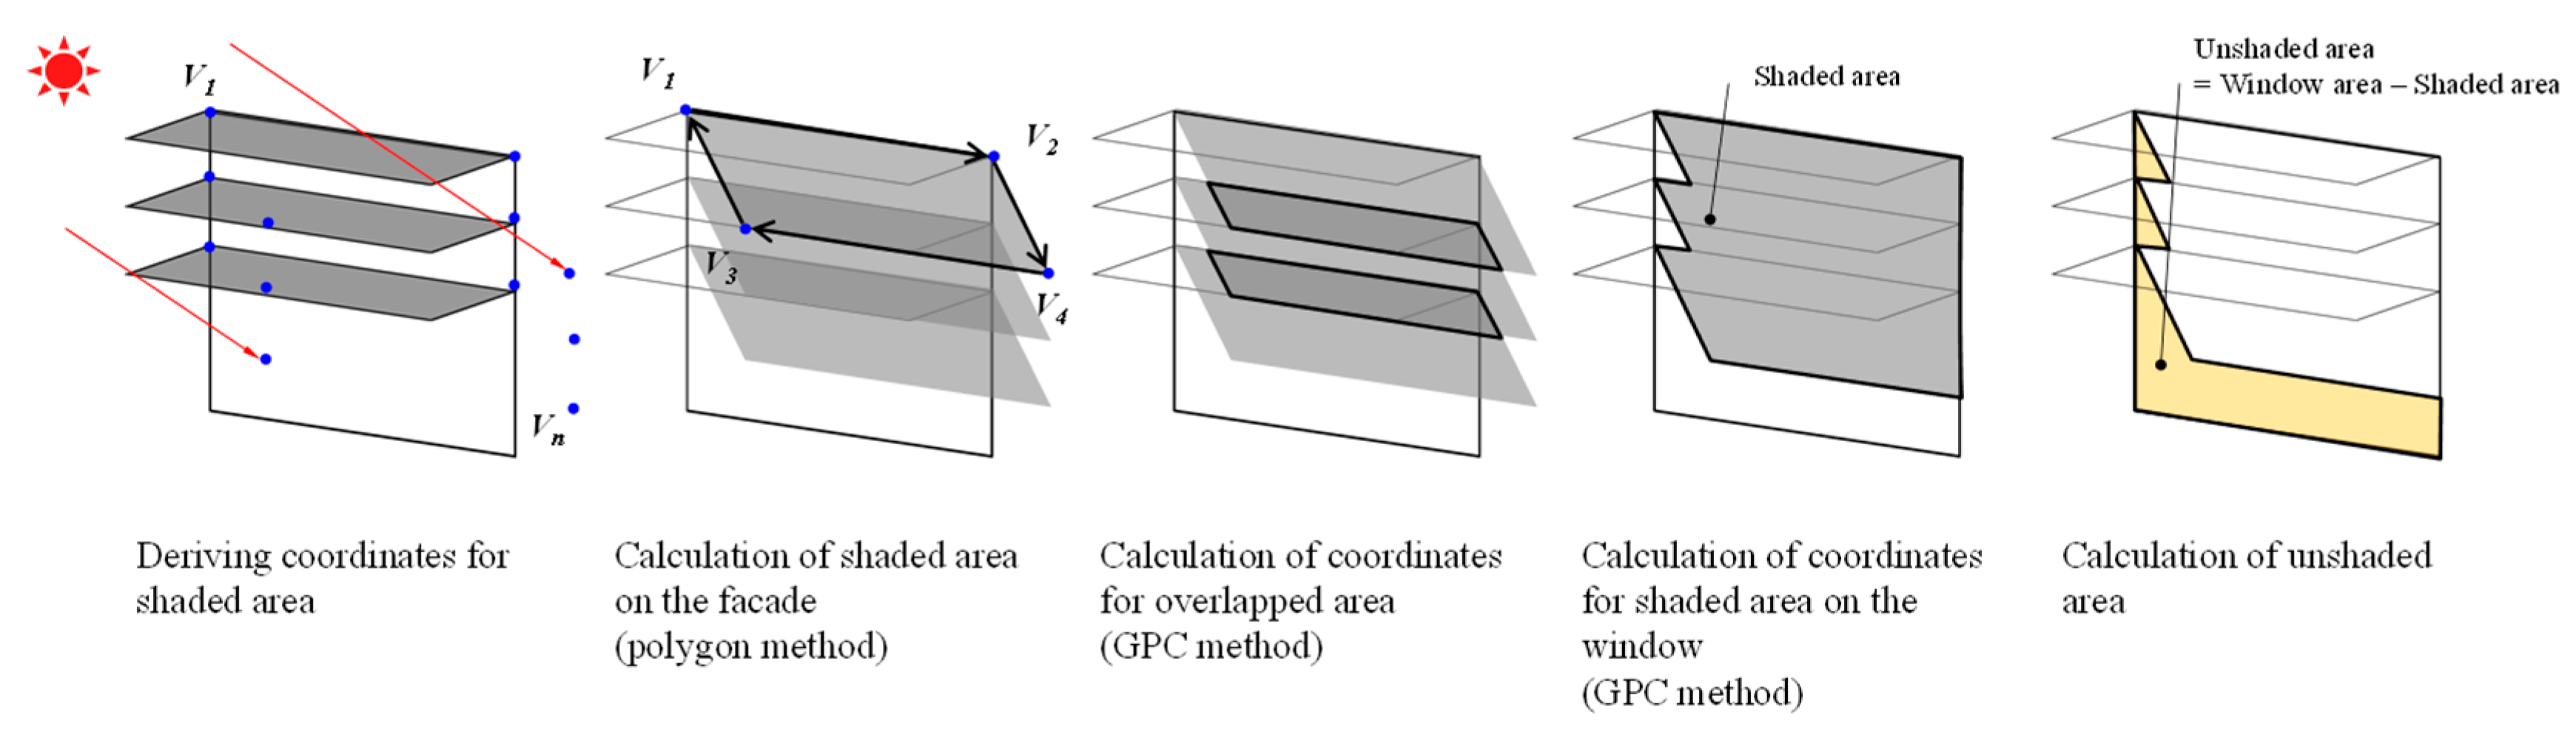
) is a coefficient for distinguishing the shaded area and unshaded area formed on a window by direct solar radiation and indicates the proportion of solar incidence area to the total window area. It has a value between 0 and 1, and when the shaded area on the window becomes larger, the
moves closer to 0.
is calculated through the shaded area formed on the window as shown in
Figure 1. Accurate methods of calculating the shaded area have been proposed in conventional studies [
16,
17,
18,
19] using the sun’s vector and the position coordinates of a shading device and a window. In the study by Y.Y. Kim et al. [
16], a method of deriving shaded coordinates generated on the façade surface was proposed, which uses the sun’s vector, the shading device’s position coordinates, and the window’s position coordinates. F. Feito et al. [
18] proposed a planar-polygon method, which calculates the polygon area by connecting the coordinates of a plane. In the study carried out by A. Murta et al. [
19], general polygon clipper (GPC) was proposed, which is an intersection calculation method for two or more polygons. The calculation method of A. Murta et al. subtracts an overlapped shaded area from the total shaded area when shade is produced on a glass surface through multiple slats such as a louver, and is applied in a calculation process of subtracting a shaded area formed outside of the window boundary. Therefore, the unshaded fraction can be derived through the calculation of the shaded area formed on the window.
Exterior solar attenuation coefficient (
EAC) is a coefficient showing the quantitative proportion of external solar radiation passing through a shading device, and it is applied in the calculation of solar heat gain through the window where a shadow is cast. It has a value between 0 and 1. As the
EAC moves closer to 0, the solar radiation passing through the shading device becomes smaller.
EAC is calculated by using the transmittance and reflectance [
15]. The transmittance means a proportion of direct and diffuse solar radiation incident from the exterior passing through the material surface, and the reflectance means the proportion reflected from the front/back side of a shading device. The calculation method of
EAC is given by Equation (2).
where
is front directional-hemispherical transmittance of the shading layer.
and
are front and back directional-hemispherical reflectance of shading layer. The notation
means the hemispherical average of the quantity over all incident directions, i.e., “diffuse”.
For the heat gain calculation by direct solar radiation, the unshaded fraction () and exterior solar attenuation coefficient (EAC) need to be taken into consideration. is applied only in the calculation of heat gain by direct solar radiation, and the unshaded area and shaded area of a window surface by direct solar radiation are divided. Since the direct solar radiation incident on the unshaded area is not affected by the shading device, only the value of a window is applied to the heat gain calculation. For the shaded area, to consider the solar radiation incident from passing through the shading device, EAC of the shading device is applied. Since the penetrated solar radiation is gained in a diffused form through the window, the heat gain is calculated by applying solar heat gain coefficient for diffuse solar radiation ().
The diffuse solar heat gain calculations are divided into two calculation methods according to the types of fixed shading device. In the case of an installed horizontal or vertical shading, it is assumed that the solar radiation is incident on the window without any decrease, and here the solar heat gain is calculated by considering
alone [
15]. In the case of an exterior shading device installed parallel to the window surface such as blinds,
EAC is applied to consider the solar radiation incident on the window after passing through the shading device. In the conventional diffuse solar heat gain calculation method [
17], an additional variable is necessary to reflect various shapes according to the shading position changes. For example, in the case of a window completely covered by blinds when the window is seen from the front,
EAC is applied to the diffuse solar heat gain calculation method, but for the window area exposed to the outdoors according to the positions of the blinds,
EAC must not be applied. In the conventional calculation method, it was assumed that the diffuse solar radiation by direction is incident on a façade surface at the incidence angle of 0 degrees [
20]. When this is taken into account, the diffuse solar heat gain can be calculated by dividing the exposed and unexposed parts of a window. In this study, an additional variable was applied to divide the exposed area and unexposed area of a frontward facing window according to the operation steps of a movable shading device, and this additional variable was the exposure coefficient (
Ce), defined as follows:
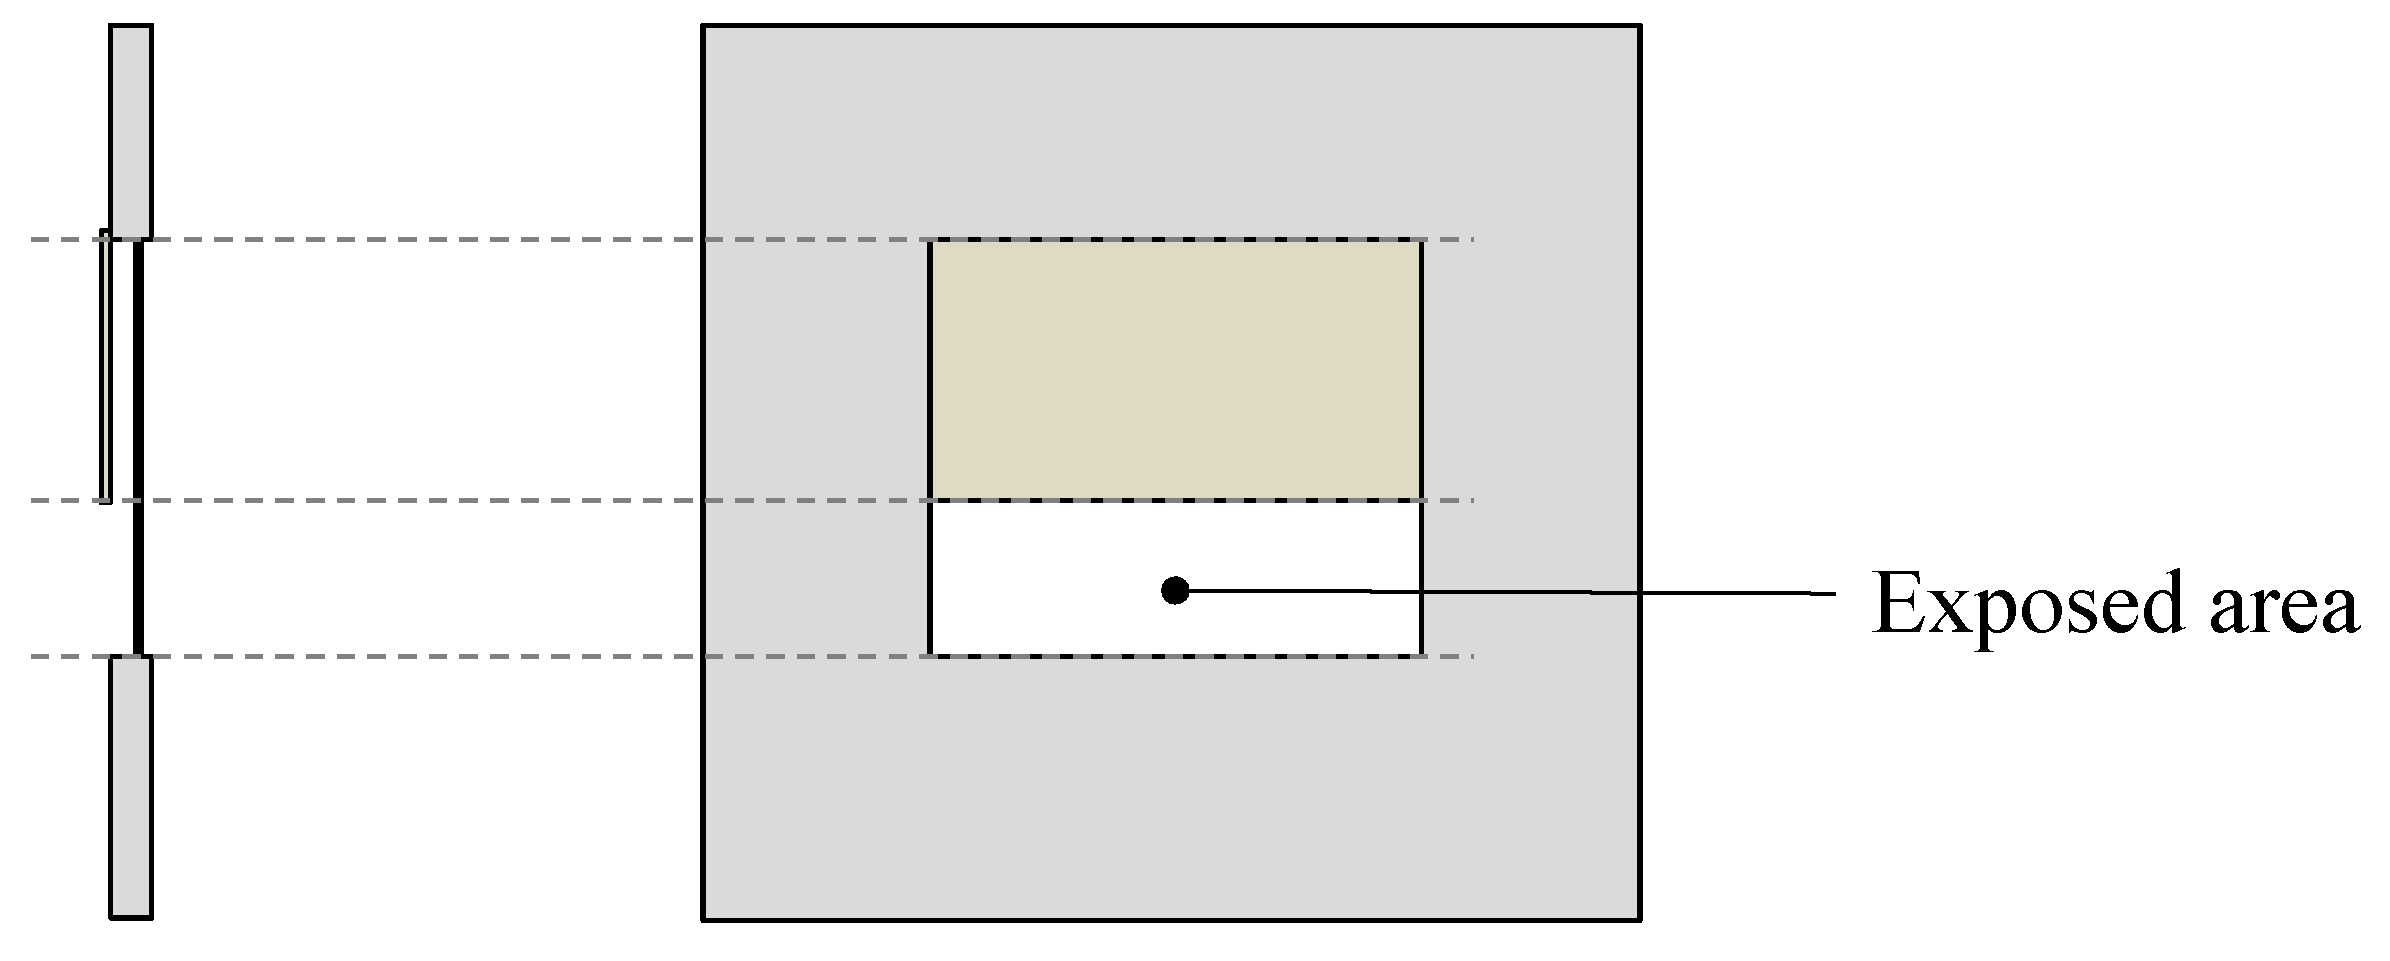
Exposure coefficient (
Ce) is a coefficient for dividing the exposed area and unexposed area of a window for diffuse solar radiation, and it is expressed as a proportion of the exposed area of the façade (front side) in the total area of the window. It has a value between 0 and 1, and as it moves closer to 1, the exposed area of a window (when seen from front) becomes larger (see
Figure 2).
In order to derive the total heat gain calculation equation reflecting the various positions of a movable shading device, the additional exposure coefficient derived from the diffuse solar heat gain calculation was applied. The total solar heat gain calculation equation is shown as Equation (3), in which variables for three types of heat energy performance were applied in the direct and diffuse solar heat gain calculation method.
2.2. Lighting Energy Requirements
When natural lighting and indoor lighting are used simultaneously, lighting energy use varies depending on whether the required illuminance is supplied to the indoor working plane through natural lighting. The daylight factor (
D) is defined as a proportion of illuminance on an indoor working plane for the exterior diffuse illuminance on the horizontal plane, and the illuminance on the indoor working plane supplied through natural lighting can be calculated through the daylight factor. EN 15193, Energy performance of buildings: Energy requirements for lighting, 2007 [
21], defines the calculation method to obtain the daylight factor for a daylight area. An indoor zone can be divided into daylight area and non-daylight area. A daylight area means an area where required illuminance can be supplied to an indoor working plane through natural lighting, and a non-daylight area is the area where required illuminance is supplied through artificial lighting regardless of natural lighting. A daylight area varies depending on the zone’s dimensions and window opening’s size and position [
21].
Since lighting energy is always used in a non-daylight area, the daylight factor is used only for the working plane illuminance calculation of a daylight area. According to EN 15193, the daylight factor is calculated through transparency index (
), depth index (
), and light transmittance of a window (
). The daylight factor calculation method for the façade where no shading device is installed is shown in Equation (4).
When a movable shading device is installed on the exterior of a window, the daylight factor varies depending on the shading device’s position and the material properties. As a variable for the shading position, there is an obstruction index (
IO), and as a variable for the physical property, there is light transmittance of shading (
τsh). The obstruction index is provided in EN 15193 [
21], and the variable for light transmittance of shading is provided in EN 13363-1 [
22]. They are defined as follows:
Obstruction index (
IO) is a coefficient for expressing the degree of obstruction by a shading device for the diffuse illuminance incident on the window, and has a value between 0 and 1. It is calculated according to the angles formed from the center of a window to the edge of the horizontal and vertical shading devices and the window plane. The obstruction index has a value closer to 0 as the window size decreases and the protruded length of the shading device increases, and has a value closer to 1 as the window area increases and the protruded length of the shading device decreases.
Light transmittance of shading (
) is a value that changes according to the transmittance and reflectance of the materials of a shading device, and is a coefficient expressing the degree of light transmittance for the shading device. It has a value between 0 and 1, and as it becomes close to 1, the transmittance for light of the shading device increases.
where
is the visual transmittance of the shading layer, and
and
are front and back directional visual reflectance of shading layer.
In the calculation method of the daylight factor, the exposure coefficient (Ce) was applied to reflect the change in the length of operation parallel to the window. In the case of IO, the shading device reflects the change in the length of protrusion in the forward-facing direction from the window, and (Ce) reflects the change in length of the shading device operated parallel to the window.
In EN 15193, a daylight factor calculation method applying the obstruction factor of the shading device was proposed. In the daylight factor equation, the light transmittance of shading and exposure coefficient proposed in EN 13363-1 were also applied. Therefore, the daylight factor (
) equation applying the three aforementioned variables for light energy was derived as shown in Equation (9). The illuminance on the indoor working plane can be calculated by multiplying the exterior diffuse illuminance on the horizontal plane and the daylight factor. The illuminance on the indoor working plane supplied from the exterior diffuse illuminance on the horizontal plane can be calculated using Equation (10).
where
is the exterior diffuse illuminance on the horizontal plane, and
is the illuminance on the task plane.
The lighting energy requirement can be calculated by multiplying the lighting power density (
LPD) and the floor space area [
23]. When calculating the lighting energy requirement, in order to determine whether the lighting is to be used for the daylight area, a determination coefficient for satisfaction/non-satisfaction of the required illuminance for the indoor working plane illuminance was applied. Therefore, the lighting energy requirement formula for the daylight area and non-daylight area of the total floor space can be expressed as follows:
The working plane illuminance for the daylight area () is calculated by multiplying the external diffuse illuminance on the horizontal plane and the daylight factor, and when the working plane illuminance of the daylight area does not satisfy the set illuminance value, artificial lighting energy is used in both the daylight area and non-daylight area (). When the illuminance on the working plane of the daylight area satisfies the required illuminance by daylight, only the lighting energy for the non-daylight area is used.
3. Shading Operation Scenario
This section proposes an optimal operation scenario calculation method for a movable shading device. In order to arrive at the optimal operation scenario, major climate and façade factors were derived for the total energy calculation of the façade where shading devices were installed. Moreover, in the solar heat gain and lighting energy requirement calculations, five key variables, i.e., unshaded fraction (Fu), obstruction index (IO), exterior solar attenuation coefficient (EAC), light transmittance (τsh), and exposure coefficient (Ce), which vary depending on the operation of the shading devices were derived. To describe the position changes by the operation of the shading device, the operation of the shading device were divided into 10 steps, and the shading position setting method was derived for each step. In addition, an optimal operation step-setting method was derived by time for calculating the annual optimal operation scenario of the shading device. Finally, the thermal and lighting energy calculation process was derived for the façade where an external movable shading device is installed.
3.1. Factors for Total Energy Calculation Methods
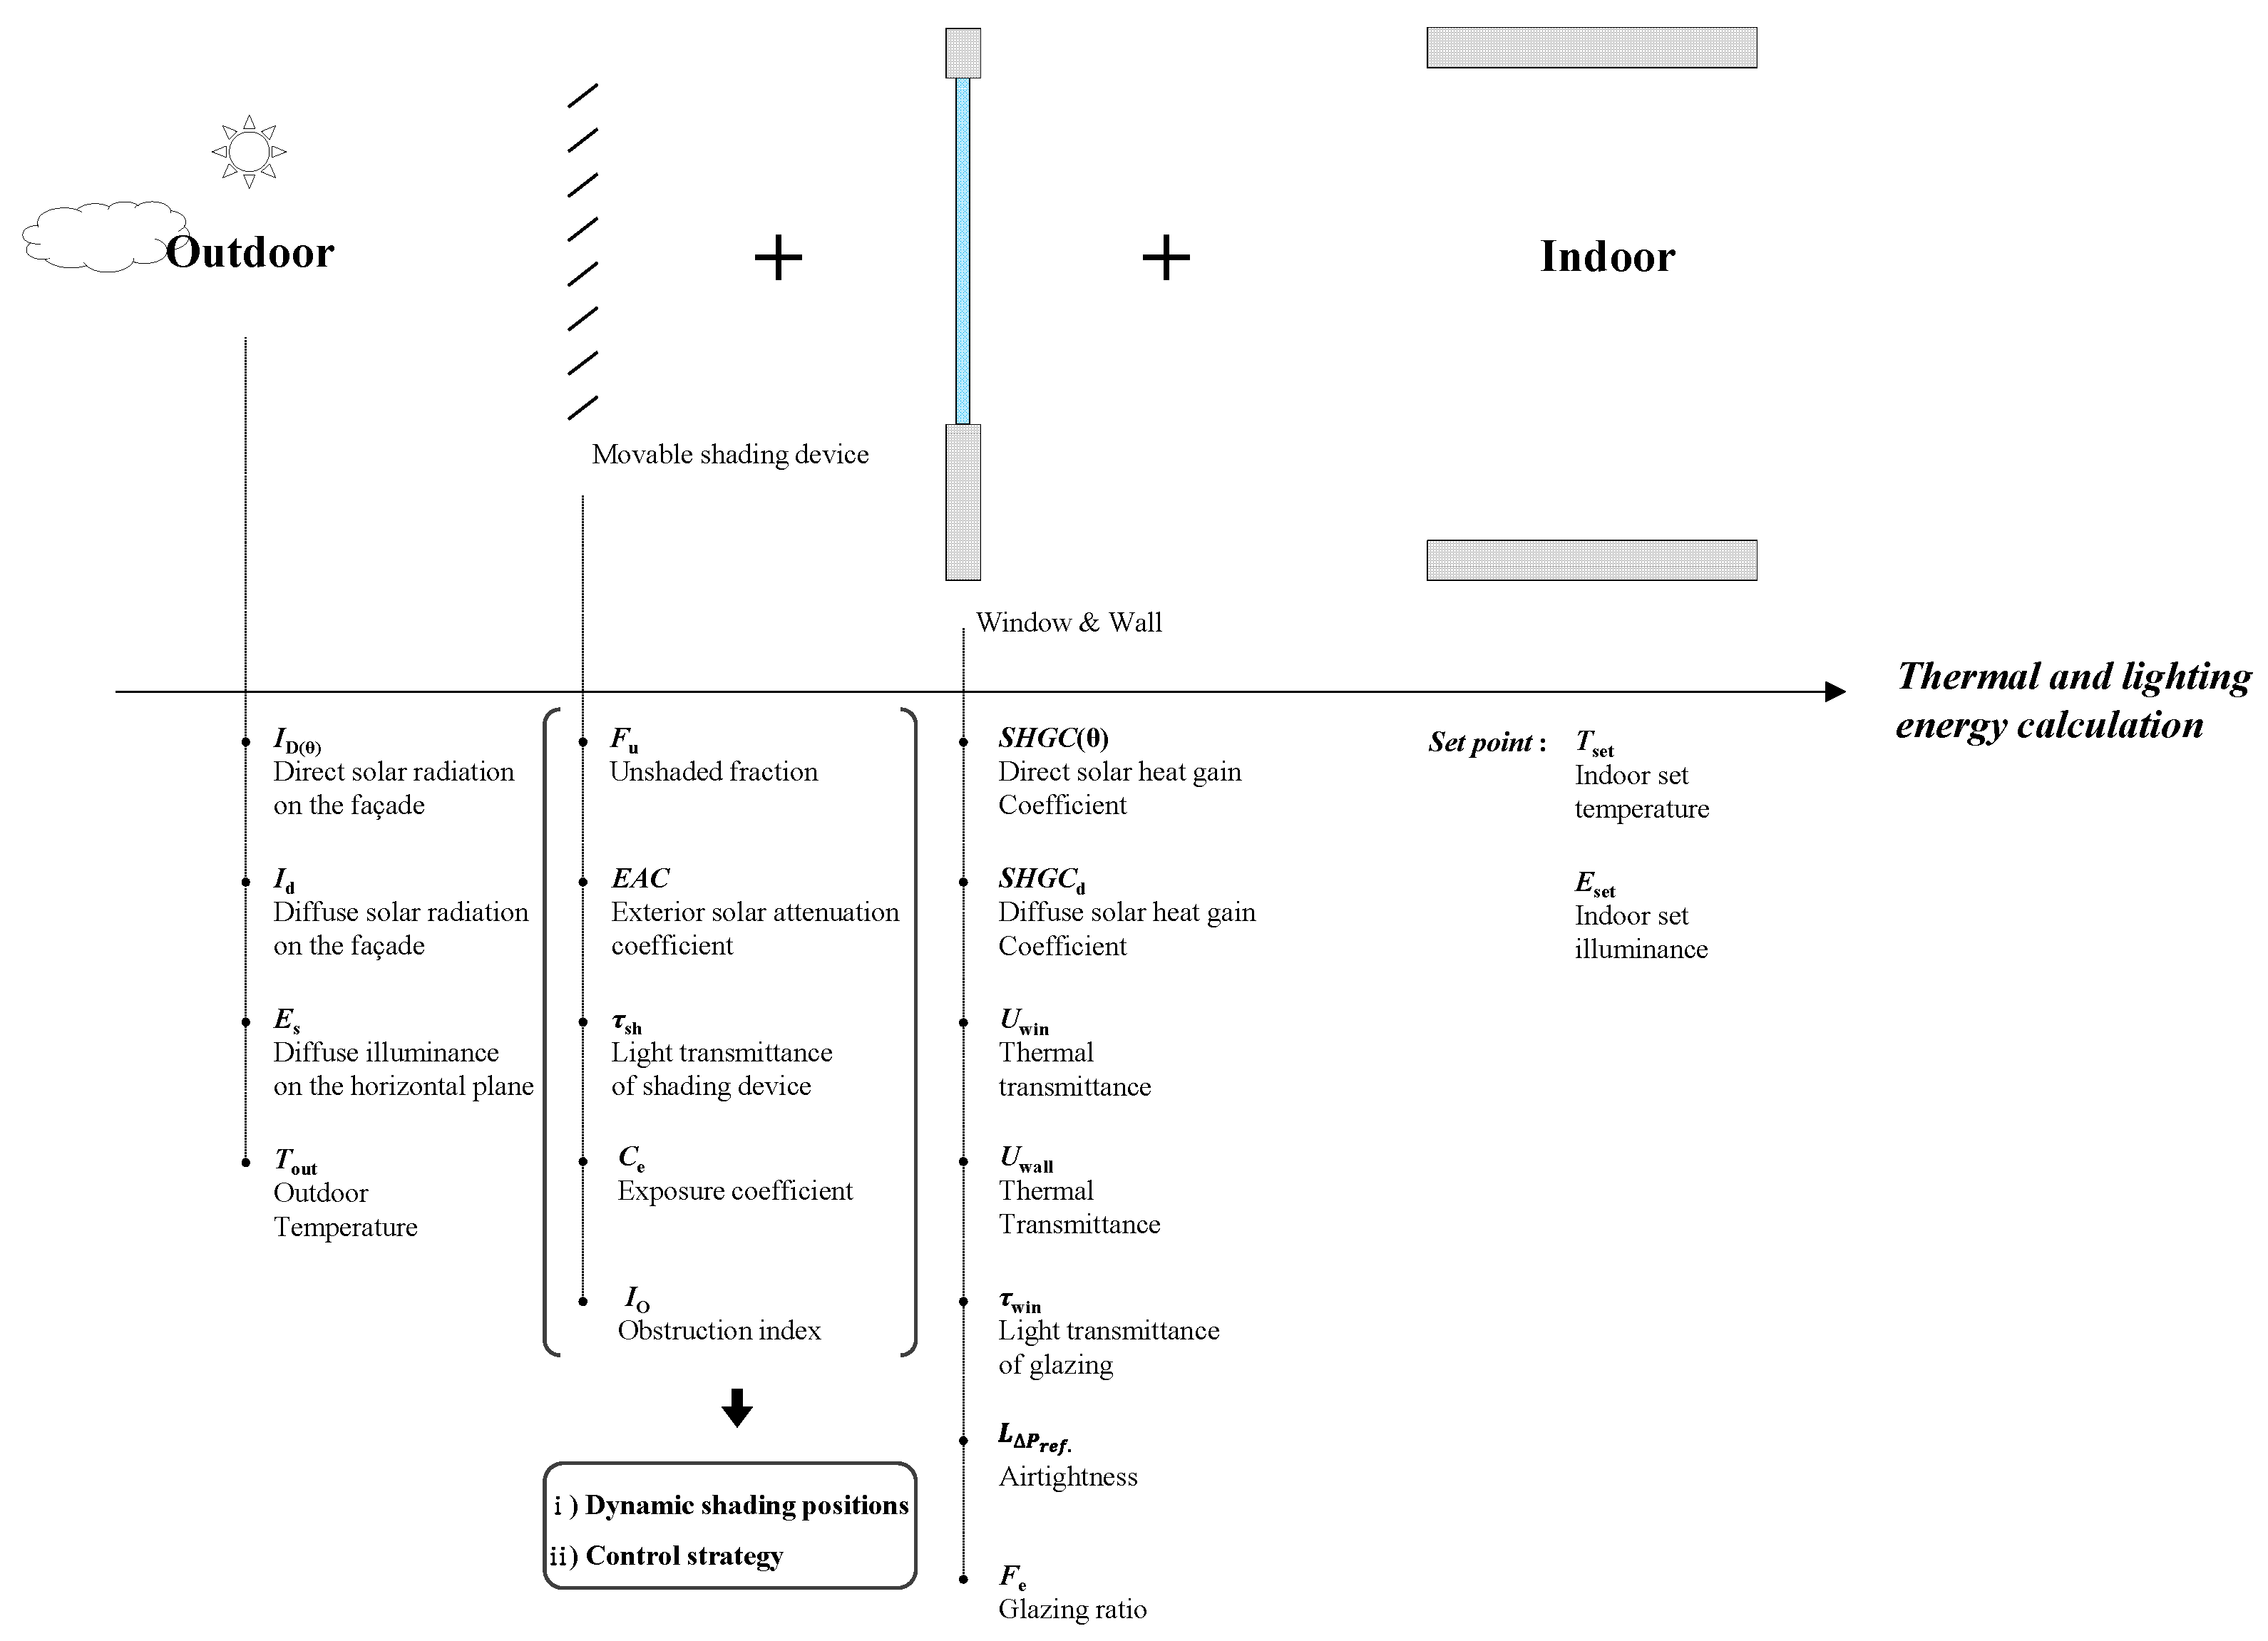
The thermal and lighting energy acquired through the building façade is generated in the process of the façade responding to climate conditions.
Figure 3 shows the major climate factors and façade factors for thermal and lighting energy calculations of the façade installed with an external movable shading device. The key factors include ambient temperature, solar radiation, and illuminance from a climate perspective, as well as the various factors of the exterior movable shading device, window, and wall from a building façade perspective. The light energy of the façade is calculated with the indoor lighting energy requirement, and the heat energy of the façade is calculated by adding the heat transfer through the window and wall, solar radiation heat through glass, and gained and lost calories by infiltration. In the heat energy calculation, the movable shading device installed on the exterior of a window does not affect the heat transfer and infiltration heat gain (or loss).
The solar heat gain and lighting energy requirement derived in
Section 2 are calculated differently depending on the five key variables (
Fu,
EAC,
Ce,
τsh, and
IO) of the shading device. The five variables of the shading device change depending on the positions and physical properties of the stationary shading device. In order to consider the position changes of a movable shading device, (i) all possible movements of the shading device need to be divided into multiple steps and the five key variables need to be obtained for each step and (ii) optimal control strategies of the shading device must be prepared according to the heating/cooling periods.
3.2. Setting Shading Positions
Previous studies have proposed various methods to reflect the movement of a shading device in an annual energy calculation [
2,
11,
12,
24,
25]. The capability of accurately describing the movements and the positions of a shading device in these studies, however, was limited because they either divided the operation steps simply into “open” or “close”, or they provided limited number of shading types of which the operation steps can bet set. To capture various movements of various external shading devices in the form of stationary shading positions, it was necessary for all types of shading devices to have the same number of driving intervals.
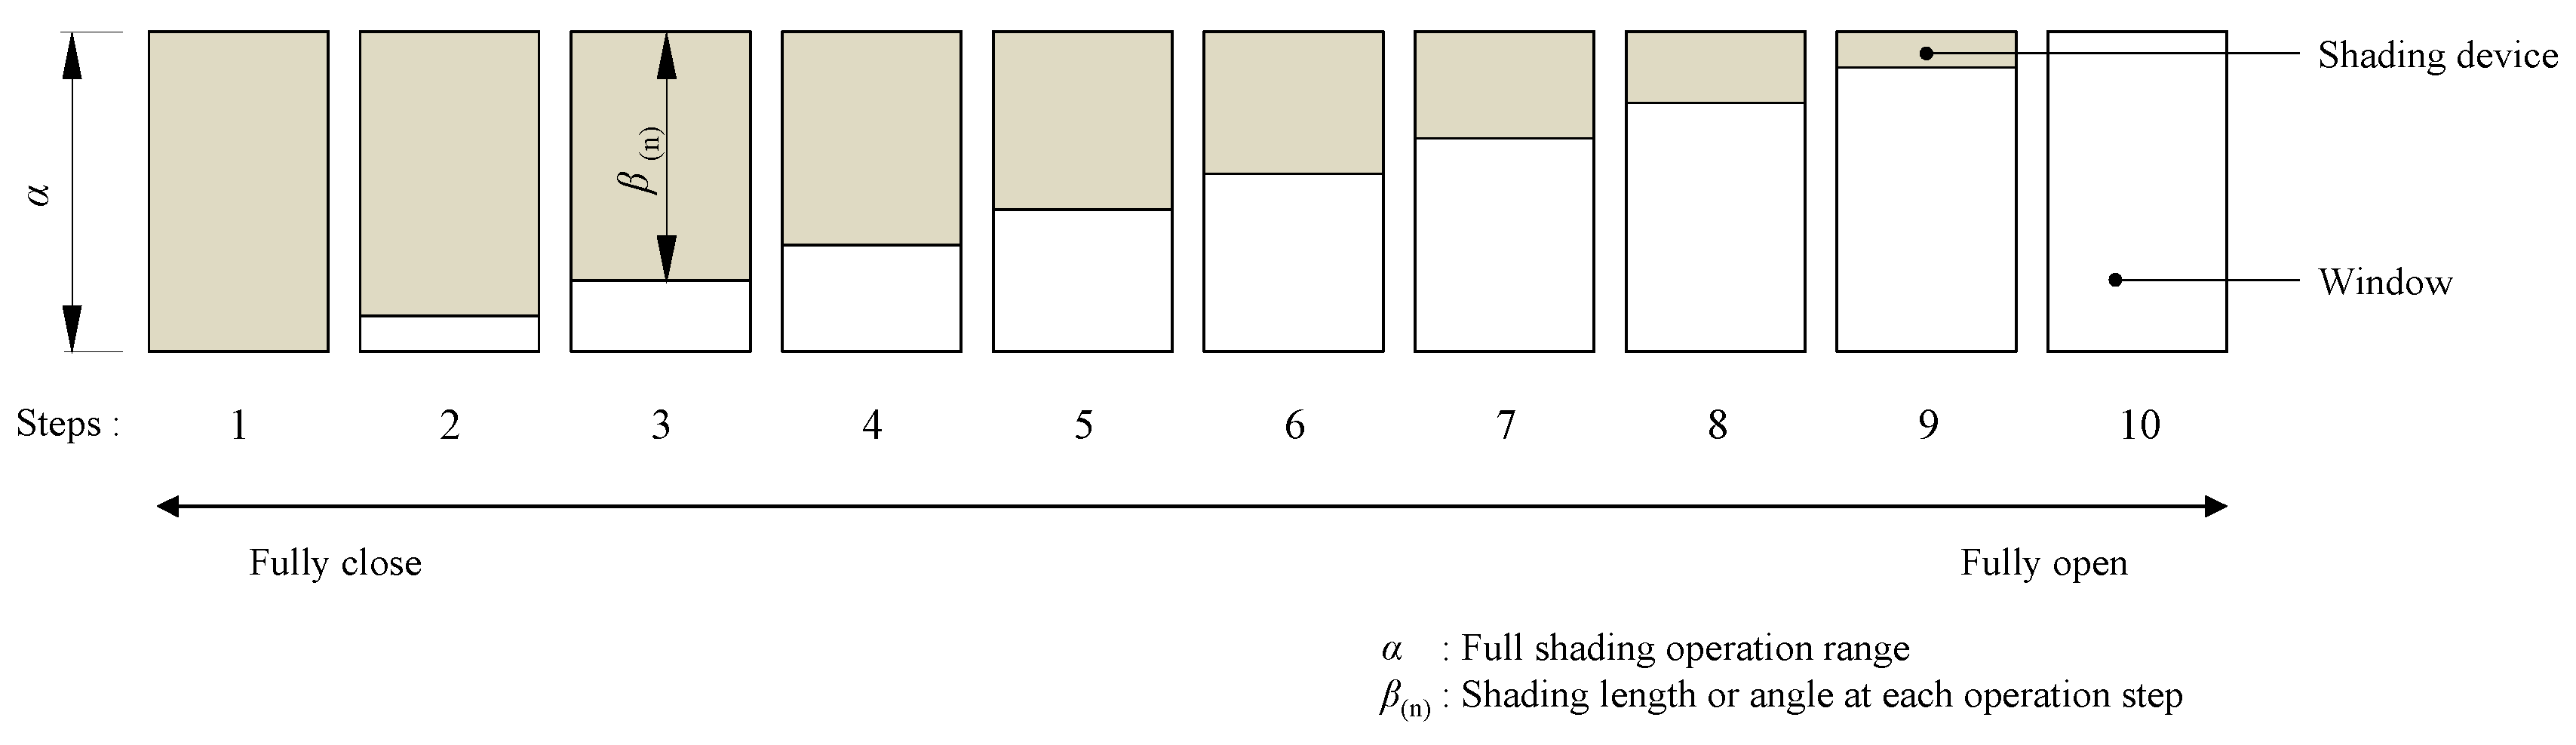
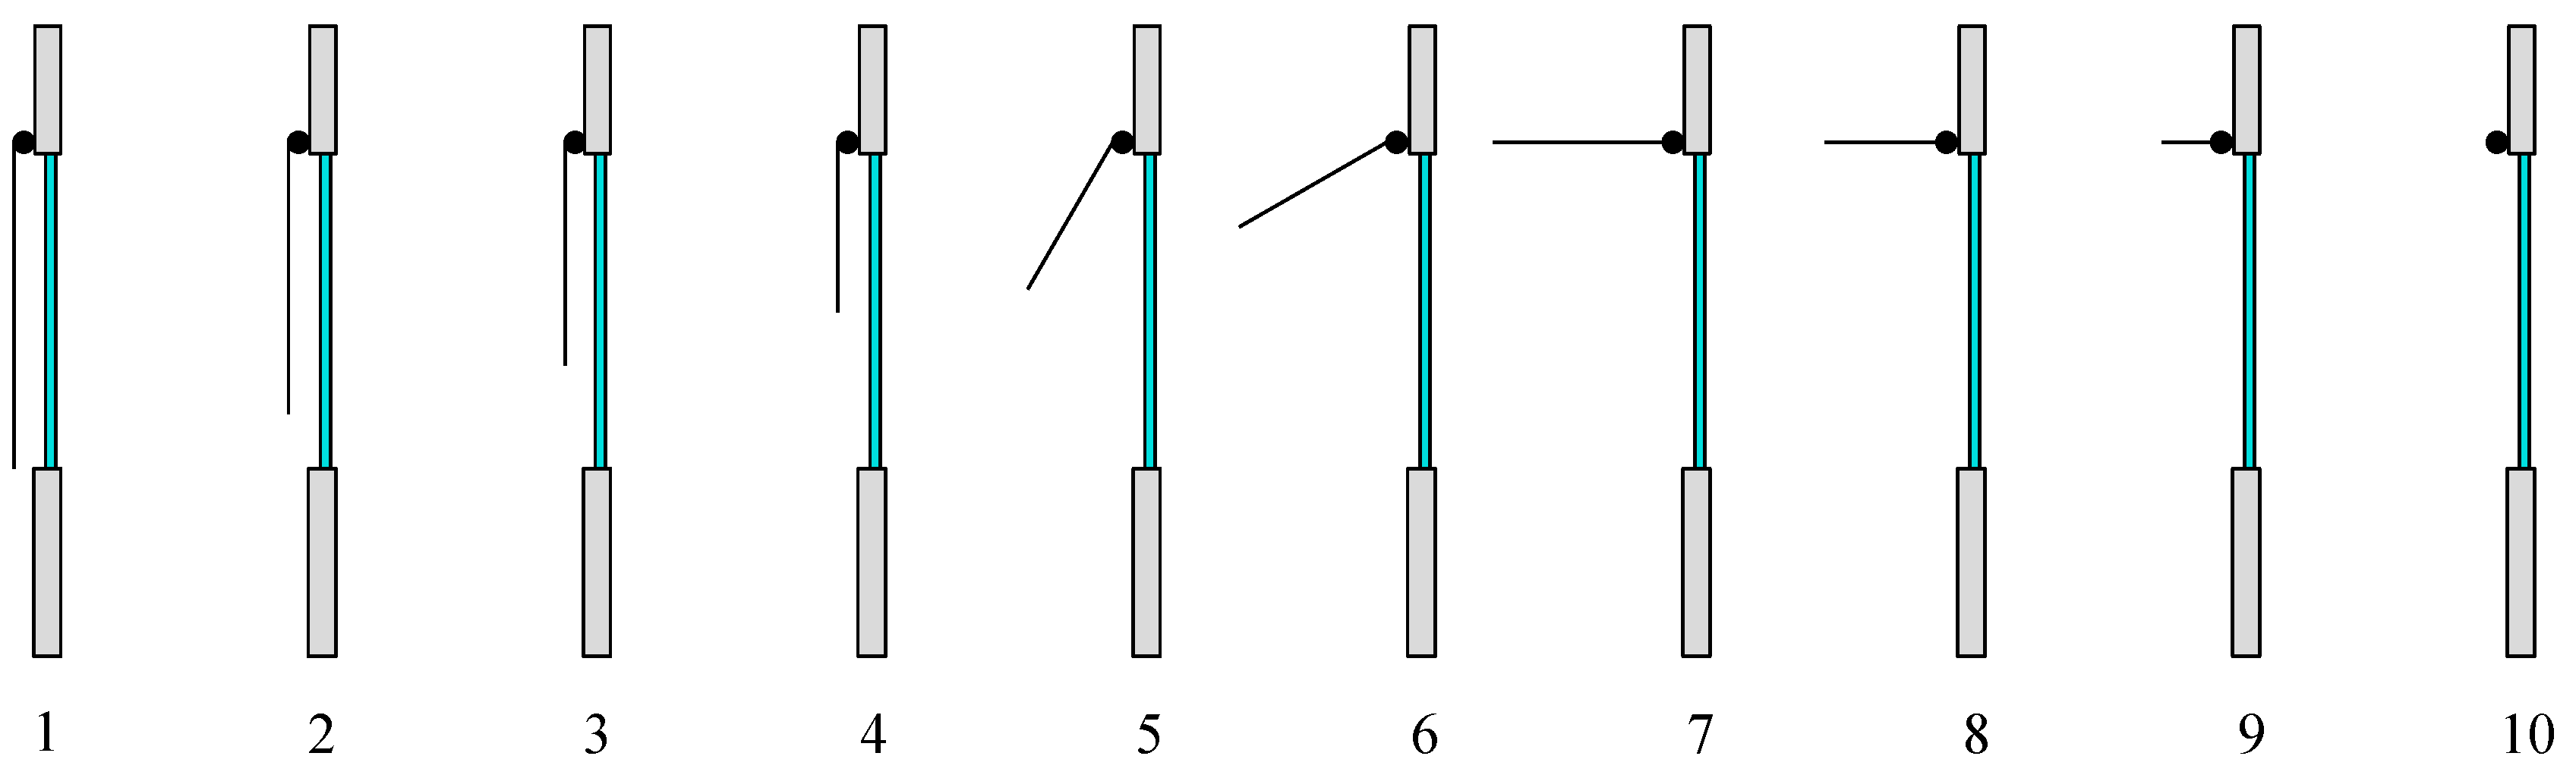
In this study, the movements of the shading device were divided 10 operational steps having equal position displacements as shown in
Figure 4. Step 1 presents “fully closed” state and Step 10 presents “fully opened” state. The operational displacement of a shading device at
nth step is calculated with Equation (12) as follows:
where
is the largest shading operation range which can be length or angle.
Most external movable shading devices use motors having rotational force, but the visible shading position changes can mainly be divided into two types of changes, i.e., angle change or length change. For example, in the case of a shading device having an angle displacement of 180 degrees, the
β(n) value is calculated with 0°, 20°, 40°, 60°, 80°, 100°, 120°, 140°, 160°, and 180° starting from Step 1. Here, 0° represents the fully closed state of a shading device. As shown in
Figure 4, the same approach can be taken when the length of a shading device changes.
Note that the shading position-setting method by operation step discussed in this study can be applied to the shading devices having various operation directions (length and rotation). In the case of a shading device having several simultaneous operation directions, the calculation can be performed by dividing the respective changing sections in the order of operating directions in which the shading device is moving. For example, in the case of changing the length after changing the angle for the shading device (i.e., a drop awning), if the angle changes for the shading device are set from Steps 1 to 5, then by dividing the length change section of the shading device from Steps 5 to 10, the shading positions can be calculated for each step. An application example of a drop awning having three change sections (length-angle-length) is discussed later in this paper.
3.3. Control Strategies for Shading Operation
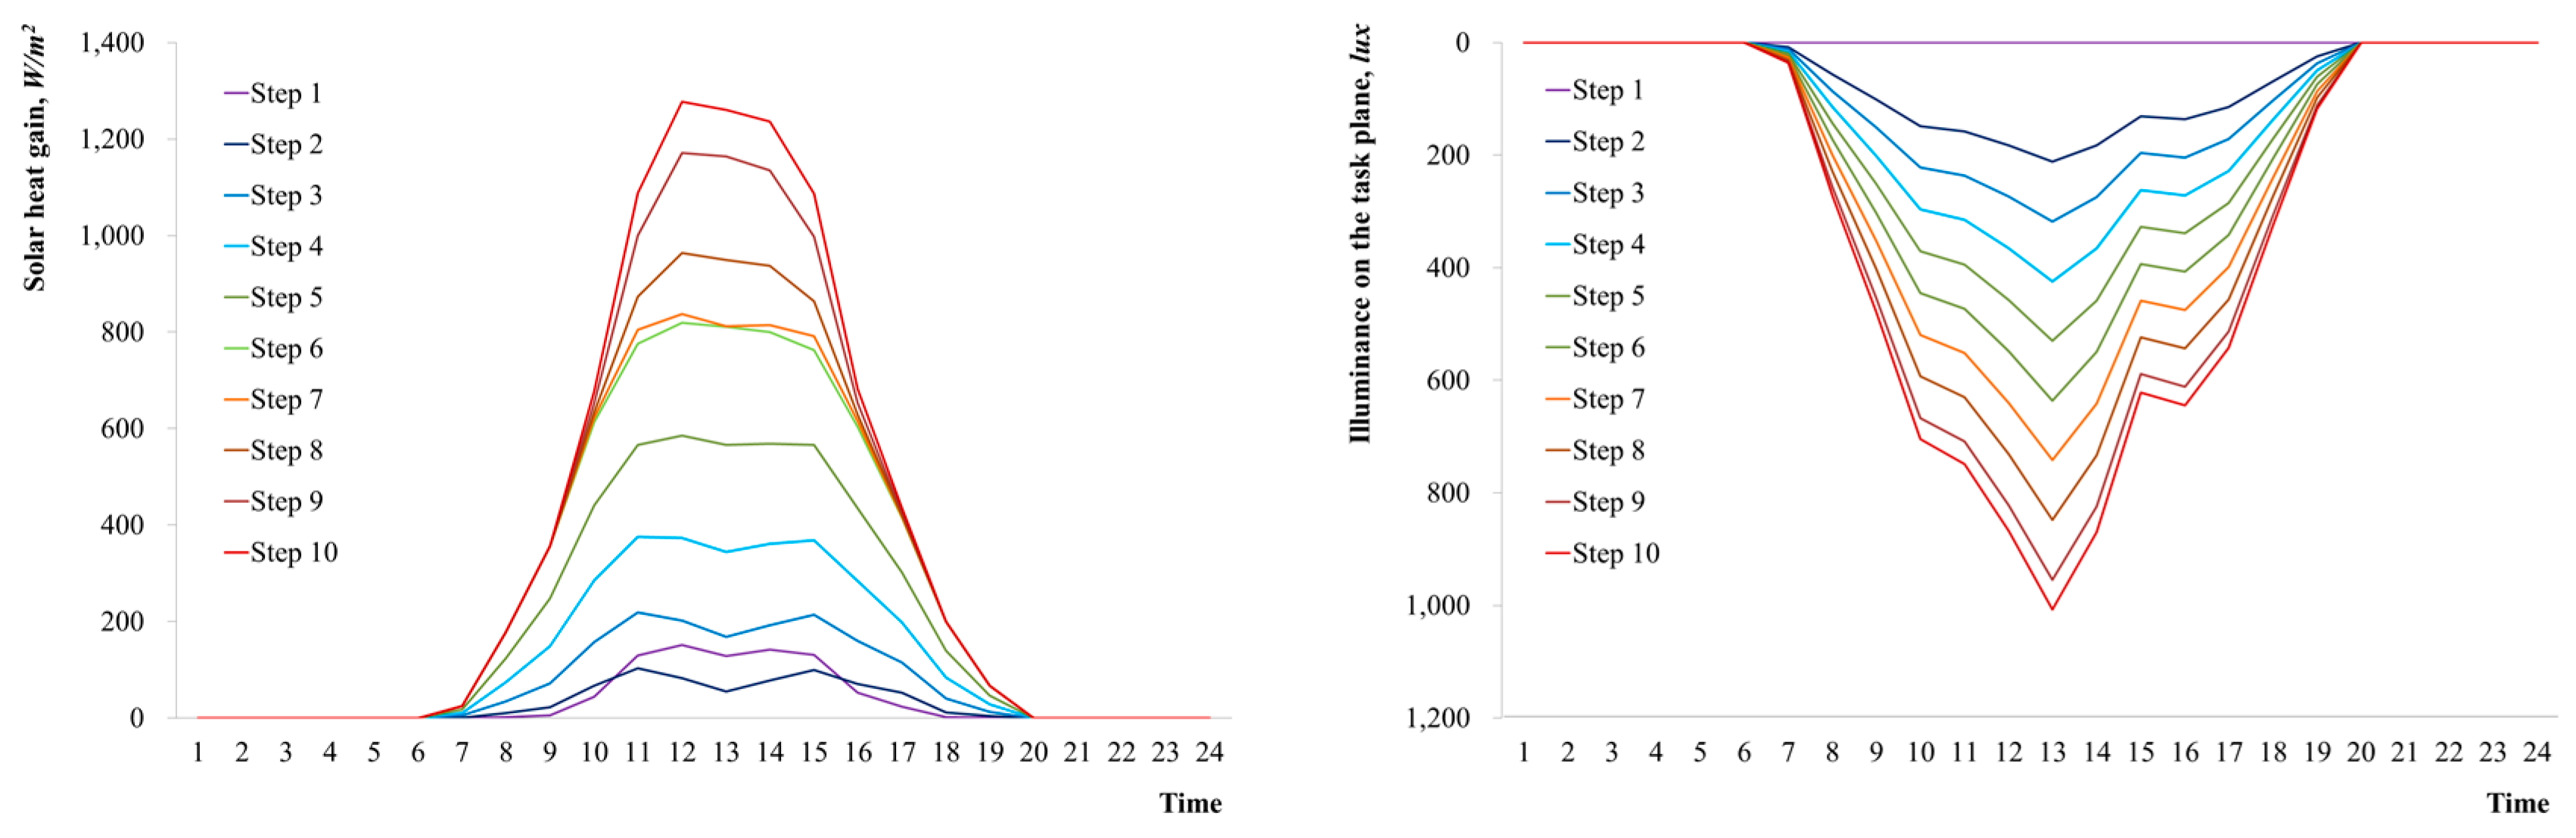
To set an optimal position for an external movable shading device by time, it is necessary to consider the changes in thermal and lighting energy performance by operation step per shading device.
Figure 5 is an example of calculating the solar heat gain and illuminance on an indoor working plane by a horizontal rotational shading device in Seoul on 21 August. When the operation steps of the external movable shading device are taken into consideration, since the external movable shading device has the highest shading performance when it is fully closed, the solar heat gain decreases from Step 10 to Step 1. On the other hand, since the daylight factor is the highest when fully open, the lighting energy requirement decreases from Step 1 to Step 10.
In the lighting energy calculation, lighting energy is always used in the non-daylight area regardless of the shading device’s operation. Therefore, the comparisons of solar heat gain and lighting energy requirements were based on the daylight area affected by shading. Accordingly, the optimal operation step of the external movable shading device was established by comparing the solar heat gain and lighting energy requirement by operation step of the shading device per unit of daylight area. Equation (13) is used to derive the operation step (
) by time.
where
is the chosen operation step for the hour of the year. “
” means the minimum and “
” means the maximum value.
and
are set point temperature and outside temperature.
The heating and cooling energy requirement and lighting energy requirement are converted to the equivalent primary energy of identical resources to enable ease of comparison (the conversion factors for primary energy can vary depending on the type of energy sources). The optimal operation step in the cooling mode is the step in which the total value of solar heat gain and primary energy consumption for lighting is the smallest among the 10 operation steps. The optimal operation step of a pertinent heating time period is fully opened (Step 10), where the effective heat gain of solar radiation is the highest and the lighting energy requirement is the lowest.
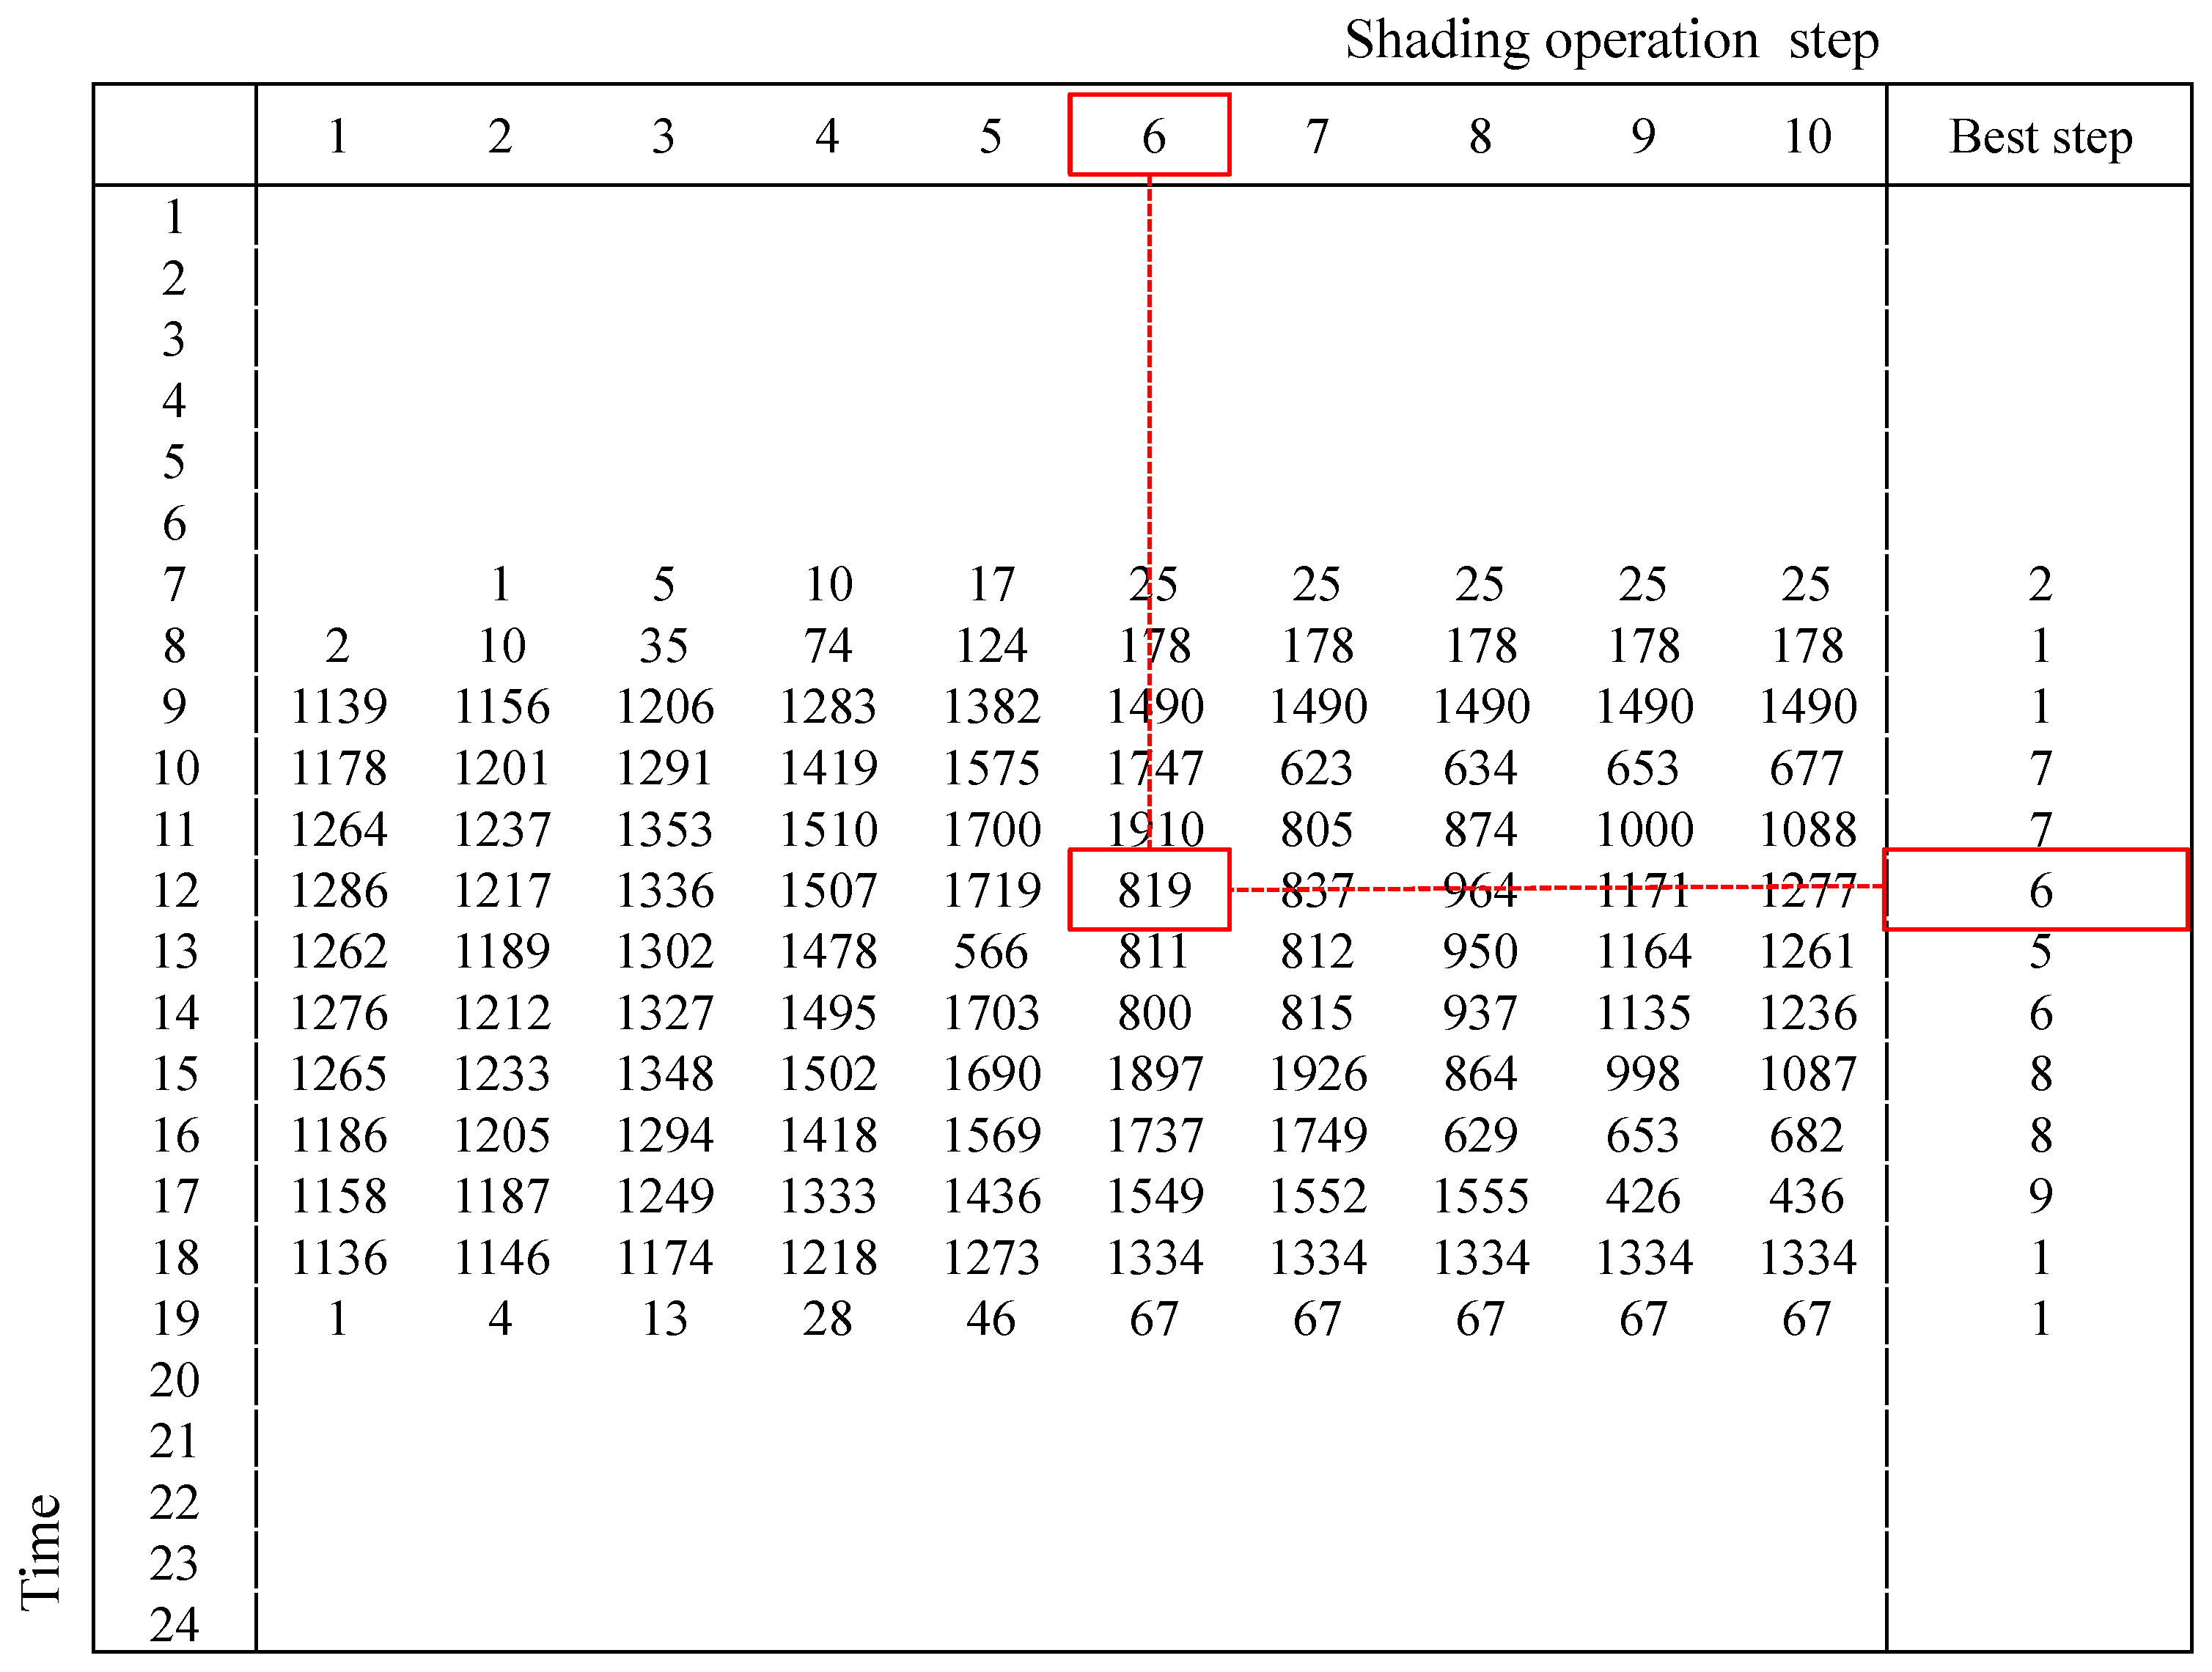
Figure 6 illustrates the total primary consumption value for the lighting energy and solar heat gain according to the time and operation step. The top right column of the figure shows the operation step when the primary energy is the smallest for each operation step at a pertinent time. For example, at 12:00, since the primary energy consumption is the smallest in Step 6, the optimal operation step of this time period becomes 6. Therefore, if the optimal operation scenario of a movable shading device is derived with 8760 h, i.e., 24 h × 365 days, the annual solar heat gain and lighting primary energy consumption can be calculated.
3.4. Energy Calculation Process
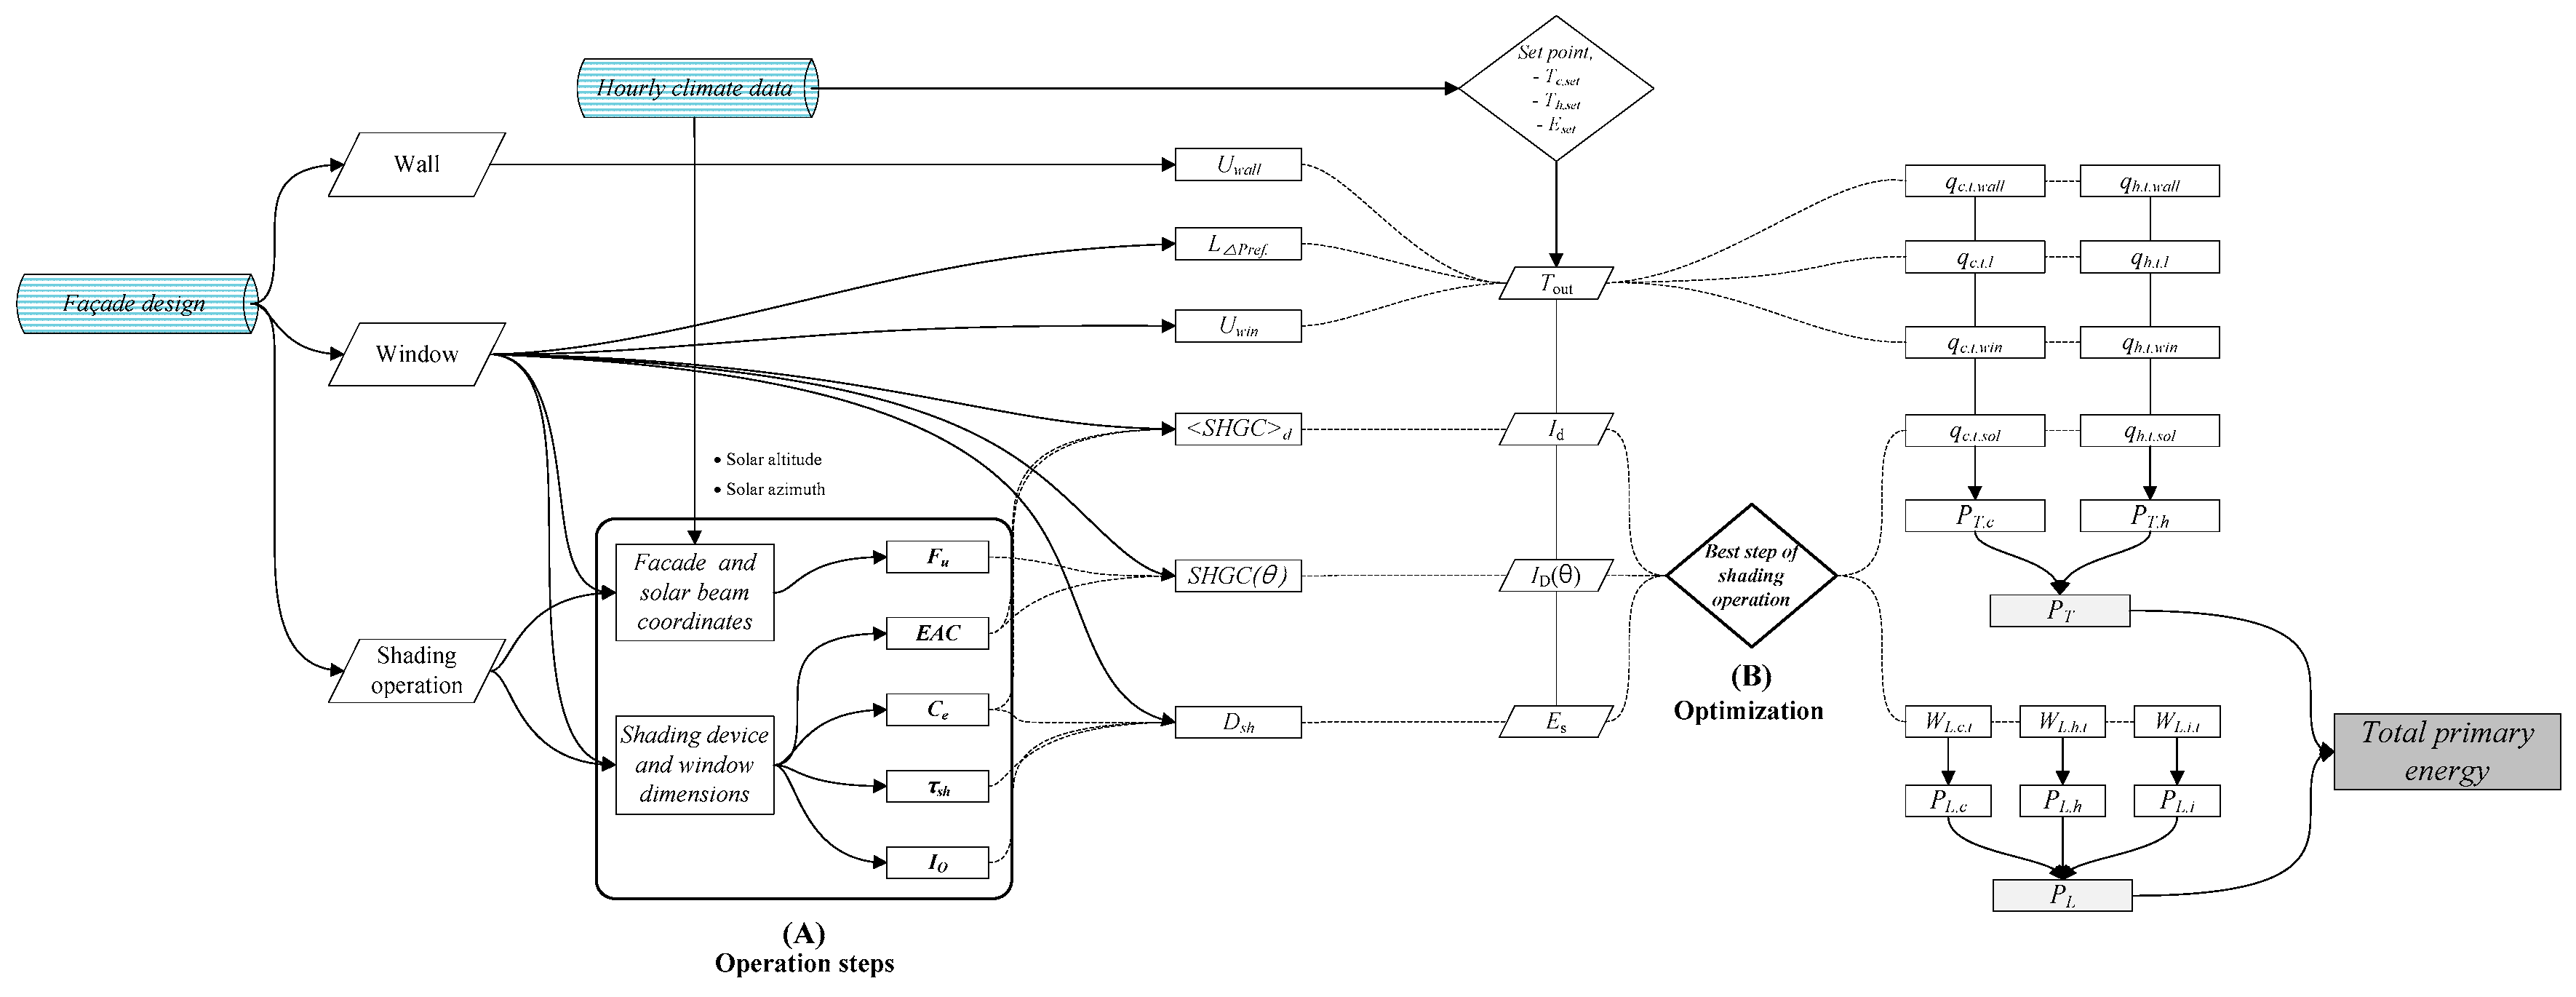
To calculate the total primary energy transferred through the building façade installed with an external movable shading device, façade design information and hourly climate data are used.
Figure 7 outlines the calculation used in this study. The façade design information includes the physical property information of the wall, window, and shading device, and in the case of the shading device, the position information according to 10 operation steps is also included. In (A), the five variables (
Fu,
IO,
EAC,
τsh,
Ce) of 10 operation steps of a shading device are calculated using the façade design information (see
Figure 7A). In the calculation of
Fu, the altitude and azimuth of the sun according to the time of hourly climate data are also used. The physical property information of a window and wall includes
Uwin,
Uwall,
LΔPref,
SHGC(Ɵ), and (
SHGC)
D.
Dsh is calculated using the major variables of a shading device and the physical property information of a window. The solar heat gain and lighting energy requirement are calculated, respectively, by 10 steps of an external movable shading device using climate information, the illuminance, and solar radiation by time.
For the heat transfer and infiltration heat gain (or loss) calorie calculations, a basic calculation method used in conventional studies was applied [
26]. When there is a temperature difference between indoors and outdoors, the heat transfer and heat gain through the façade result from conduction, convection, and radiation through the windows and walls. In the heat transfer and heat gain calculations, the key variables of the façade include the thermal transmittance (
Uwin and
Uwall) of the window and wall. The infiltration mainly occurs at the windows and produces heat gain and loss. When the walls are assumed to be airtight, the major variable for calculation of heat gain by infiltration is the airtightness (
LΔPref) of the window. The airtightness of the window is expressed by the air infiltration rate per unit area (
) at a certain pressure difference.
The optimal operation step for the calculation of the solar heat gain and lighting energy requirement is derived through the control strategy depicted in (B). The annual solar heat gain and lighting energy requirement are calculated by including the optimized shading operation scenario of annual shading, in which the optimal operation step by time is applied. Therefore, the total primary energy consumption where external movable shading devices are installed is calculated by totaling the annual solar heat gain and lighting energy requirement reflecting the movement of a shading device, heat transfer and heat gain through windows and walls, and heat gain by infiltration (see
Figure 7B).
4. Application of Different Shading Control Strategies for Thermal and Lighting Energy Evaluation
Setting the control strategies of a shading device is a very important factor in the thermal and lighting energy calculation of a façade installed with external movable shading devices. In this section, simulations were conducted to compare the energy performance of a façade according to the control strategies. The primary energy consumption of the façade was calculated by applying the control strategies of a movable shading device used in conventional studies and the control strategies derived in
Section 4. For the type of shading, a drop awning was selected and for the region, Dubai (UAE) was chosen.
4.1. Description of Different Shading Control Strategies
In previous studies, by applying the simplified steps, i.e., open or close, the shading position changes were applied in the annual energy calculation. In the case of solar radiation reaching the façade exceeding a certain range, researchers have looked into a method of controlling solar heat gain by closing the shading device [
2,
24,
27]. With respect to natural lighting, in the case of the illuminance on the indoor working plane of less than or equal to 1800 lux or 2000 lux, studies have been conducted to determine a control method to maintain an effective illuminance indoors [
2,
11]. To compare the annual primary energy according to the control strategies of an external movable shading device, three control strategies were selected on the basis of conventional studies related to solar radiation heat and natural lighting.
Table 1 shows (CS-1) an open/closed control strategy based on illuminance on the indoor working plane, (CS-2) an open/closed control strategy based on solar radiation reaching the façade, (CS-3) the control strategy that considers the solar heat gain and lighting energy requirement proposed in this study. During the non-occupation period, the shading device is left close.
4.2. Description of the Building Façade
An office building was chosen for the application. The building façade was designed with a width of 4.2 m, a height of 4.2 m, and a zone depth of 8.4 m (South). A window was installed 1.26 m above the floor, and the area was 7.6 m
2, with a width of 3.36 m and a height of 2.1 m. The operation settings of the building used for simulations included temperature settings of 26 °C for cooling and 21 °C for heating. Hours of building operation were established as 08:00 to 20:00. The light power density (LPD) for the lighting energy requirement calculation was 12 W/m
2, and the indoor illuminance was set at 500 lux. Artificial lighting control systems were set at on-off automatic control. The average pressure difference of the façade for the infiltration load calculation was assumed to be 4 Pa to simulate a natural indoor/outdoor pressure difference [
28]. For the primary energy conversion coefficient, the usual system efficiency applied in conventional studies was used [
29,
30,
31]. For the cooling system of the building, an EHP (system air conditioner) having a COP (coefficient of performance) of 3 was established, and the efficiency of the boiler was set at 80%. The coefficient for primary energy conversion of used electric power was set at 3.0, and for the fuel used, it was set at 1.1.
For the evaluation target area, Dubai (UAE) was chosen, and climate data were gathered through Meteonorm 7 [
32]. Dubai is a city located in a significantly hot region, positioned at north latitude of 25.3°. The total solar radiation on the horizontal plane in May, in which the solar radiation is the highest, is about 250 kWh/m
2, and that in December, when solar radiation is the lowest, is approximately 105 kWh/m
2. The maximum temperature in July and August, when outdoor temperatures are the highest, is about 44 °C, and the minimum temperature in January when outdoor temperatures are the lowest is about 14 °C.
For the external movable shading device, a drop awning with changes in both parallel and vertical directions to the façade was selected. The cross-section of the façade installed with the drop awning is shown in
Figure 8. The operation method was set with the length-angle-length changes, and it contracts in the parallel direction in Steps 1–4, rotates in Steps 4–7, and contracts in the vertical direction in Steps 7–10.
Punched window was selected for the façade type where the external movable shading device was installed. The wall was a concrete structure and the window was set as a 6 mm low-E double glazing filled with 3 mm argon.
Table 2 shows the physical property information for the drop awning, window, and wall. The physical property information of each component was obtained using the Window 6 [
33] program.
4.3. Calculation Results
The primary energy consumption at the façade, where the drop awning was installed, was calculated for each of the four types of main orientations. The primary energy consumptions were derived based on the control strategies of mutually exclusive shading devices according to three shading control strategies.
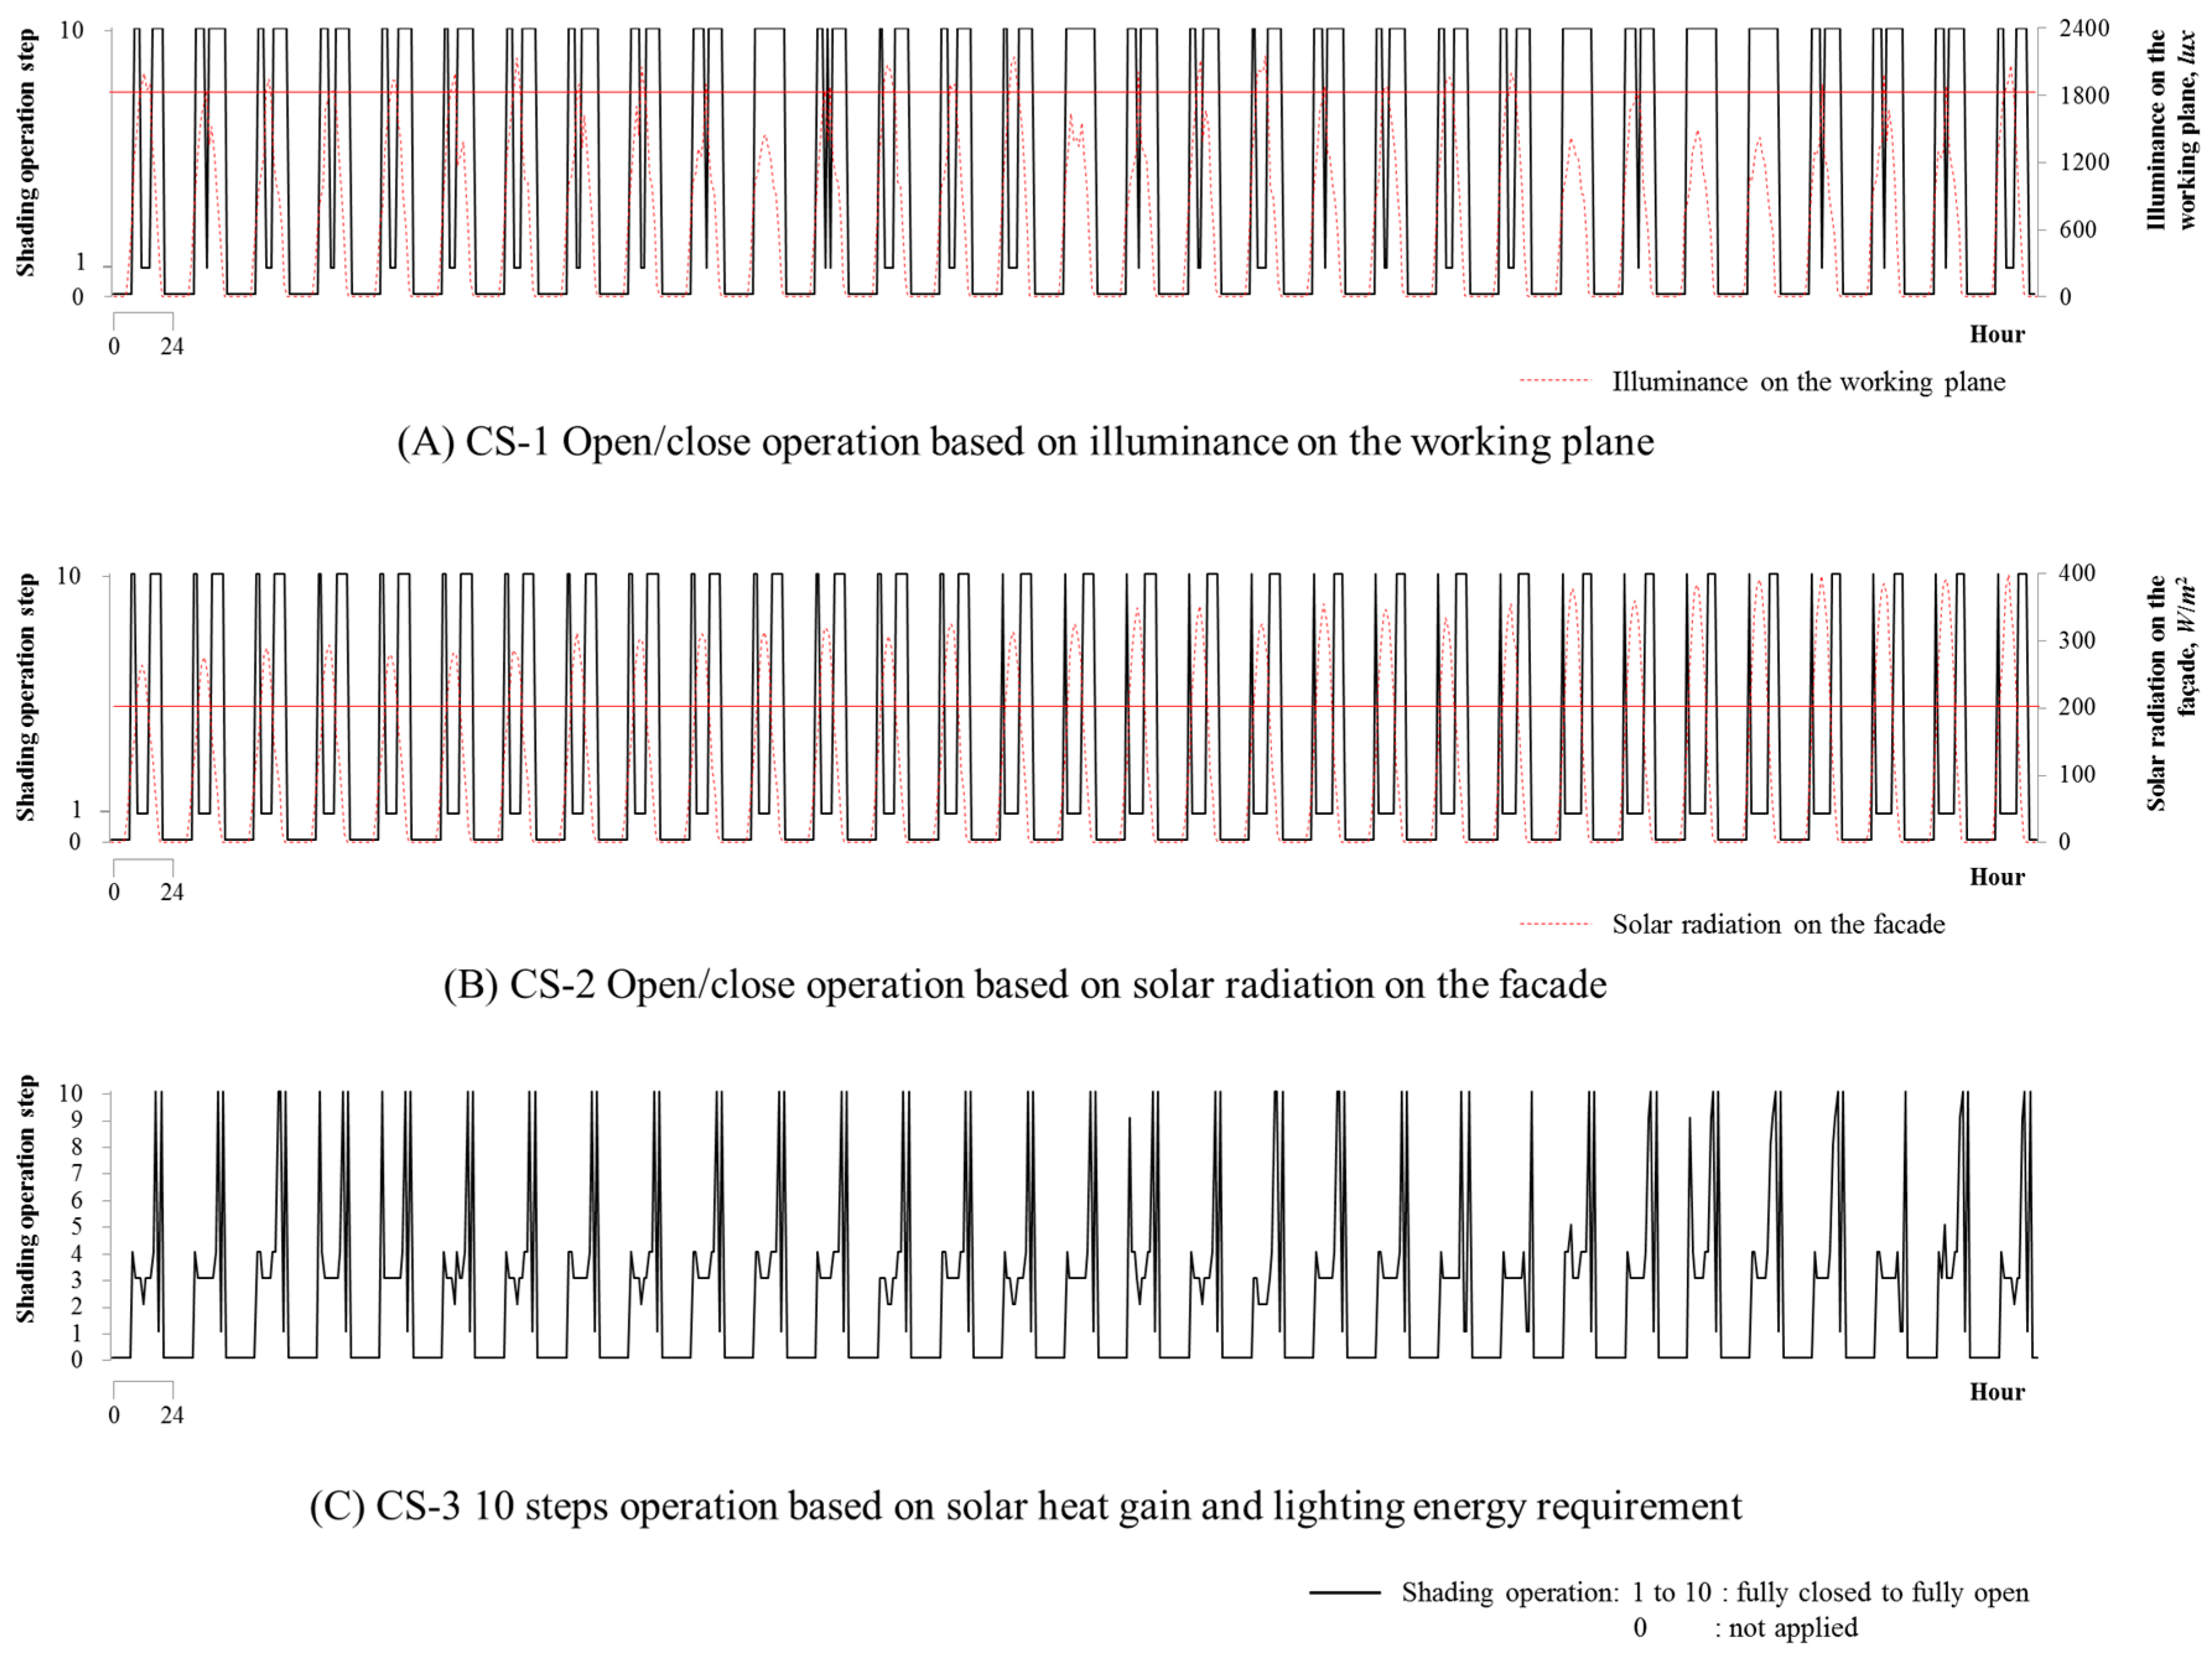
Figure 9 is an illustrative graph showing the operation scenario for the façade facing south in August. The vertical axis of the graph shows the operation steps. Step 0 indicates the time period when the office is not in operation and, thus, shading is not applied. Steps 1 (fully closed) through 10 (fully open) indicate the operation steps of the shading device. The horizontal axis shows the changes in time. (A) and (B) show the open/closed operation according to the conventional method, and (C) shows the operation scenario according to the method proposed in this study. In the case of CS-1, when the illuminance on the working plane exceeds 1800 lux, the shading device is closed. In CS-2, when the solar radiation incident on the façade is 200 W/m
2, the shading device is closed. The movements of the shading device in CS-1 and CS-2 showed that it remained mostly closed in the afternoon, and no significant difference was observed on different dates. In the case of CS-3, the operation steps of the shading device varied depending on the time period, and mutually exclusive scenarios were shown for each date.
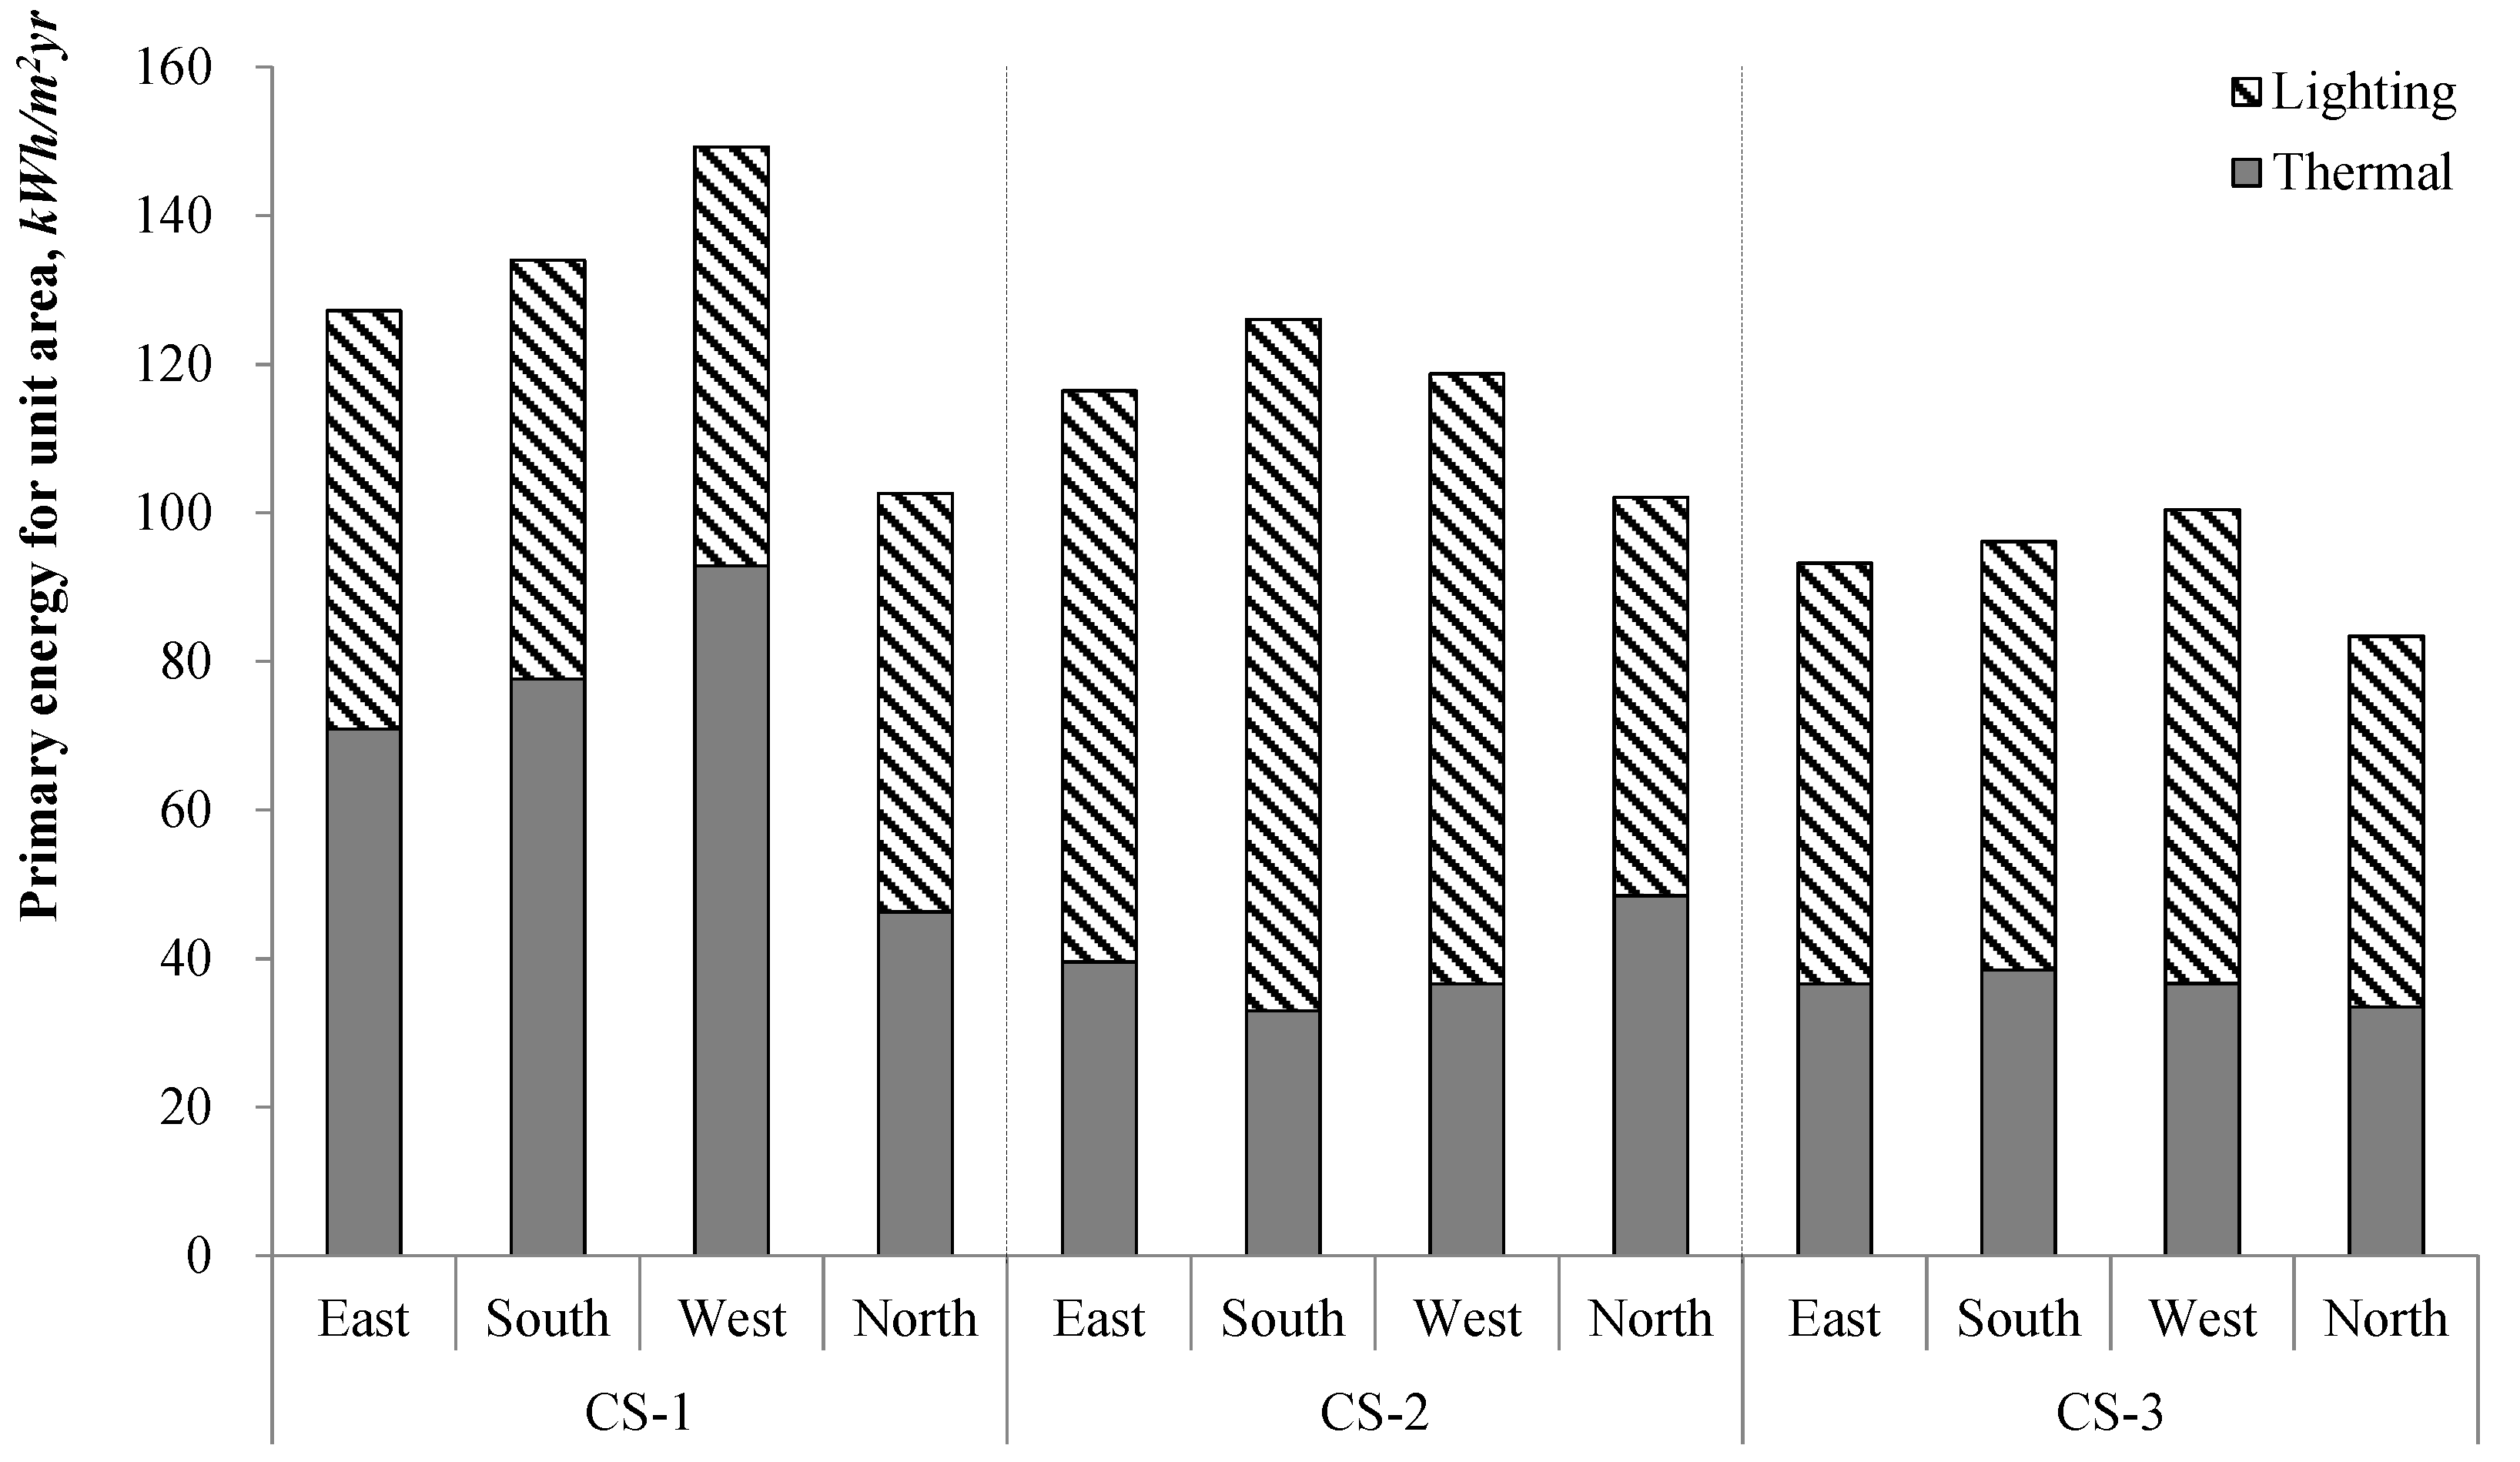
Reflecting the annual operation scenario of the shading device, the primary energy consumption per floor space of the evaluation target building was calculated as shown in
Table 3. Dubai was mainly in the cooling period, hence heating primary energy consumption was small. In the case of CS-1, the thermal energy made up a higher proportion than the amount of lighting energy, and in the case of CS-2, the amount of lighting energy made up a higher proportion than the amount of thermal energy.
Figure 10 describes the thermal and lighting primary energy consumptions of all three control strategies by direction. Since Dubai was mainly in the cooling period, the thermal energy performance was relatively better in the case of CS-2 controlled on the basis of solar heat gain. The lighting energy requirement, however, was very large because natural lighting is not taken into consideration. The lighting energy use had the lowest value in the case of CS-1, but the heating/cooling primary energy consumption was excessive. The total primary energy consumption showed the highest value in CS-1 and the lowest value in CS-3.
5. Discussion
An external movable shading device performs best when it is optimally controlled with the consideration of the comfort of inhabitants and building energy use. This study explored an optimal control method of a shading device for minimizing the energy acquired through the façade. An annual optimal operation scenario derivation method was proposed for the external movable shading device considering the solar heat gain and lighting energy requirement affected by the operation of the shading device. To depict various shading position changes, 10 operation steps were established for the shading device, and the solar heat gain and lighting energy requirement calculation methods reflecting various positions and properties of the shading device were calculated. Furthermore, a control strategy for the shading device was derived to minimize the thermal and lighting primary energy consumption at the façade where the external movable shading device was installed.
The external movable shading device affects not only the solar radiation entering a building but also the daylight performance within the building. The operation of the movable shading device, therefore, must effectively block/receive the solar radiation within the range that facilitates natural lighting. Because the conventional operation control method limits the position change by operation of the shading device to simply open/closed, and because the shading device is controlled on the basis of solar radiation or illuminance only, effective control of the external movable shading device was difficult in terms of energy performance. The optimal operation scenario derived in this study can result in an effective energy performance because it sets the required illuminance indoors for natural lighting and can optimally control the lighting energy requirement and solar heat gain thereby produced.
One issue related to the control of an external movable shading device that was not addressed in this study is glare control. Because the optimal control strategies proposed in this study did not consider the comfort of building inhabitants, glare control was not reflected in the control strategies. In a conventional study [
11] of the control strategy of a shading device, glare was considered as an important driving parameter. In the study, a control method was used to minimize the direct solar radiation incident on the working plane. Nevertheless, it is necessary to control the operation of external movable shading devices by prioritizing the energy reduction during the heating/cooling period. The optimal control strategies of a shading device derived in this study showed an excellent energy performance by effectively controlling the shading device according to the heating/cooling period. For both energy performance and comfort considerations of an external movable shading device, it is also necessary to consider the solar heat gain, lighting energy consumption, and glare control.
6. Conclusions
This study presents a calculation methodology to evaluate the thermal and lighting energy performance of external movable shading devices. A calculation method was derived in order to estimate the annual heating/cooling primary energy considering the operation of a shading device. The methodology also takes into account the positions and physical properties of the shading devices and produces solar heat gain and the lighting energy requirement.
Using the calculation methodology, an optimal operation scenario was derived which can minimize the solar heat gain and lighting energy requirement, and the primary energy consumption calculation process of heat and light was established. A simulation was performed on an example building with a drop awning with length-angle-length changes. In order to compare the results from this study with the ones in previous studies, three control strategies, i.e., closing based on solar radiation on the façade, closing based on the working plane illuminance, and the proposed control method, were selected, and the annual primary energy consumption of heat and lighting reflecting the three operation scenarios of shading devices were compared.
Acknowledgments
This research was supported by the “World Class 300 Project R&D” funded by the Small and Medium Business Administration [10046952] and also supported by a grant (16AUDP-B100343-02) from Architecture & Urban Development Research Program funded by Ministry of Land, Infrastructure and Transport of Korean government.
Author Contributions
Dong-Seok Lee and Jae-Hun Jo had the original idea for the study, and all co-authors conceived of and designed the methodology. Dong-Seok Lee and Sung-Han Koo drafted the manuscript, which was revised by Jae-Hun Jo. All authors read and approved the final manuscript.
Conflicts of Interest
The authors declare no conflict of interest.
Nomenclature
| Solar heat gain through the window, |
| Total façade area, |
| Fenestration ratio, Fenestration area/Total façade area |
| Direct radiation on the façade, |
| Diffuse radiation on the façade, |
| Solar heat gain coefficient for direct solar radiation |
| Solar heat gain coefficient for diffuse solar radiation |
| Exterior solar attenuation coefficient |
| Light transmittance of shading |
| Transmittance of the shading layer |
| Visual transmittance of the shading layer |
| Visual reflectance of shading layer |
| Reflectance of shading layer |
| Unshaded fraction |
| Transparency index and depth index |
| Depth index |
| Light transmittance of the window |
| Shading angle, |
| Daylight factor of exterior shading device installed facade |
| Obstruction index |
| Exterior diffuse illuminance on the horizontal plane, |
| Illuminance on the task plane, |
| Lighting power density, |
| Daylit area, |
| Non-daylit area, |
| Lighting energy required for an hour in the zone, |
| Heating or cooling load generated by transmission of wall |
| Heating or cooling load generated by transmission of window |
| Thermal transmittance of the window, |
| Thermal transmittance of the wall, |
| Set-point temperature, °C |
| Outdoor temperature, °C |
References
- Van Moeseke, G.; Bruyere, I.; de Herde, A. Impact of control rules on the efficiency of shading devices and free cooling for office buildings. Build. Environ. 2007, 42, 784–793. [Google Scholar] [CrossRef]
- Da Silva, P.C.; Leal, V.; Andersen, M. Influence of shading control patterns on the energy assessment of office spaces. Energy Build. 2012, 50, 35–48. [Google Scholar] [CrossRef]
- Marszal, A.J.; Heiselberg, P.; Bourrelle, J.S.; Musall, E.; Voss, K.; Sartori, I.; Napolitano, A. Zero energy building—A review of definitions and calculation methodologies. Energy Build. 2011, 43, 971–979. [Google Scholar] [CrossRef]
- Sartori, I.; Napolitano, A.; Voss, K. Net zero energy buildings: A consistent definition framework. Energy Build. 2012, 48, 220–232. [Google Scholar] [CrossRef]
- Kim, G.; Lim, H.S.; Lim, T.S.; Schaefer, L.; Kim, J.T. Comparative advantage of an exterior shading device in thermal performance for residential buildings. Energy Build. 2012, 46, 105–111. [Google Scholar] [CrossRef]
- Freewan, A.A.Y. Impact of external shading devices on thermal and daylighting performance of offices in hot climate regions. Sol. Energy 2014, 102, 14–30. [Google Scholar] [CrossRef]
- David, M.; Donn, M.; Garde, F.; Lenoir, A. Assessment of the thermal and visual efficiency of solar shades. Build. Environ. 2011, 46, 1489–1496. [Google Scholar] [CrossRef]
- Alzoubi, H.H.; Al-Zoubi, A.H. Assessment of building facade performance in terms of daylighting and the associated energy consumption in architectural spaces: Vertical and horizontal shading devices for southern exposure facades. Energy Convers. Manag. 2010, 51, 1592–1599. [Google Scholar] [CrossRef]
- Frontini, F.; Kuhn, T.E.; Herkel, S.; Strachan, P.; Kokogiannakis, G. Implementation and Application of a New Bi-directional Solar Modelling Method for Complex Facades within the ESP-R Building Simulation Program. In Proceedings of the 11th International IBPAS Conference, Glasgow, Scotland, 27–30 July 2009.
- Atzeri, A.; Pernigotto, G.; Cappelletti, F.; Gasparella, A.; Tzempelikos, A. Energy performance of shading devices for thermal and lighting comfort in offices. In Proceedings of the BSA 2013: 1st IBPSA-Italy Conference, Bolzano, Italy, 30 January–1 February 2013.
- Tzempelikos, A.; Shen, H. Comparative control strategies for roller shades with respect to daylighting and energy performance. Build. Environ. 2013, 67, 179–192. [Google Scholar] [CrossRef]
- Montier, C.D.; Potvin, A.; Demers, C.M.; Montier, C.D.; Potvin, A. Energy and daylighting potential for adaptive facades: Evaluation of movable insulated panels, ICAMA 2013. In Proceedings of the International Conference on Adaptation and Movement in Architecture, Totonto, ON, Canada, 10–11 October 2013.
- Van Den Wymelenberg, K. Patterns of occupant interaction with window blinds: A literature review. Energy Build. 2012, 51, 165–176. [Google Scholar] [CrossRef]
- Foster, M.; Oreszczyn, T. Occupant control of passive systems: The use of Venetian blinds. Build. Environ. 2001, 36, 149–155. [Google Scholar] [CrossRef]
- ASHRAE. ASHRAE Handbook Fundamentals; American Society of Heating, Refrigerating and Air Conditioning Engineers: Atlanta, GA, USA, 2005; Chapter 31. [Google Scholar]
- Kim, Y.Y. Development and application of shadow areas calculation algorithm for analysis of solar access and irradiance. J. Archit. Inst. Korea 2013, 15, 197–205. [Google Scholar]
- Choi, S.J.; Lee, D.S.; Lee, B.Y.; Koo, S.H.; Jo, J.H. Calculation method of Shaded Ratio according to Shading Operations for Kinetic Façade. In Proceedings of the ISHVAC-COBEE Conference, Tianjin, China, 12–15 July 2015.
- Feito, F.; Torres, J.C.; Urena, A. Orientation, simplicity, and inclusion test for planar polygons. Comput. Graph. 1995, 19, 595–600. [Google Scholar] [CrossRef]
- Murta, A. A Generic Polygon Clipping Library. 1998. Available online: http://www.cs.man.ac.uk/~toby/alan/software/gpc.html (accessed on 1 July 2016).
- Kim, D.K.; Jeon, J.U.; Kim, K.S. Comparison of EnergyPlus Algorithm with DIN EN 13363–2 th Evaluate Solar Transmittance for Glazing System with Venetian Blind. J. Archit. Inst. Korea 2011, 27, 373–380. [Google Scholar]
- BS EN 15193:2007. In Energy Performance of Buildings-Energy Requirements for Lighting; British Standards Institution: London, UK, 2007.
- BS EN 13363-1:2003+A1:2007. In Solar Protection Devices Combined with Glazing. Calculation of Solar and Light Transmittance. Simplified Method; British Standards Institution: London, UK, 2003.
- ASHRAE Standard 90.1. In Energy Standard for Buildings except Low-Rise Residential Buildings; American Society of Heating, Refrigerating and Air-Conditioning Engineers, Inc.: Atlanta, GA, USA, 2007.
- Tzempelikos, A.; Athienitis, A.K. The impact of shading design and control on building cooling and lighting demand. Energy Build. 2007, 81, 369–382. [Google Scholar] [CrossRef]
- Wankanapon, P.; Mistrick, R.G. Roller shades and automatic lighting control with solar radiation control strategies. Built 2011, 1, 35–42. [Google Scholar]
- Choe, Y.J. Development of Integrated Energy Performance Evaluation Method for Window Considering heating and Cooling Load in Building. Master’s Thesis, Inha University, Incheon, South Korea, 2013. [Google Scholar]
- Olbina, S.; Hu, J. Daylighting and thermal performance of automated split-controlled blinds. Build. Environ. 2012, 56, 127–138. [Google Scholar] [CrossRef]
- ASTM E779. In Standard Test Method for Determining Air Leakage Rate by Fan Pressurization; ASTM: West Conshohocken, PA, USA, 2010.
- Baker, N.; Steemers, K. Energy and Environment in Aichitecture—A Technical Design Guide; Taylor & Francis: London, UK, 2005. [Google Scholar]
- Perez-Lombard, L.; Ortiz, J.; Maestre, I.R. The map of energy flow in HVAC systems. Appl. Energy 2011, 88, 5020–5031. [Google Scholar] [CrossRef]
- Perez-Lombard, L.; Ortiz, J.; Maestre, I.R.; Coronel, J.F. Constructing HVAC energy efficiency indicators. Energy Build. 2012, 47, 619–629. [Google Scholar] [CrossRef]
- Meteonorm. Available online: http://meteonorm.com/ (accessed on 1 July 2016).
- Window 6. Available online: http://windows.lbl.gov (accessed on 1 July 2016).
© 2016 by the authors; licensee MDPI, Basel, Switzerland. This article is an open access article distributed under the terms and conditions of the Creative Commons Attribution (CC-BY) license (http://creativecommons.org/licenses/by/4.0/).


