
Impact and Mitigation of Nutrient Pollution and Overland Water Flow Change on the Florida Everglades, USA


Abstract
:
1. Introduction
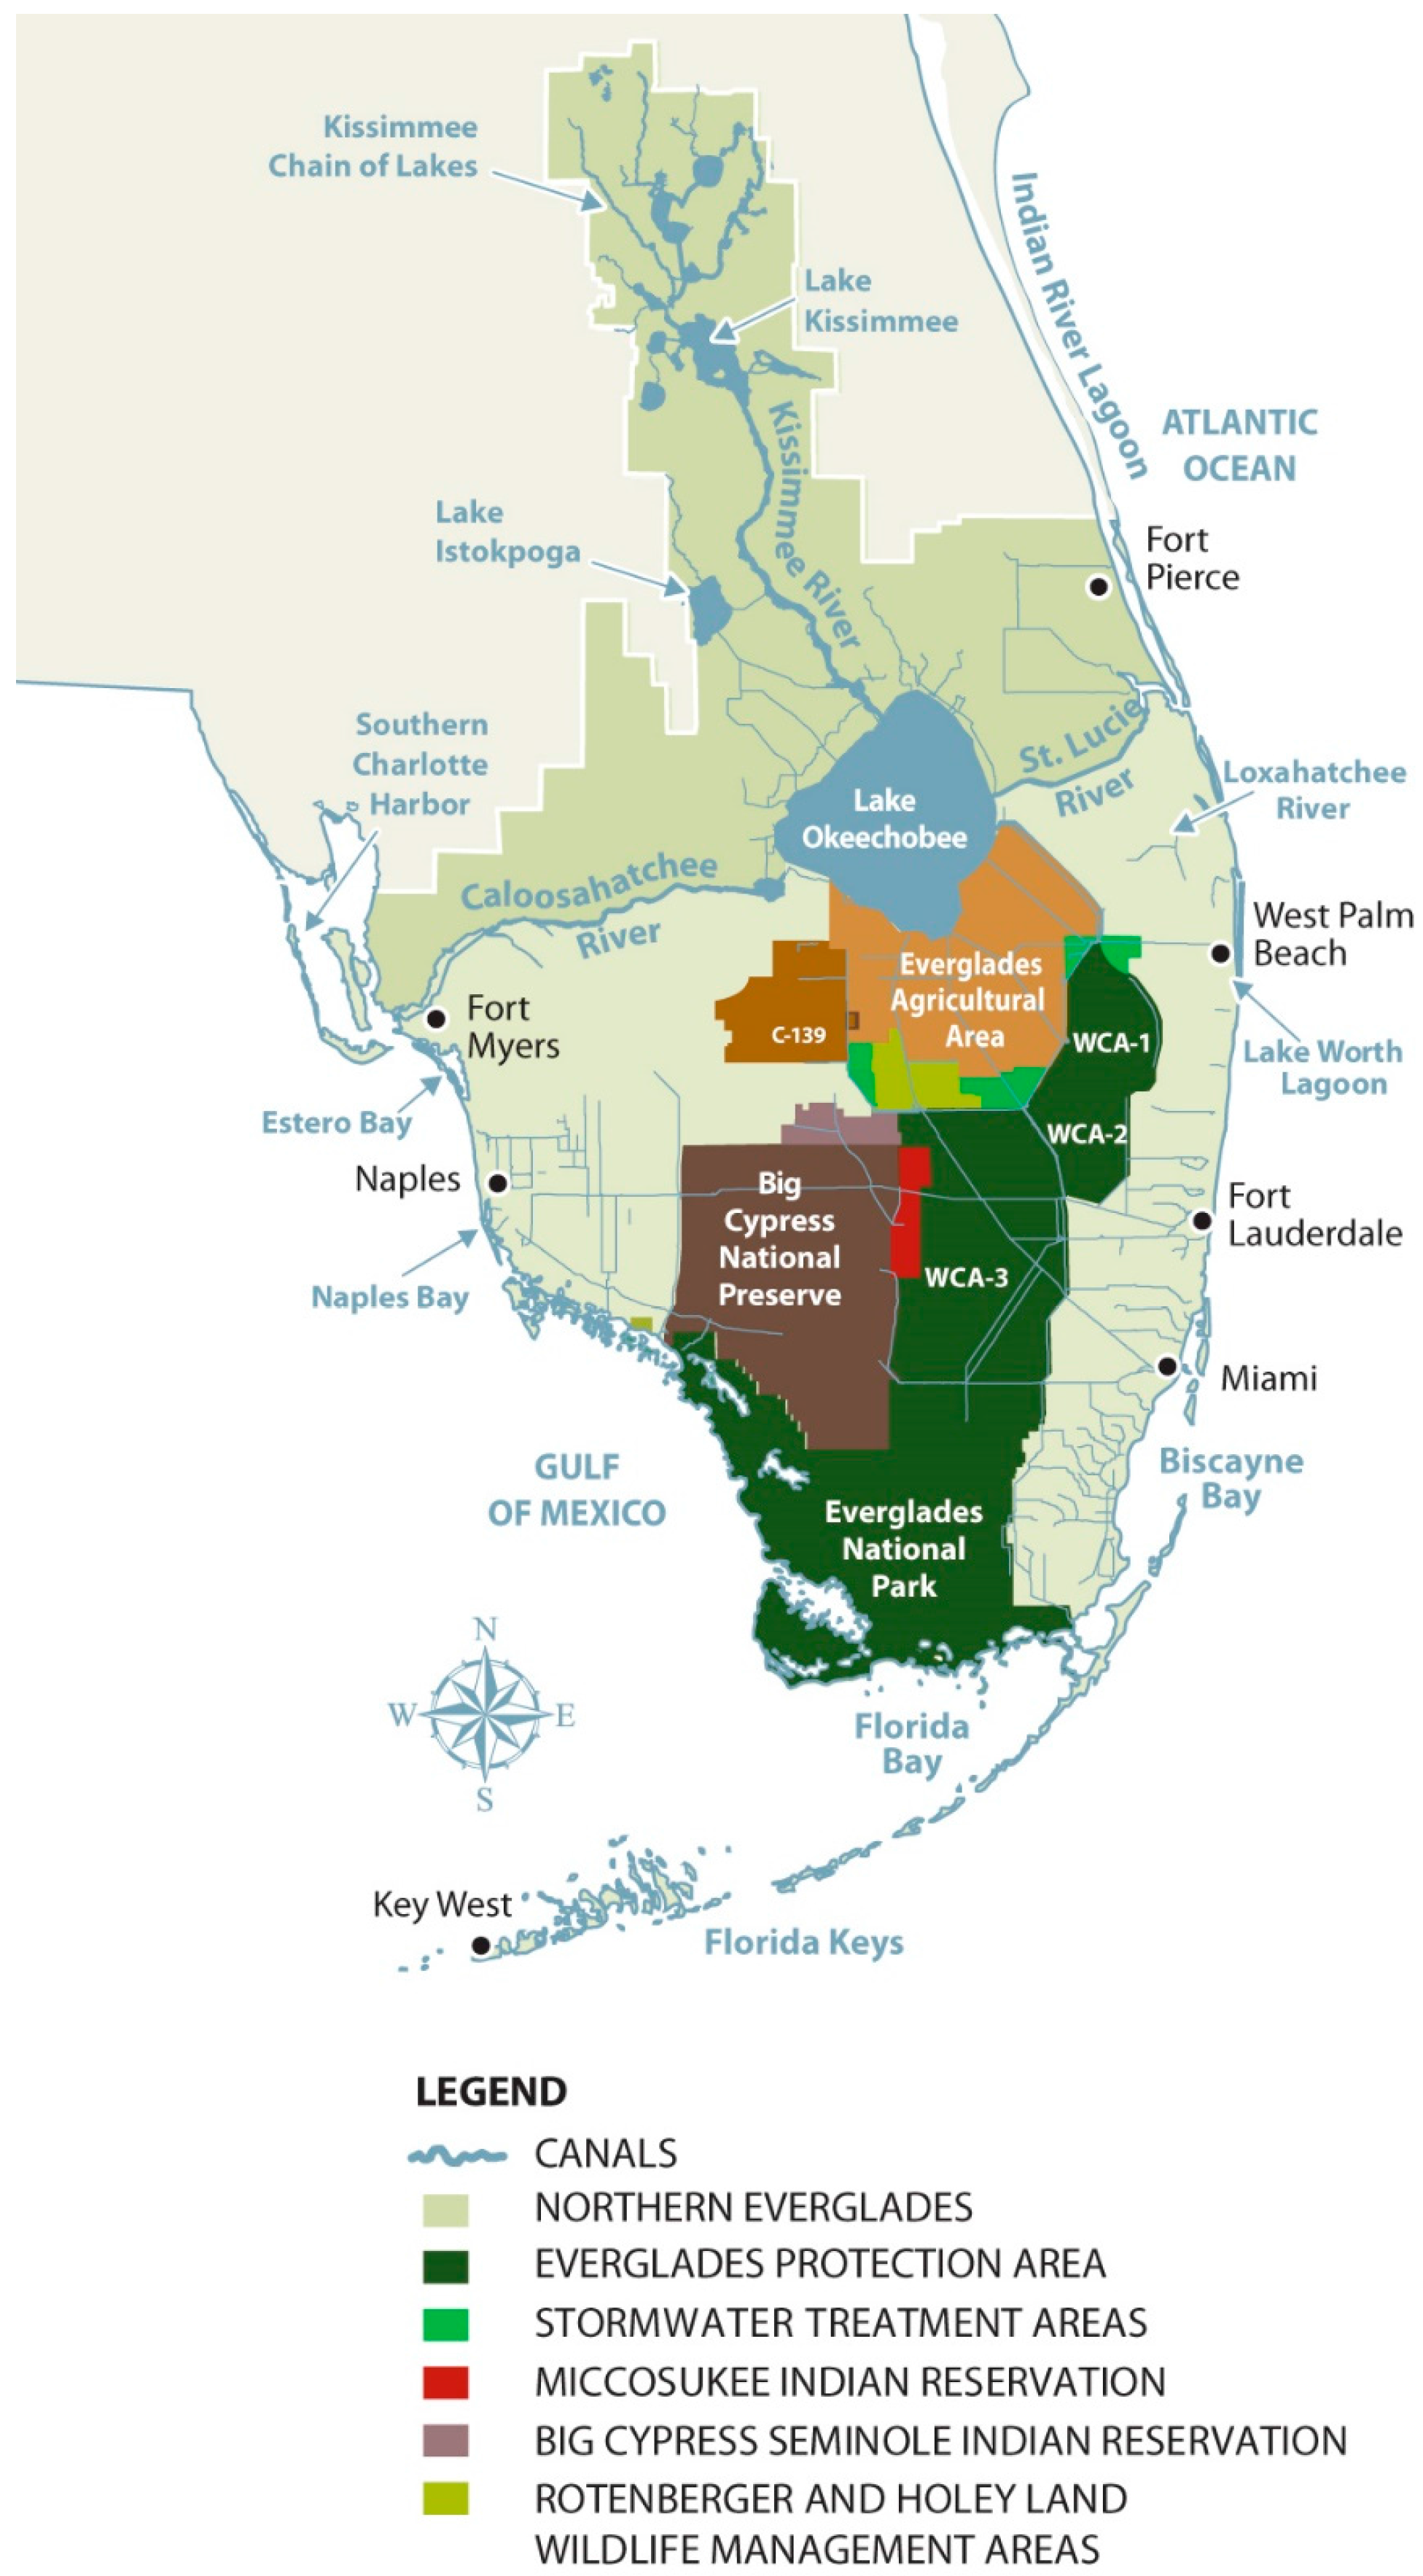
2. The Everglades
3. Lake Okeechobee
4. Florida Bay
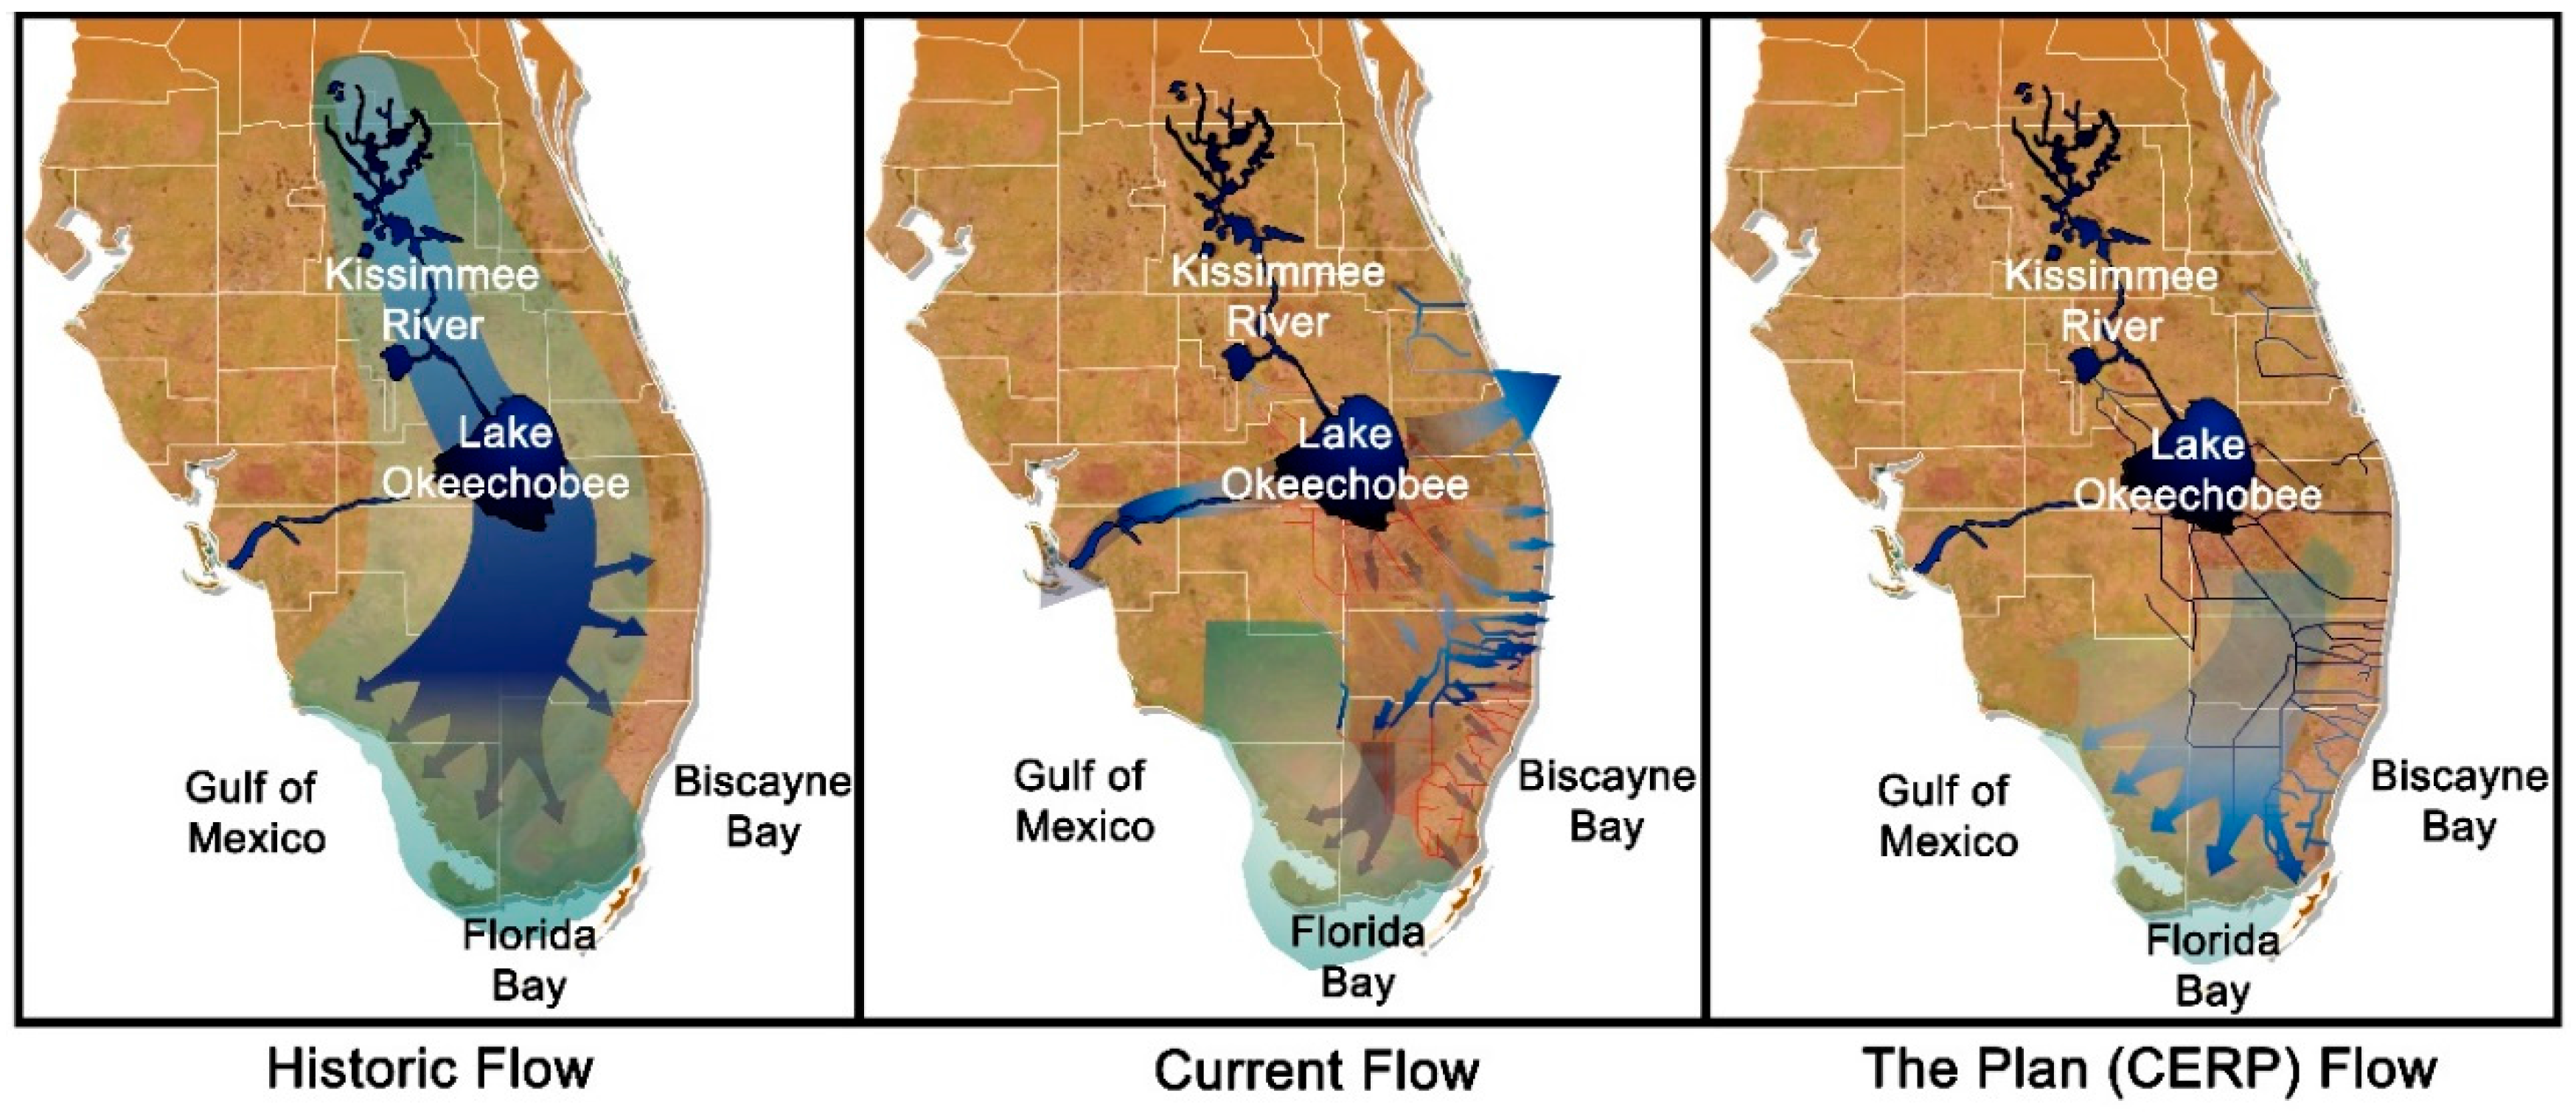
5. Landscape and Overland Water Flow Change
5.1. Development of the Everglades
5.2. Water Quality Impacts
5.3. Nutrient Phosphorus and Nitrogen
5.4. Numerical Nutrient Water Quality Standards
5.5. Everglades Restoration
5.6. Best Management Practices
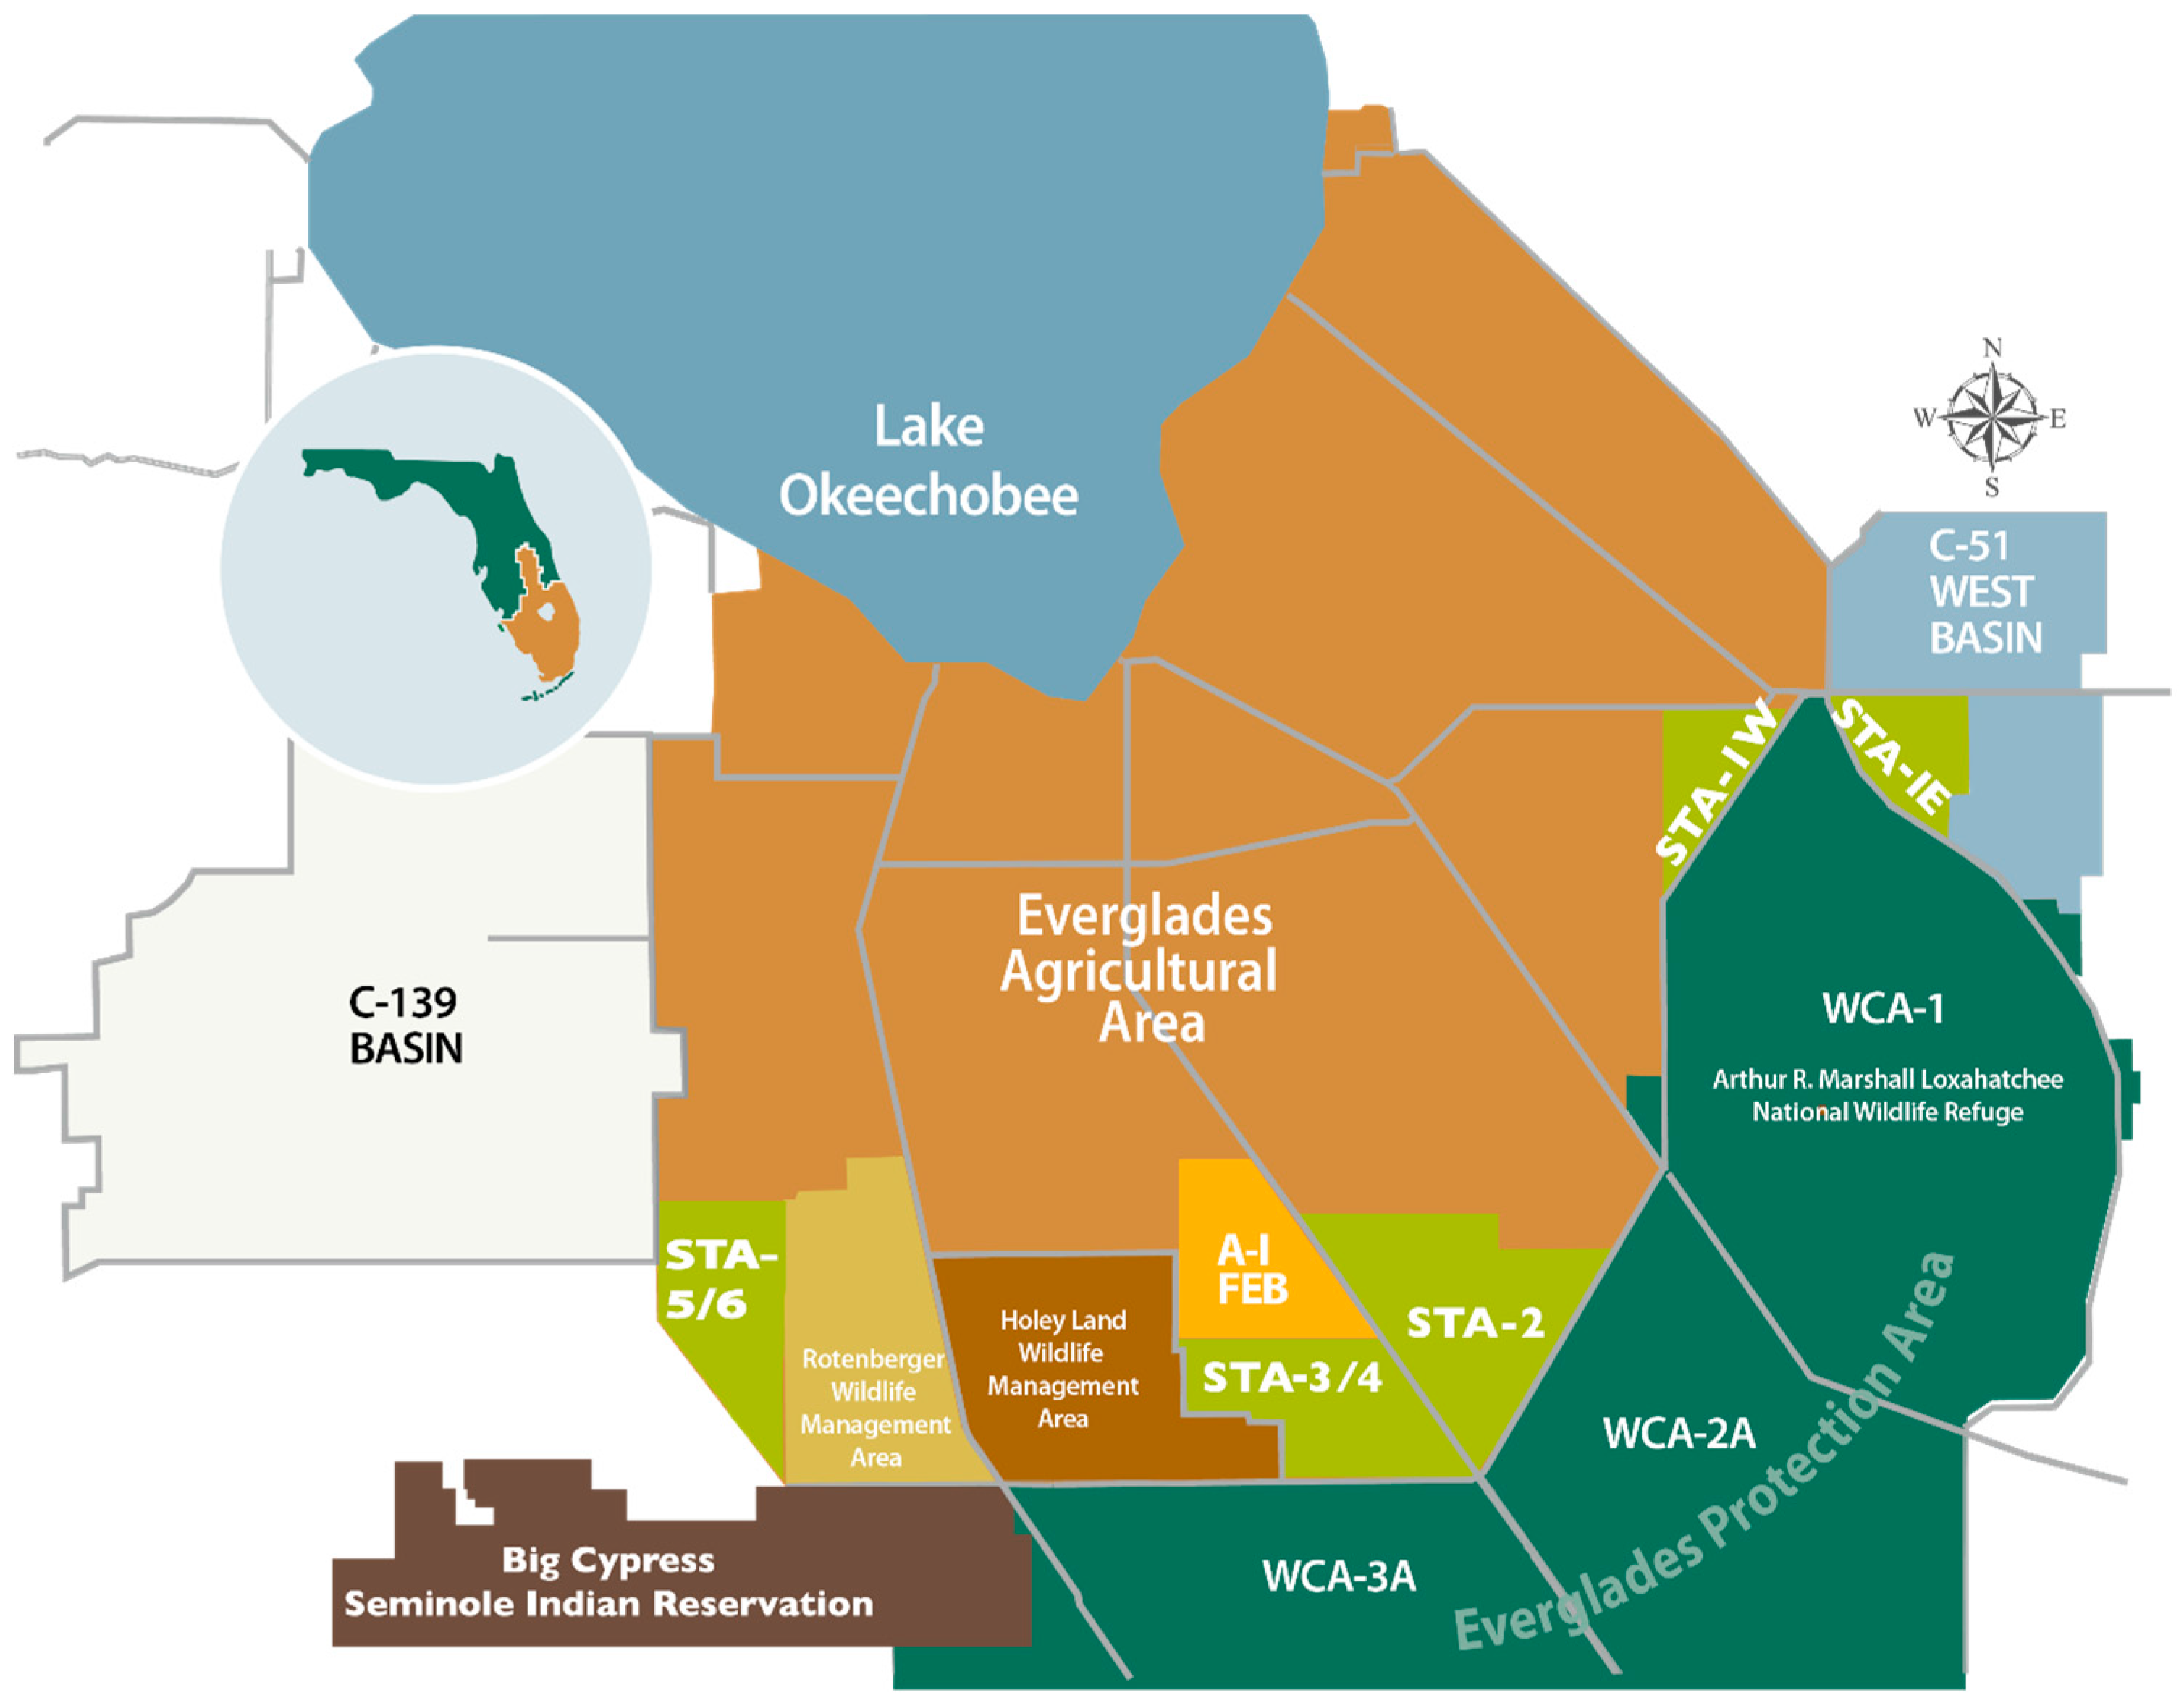
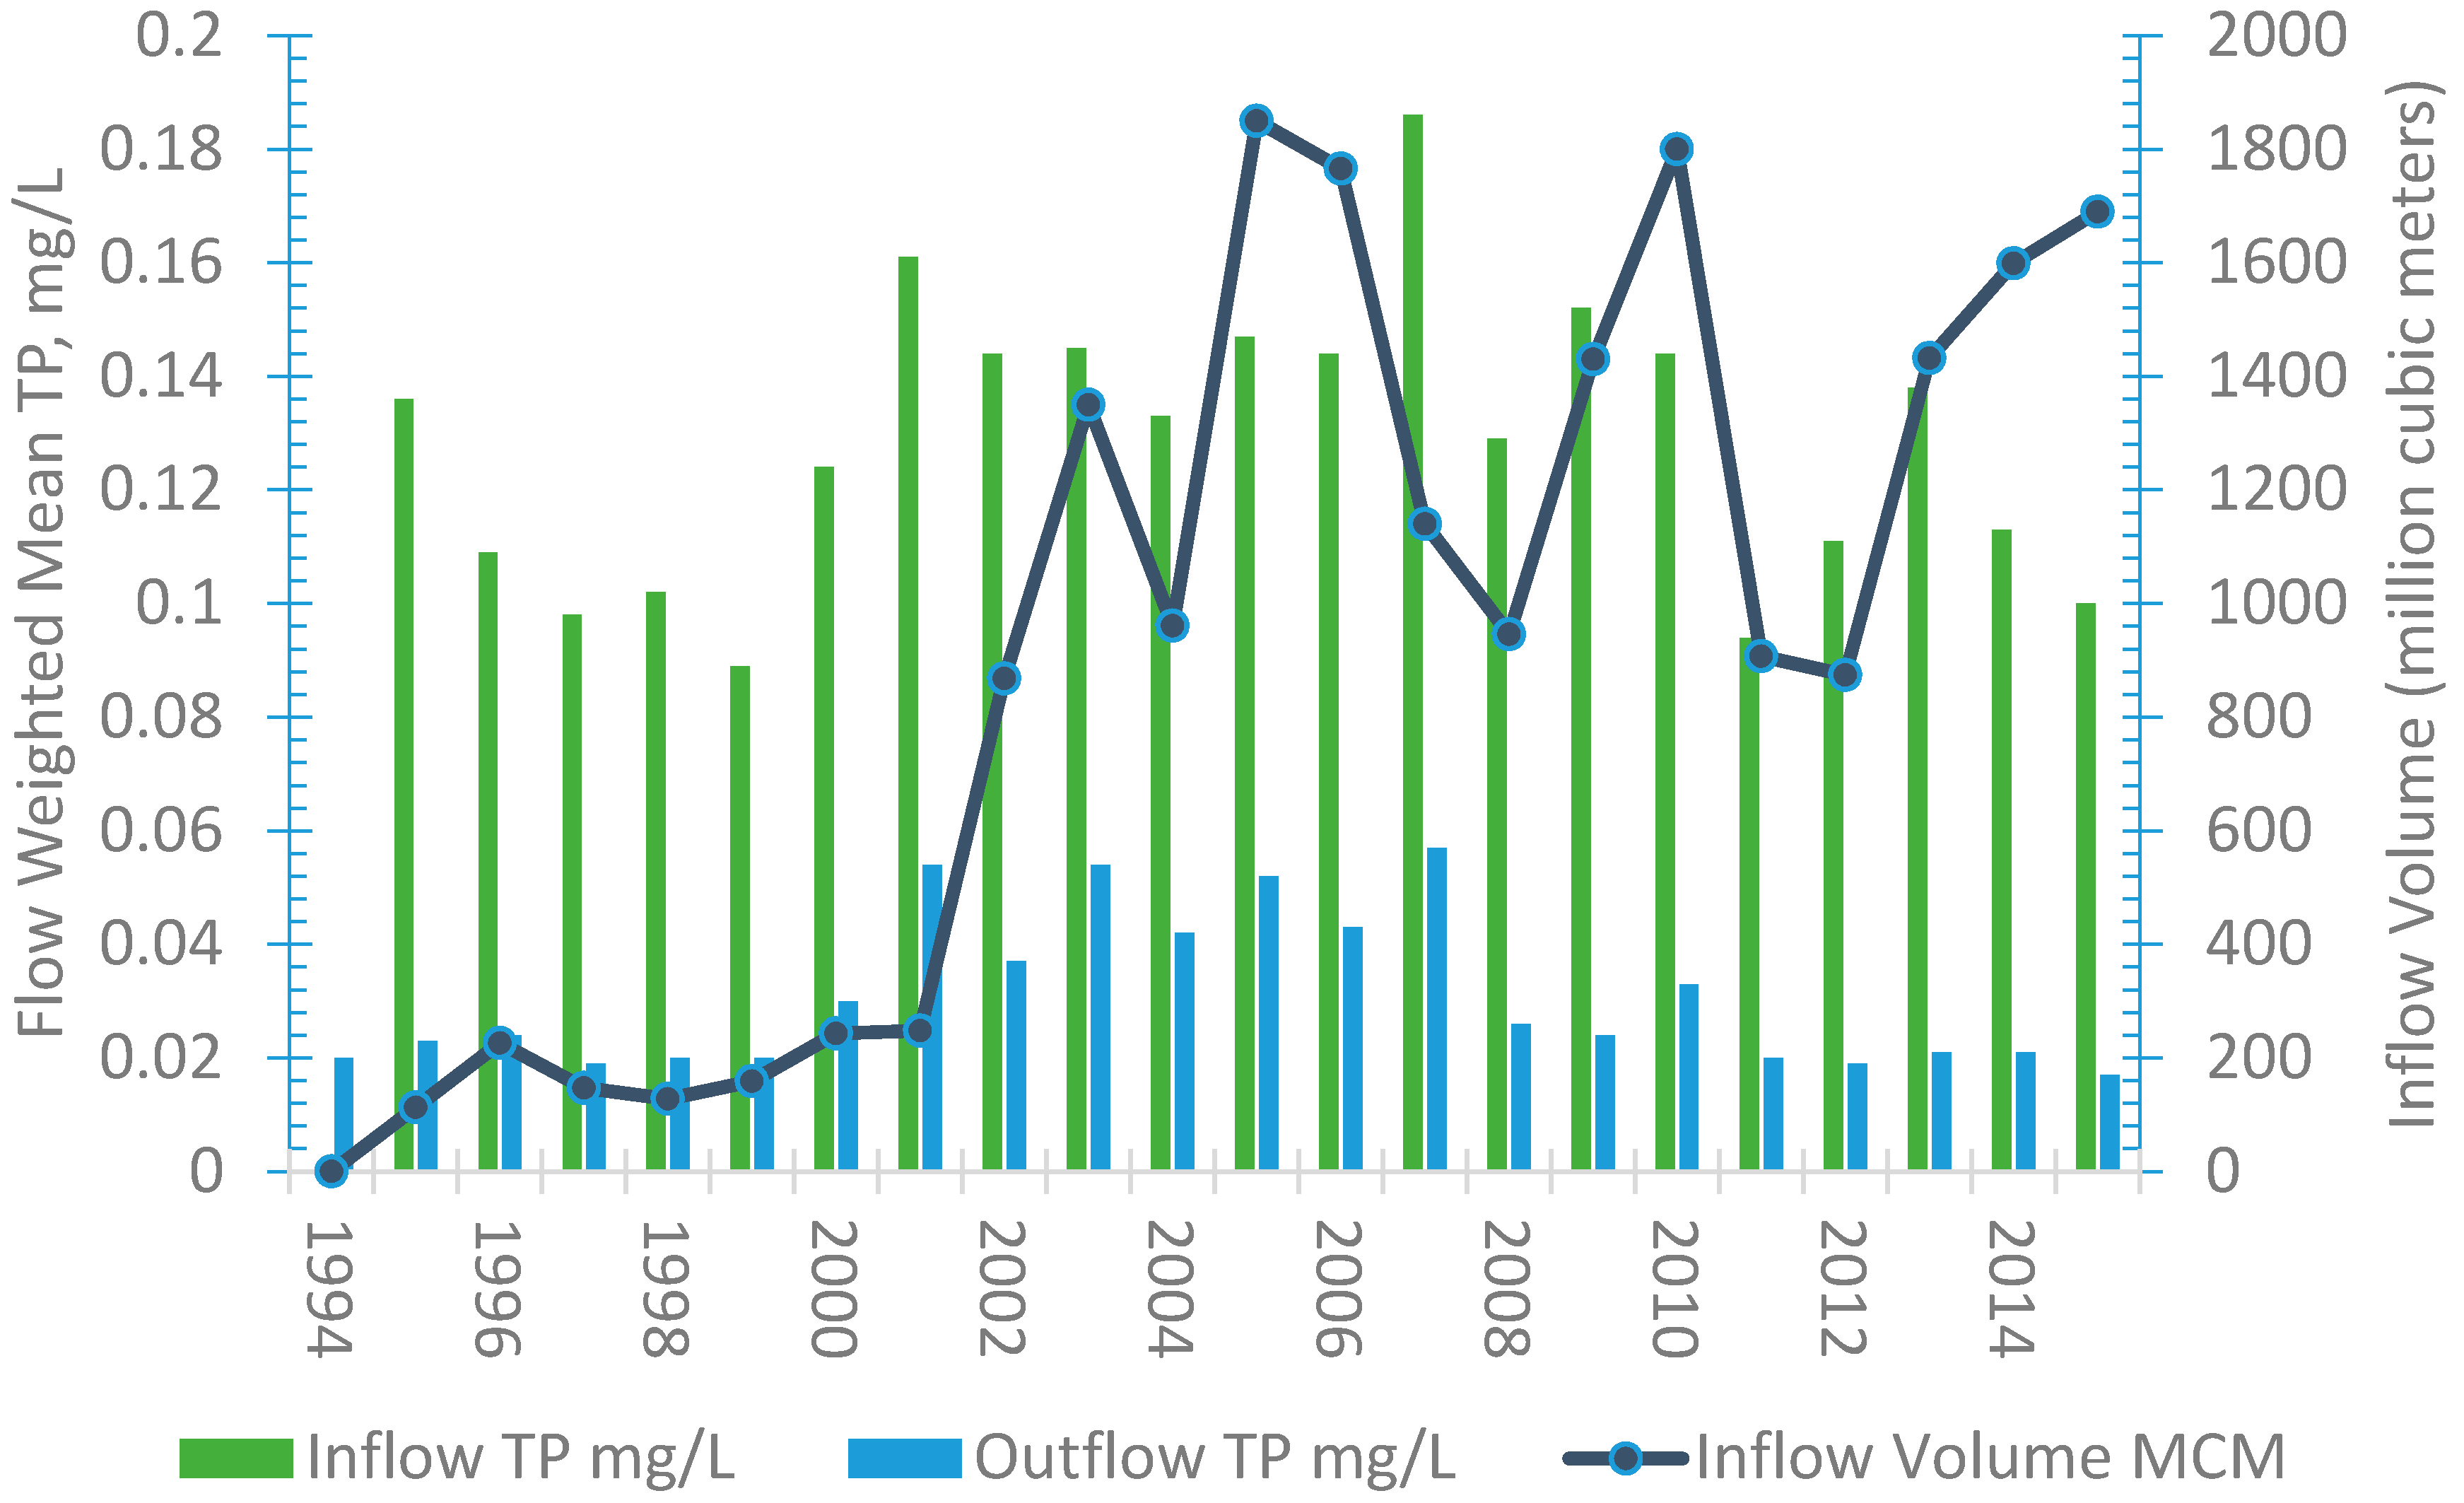
5.7. Stormwater Treatment Areas
6. Conclusions
Acknowledgments
Author Contributions
Conflicts of Interest
Abbreviations
| FAC | Florida Administrative Code |
| TP | Total phosphorus |
| TN | Total nitrogen |
| WCA | Water Conservation Area |
| EAA | Everglades Agricultural Area |
| CERP | Central Everglades Restoration Plan |
| FEB | Flow equalization basins |
| EFA | Everglades Forever Act |
| BMP | Best management practice |
| STA | Stormwater treatment area |
References
- Perry, W.B. Everglades restoration and water quality challenges in south Florida. Ecotoxicology 2008, 17, 569–578. [Google Scholar] [CrossRef] [PubMed]
- Florida Department of Environmental Protection. Criteria for Surface Water Quality Classification. Available online: http://www.dep.state.fl.us/legal/Rules/shared/62-302/302-Table.pdf (accessed on 17 May 2016).
- Richardson, C.J. The Everglades: North America’s subtropical wetland. Wetl. Ecol. Manag. 2010, 18, 517–542. [Google Scholar] [CrossRef]
- Chimney, M.J.; Goforth, G. History and description of the Everglades Nutrient Removal Project, a subtropical constructed wetland in south Florida (USA). Ecol. Eng. 2006, 27, 268–278. [Google Scholar] [CrossRef]
- National Park Services. Everglades National Park—Geological Resource Evaluation Report. Available online: https://www.nature.nps.gov/geology/inventory/publications/reports/ever_gre_rpt_view.pdf (accessed on 10 November 2015).
- Gaiser, E.; Trexler, J.; Wetzel, P. The Florida Everglades. In Wetland Habitats of North America Ecology and Conservation Concerns; Batzer, D., Baldwin, A., Eds.; University of California Press: Berkeley, CA, USA, 2012. [Google Scholar]
- Harvey, J.W.; McCormick, P.V. Groundwater’s significance to changing hydrology, water chemistry, and biological communities of a floodplain ecosystem, Everglades, South Florida, USA. Hydrogeol. J. 2009, 17, 185–201. [Google Scholar] [CrossRef]
- Moller, S. The Everglades National Park—Evolution of the Everglades Peatland. TU-Bergakademie Freiberg. Available online: http://www.geo.tu-freiberg.de/oberseminar/os06_07/stephanie_moeller.pdf (accessed on 2 November 2015).
- Kotun, K. Everglades National Park 2013 Indicators of Integrity. South Florida Natural Resources Center Status and Trends Report. Available online: http://www.nps.gov/ever/learn/nature/upload/2013_State_of-Conservation_Indicator_of-Integrity.pdf (accessed on 10 November 2015).
- Wu, Y.; Wang, N.; Rutchey, K. An analysis of spatial complexity of ridge and slough patterns in the Everglades ecosystem. Ecol. Complex. 2006, 3, 183–192. [Google Scholar] [CrossRef]
- McVoy, C.W.; Said, W.P.; Obeysekera, J.; van Arman, J.; Dreschel, T. Landscapes and Hydrology of the Predrainage Everglades; University Press of Florida: Gainsville, FL, USA, 2011; p. 576. [Google Scholar]
- Saunders, C.J.; Gao, M.; Lynch, J.A.; Jaffe, R.; Childers, D.L. Using soil profiles of seeds and molecular markers as proxies for sawgrass and wet prairie slough vegetation in Shark Slough, Everglades National Park. Hydrobiologia 2006, 569, 475–492. [Google Scholar] [CrossRef]
- Olmsted, I.; Armentano, T.V. Vegetation of Shark Slough, Everglades National Park. South Florida Natural Resources Center Technical Report 97-001. Available online: https://www.nps.gov/ever/learn/nature/upload/SecureTRSFNRC97-001.pdf (accessed on 25 May 2016).
- Serna, A.; Richards, J.H.; Troxler, T.G.; Scinto, L.J. Vegetation and soil response to hydrology in a re-created Everglades. Hydrobiologia 2015, 757, 167–183. [Google Scholar] [CrossRef]
- U.S. Fish and Wildlife Service. Freshwater Marshes and Wet Prairies. In South Florida Multi-Species Recovery Plan. Available online: https://www.fws.gov/verobeach/MSRPPDFs/FreshMarWetPrairie.pdf (accessed on 25 May 2016).
- Loveless, C.M. A study of the vegetation in the Florida Everglades. Ecology 1959, 40, 1–9. [Google Scholar] [CrossRef]
- Givnish, T.J.; Volin, J.C.; Owen, V.D.; Volin, V.C.; Muss, J.D.; Glaser, P.H. Vegetation differentiation in the patterned landscape of the central Everglades: Importance of local and landscape drivers. Glob. Ecol. Biogeogr. 2008, 17, 384–402. [Google Scholar] [CrossRef]
- Larsen, L.; Aumen, N.; Bernhardt, C.; Engel, V.; Givnish, T.; Hagerthey, S.; Harvey, J.; Leonard, L.; McCormick, P.; McVoy, C.; et al. Recent and Historic Drivers of Landscape Changes in the Everglades Ridge, Slough, and Tree Island Mosaic. Environ. Sci. Technol. 2011, 41, 344–381. [Google Scholar] [CrossRef]
- Ogden, J.C. Everglades Ridge and Slough Conceptual Ecological Model. Wetlands 2005, 25, 810–820. [Google Scholar] [CrossRef]
- Castaneda-Moya, E.; Twilley, R.R.; Rivera-Moya, V.H.; Zhang, K.; Davis, S.E., III; Ross, M. Sediment and Nutrient Deposition Associated with Hurricane Wilma in Mangroves of the Florida Coastal Everglades. Estuar. Coasts 2010, 33, 45–58. [Google Scholar] [CrossRef]
- Castaneda-Moya, E.; Twilley, R.R.; Rivera-Monroy, V.H. Allocation of biomass and net primary productivity of mangrove forests along environmental gradient in the Florida Costal Everglades, USA. For. Ecol. Manag. 2013, 307, 226–241. [Google Scholar] [CrossRef]
- Twilley, R.R.; Day, J.W., Jr. The productivity and nutrient cycling of mangrove ecosystems. In Ecosistemas de Manglar en AMERICA Tropical; Yanez-Arancibia, A., Lara-Dominguez, A.L., Eds.; UICN: Gland, Switzerland, 1999; pp. 127–152. [Google Scholar]
- National Park Services. Inventory of Threatened and Endangered Species in Everglades National Park. Available online: http://www.nps.gov/ever/learn/nature/techecklist.htm (accessed on 10 November 2015).
- Sklar, F.H.; Chimney, M.J.; Newman, S.; McCormick, P.; Gawlik, D.; Miao, S.; McVoy, C.; Said, W.; Newman, J.; Coronado, C.; et al. The ecological–societal underpinnings of Everglades restoration. Front. Ecol. Environ. 2005, 3, 161–169. [Google Scholar]
- South Florida Water Management District. South Florida Environmental Report—Highlights. Available online: https://issuu.com/southfloridawatermanagement/docs/2016_sfer_highlights_final?e=4207603/33817547 (accessed on 15 March 2016).
- Florida Fish and Wildlife Conservation Commission. Python Permit Program Frequently Asked Questions. Available online: http://myfwc.com/wildlifehabitats/nonnatives/python/faqs/permit-faqs/ (accessed on 2 May 2016).
- U.S. Environmental Protection Agency. Americas Wetlands—Our Vital Link between Land and Water. Available online: https://www.csu.edu/cerc/documents/AmericasWetlands.pdf (accessed on 10 November 2015).
- Center for Urban and Environmental Solutions at Florida Atlantic University. The Economics of the Everglades Watershed and Estuaries. Available online: http://www.drivecms.com/uploads/riverofgrasscoalition.com/1022369245The%20Economics%20of%20the%20Everglades%20FINAL%20REPORT.pdf (accessed on 10 November 2015).
- Florida Department of Environmental Protection. Kissimmee River Watershed. Available online: http://www.protectingourwater.org/watersheds/map/kissimmee_river/ (accessed on 2 May 2016).
- Havens, K.E.; Gawlik, D.E. Lake Okeechobee Conceptual Ecological Model. Wetlands 2005, 25, 908–925. [Google Scholar] [CrossRef]
- Byrne, M.J.; Wood, S.M. Concentrations and Loads of Nutrients in the Tributaries of the Lake Okeechobee Watershed, South-Central Florida, Water Years 2004–2008: U.S. Geological Survey Data Series 613. Available online: https://pubs.usgs.gov/ds/613/pdf/USGS_DS-613_Byrne.pdf (accessed on 2 May 2016).
- Cantillo, A.Y.; O’Connor, T.P.; Lauenstein, G.G. South Florida Environmental Quality. NOAA Technical Memo, NOS ORCA 75. Available online: http://www.aoml.noaa.gov/general/lib/sfeq.pdf (accessed on 27 June 2016).
- Boyer, J.N.; Fourqurean, J.W.; Jones, R.D. Seasonal and Long-Term Trends in the Water Quality of Florida Bay. Estuaries 1999, 22, 417–430. [Google Scholar] [CrossRef]
- Lorenz, J.J. A Review of the Effects of Altered Hydrology and Salinity on Vertebrate Fauna and Their Habitats in Northeastern Florida Bay. Wetlands 2014, 34, 189–200. [Google Scholar] [CrossRef]
- Kang, W.-J.; Trefry, J.H. Identifying increased inputs of terrestrial phosphorus to sediments of the southwestern Everglades and Florida Bay. Estuar. Coast. Shelf Sci. 2013, 129, 28–36. [Google Scholar] [CrossRef]
- Melesse, A.M.K.; Zhang, K. Modeling Costal Eutrophication at Florida Bay Using Neural Networks. J. Coast. Res. 2008, 24, 190–196. [Google Scholar] [CrossRef]
- Woodland, R.J.; Thomson, J.R.; MacNally, R.; Reich, P.; Evrard, V.; Wary, F.Y.; Walker, J.P.; Cook, P.L.M. Nitrogen loads explain primary productivity in estuaries at the ecosystem scale. Limnol. Oceanogr. 2015, 60, 1751–1762. [Google Scholar] [CrossRef]
- Izuno, F.T.; Rice, R.W.; Capone, L.T. Best Management Practices to Enable the Coexistence of Agriculture and the Everglades Environment. Hort Sci. 1999, 34, 27–33. [Google Scholar]
- Fling, H.E.; Aumen, N.G.; Armentano, T.; Mazzotti, F.J. The Role of Flow in the Everglades Landscape. Soil Water Deparment of University of Florida IFAS Extension Publication CIR 1452. Available online: https://edis.ifas.ufl.edu/pdffiles/UW/UW19900.pdf (accessed on 23 August 2016).
- Sklar, F.; McVoy, C.; van Zee, R.; Gawlik, D.; Swift, D.; Park, W.; Fitz, C.; Wu, Y.; Rudnick, D.; Fontaine, T.; et al. Chapter 2—Hydrologic Needs: The Effect of Altered Hydrology on the Everglades. Everglades Interim Report. Available online: http://www.sfwmd.gov/portal/page/portal/pg_grp_sfwmd_sfer/portlet_prevreport/interimrpt_98/chpt2.pdf (accessed on 23 August 2016).
- U.S. Geological Survey. Land Subsidence in the United States. Available online: http://pubs.usgs.gov/circ/circ1182/pdf/circ1182_intro.pdf (accessed on 10 November 2015).
- Prinos, S.T.; Wacker, M.A.; Cunningham, K.J.; Fitterman, D.V. Origins and Delineation of Saltwater Intrusion in the Biscayne Aquifer and Changes in the Distribution of Saltwater in Miami-Dade County, Florida. U.S. Geological Survey. Available online: http://pubs.usgs.gov/sir/2014/5025/pdf/sir2014-5025.pdf (accessed on 23 August 2016).
- University of Florida. Mitigating Saltwater Intrustion through Everglades Restoration: A Policy Proposal for the Florida Legislature. Available online: http://www.bobgrahamcenter.ufl.edu/sites/default/files/mitigating_saltwater_intrusion_policy_proposal.pdf (accessed on 23 August 2016).
- Reddy, K.R.; Newman, S.; Osborne, T.Z.; White, J.R.; Fitz, H.C. Phosphorus Cycling in the Greater Everglades Ecosystem: Legacy Phosphorus Implications for Management and Restoration. Environ. Sci. Technol. 2011, 41, 149–186. [Google Scholar] [CrossRef]
- Chebud, Y.; Naja, G.M.; Riveroa, R. Phosphorus Run-off Assessment in a Watershed. J. Environ. Monit. 2011, 13, 66–73. [Google Scholar] [CrossRef] [PubMed]
- Daroub, S.H.; Stuck, J.D.; Lang, T.A.; Diaz, O.A. Particulate Phosphorus in the Everglades Agricultural Area: I—Introduction and Sources. Soil Water Department of University of Florida IFAS Extension Publication SL 197. Available online: https://edis.ifas.ufl.edu/pdffiles/SS/SS41000.pdf (accessed on 10 November 2015).
- Frossard, F.; Brossard, M.; Hedley, M.J.; Metherell, A. Reactions controlling the cycling of P in soils. In Phosphorus in the Global Environment: Transfers, Cycles, and Management; Tiessen, H., Ed.; John Wiley & Sons: New York, NY, USA, 1995. [Google Scholar]
- Diaz, O.A.; Daroub, S.H.; Stuck, J.D.; Clark, M.W.; Lang, T.A.; Reddy, K.R. Sediment Inventory and Phosphorus Fractions for Water Conservation Area Canals in the Everglades. Soil Sci. Soc. Am. J. 2006, 70, 863–871. [Google Scholar] [CrossRef]
- Pfeuffer, R.J. Pesticide Surface Water Quality Report November 2015 Sampling Event; South Florida Water Management District: West Palm Beach, FL, USA, 2015.
- Quinete, N.; Castro, J.; Fernandez, A.; Zamora-Ley, I.M.; Rand, G.M.; Gardinali, P.R. Occurrence and Distribution of Endosulfan in Water, Sediment, and Fish Tissue: An Ecological Assessment of Protected Lands in South Florida. J. Agric. Food Chem. 2013, 61, 11881–11892. [Google Scholar] [CrossRef] [PubMed]
- Rand, G.M.; Carriger, J.F.; Gardinali, P.R.; Castro, J. Endosulfan and its metabolite, endosulfan sulfate, in freshwater ecosystems of South Florida: A probabilistic aquatic ecological risk assessment. Ecotoxicology 2010, 19, 879–900. [Google Scholar] [CrossRef] [PubMed]
- Fink, L.; Rumbold, D.; Rawlik, P. The Everglades Mercury Problem in the Everglades. In Everglades Interim Report; South Florida Water Management District. Available online: https://my.sfwmd.gov/portal/page/portal/pg_grp_sfwmd_sfer/portlet_prevreport/interimrpt_98/chpt7.pdf (accessed on 2 May 2016).
- Gabriel, M.C.; Howard, N.; Osborne, T.Z. Fish Mercury and Surface Sulfate Relationships in the Everglades Protection Area. Environ. Manag. 2014, 53, 583–593. [Google Scholar] [CrossRef] [PubMed]
- Florida Department of Environmental Protection. Mercury in Aquatic Ecosystems in Florida. Available online: http://www.dep.state.fl.us/Water/sas/mercury/index.htm (accessed on 2 May 2016).
- Florida Department of Environmental Protection. Blue-Green Algae. Available online: https://www.dep.state.fl.us/water/bgalgae/faq.htm (accessed on 23 August 2016).
- Reddy, K.R.; White, J.R.; Wright, A.L.; Chua, T. Influence of phosphorus loading on the microbial processes in the soil and water column of wetlands. In Phosphorus Biogeochemistry of Sub-Tropical Ecosystems; Reddy, K.R., O’Connor, G.A., Schelsk, C.L., Eds.; CRC Press: Boca Raton, FL, USA, 1999; pp. 249–274. [Google Scholar]
- Surratt, D.; Aumen, N.G. Factors influencing phosphorus levels delivered to Everglades National Park, Florida, USA. Environ. Manag. 2014, 54, 223–239. [Google Scholar] [CrossRef] [PubMed]
- Brown, P.; Wright, A.L. The role of periphyton in the Everglades. Soil Water Department, University of Florida IFAS Extension Publication SL 310. , 2009. Available online: https://edis.ifas.ufl.edu/pdffiles/SS/SS52200.pdf (accessed on 10 November 2015).
- Zelder, J.B.; Kercher, S. Causes and consequences of invasive plants in wetlands: Opportunities, opportunist, and outcomes. Plant Sci. 2006, 23, 431–452. [Google Scholar]
- National Research Council. Progress Toward Restoring the Everglades: The Third Biennial Review—2010; The National Academies Press: Washington, DC, USA, 2011. [Google Scholar]
- Delfino, J.J.; Heaney, J.P. Challenges to water resources sustainability in Florida. In Proceedings of the Allocating Water: Economics and the Environment, Universities Council on Water Resources, Portland, OR, USA, 22 July 2004; Available online: http://opensiuc.lib.siu.edu/cgi/viewcontent.cgi?article=1106&context=ucowrconfs_2004 (accessed on 10 November 2015).
- Light, A.R. Reducing Nutrient Pollution in the Everglades Agricultural Area through Best Management Practices. Nat. Resour. Environ. 2010, 25, 26–30. [Google Scholar]
- Inglett, P.W.; Rivera-Monroy, V.H.; Wozniak, J. Biogeochemistry of Nitrogen Across the Everglades Landscape. Environ. Sci. Technol. 2011, 41, 187–216. [Google Scholar] [CrossRef]
- Morgan, K.T.; McCray, J.M.; Rice, R.W.; Gilbert, R.A.; Baucum, L.E. Review of Current Sugarcane Fertilizer Recommendations: A Report from the UF/IFAS Sugarcane Fertilizer Standard Task Force. Soil and Water Department, University of Florida IFAS Extension Publication SL 295. Available online: https://edis.ifas.ufl.edu/ss508 (accessed on 2 May 2016).
- Schindler, D.W.; Carpenter, S.R.; Chapra, S.C.; Hecky, R.E.; Orihel, D.M. Reducing Phosphorus to Curb Lake Eutrophication is a Success. Environ. Sci. Technol. 2016. [Google Scholar] [CrossRef] [PubMed]
- U.S. Environmental Protection Agency, Office of Water. Numeric Nutrient Criteria for the State of Florida: Withdrawing the Federal Actions Factsheet. 4305T, EPA-820-F-14-006. Available online: https://www.epa.gov/sites/production/files/2015-07/documents/factsheet-withdrawl-2014.pdf (accessed on 14 June 2016).
- Florida Department of Environmental Protection. Numeric Nutrient Standards for Florida Waters. Available online: http://www.dep.state.fl.us/water/wqssp/nutrients/ (accessed on 14 June 2016).
- Schwartz, R.E.; Chung, D.Y.; Mendoza, T. Nutrients in the Courts: Cooperative Federalism Entangles EPA Actions on Nitrogen and Phosphorus. Environ. Law Rep. 2014, 44, 10163–10172. [Google Scholar]
- Houck, O.A. Cooperative Federalism, Nutrients, and the Clean Water Act: Three Cases Revisited. Environ. Law Rep. 2014, 44, 10426–10442. [Google Scholar]
- Qian, S.S.; Lavine, M. Setting Standards for Water Quality in the Everglades. Chance 2003, 16, 10–16. [Google Scholar] [CrossRef]
- Richardson, C.J.; King, R.S.; Qian, S.S.; Vaithiyanathan, P.; Qualls, R.G.; Stow, C.A. Estimating Ecological Thresholds for Phosphorus in the Everglades. Environ. Sci. Technol. 2007, 41, 8084–8091. [Google Scholar] [CrossRef] [PubMed]
- Payne, G.; Bennett, T.; Weaver, K. 2002 Everglades Consolidated Report. Chapter 5: Development of a Numeric Phosphorus Criterion for the Everglades Protection Area. Available online: http://www.sfwmd.gov/portal/page/portal/pg_grp_sfwmd_sfer/portlet_prevreport/2002_ecr/Chapters/Ch5.pdf (accessed on 15 June 2016).
- Florida Department of Environmental Protection. Numeric Interpretations of Narrative Nutrient Criteria. Rule: 62-302.531, F.A.C. Available online: https://www.flrules.org/gateway/ruleno.asp?id=62-302.531 (accessed on 15 June 2016).
- Florida Deparment of Environmental Protection. Estuary-Specific Numeric Interpretations of the Narrative Nutrient Criterion. Rule: 62-302.532, F.A.C. Available online: https://www.flrules.org/gateway/RuleNo.asp?title=SURFACE%20WATER%20QUALITY%20STANDARDS&ID=62-302.532 (accessed on 15 June 2016).
- Water Resources Development Act. Federal Legislation for 2000. Washington, DC, USA. Available online: https://www.fws.gov/habitatconservation/omnibus/wrda2000.pdf (accessed on 10 November 2015).
- South Florida Water Management District. Quick Facts on: Restoration Strategies for Clean Water for the Everglades. Available online: http://www.sfwmd.gov/portal/pls/portal/docs/17588004.PDF (accessed on 15 March 2016).
- U.S. Army Corps of Engineers, Jacksonville District. Comprehensive Everglades Restoration Plan (CERP)—Water Flow Maps of the Everglades: Past, Present and Future. Available online: http://141.232.10.32/education/presentation_materials.aspx (accessed on 20 November 2015).
- Entry, J.A. The impact of stormwater treatment and best management practices on nutrient concentration in the Florida Everglades. Water Air Soil Pollut. 2014, 225, 1758. [Google Scholar] [CrossRef]
- Stone, J.A.; Legg, D.E. Agriculture and the Everglades. J. Soil Water Conserv. 1992, 47, 207–215. [Google Scholar]
- South Florida Water Management District. Below the Surface—An in-depth look at Everglades Stormwater Treatment Areas. Available online: http://www.sfwmd.gov/portal/page/portal/xrepository/sfwmd_repository_pdf/bts_sta.pdf (accessed on 15 March 2016).
- Kadlec, R.H.; Wallace, S.D. Treatment Wetlands, 2nd ed.; CRC Press, Taylor & Francis Group: Boca Raton, FL, USA, 2009. [Google Scholar]
- Entry, J.A.; Gottlieb, A. The impact of stormwater treatment areas and agricultural best management practices on water quality in the Everglades Protection Area. Environ. Monit. Assess. 2014, 186, 1023–1037. [Google Scholar] [CrossRef] [PubMed]
- Pietro, K. Synopsis of the Everglades Stormwater Treatment Areas, Water Year 1996–2012. South Florida Water Management District Technical Publication ASB-WQTT-12-001. Available online: http://www.wwwalker.net/ever/stas/pdfs/references/STA_Synopsis_1996-2012_ASB-WQTT-12-001.pdf (accessed on 10 November 2015).
- Leeds, J. South Florida Environmental Report. South Florida Water Management District; Volume I, p. 5B-2. Available online: http://www.sfwmd.gov/portal/page/portal/pg_grp_sfwmd_sfer/portlet_prevreport/2016_sfer_final/v1/chapters/v1_ch5b.pdf (accessed on 15 March 2016).
- Committee on Independent Scientific Review of Everglades Restoration Progress; Water Science and Technology Board, Board on Environmental Studies and Toxicology; Division on Earth and Life Studies, and National Research Council. Progress Toward Restoring the Everglades—The Fifth Biennial Review—2014; The National Academies Press: Washington, DC, USA, 2014. [Google Scholar]
- Walton, T.L., Jr. Projected sea-level rise in Florida. Ocean Eng. 2007, 34, 1832–1840. [Google Scholar] [CrossRef]
- State of Florida Office of the Governor. Executive Order Number 16-155. Available online: http://www.flgov.com/2016/06/29/gov-scott-declares-state-of-emergency-in-st-lucie-and-martin-counties-following-algal-blooms/ (accessed on 10 July 2016).
- The George Barley Water Prize. Available online: http://www.barleyprize.com/ (accessed on 15 June 2016).
- European Sustainable Phosphorus Platform. Available online: http://phosphorusplatform.eu/ (accessed on 8 May 2016).
- Arizona State University. Sustainable Phosphorus Initiative. Available online: https://sustainablep.asu.edu/ (accessed on 8 May 2016).
- Douglas, M.S.; Fink, R.; Fitzgerald Rivers of America Collection (Library of Congress). The Everglades: River of Grass; Rinehart: New York, NY, USA, 1947. [Google Scholar]


© 2016 by the authors; licensee MDPI, Basel, Switzerland. This article is an open access article distributed under the terms and conditions of the Creative Commons Attribution (CC-BY) license (http://creativecommons.org/licenses/by/4.0/).
Share and Cite
Schade-Poole, K.; Möller, G. Impact and Mitigation of Nutrient Pollution and Overland Water Flow Change on the Florida Everglades, USA. Sustainability 2016, 8, 940. https://doi.org/10.3390/su8090940
Schade-Poole K, Möller G. Impact and Mitigation of Nutrient Pollution and Overland Water Flow Change on the Florida Everglades, USA. Sustainability. 2016; 8(9):940. https://doi.org/10.3390/su8090940
Chicago/Turabian StyleSchade-Poole, Kristin, and Gregory Möller. 2016. "Impact and Mitigation of Nutrient Pollution and Overland Water Flow Change on the Florida Everglades, USA" Sustainability 8, no. 9: 940. https://doi.org/10.3390/su8090940