Article

Estimating Air Particulate Matter Using MODIS Data and Analyzing Its Spatial and Temporal Pattern over the Yangtze Delta Region

1
School of Geographic Information and Tourism, Chuzhou University, Chuzhou 293000, China
2
International Institute of Earth System Science, Nanjing University, Nanjing 210093, China
3
Anhui Center for Collaborative Innovation in Geographical Information Integration and Application, Chuzhou 239000, China
4
School of Sciences, Jimei University, Xiamen 361021, China
5
Zhejiang Provincial Key Laboratory of Carbon Cycling in Forest Ecosystems and Carbon Sequestration, Zhejiang A&F University, Lin’an 311300, China
*
Authors to whom correspondence should be addressed.
Sustainability 2016, 8(9), 932; https://doi.org/10.3390/su8090932
Submission received: 3 June 2016 / Revised: 4 September 2016 / Accepted: 7 September 2016 / Published: 13 September 2016
(This article belongs to the Special Issue Air Pollution Monitoring and Sustainable Development)

Abstract

:
The deteriorating air quality in the Yangtze delta region is attracting growing public concern. In this paper, seasonal estimation models of the surface particulate matter (PM) were established by using aerosol optical thickness (AOT) retrievals from the moderate resolution imaging spectro-radiometer (MODIS) on board NASA’s Terra satellite. The change of the regional distribution of the atmospheric mixed layer, relative humidity and meteorological elements have been taken into account in these models. We also used PM mass concentrations of ground measurements to evaluate the estimation accuracy of those models. The results show that model estimation of PM2.5 and PM10 mass concentrations were in good agreement with the ground-based observation of PM mass concentrations (p < 0.01, the R2 value of the PM2.5 concentrations experimental model for four seasons are 0.48, 0.62, 0.61 and 0.52 respectively. The R2 value of PM10 concentrations experimental model for four seasons are 0.57, 0.56, 0.64 and 0.68 respectively). At the same time, spatial and temporal variations of PM2.5 and PM10 mass concentrations were analysed over the Yangtze delta region from 2000 to 2013. The results show that PM2.5 and PM10 show a trend of increase in the Yangtze delta region from 2000 to 2013 and change periodically. The maximum mass concentration of PM2.5 and PM10 was in January–February, and the minimum was in July–August. The highest values of PM2.5 and PM10 mass concentration are in the region of urban agglomeration which is grouped to a delta-shaped region by Shanghai, Hangzhou and Nanjing, while the low values are in the forest far away from the city. PM mass concentration over main cities and rural areas increased gradually year by year, and were increasing more quickly in urban areas than in rural areas.

1. Introduction

Atmospheric aerosol has been one of the most important branches of atmospheric environmental scientific research for its important role in not only global climatic change but also in changes to the environment [1,2]. Atmospheric aerosol particles, particularly PM2.5 (particle matter, PM) and PM10 which can cause the decrease of visibility and are serious hazards to human health, are important indexes to evaluate air quality. Since 1980s, with the development of social industrialization and economy, the demand of energy is increasing, which results in more serious air pollution problems.
Routine measurements of ground-level PM concentration by air quality monitoring networks can give the change of PM concentrations with time. This information has high accuracy and continuous monitoring advantages, but its spatial coverage is limited. Satellite remote sensing can be an important tool to complement ground-level measurement. The relevant satellite-derived parameter is AOT, which quantifies the extinction of solar radiation at a given wavelength due to presence of aerosols in an atmospheric column. There is a correlation between AOT and PM concentrations near the surface [3,4,5,6,7,8,9,10,11]. The satellite-derived AOT is a measure of light attention in the column that is affected by ambient conditions (e.g., variable humidity, vertical profile and chemical composition etc.) [12], while PM concentration is a measure near the surface after it has dried.
Studies on the correlation between AOT and PM concentration near the surface after vertical correction and humidity correction have been conducted, respectively. Also, some studies found that the correlation between AOT and PM concentration is impacted by meteorological conditions [13,14,15,16,17,18,19], boundary layer height [20,21,22], land use [23] and geographical location, [24] etc. Recently, researchers developed approaches using various statistical methods, from linear regression models [25,26] to more complex multiple regression and neural network techniques [13,27], generalized additive mixed models (GAMs) [23,28], and mixed effects models [29,30].
Air pollution has become an increasingly serious concern in parts of China, especially in three economic zones. The Yangtze River delta has been one of the several areas affected by haze in China [31]. At present, the monitoring and analysis of PM concentrations over the Yangtze delta is rarely reported. Therefore, using MODIS AOT to estimate PM concentration and analyzing its spatial and temporal variation is of important practical significance for scientific prediction and effective control of atmospheric PM pollution over the Yangtze delta.

2. Data and Methods

2.1. Study Area

The Yangtze delta region is situated in the lower reaches of the Yangtze river, East China. The central geographical coordinates are approximately 120.5°E, 30.5°N. This region is affected by a marine monsoon and continental monsoon climate in summer and winter, respectively. Therefore, the Yangtze delta has a marine monsoon subtropical climate, and the weather is generally warm and humid. The region is a major industrial and commercial hub in China. Because of rapid economic development over the last two decades, high concentrations of aerosols with diverse properties are being emitted in the region. These pollutants may play a more significant role in urban regions and provide a unique opportunity for understanding the impact of environmental change on climate systems, especially in urban areas (Figure 1).

2.2. Data

2.2.1. MODIS Data

The Moderate-Resolution Imaging Spectroradiometer (MODIS) of the U.S.’s NASA (National Aeronautics and Space Administration) has multispectral, wide coverage and high temporal resolution. It is carried on two satellites (Terra and Aqua) and is widely used to monitor atmospheric aerosols. Currently, NASA releases a daily land atmospheric MODIS AOT product obtained using a dark pixel algorithm. The spatial resolution of the product is 10 km, the wavelength is 0.55 μm, and the error is about 15% over land [32]. For the applicability of the aerosol product over the Yangtze delta region, we used ground-based observation data obtained by a sun photometer for validation. Fourteen years (2000–2013) of MODIS Terra AOT550 data (collection 6) were downloaded from the MODIS website [33].

2.2.2. Ground-Based Observation Data

PM2.5 and PM10 concentrations data for the Yangtze delta region are obtained from the China National Environment Monitoring Centre. We obtained hourly PM2.5 and PM10 mass concentrations from 53 air quality ground-based observation sites (Figure 1). The time of the MODIS Terra satellite overpass in China is 10:30 a.m. In order to make PM concentrations of ground-based observation data match with MODIS AOT data, we selected the mean of 10:00 a.m. to 12:00 p.m. noon air quality ground-based observation data.
AOT ground-based observation data was obtained using the French CIMEL manufactured automatic tracking and scanning sun photometer (CE-318). The CE-318 is an important instrument for atmospheric aerosol observations. It is used by NASA of the United States as the main instrument in its global aerosol observation network (AERONET). In this study we used data from six AERONET sites equipped by CE-318 sun photometers located in Yangtze delta region: Shanghai_Minhang (SHM), Hangzhou_City (HZC), Hangzhou_ZFU (HZZ), LA-TM (LA), Ningbo (NB) and Qiandaohu (QDH) (shown in blue in Figure 1). Since AERONET provides AOT data at 500 nm, these values have been interpolated at 550 nm in order to coincide with MODIS AOT550 using the following equation:
AOT550 = AOT500/exp[aln(λ12)]
where a is the AE estimated between 440 and 675 nm, λ1 is 500 nm, and λ2 is 550 nm.

2.2.3. Meteorological Data

Meteorological data were obtained from the China Meteorological Data Sharing Service System. We obtained the daily meteorological data including relative humidity, wind speed, atmospheric pressure, atmospheric temperature, dew point temperature and cloud cover for 58 meteorological observation sites in the Yangtze delta region from 1 January 2000 to 31 December 2013. We obtained the spatial data of every meteorological parameter by using the common ANUSPLIN interpolation software in meteorology [34].

2.3. Method

In order to create estimation model to predict PM concentrations, five main stages have undergone.
First, check the quality of satellite-retrieved AOT measurements.
Next, get the surface aerosol extinction coefficient by vertical correlation based on AOT and mixture layer height data.
Next, get PM concentration by humidity correction using ground-level PM measurement and relative humidity data.
Next, create a multiple linear regression model considered the influence of ground-level temperature, ground-level pressure and wind speed.
Finally, verify the accuracy of the estimation model.

2.3.1. Correction of Vertical Elevation

AOT is the most important data for estimating PM concentrations near the ground by using remote sensing retrieval and is a columnar measurement of aerosol light extinction. Under the assumption of a plane parallel atmosphere, AOT is the integration of the extinction coefficient at all altitudes along the vertical direction [35].The relationship between AOT and PM concentrations is therefore affected by the vertical distribution of aerosols. Aerosol particle concentration is negatively exponentially decreased with height because of the influence of the Earth’s gravity [36] (Equation (2)).
τ a ( λ ) = 0 κ a ( λ , z ) d z
where τ a ( λ ) is AOT, κ a ( λ , z ) is the aerosol extinction coefficient at the height of z . z represents vertical height. Assuming that the vertical direction changes of κ a ( λ , z ) are the negative exponential form, we can get the equation (Equation (3)):
κ a ( λ , z ) κ a , 0 ( λ ) exp ( z H A )
where κ a , 0 ( λ ) is the surface aerosol extinction coefficient, and H A is the aerosol scale height, which is the key parameter to reflect aerosol vertical height distribution. We obtain the following relationship between atmospheric AOT and the surface aerosol extinction coefficient (Equation (4)):
τ a ( λ ) κ a , 0 ( λ ) 0 exp ( z H A ) d z = κ a , 0 ( λ ) × H A
where τ a ( λ ) is the AOT, κ a , 0 ( λ ) is the surface aerosol extinction coefficient, and H A is the aerosol scale height. As a result of Equation (4), based on satellite-retrieved AOT, we can get the surface aerosol extinction coefficient for each pixel, just by obtaining aerosol scale height of each pixel (Equation (5)).
κ a , 0 ( λ ) τ a ( λ ) H A
In the practical applications, the aerosol scale height can be replaced by the thickness of mixed layer or atmospheric boundary layer height [37,38]. In this study, we used the mixed layer height to replace aerosol scale height, and mixed layer height is calculated using the Nozaki method based on ground observation meteorological data [39,40].

2.3.2. Correction for Relative Humidity

Under a certain height and the size distribution of PM, there is a positive correlation between PM concentrations and the aerosol extinction coefficient [10,41,42], because water vapor has a significant impact on the physical and optical characteristics of aerosol particles, such as the complex refractive index and extinction cross section [43].Therefore, the “wet” aerosol extinction coefficient needs to be corrected, to become a “dry” aerosol extinction coefficient after correction, and this has a higher correlation with PM concentrations. The influence of air humidity on the extinction coefficient can be described by the hygroscopic growth factor ( ƒ ( RH ) , RH is the relative humidity). Its value is equal to the ratio of the “wet” aerosol extinction coefficient and “dry” aerosol extinction coefficient under the same conditions. In this paper, we use the empirical relation of White and Roberts [44] to obtain the hygroscopic growth factor (Equation (6)).
ƒ ( RH ) = 1 1 RH
Using Equations (1) and (4), the “dry” surface aerosol extinction coefficient ( k a , d r y ( 0 , λ ) ) can be calculated by Equation (7):
k a , d r y ( 0 , λ ) τ a ( λ ) H A ƒ ( RH )
where k a , d r y ( 0 , λ ) is the surface aerosol extinction coefficient of the surface PM after drying.

2.3.3. Statistical Model

In this paper, we estimated PM concentrations on a daily basis and used a multivariable linear regression model which was constructed by PLS (Partial Least Square) method. Since relative humidity, aerosol scale height and meteorological conditions influence the PM–AOT relationship, we select aerosol scale height, relative humidity, temperature, pressure and wind speed as influence factors to join statistical model construction in order to improve the prediction accuracy of model. We find that PM concentrations can be calculated by Equation (8):
PM = F ( k a , d r y ( 0 , λ ) ,   T ,   P ,   W )
where k a , d r y ( 0 , λ ) is the “dry” aerosol extinction coefficient near the ground, T is ground-level measurement temperature, P is ground-level measurement pressure, and W is ground-level measurement wind speed. We express their relation by a multiple linear equation, Equation (9):
PM = a 0 + a 1 k a , d r y ( 0 , λ ) + a 2 T + a 3 P + a 4 W
where the coefficients a0, a1, a2, a3 and a4 are determined by multivariate linear fitting based on monitoring data.
The sources of aerosols differ greatly in different seasons (spring, summer, autumn, winter) over the Yangtze delta region. In the Yangtze delta region, spring and winter are affected by the continental monsoon climate which brings mainly dust aerosols. The main aerosols are sea salt and black carbon aerosol in summer. Since aerosols from different sources exhibit different physical, chemical and optical characteristics which affect the aerosol vertical correction and humidity correction, the correlation with meteorological variables is different. Consequently we expect to find different sets of values for the coefficients a0, a1, a2, a3 and a4 for different seasons.

2.3.4. Model Validation

We obtained PM2.5 and PM10 concentrations data from a total of 53 air quality ground-based observation sites over the Yangtze delta region in 2013. We chose 36 air quality ground-based observation sites in the study region (shown in red in Figure 1) to provide data of relatively spatial uniform distribution and continuous monitoring to determine the values of the coefficients, a0, a1, a2, a3 and a4 in the model. Then we chose 17 sites (shown in green in Figure 1) to provide data on air quality in the remaining ground observation sites to validate the model and determine the accuracy of the PM2.5 and PM10 model.

3. Results and Analysis

3.1. Validation of MODIS AOT Products

MODIS AOT products were validated using ground-based observation data (sun photometer) for each of six locations. Data from the sun photometer coincides to the MODIS data within 30 min of MODIS satellite overpass time, and the MODIS data were averaged over a 3 by 3 pixels area centred at the ground observation sites. The results of the linear regression analysis are shown in Figure 2. The correlation R2 values for the six locations are also given in Table 1 and range from 0.86 to 0.62. The results show that the MODIS AOT is in good agreement with the data obtained from the 6 ground-based AERONET sets of sun photometer readings. The results show that MODIS AOT products have good applicability in this study area, and provide a guarantee of the accuracy of the data for us to estimate PM concentrations based on MODIS AOT.

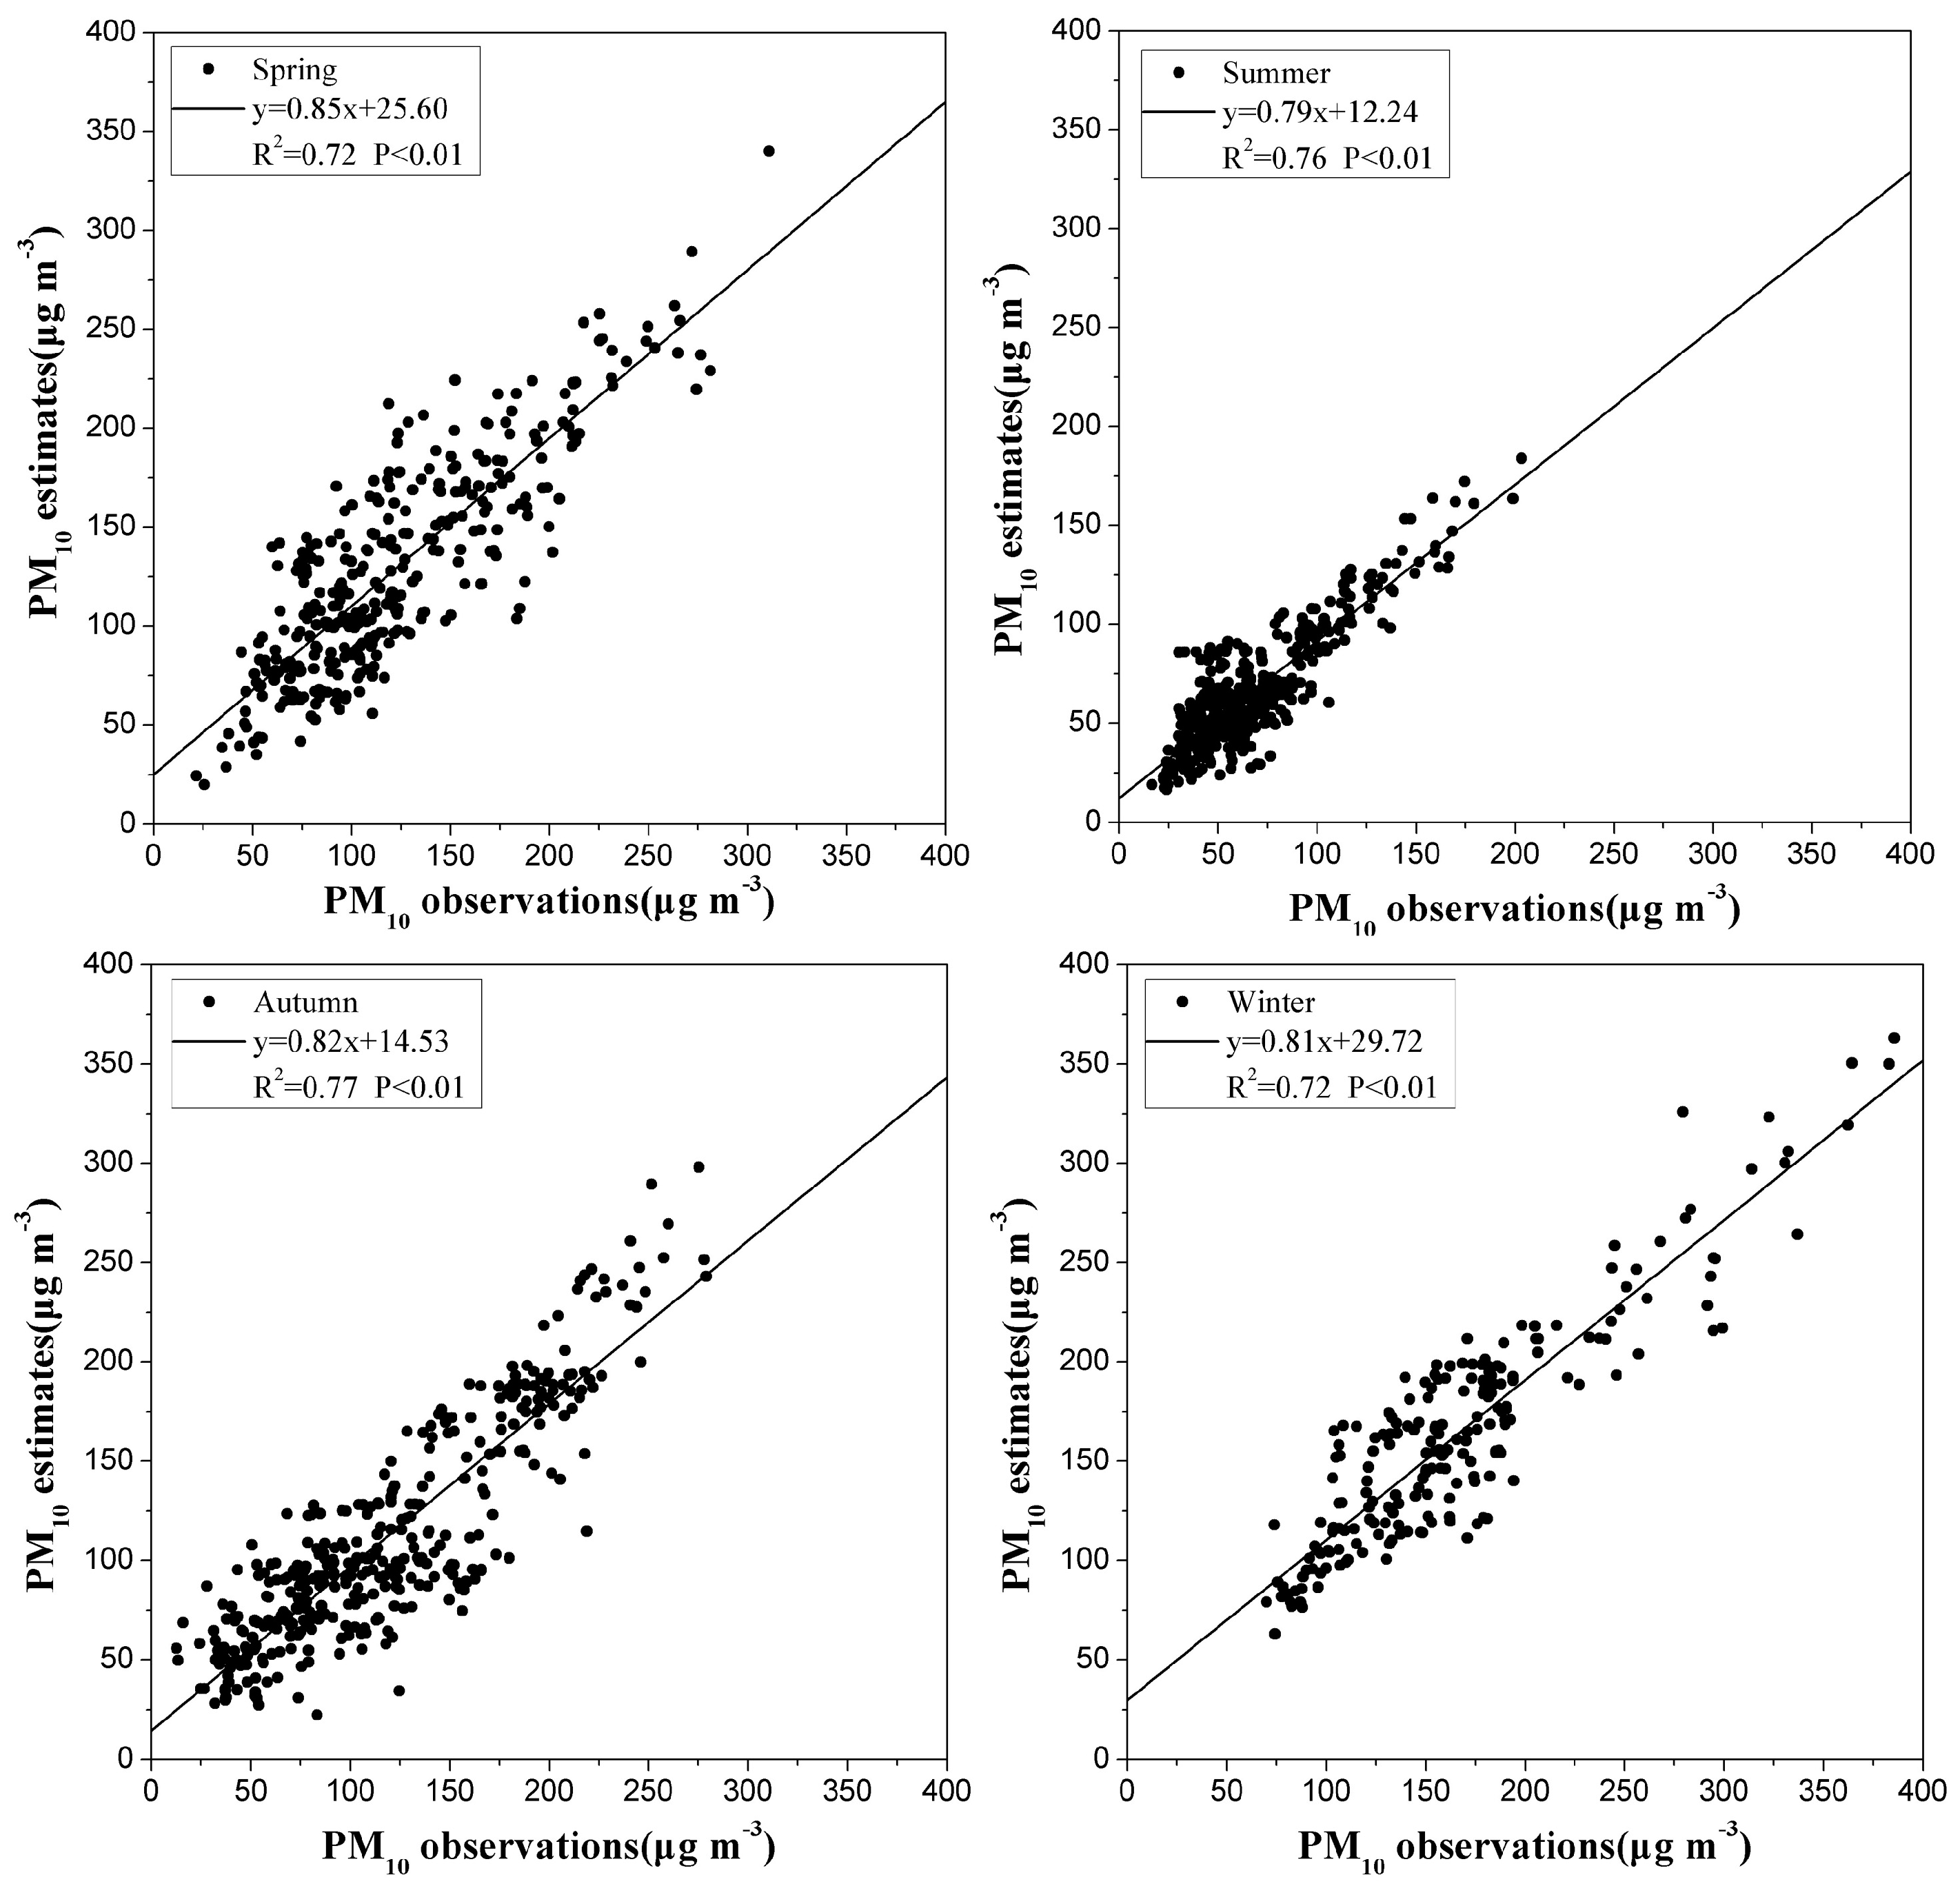
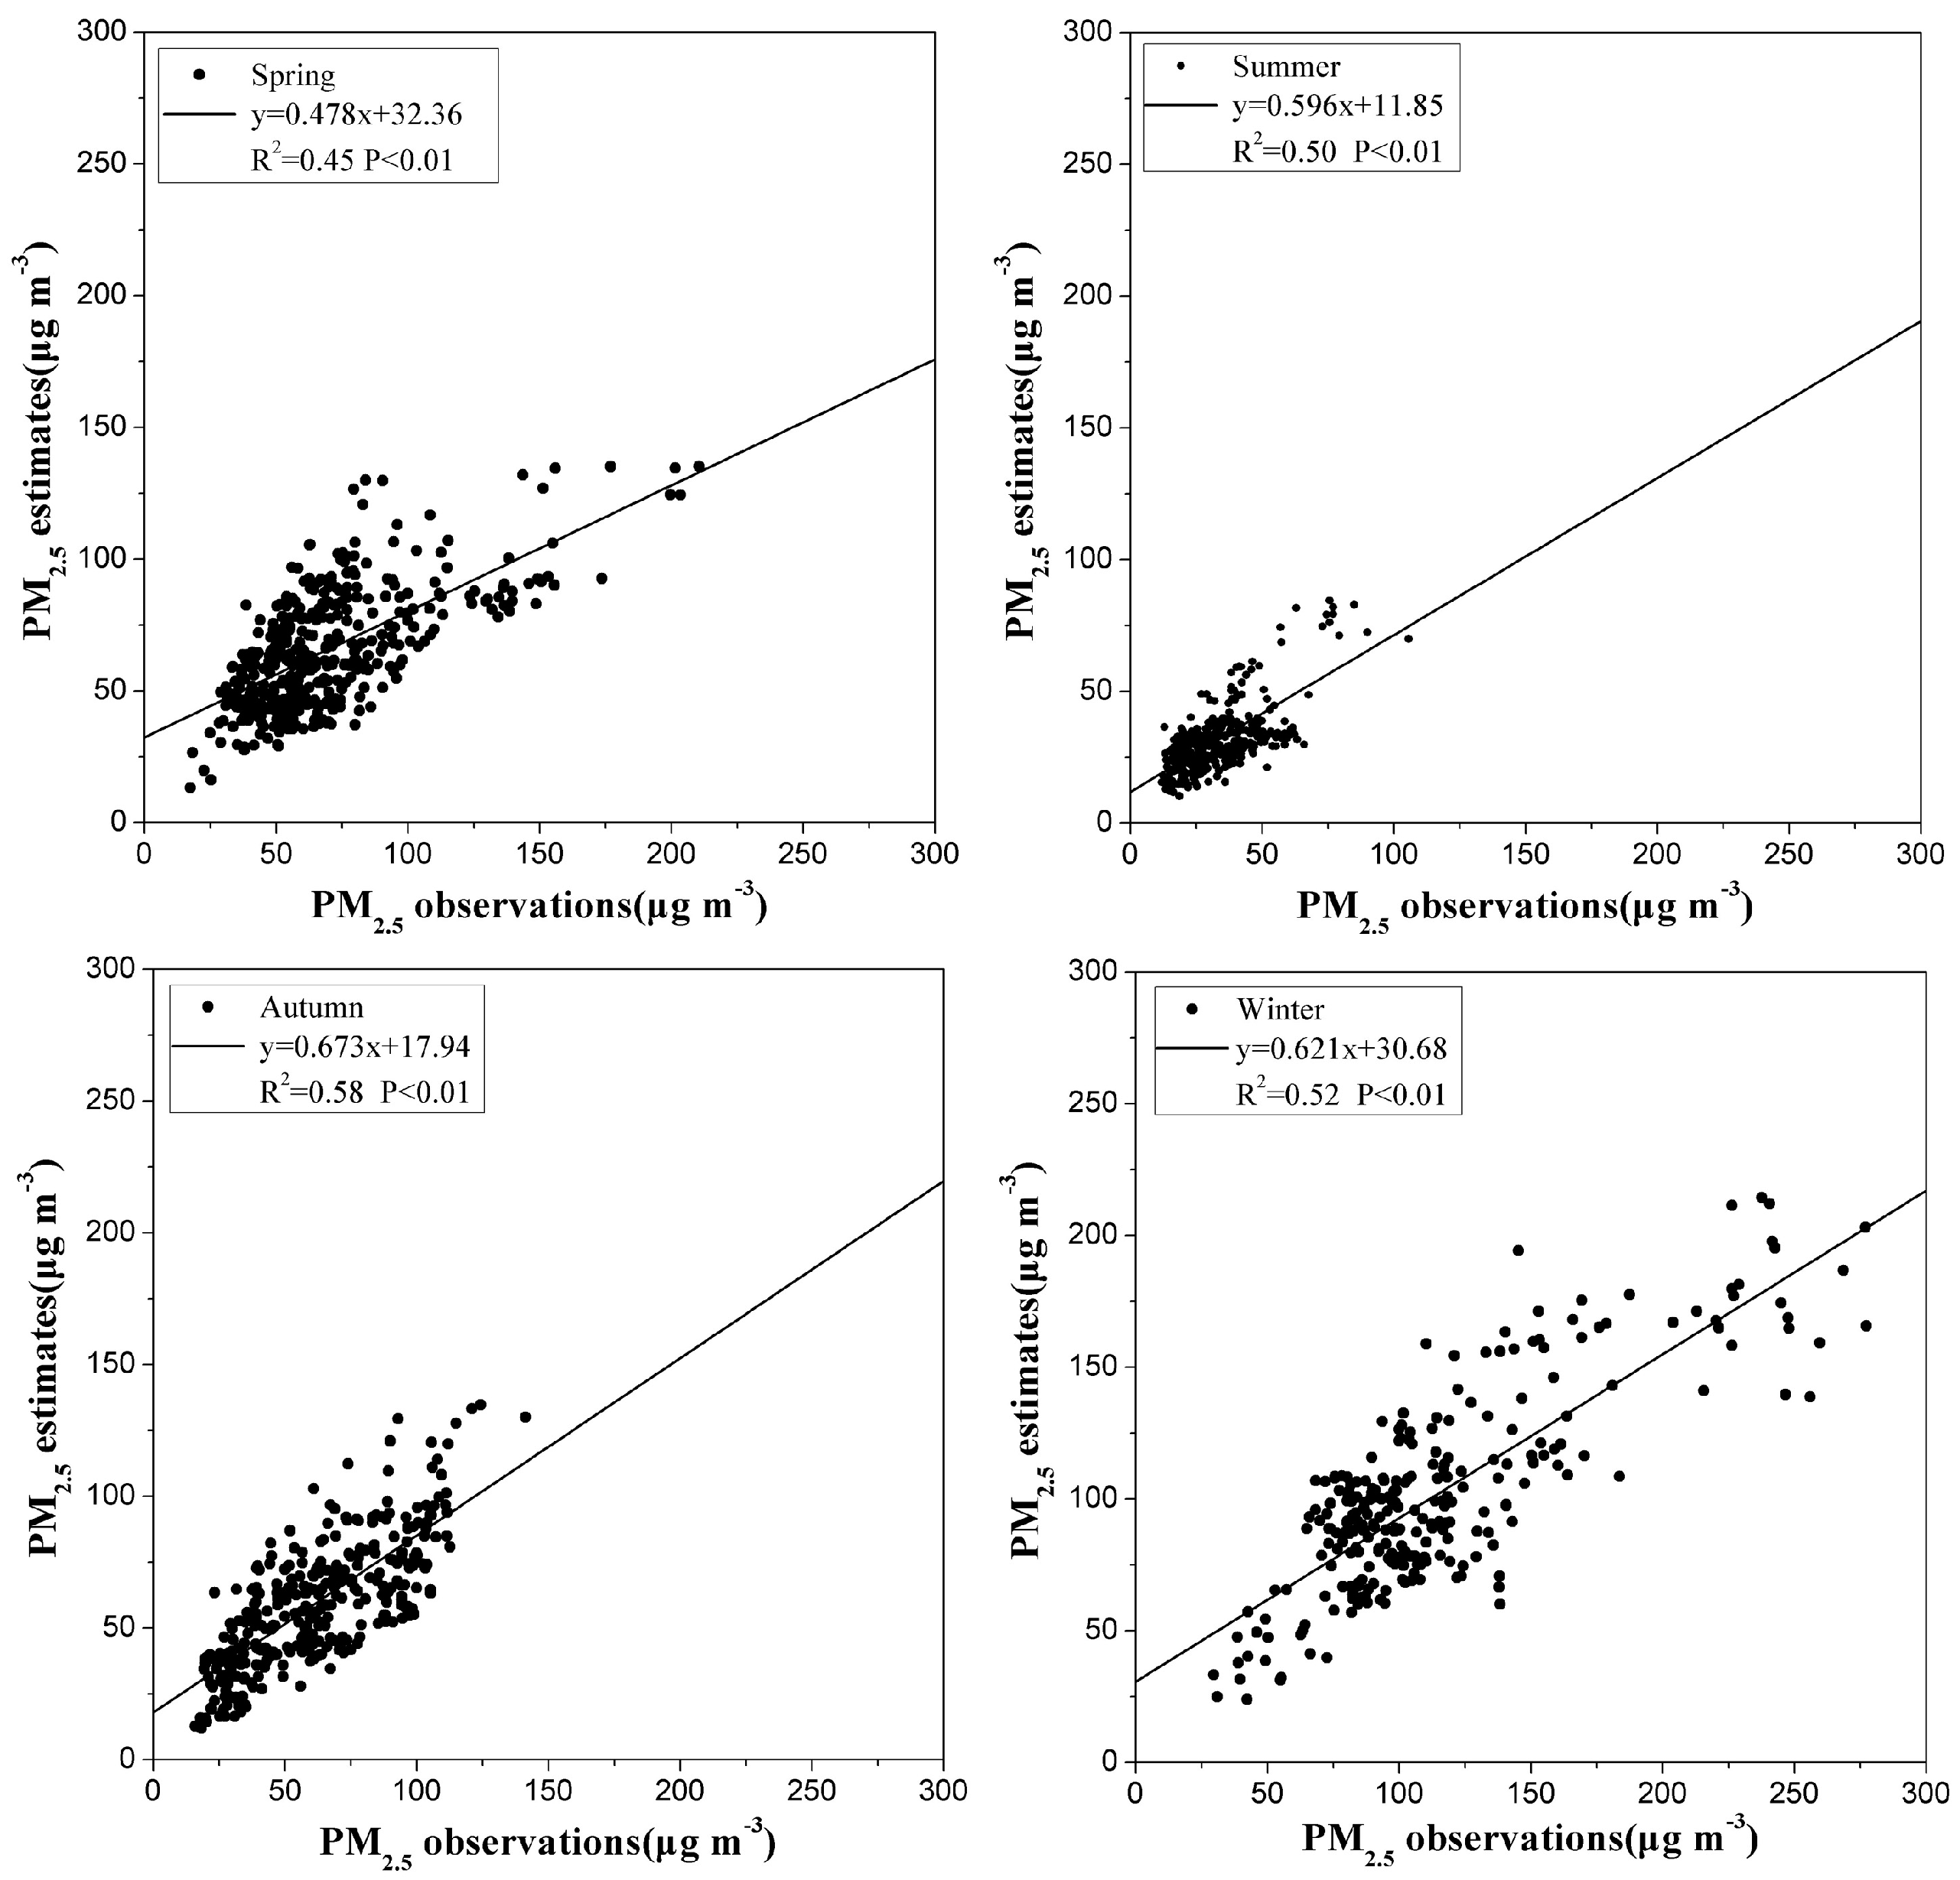
3.2. PM Estimation Model and Accuracy Validation

We determine the coefficients in Equation (9) based on aerosol extinction coefficients after vertical elevation and relative humidity correction, PM concentrations of ground observation and meteorological factors according to different seasons. Table 2 shows that the R2 of seasonal experimental models of PM2.5 concentrations is 0.48, 0.62, 0.61, 0.52, respectively, and the R2 of seasonal experimental models of PM10 concentrations is 0.57, 0.56, 0.64, 0.68, respectively.
Experimental models were validated using ground-based PM concentration data. The linear regression analysis is shown in Figure 3 and Figure 4. The results show that the estimate of PM2.5 and PM10 concentrations is in good agreement for ground-based observation data. The correlation R2 values of estimated PM2.5 concentrations and ground-observation data for the seasons of spring, summer, autumn and winter were 0.45, 0.50, 0.58, 0.52, respectively. The correlation R2 values of estimated PM10 concentrations and ground-based observation data for the seasons of spring, summer, autumn and winter were 0.72, 0.76, 0.77, 0.72, respectively. The results show that using these estimate models to estimate air PM concentrations has good applicability.

3.3. Spatial and Temporal Variation of Air PM Concentrations over the Yangtze Delta Region

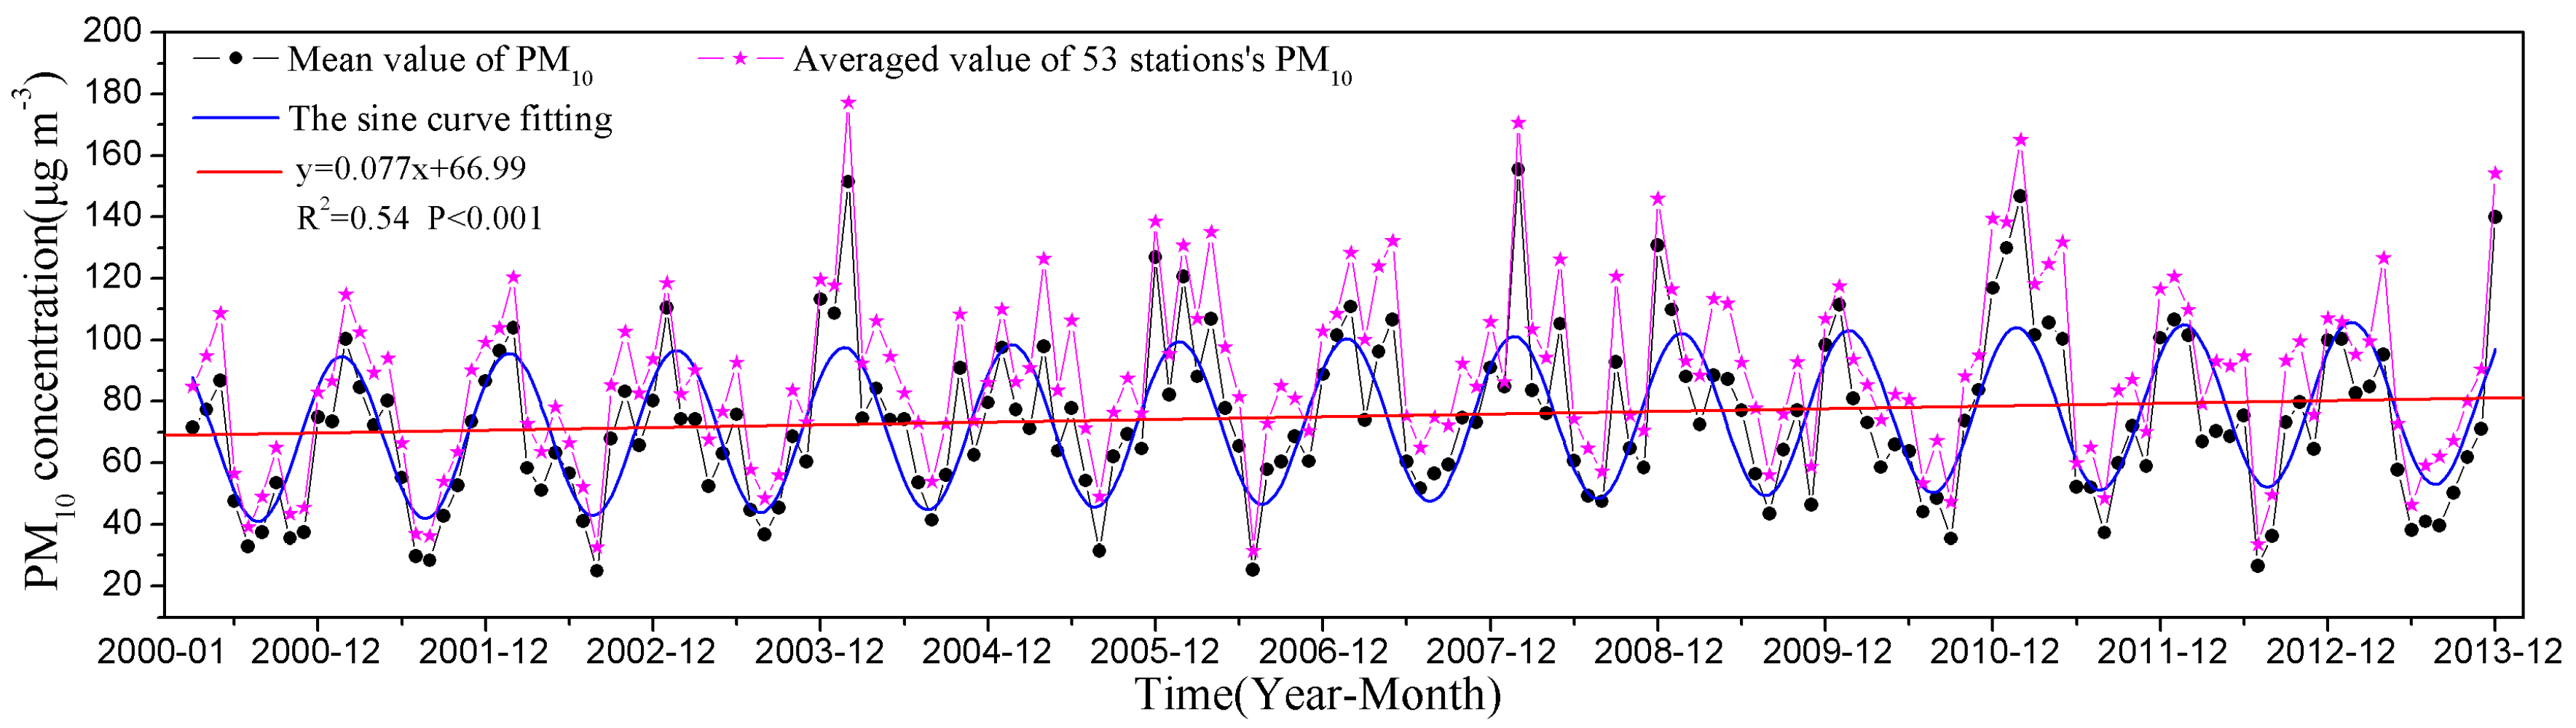
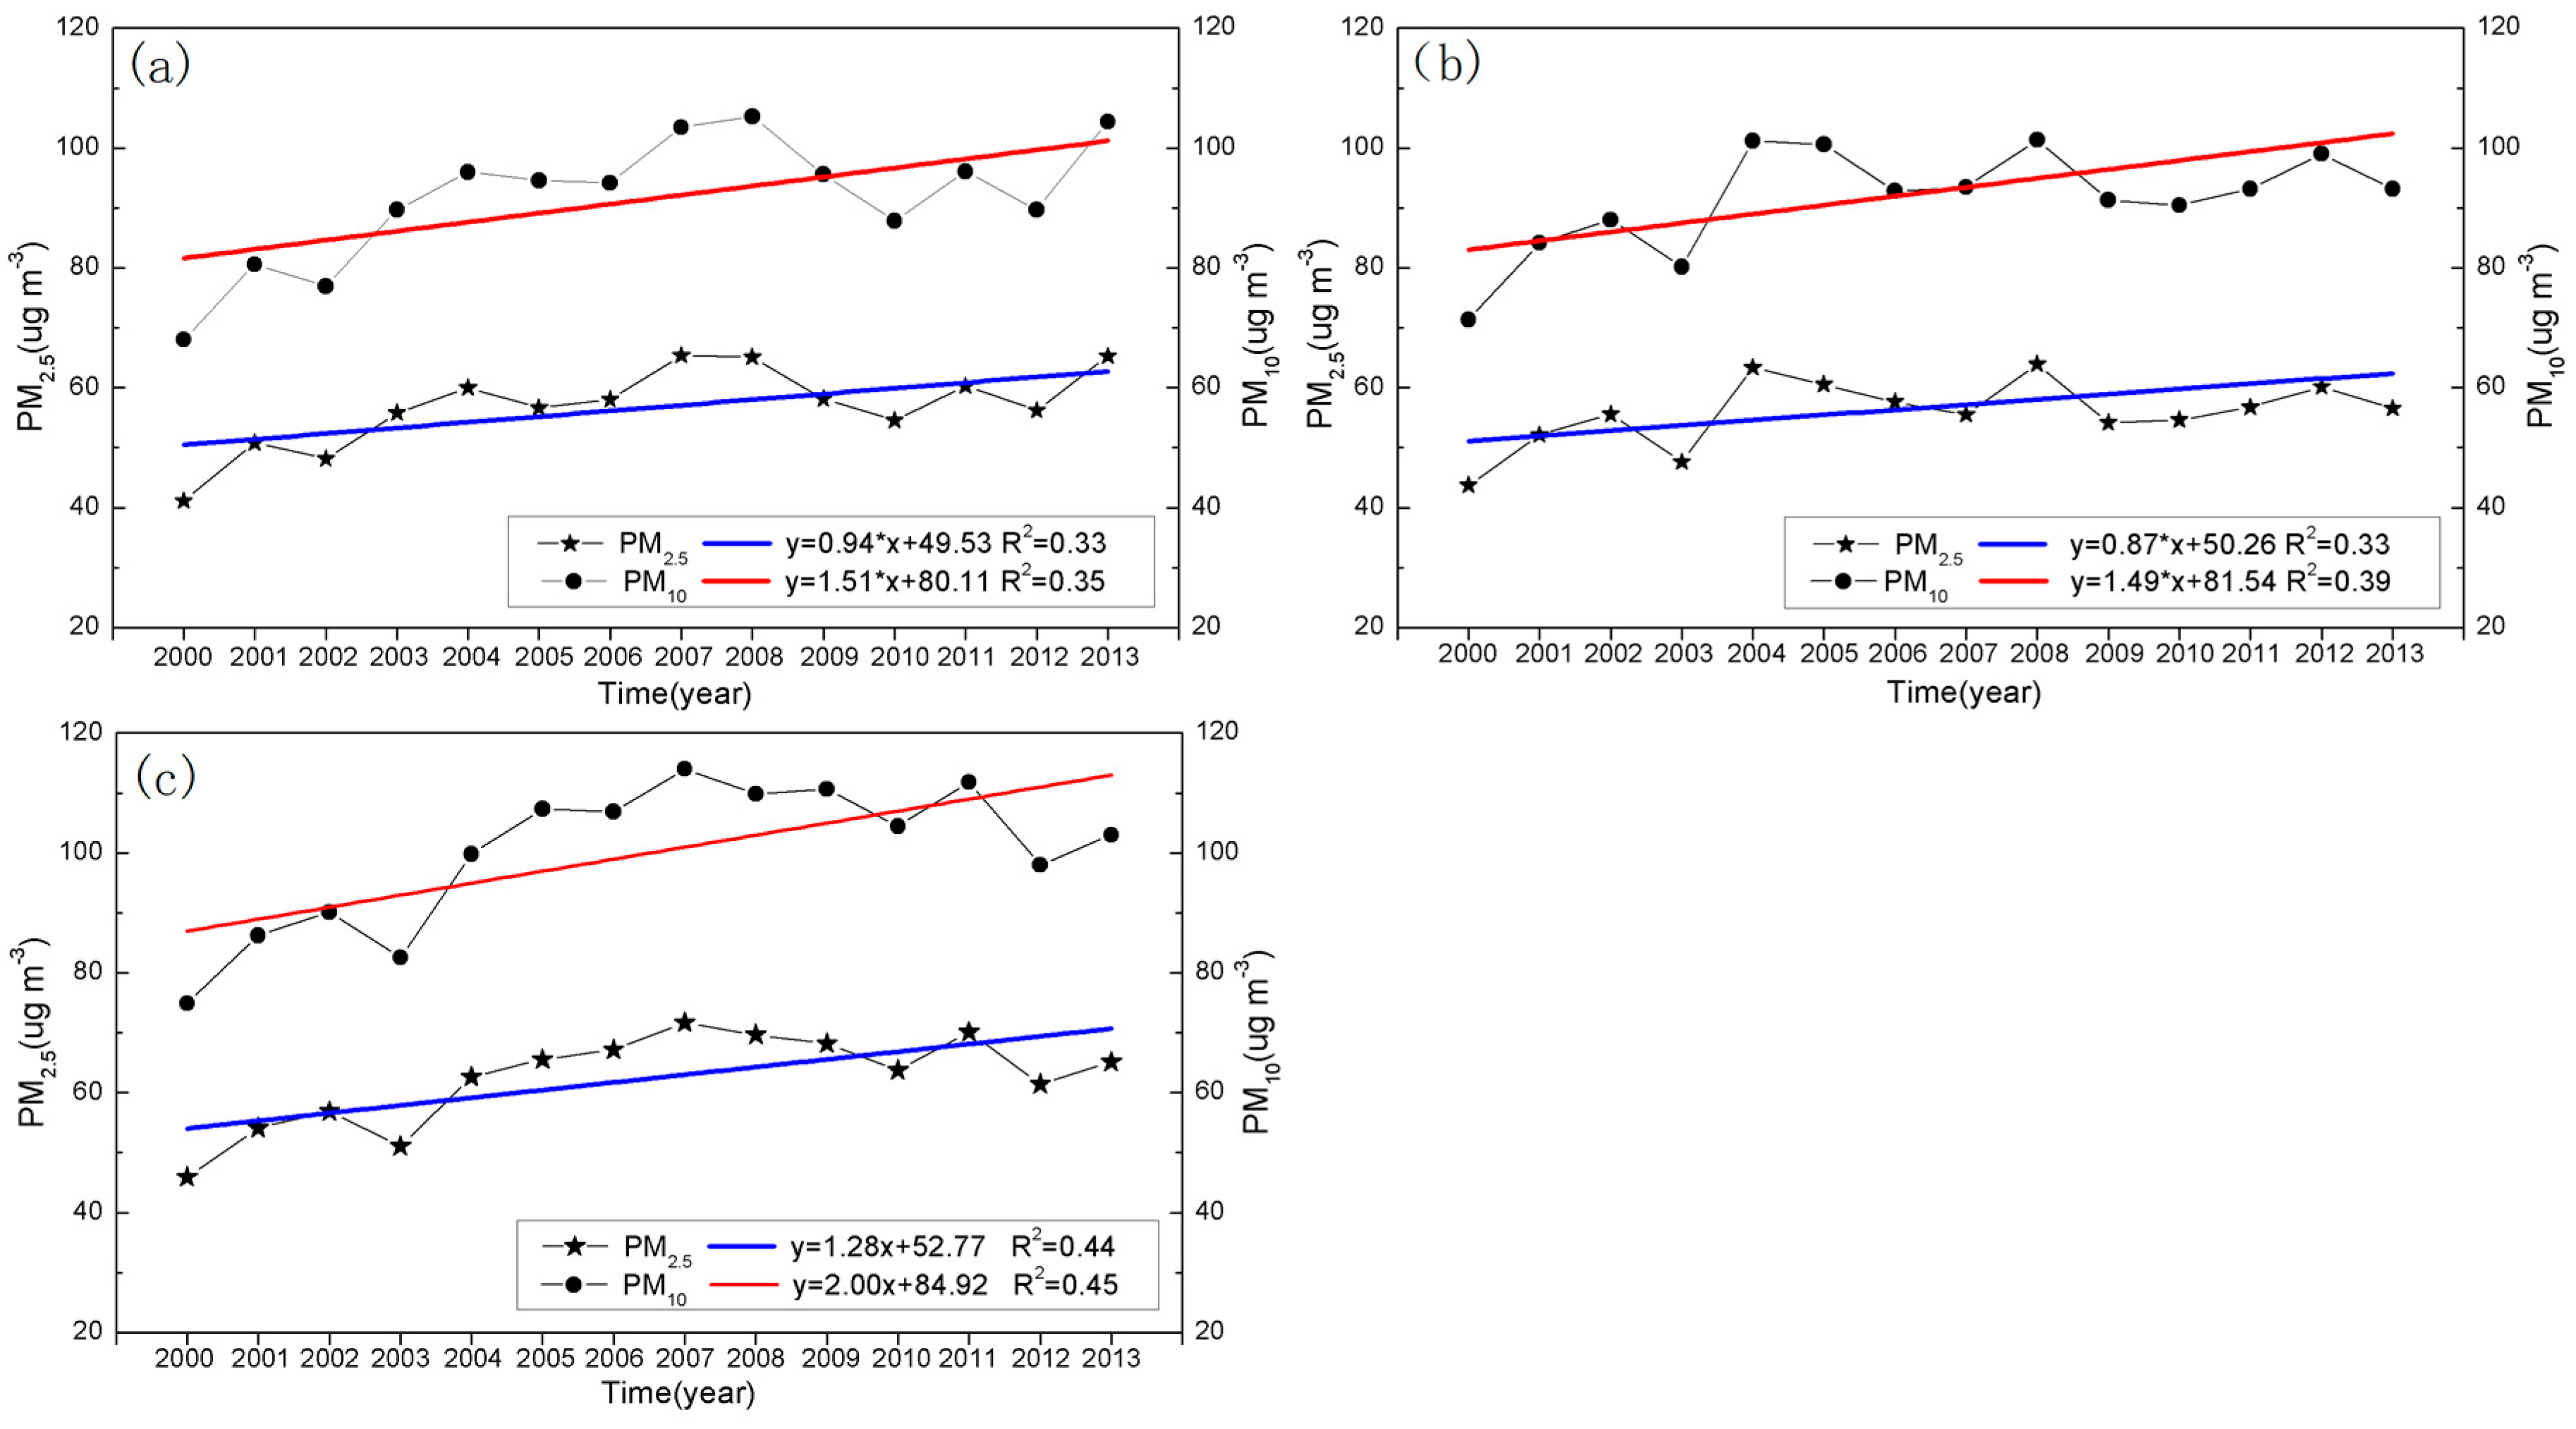
3.3.1. Temporal Variation of Air PM Concentrations over the Yangtze Delta Region

We obtain the monthly and seasonal mean of PM2.5 and PM10 concentrations from March 2000 to December 2013 by using Equation (9). Figure 5 and Figure 6 show the monthly mean PM2.5 and PM10 concentrations variation for the Yangtze delta region from March 2000 to December 2013. From Figure 5 and Figure 6, we find that mean values of PM2.5 and PM10 concentrations averaged over the 53 stations. This is because the 53 stations are located in urban and suburban areas, and PM concentrations in urban and suburban areas are generally higher than other regions due to human activities and anthropogenic pollutants. We used a sine function to fit the regional monthly mean PM2.5 and PM10 concentrations data. The result presents an obvious one year cycle variation, and shows a marked seasonal variation. The largest value often appears in January and February, and the smallest often appears in July or August, but in 2013 the largest value appeared in December. This pattern may relate to the local meteorological conditions. The trend line (slope is 0.045 μg·m−3·year−1, R2 is 0.52) in Figure 5 represents the variation trend of PM2.5 concentrations over the region. The trend line (slope is 0.074 μg·m−3·year−1, R2 is 0.55) in Figure 6 represents the variation trend of PM10 concentrations over the region. From the slope value of the trend line, we can draw the conclusion that the PM2.5 and PM10 concentrations increased with temporal evolution from 2000 to 2013, and PM10 concentrations increased faster than PM2.5 concentrations over the Yangtze delta region. Table 3 shows the regional seasonal mean PM2.5 and PM10 concentrations from 2000 to 2013. From Table 3, we find that the mean seasonal value of PM concentrations of winter is the highest, and that of summer is the lowest in four seasons.

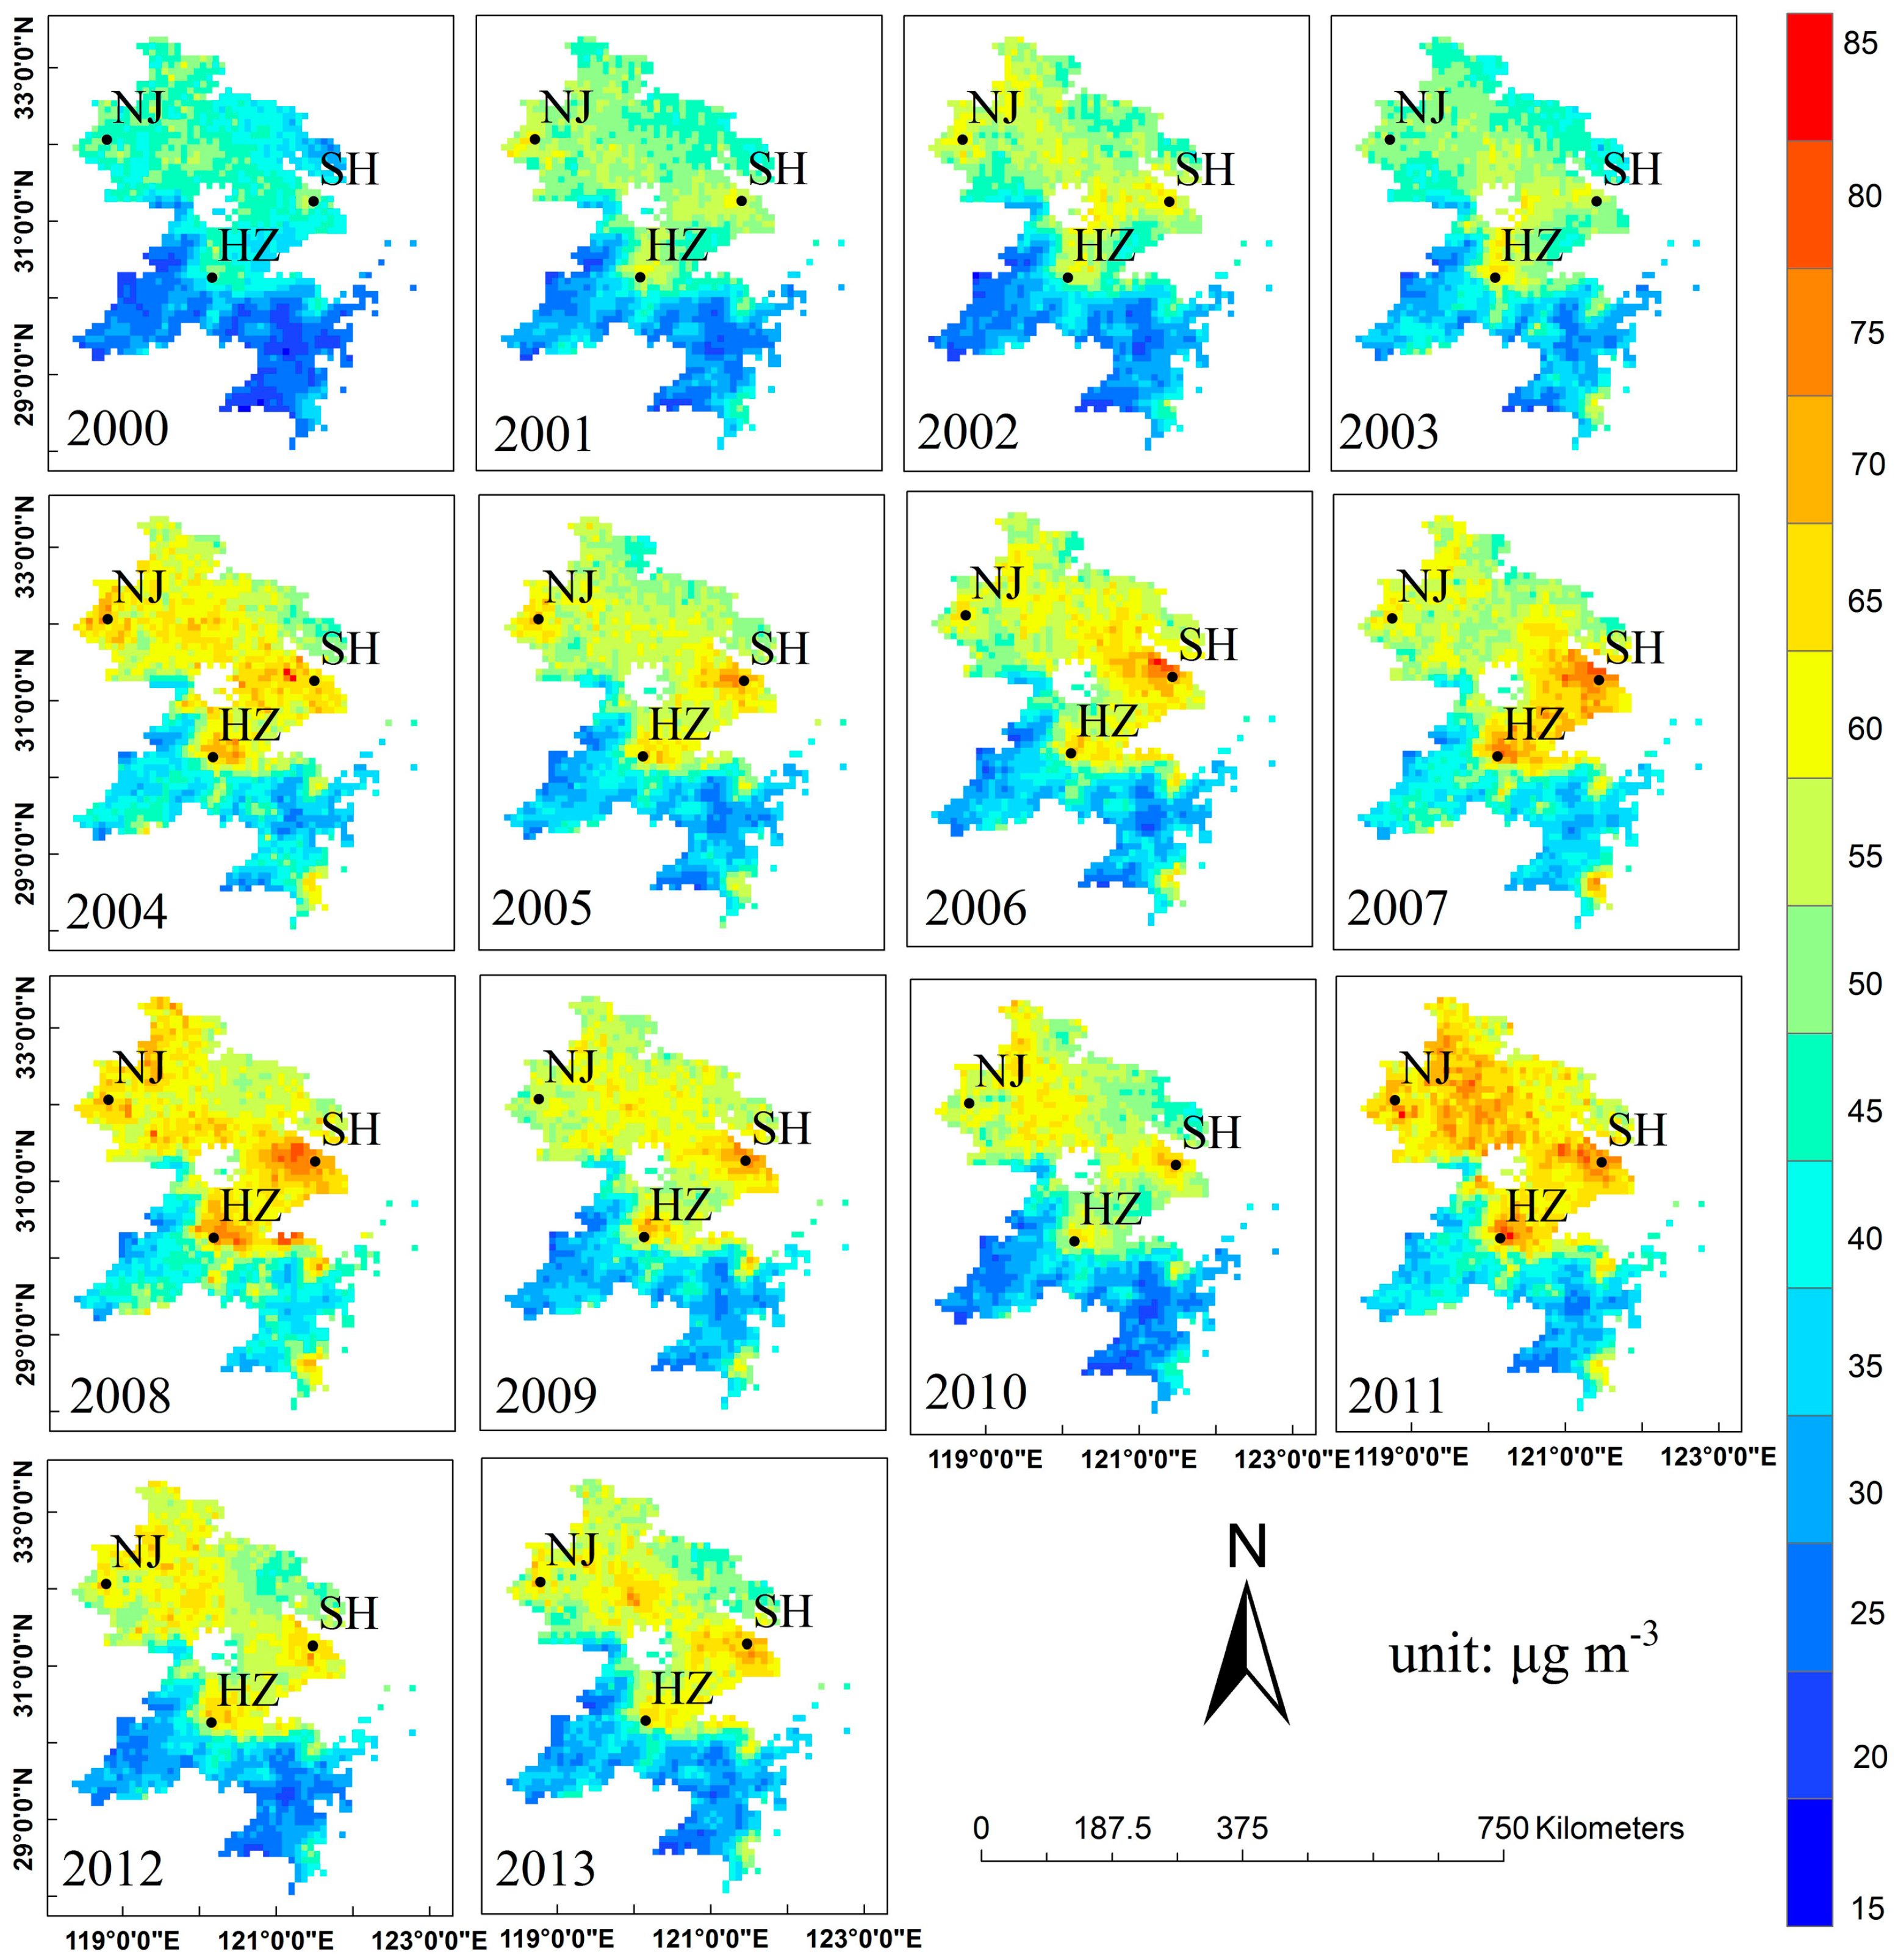
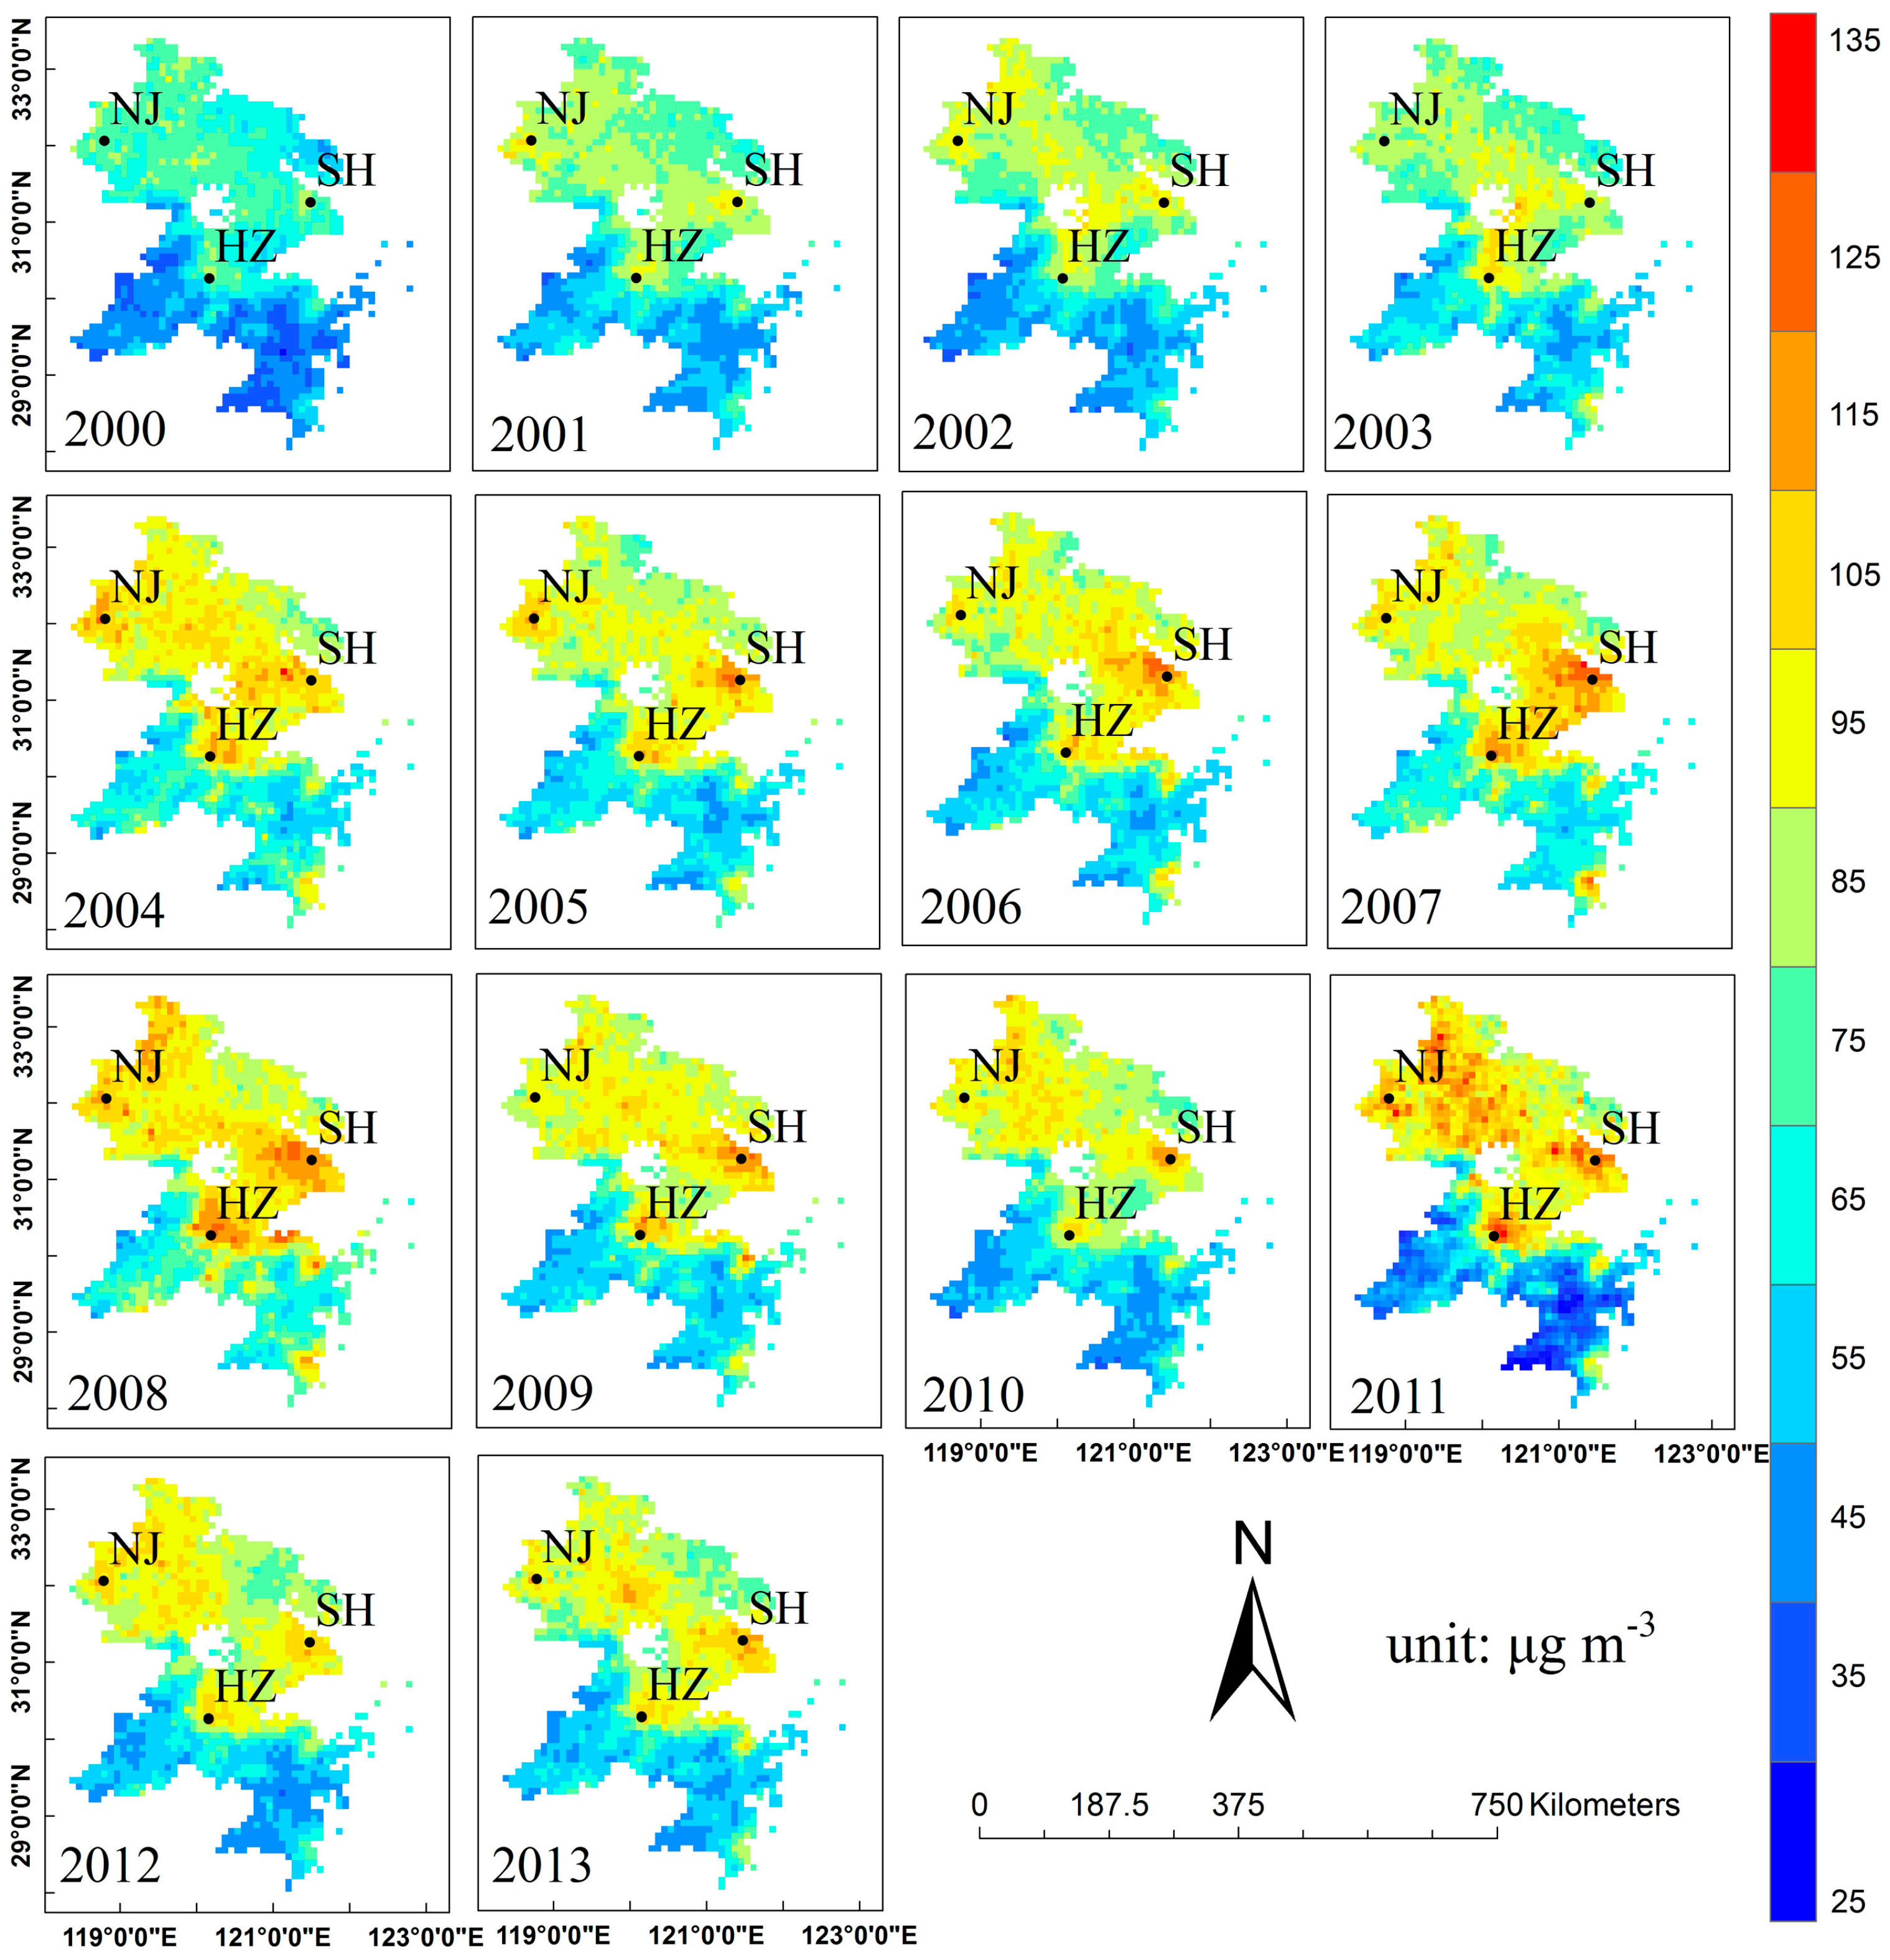
3.3.2. Spatial Variation of Air PM over the Yangtze Delta Region

Figure 7 and Figure 8 represent the spatial distributions of annual mean of PM2.5 and PM10 concentrations over the Yangtze delta region from 2000 to 2013. It shows that to the north of the Yangtze delta region, there is a plain and urban centralized distribution of which PM concentrations are higher. In the mountainous south where forest coverage rate is high, PM concentrations are lower. In the triangular region of urban agglomerations, composed of Nanjing (NJ), Shanghai (SH) and Hangzhou (HZ), PM concentrations are highest. Atmospheric PM concentrations have increased gradually year by year. The yearly increasing trend of PM in cities over plains is larger than in those cities in mountainous areas, and the increasing PM in urban areas is also faster than that in rural areas. The largest values appear in big cities, and the smallest values appear in forest areas. The reason for the increase is the human activity associated with anthropogenic pollutants, and that is more apparent in urban areas. Pollutants include aerosol particles, anthropogenic emissions (industrial waste gas, automobile exhaust gas and the burning of fossil fuels) and urban construction. We consider that there are two reasons for the low PM concentrations in forest areas. The first reason is that there is less human activity in forested areas, and the second reason is that forest has a good purification effect against air PM.

3.3.3. Variation of Atmospheric PM Concentrations over Typical Cities in the Yangtze Delta Region

We chose Hangzhou (HZ), Nanjing (NJ) and Shanghai (SH) as typical cities to analyse the variation of annual mean of PM concentrations over the Yangtze delta region from 2000 to 2013. Figure 9 shows the variation of PM2.5 and PM10 concentrations from 2000 to 2013. From Figure 9, we find that the annual mean PM2.5 and PM10 concentrations of the three cities show a growth trend, and the rate of growth of PM10 concentrations is greater than the PM2.5 concentrations. PM concentrations in Shanghai have the highest value and the highest growth rate (slope of PM2.5 is 1.28 ug·m−3·year−1, slope of PM10 is 2.00 ug·m−3·year−1 (as shown in Figure 9)) compared with the other cities. We found that human activity has a great influence on PM concentrations. The statistical yearbook for the three cities shows that population density, quantity of coal combustion, quantity of gasoline combustion, quantity of diesel fuel combustion, power consumption and the expansion of the city in Shanghai are greater than in Hangzhou or Nanjing.

4. Conclusions

(1)
We validated the MODIS AOT data based on ground-based monitoring AOT data; the results show that aerosol optical characteristic research and atmospheric PM concentration estimate by using satellite remote sensing retrieved MODIS AOT data has applicability over the Yangtze delta.
(2)
We developed seasonal estimation model of PM2.5 and PM10 mass concentration based on satellite remote sensing. The precision validation suggest that we can monitor PM2.5 and PM10 on region scale by using satellite remote sensing.
(3)
PM concentrations over the Yangtze delta presented an obvious one year cycle variation from 2000 to 2013. The largest value often appeared in January–February, and the smallest often appeared in July–August, but in 2013 the largest value appeared in December. The mean seasonal value of PM concentrations has the highest and lowest value in winter and summer, respectively. PM concentrations over main cities and rural areas have increased gradually year by year, and PM concentrations are increasing faster in urban areas than in rural areas.

Acknowledgments

National Natural Science Foundation of China (41101421, 41601442), The Fundamental Research Project of MOST (2005DKA32300), Key University Science Research Project of Anhui Province (KJ2015A245, KJ2015A265), The Key Program in the Youth Elite Support Plan in Universities of Anhui Province (gxyqZD2016326), General Science Research Project of Department of Education of Anhui Province (KJ2015B16), Chuzhou University scientific research fund project (2015qd10).

Author Contributions

Jianhui Xu and Jiang Hong mostly contributed equally at designing of manuscript. Zhongyong Xiao, Bin Wang and Jian Wu carried out data collection and processing. Jianhui Xu and Xin Lv wrote and revised the paper. All author read and approved the final manuscript.

Conflicts of Interest

The authors declare no conflict of interest.

References

  1. Lohmann, U.; Lesins, G. Stronger constraints on the anthropogenic indirect aerosol effect. Science 2002, 298, l012–1015. [Google Scholar] [CrossRef] [PubMed]
  2. Penner, J.E.; Dong, X.Q.; Chen, Y. Observational evidence of a change in radiative forcing due to the indirect aerosol effect. Nature 2004, 427, 231–234. [Google Scholar] [CrossRef] [PubMed]
  3. Li, C.C.; Mao, J.T.; Liu, Q.H.; Liu, X.Y.; Liu, G.Q.; Zhu, A.H. Research on the Air Pollution in Beijing and Its Surroundings with MODIS AOD Products. Chin. J. Atmos. Sci. 2003, 27, 869–880. [Google Scholar]
  4. Chu, D.A.; Kaufman, Y.J.; Zibordi, G.; Chern, J.D.; Mao, J.T.; Cheng, C.C.; Holben, B.N. Global monitoring of air pollution over land from the Earth Observing System-Terra Moderate Resolution Imaging Spectroradiometer (MODIS). J. Geophys. Res. 2003, 108. [Google Scholar] [CrossRef]
  5. Slater, J.F.; Dibb, J.E.; Campbell, J.W.; Moore, T.S. Physical and chemical properties of surface and column aerosols at a rural New England site during MODIS overpass. Remote Sens. Environ. 2004, 92, 173–180. [Google Scholar] [CrossRef]
  6. Li, C.C.; Mao, J.T.; Alexis, K.H. Application of MODIS AOD Products in Research of Air Pollution in Beijing. China Sci. 2005, 35, 177–186. [Google Scholar]
  7. Engel-Cox, J.A.; Holloman, C.H.; Coutant, B.W. Qualitative and quantitative evaluation of MODIS satellite censor data for regional and urban scale air quality. Atoms. Environ. 2004, 38, 2495–2509. [Google Scholar] [CrossRef]
  8. Gupta, P.; Christopher, S.A.; Wang, J. Satellite remote sensing of PM and air qualliy assessment over global cities. Atmos. Environ. 2006, 40, 5880–5892. [Google Scholar] [CrossRef]
  9. Liu, Y.; Franklin, M.; Kahn, R.; Koutrakis, P. Using aerosol optical thickness to predict ground-level PM2.5 concentrarions in the St. Louis area: A comparison between MISR and MODIS. Remote Sens. Environ. 2007, 107, 33–44. [Google Scholar] [CrossRef]
  10. Hoff, R.M.; Christopher, S.A. Remote sensing of particulate pollution from space: Have we reached the promised land? Air Waste Manag. Assoc. 2009, 59, 645–675. [Google Scholar]
  11. Tao, J.H.; Zhang, M.G.; Chen, L.F.; Wang, Z.; Lin, F.S.; Han, X.; Zou, M.M. A method to estimate concentrations of surface-level particulate matter using satellite-based aerosol optical thickness. Sci. China Earth Sci. 2013, 56, 1422–1433. [Google Scholar] [CrossRef]
  12. Chudonvshky, A.; Tang, C.; Lyaputin, A.; Wang, Y.; Schwartz, J.; Koutrakis, P. A critical assessment of high-resolution aerosol optical depth retrievals for fine particulate matter pridictions. Atoms. Chem. Phys. 2013, 13, 10907–10917. [Google Scholar] [CrossRef]
  13. Gupta, P.; Christopher, S.A. Partivulate matter air quality assessment using integrated surface, satellite, and meteorological products: 2. A neural network approach. J. Geophys. Res. 2009, 114, D20205. [Google Scholar] [CrossRef]
  14. Emili, E.; Lyapustin, A.; Wang, Y.; Popp, C.; Korkin, S.; Zebisch, M. High spatial resolution aerosol retrieval with MAIAC: Application to mountain regions. J. Geophys. Res. 2011, 116, D23211. [Google Scholar] [CrossRef]
  15. Wu, D.; Lau, A.K.-H.; Leung, Y.; Bi, X.; Li, F.; Tan, H.; Liao, B.; Chen, H. Hazy weather formation and visibility deterioration resulted from fine particulate(PM2.5) populations in Guangdong and Hong Kong. Huanjing Kexue Xuebao/Acta Sci. Circumst. 2012, 32, 2660–2669. [Google Scholar]
  16. Kanabkaew, T.; Tanre, D.; Rmer, L.; Vermote, E.F.; Chu, A.; Holben, B.N. Operation remote sensing of troposheric aerosol over land from EOS MODerate resolution imaging spectroradiometer. J. Geophys. Res. 2013, 6, 65–70. [Google Scholar]
  17. Acherman, S.; Strabala, K.; Menzel, W.; Frey, R.; Moeller, C.; Gumley, L. Discriminating clear sky from clouds with MODIS. J. Geophys. Res. 1998, 103, 32141–32157. [Google Scholar] [CrossRef]
  18. Kloog, I.; Chudnovsky, A.A.; Just, A.C.; Nordio, F.; Koutrakis, P.; Coull, B.A.; Lyapustin, A.; Wang, Y.; Schwartz, J. A new hybrid spatio-temporal model of estimating daily multi-year PM2.5 concentration across northeastern USA using high resolution aerosol optical depth data. Atmos. Environ. 2014, 95, 581–590. [Google Scholar] [CrossRef]
  19. Lin, C.Q.; Li, Y.; Yuan, Z.B.; Alexis, K.H.; Deng, X.J.; Tse, T.K.L.; Fung, J.C.H.; Li, C.C.; Li, Z.Y.; Lu, X.C.; et al. Estimation of long-term population exposur to PM2.5 for dense urban areas using 1-km MODIS data. Remote Sens. Environ. 2016, 179, 13–22. [Google Scholar] [CrossRef]
  20. Engel-Cox, J.A.; Hoff, R.; Rogers, M.R.; Dimmick, F.; Rush, A.C.; Szykman, J.J.; Saadi, J.A.; Chu, D.A.; Zell, E.R. Integrating lidar and satellite optical depth with ambient monitoring for 3-dimensional particulate characterization. Atmos. Environ. 2006, 40, 530–543. [Google Scholar] [CrossRef]
  21. Tsai, T.C.; Jeng, Y.J.; Chu, D.A.; Chen, J.P.; Chang, S.C. Analysis of the relationship between MODIS aerosol optical depth and particulate matter from 2006 to 2008. Atmos. Environ. 2011, 45, 4777–4788. [Google Scholar] [CrossRef]
  22. Estellés, V.; Martínez-Lozano, J.A.; Pey, J.; Sicard, M.; Querol, X.; Esteve, A.R.; Utrillas, M.P.; Gangoiti, G.; Alastuey, A.; Rocadenbosch, F. Study of the correlation between columnar aerosol burden, suspended matter at ground and chemical components in a background European environment. J. Geophys. Res. Atmos. 2012, 117, D04201. [Google Scholar] [CrossRef]
  23. Liu, Y.; Paciorek, C.J.; Koutrakis, P. Estimating regional spatial and temporal variability of PM2.5 cncentrations using satellite data, meteorology, and land use information. Environ. Health Persp. 2009, 117, 886–892. [Google Scholar] [CrossRef] [PubMed]
  24. Hu, X.F.; Waller, L.A.; Al-Hamdan, M.Z.; Crosson, W.L.; Ester, M.G., Jr.; Estes, S.M.; Quattrochi, D.A.; Sarnat, J.A.; Liu, Y. Estimation ground-level PM2.5 concentrations in the southeastern U.S. using geographically weighted regression. Environ. Res. 2013, 121, 1–10. [Google Scholar] [CrossRef] [PubMed]
  25. Wang, Z.F.; Chen, L.F.; Tao, J.H.; Zhang, Y.; Lin, S. Satellite-based estimation of regional particulate matter (PM) in Beijing using vertical-and-RH correcting method. Remote Sens. Environ. 2010, 114, 50–63. [Google Scholar] [CrossRef]
  26. Tian, J.; Chen, D. A semi-empirical model for predicting hourly ground-level fine particulater matter (PM2.5) concentration in southern ontario from satellite remote sensing and ground-based meteorological measurements. Remote Sens. Environ. 2010, 114, 221–229. [Google Scholar] [CrossRef]
  27. Gupta, P.; Christopher, S.A. Particulate matter air quality assessment using integrated surface, satellite, and meteorological products: Multiple regression approach. J. Geophys. Res. 2009, 114, D14205. [Google Scholar] [CrossRef]
  28. Paciorek, C.J.; Liu, Y. HEI Health Review Committee Assessment and Statistical Modeling of the Relationship between Remotely Sensed Aerosol Optical Depth and PM2.5 in the Eastern United States. Health Eff. Inst. 2012, 167, 85–91. [Google Scholar]
  29. Lee, H.J.; Liu, Y.; Coull, B.; Schwartz, J.; Koutrakis, P. Anovel calibration approach of MODIS AOD data to predict PM2.5 concentrations. Atmos. Chem. Phys. 2011, 11, 7991–8002. [Google Scholar] [CrossRef]
  30. Chudnovsky, A.; Lee, H.J.; Kostinski, A.; Kotlov, T.; Koutrakis, P. Prediction of daily fine particulate matter concentrations using aerosol optical depth retrievals from the Geostationary Operational Environmental Satellite. J. Air Waste Manag. 2012, 62, 1022–1031. [Google Scholar] [CrossRef]
  31. Shen, G.F.; Yuan, S.Y.; Xie, Y.N.; Xia, S.J.; Li, L.; Yao, Y.K.; Qiao, Y.Z.; Zhang, J.; Zhao, Q.Y.; Ding, A.J.; et al. Ambient levels and temporal variations of PM2.5 and PM10 at a residential site in the mega-city, Nanjing, in the western Yangtze River delta, China. J. Environ. Sci. Health 2014, 49, 171–178. [Google Scholar] [CrossRef] [PubMed]
  32. Levy, R.C.; Remer, L.A.; Kleidman, R.G. Global evaluation of the Collection 5 MODIS dark-target aerosol products over land. Atmos. Chem. Phys. 2010, 10, 10399–10420. [Google Scholar] [CrossRef] [Green Version]
  33. Search for Date Products. Available online: http://ladsweb.nascom.nasa.gov/data/search.html (accessed on 11 September 2016).
  34. Liu, Z.H.; Li, L.T.; Tim, R.M.; Van Niel, T.G.; Yang, Q.K.; Li, R. Introduction of the professional Interpolation Sofeware for Meteorology Data: ANUSPLINN. Meteorol. Mon. 2008, 34, 92–100. [Google Scholar]
  35. Lin, C.Q.; Li, Y.; Yuan, Z.B.; Alexis, K.H.; Li, C.C.; Jimmy, C.H. Using satellite remote sensing data to estimate the high-resolution distribution of ground-level PM2.5. Remote Sens. Environ. 2015, 156, 117–128. [Google Scholar] [CrossRef]
  36. Xu, X.R. Remote Sensing Physical; Peking University Press: Beijing, China, 2005; pp. 298–299. [Google Scholar]
  37. He, Q.S.; Mao, J.T. Observation of Urban Mixed Layer at Beijing Using a Micropulse Lidar. Acta Meteorol. Sin. 2005, 63, 36–43. [Google Scholar]
  38. Pelletier, B.; Sater, R.; Vidot, J. Retrieving of particulate matter from optical measurment: A semiparametric approach. J. Geophys. Res. 2007, 112, 1–18. [Google Scholar] [CrossRef]
  39. Meng, Q.Z.; Feng, Y. Calculation and Analysis of the Thickness of Atmospheric Mixed Layer above Chengdu. J. Chengdu Inst. Meteorol. 1996, 11, 73–81. [Google Scholar]
  40. Chen, S.Y.; Xi, D.L.; Zhang, B.N.; Hao, R.X.Z.; Zheng, B.; Han, T.Y. Study on the Determingation and Calculating Method of Atmospheric Mixing Layer Height. China Environ. Sci. 1997, 17, 374–383. [Google Scholar]
  41. Sun, J.Q.; Zhang, H.F. A Theortical Ananlysis of Remote Measurement of Mass Concentration of Atmospheric Dust Using Lidar. Acta Sci. Circumst. 1982, 2, 36–43. [Google Scholar]
  42. Han, D.W.; Liu, W.Q.; Lu, Y.H.; Zhao, N.J.; Yang, H.; Zhang, Y.J. Retrieval Method for Aerosol Mass Concentration Vertical Distribution. Chin. J. Lasers 2006, 33, 1567–1573. [Google Scholar]
  43. Malm, W.C.; Day, D.E.; Kreidenweis, S.M. Light scattering characteristics of aerosol as a function of relative humidity: Part I—A comparison of measured scattering and aerosol concentrationss using the theoretical models. J. Air Waste Manag. Assoc. 2000, 50, 686–700. [Google Scholar] [CrossRef] [PubMed]
  44. White, W.H.; Roberts, P.T. On the nature and origins of visibility-reducing aerosols in the Los Angeles air basin. Atmos. Environ. 1977, 11, 803–812. [Google Scholar] [CrossRef]
Figure 1. Location of the Yangtze Delta, distribution of sampling sites and CE-318s.
Sustainability 08 00932 g001
Figure 2. Linear regression analysis of daily AOT from CE-318 and MODIS AOT products.
Sustainability 08 00932 g002
Figure 3. Linear regression analysis of estimated PM2.5 concentrations and ground-based observation PM2.5 concentrations.
Sustainability 08 00932 g003
Figure 4. Linear regression analysis of estimated PM10 concentrations and ground-based observation PM10 concentrations.
Sustainability 08 00932 g004
Figure 5. Variation of monthly mean PM2.5 concentrations over the Yangtze Delta Region from 2000 to 2013.
Sustainability 08 00932 g005
Figure 6. Variation of monthly mean PM10 concentrations over the Yangtze Delta Region from 2000 to 2013.
Sustainability 08 00932 g006
Figure 7. Spatial distribution of annual mean PM2.5 concentrations over the Yangtze Delta Region from 2000 to 2013. Hangzhou (HZ), Nanjing (NJ), Shanghai (SH).
Sustainability 08 00932 g007
Figure 8. Spatial distribution of annual mean PM10 concentrations over the Yangtze Delta Region from 2000 to 2013. Hangzhou (HZ), Nanjing (NJ), Shanghai (SH).
Sustainability 08 00932 g008
Figure 9. Variation of annual mean PM2.5 and PM10 concentration sover typical cities in the Yangtze Delta Region from 2000 to 2013. (a) Hangzhou; (b) Nanjing and (c) Shanghai.
Sustainability 08 00932 g009
Table 1. The coefficient value of linear regression analysis of daily AOT from CE-318 and MODIS AOT products.
Observation SiteLongitude (°)Latitude (°)SlopeInterceptR2p
SHM121.39731.1311.130.0300.78<0.01
HZC120.08330.2630.960.0960.86<0.01
HZZ119.74530.4160.98−0.1200.77<0.01
NB121.58329.8670.770.2900.76<0.01
QDH119.01229.5500.75−0.0300.71<0.01
LA119.44230.3170.62−0.0040.62<0.01
Table 2. The coefficient value of experimental models of PM2.5 and PM10 concentrations in different seasons.
a0a1a2a3a4R2pSTD
PM2.5Spring366.69179.55−0.51−0.28−19.720.48<0.0117.15
Summer0.00106.4−4.731.23−15.830.62<0.0111.80
Autumn0.00258.743.033.73−50.270.61<0.0115.21
Winter0.00356.428.66.98−86.070.52<0.0121.59
PM10Spring33.39325.961.070.03−22.890.57<0.0122.17
Summer0.00204.6−11.592.57−23.170.56<0.0115.40
Autumn0.00302.977.768.3−80.180.64<0.0118.15
Winter0.00341.0720.148.2−93.910.68<0.0125.50
Table 3. Variation of seasonal mean PM2.5 and PM10 concentrations over the Yangtze Delta Region from 2000 to 2013. Units (μg·m−3).
YearPM2.5PM10
SpringSummerAutumnWinterSpringSummerAutumnWinter
200047.1721.7429.010.0078.4939.2542.070.00
200147.1220.7538.7751.8578.9737.6841.1986.77
200234.2822.4252.4653.8457.5440.8672.2993.54
200339.4034.1740.6458.5263.1652.3658.1199.30
200446.8030.8050.0466.9577.5756.3369.80113.20
200547.0629.7946.6955.2877.6454.3865.30100.60
200654.2027.2444.9757.1590.8649.5163.1597.17
200754.9330.4249.6859.2892.1656.1769.07101.13
200852.8128.3648.6573.4988.2952.4071.91123.65
200949.8831.7344.3756.8182.6958.9862.5198.71
201040.1028.4341.4456.8565.8252.0864.25103.01
201161.2725.6745.1973.47102.4447.1563.62125.77
201241.7225.4751.4358.6568.6146.0372.44102.71
201347.9722.8541.5864.5579.2239.5361.04107.61

