
Characterization of Polyethylene Oxide and Sodium Alginate for Oil Contaminated-Sand Remediation

Abstract
:1. Introduction
2. Previous Studies
2.1. Biopolymer in Soil Remediation and Enhanced Oil Recovery
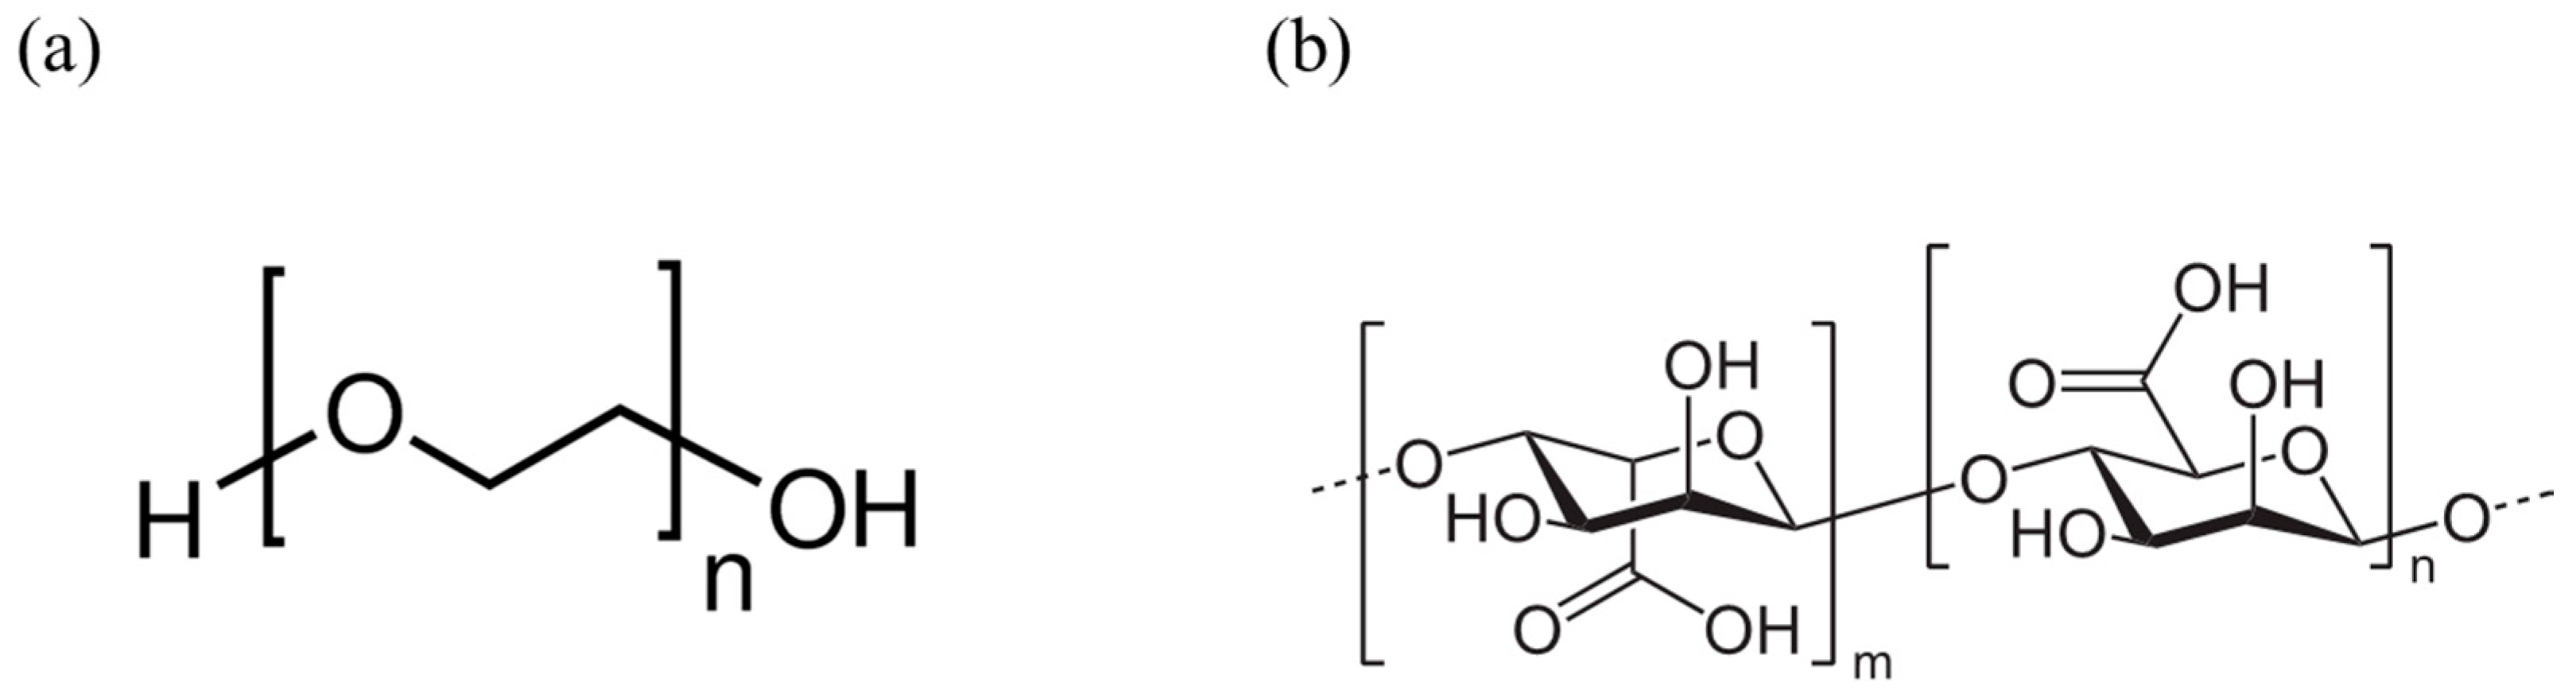
2.2. Polyethylene Oxide
2.3. Sodium Alginate
3. Experimental Methods
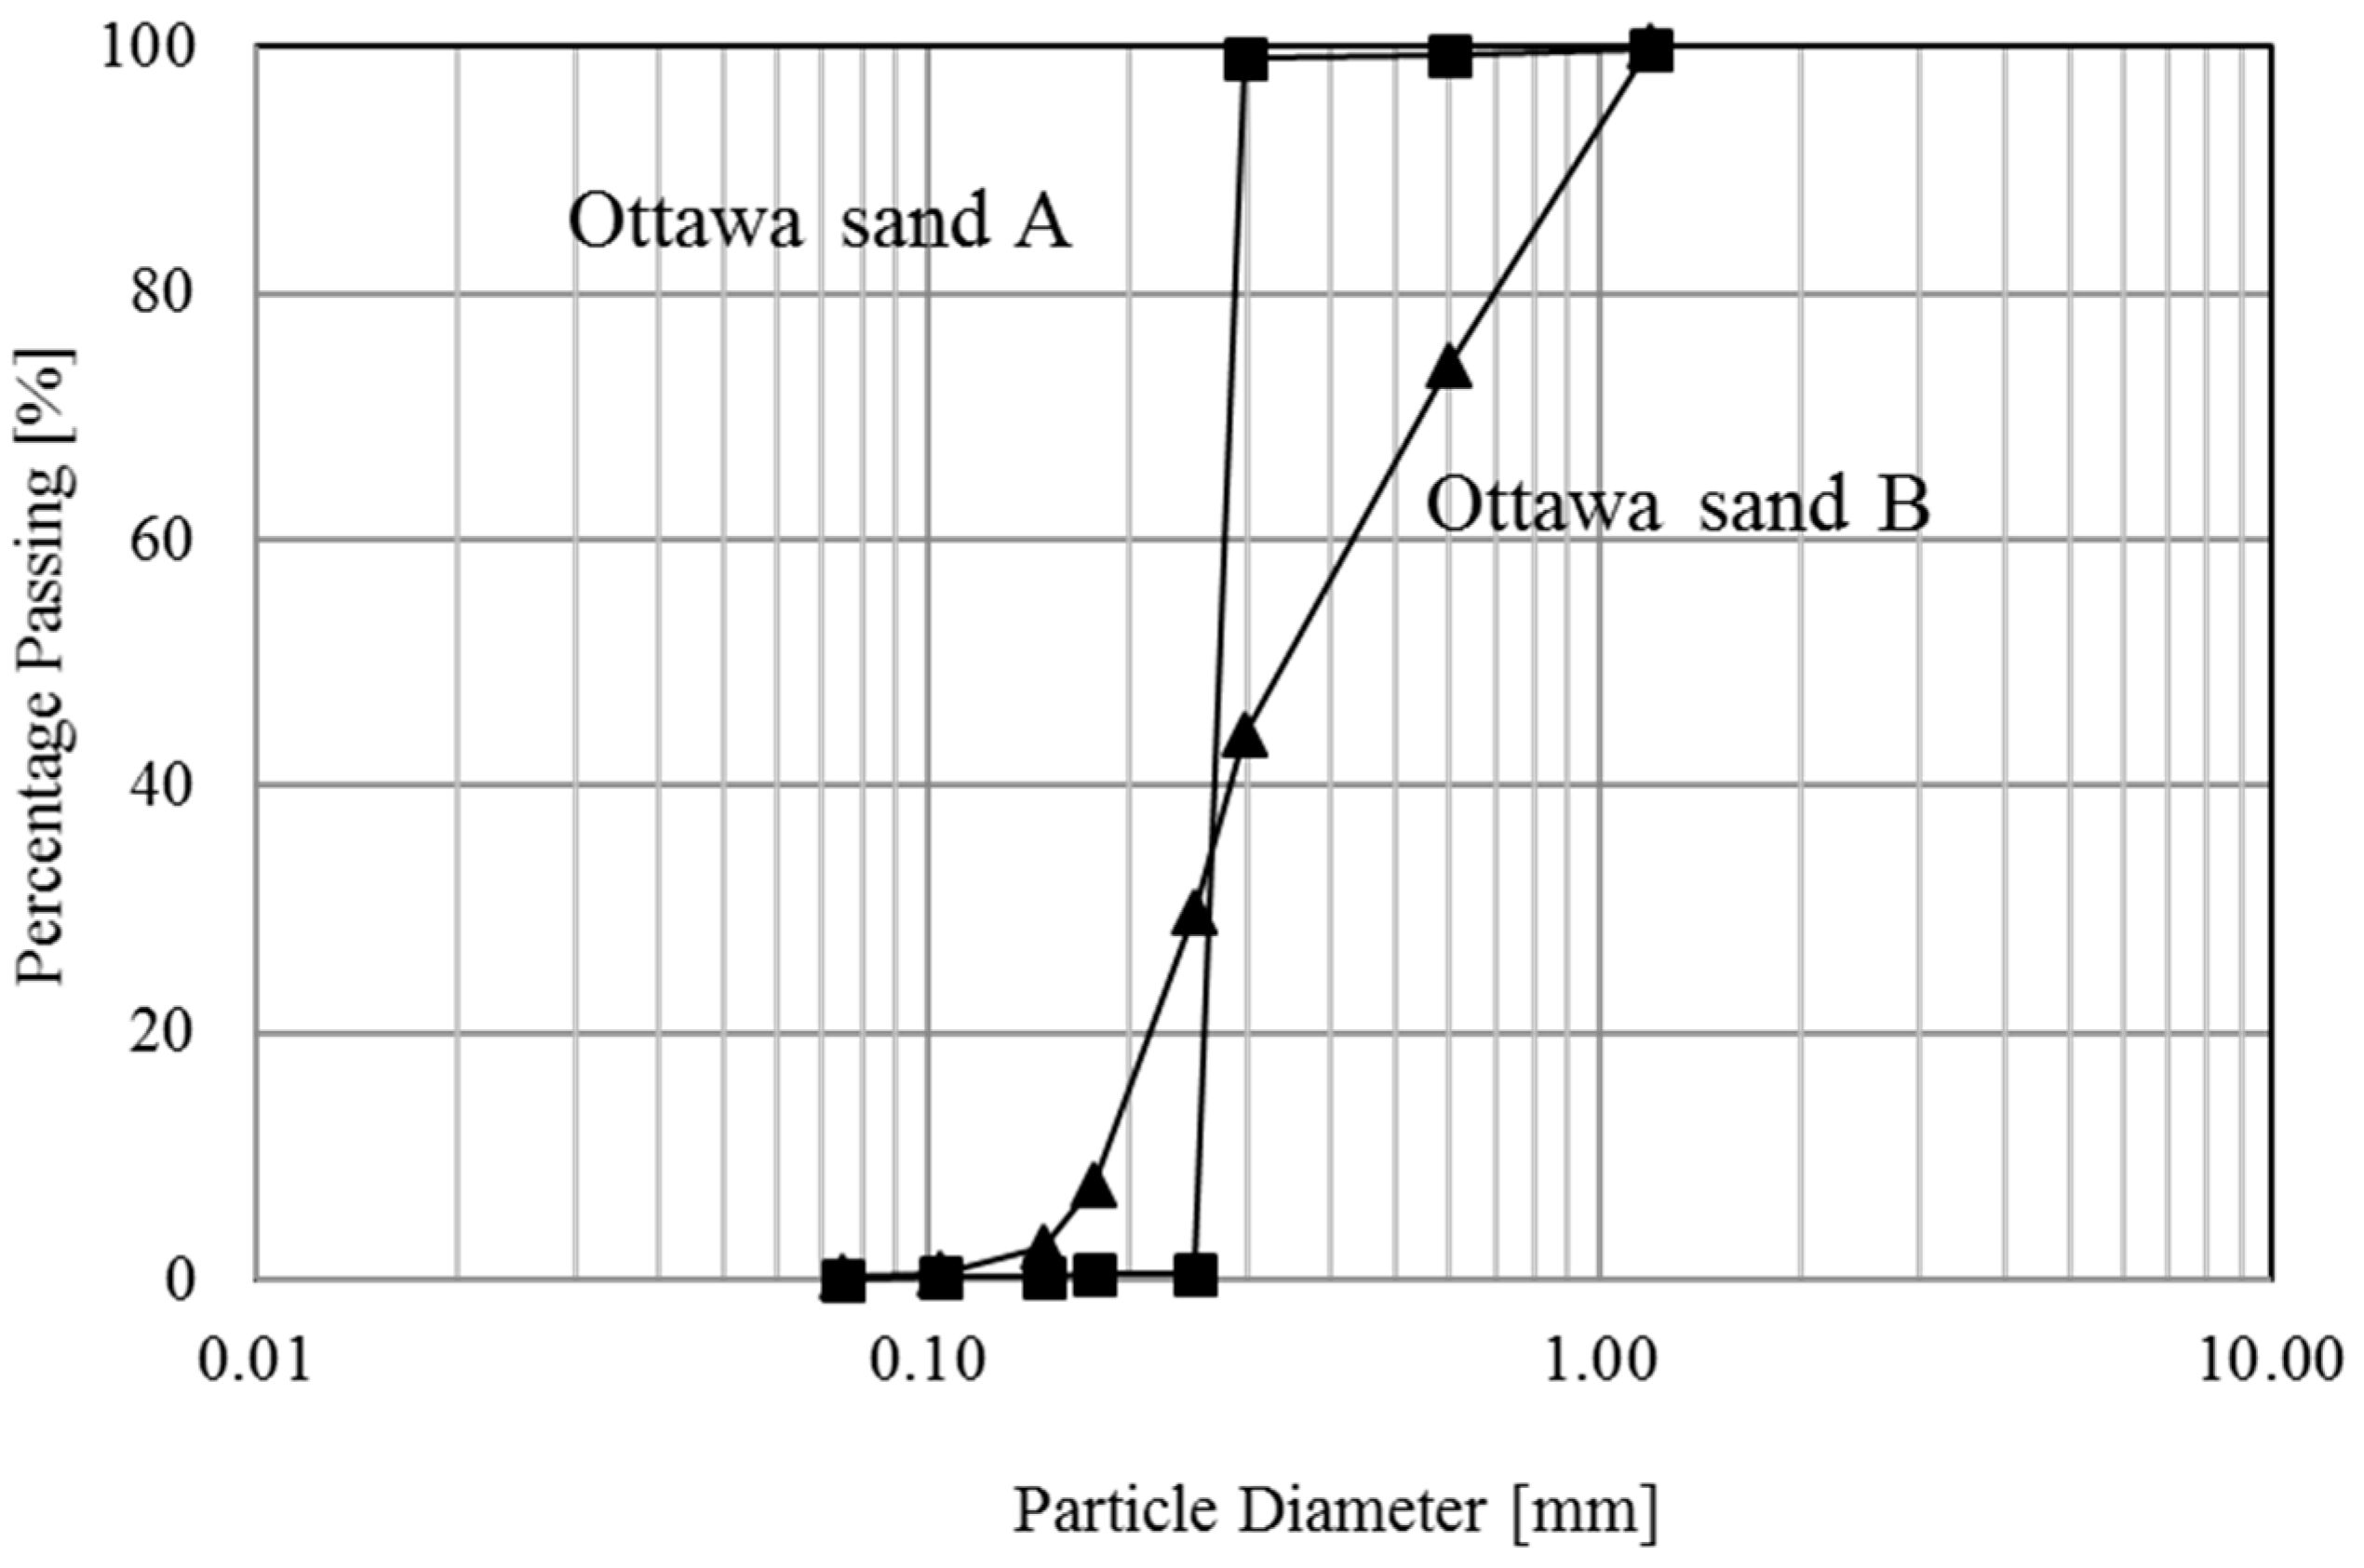
3.1. Materials
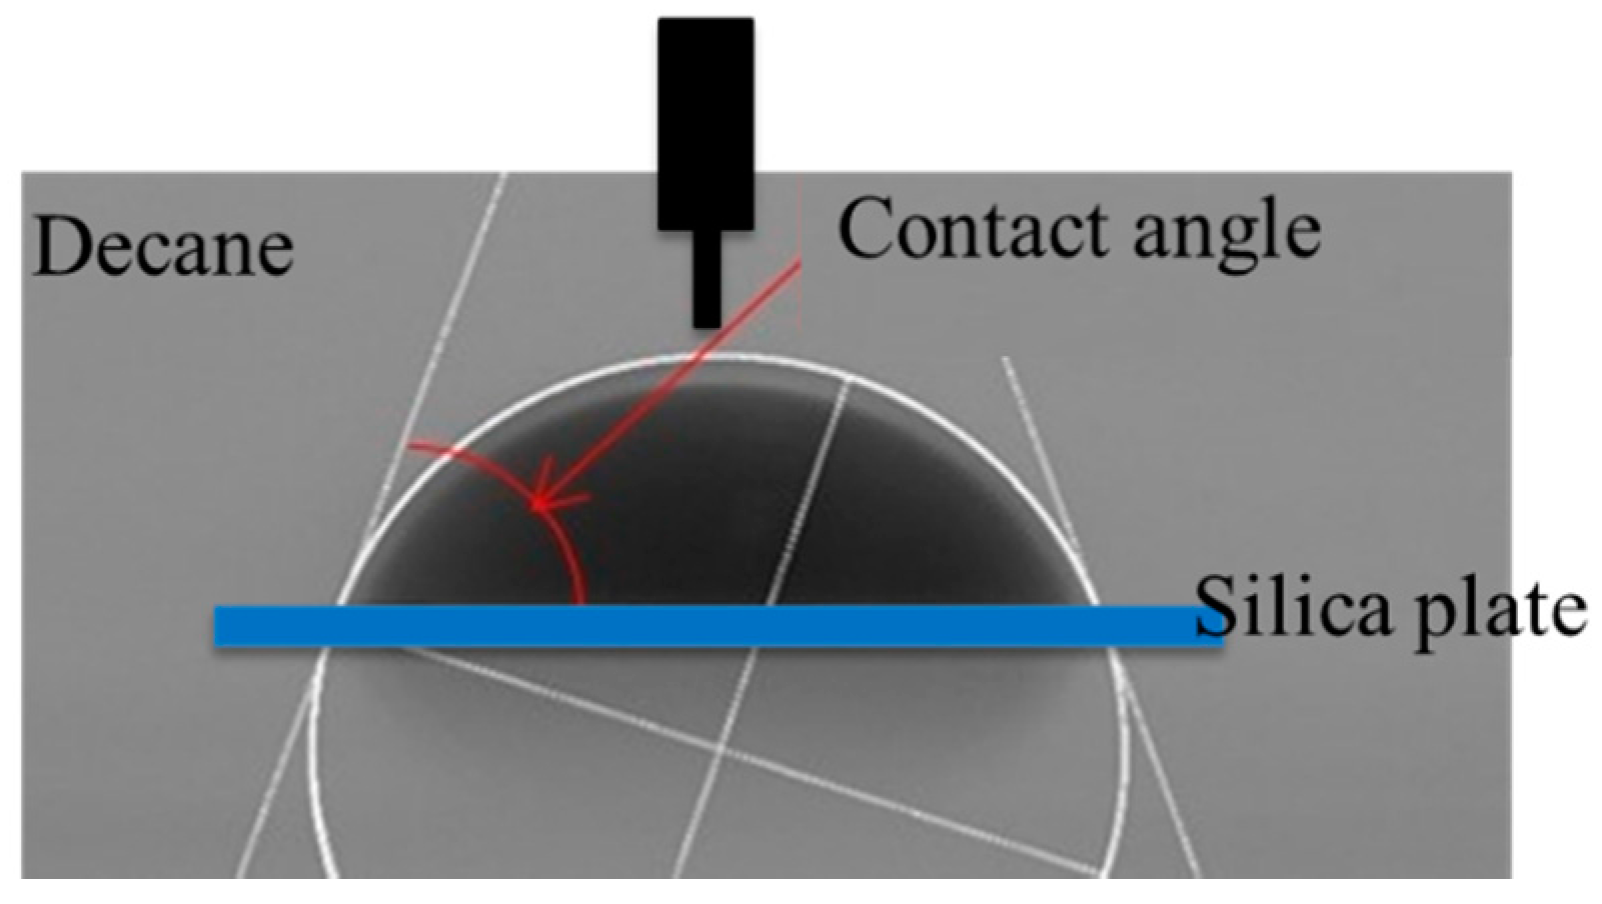
3.2. Contact Angle
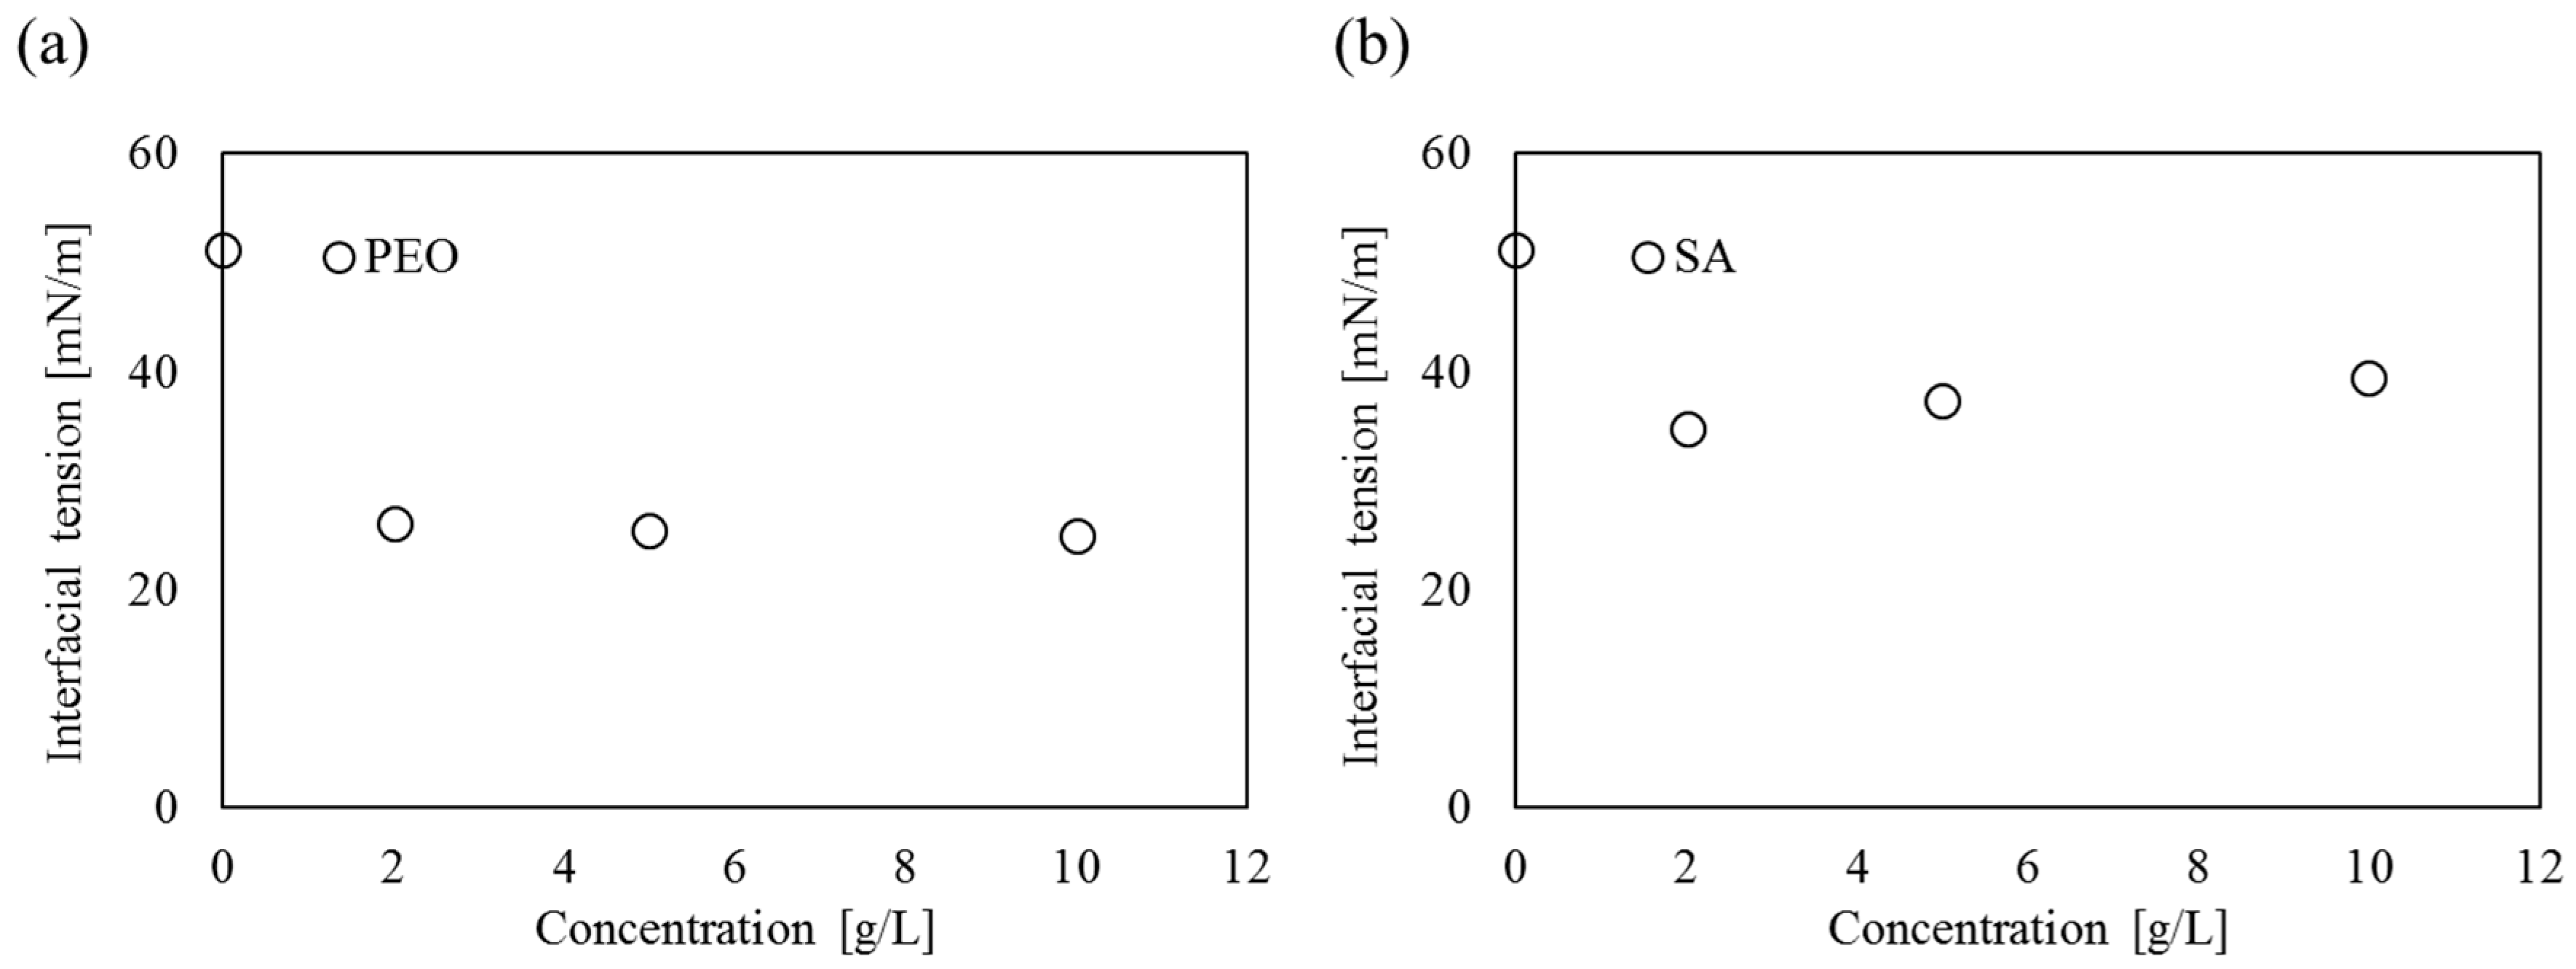
3.3. Interfacial Tension
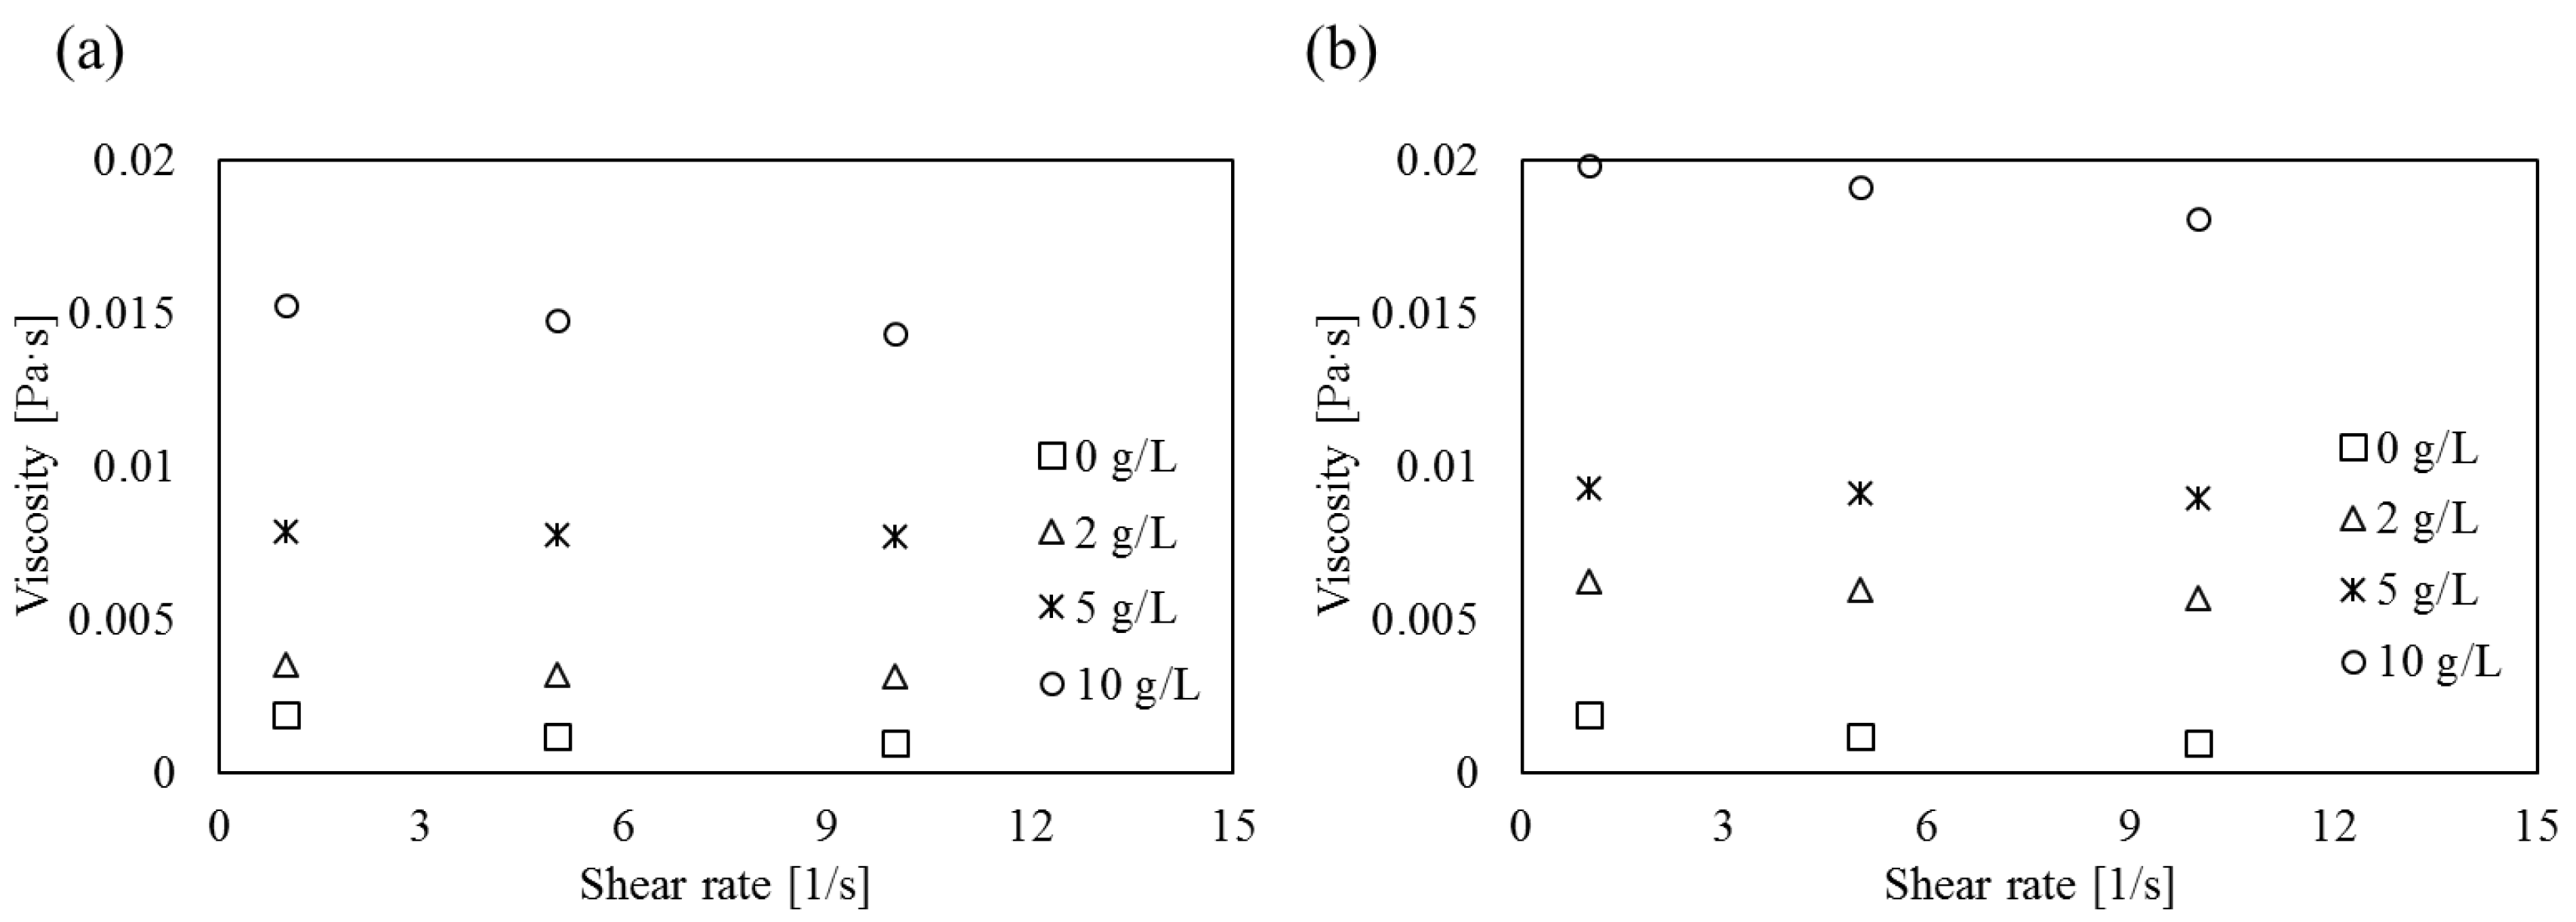
3.4. Viscosity
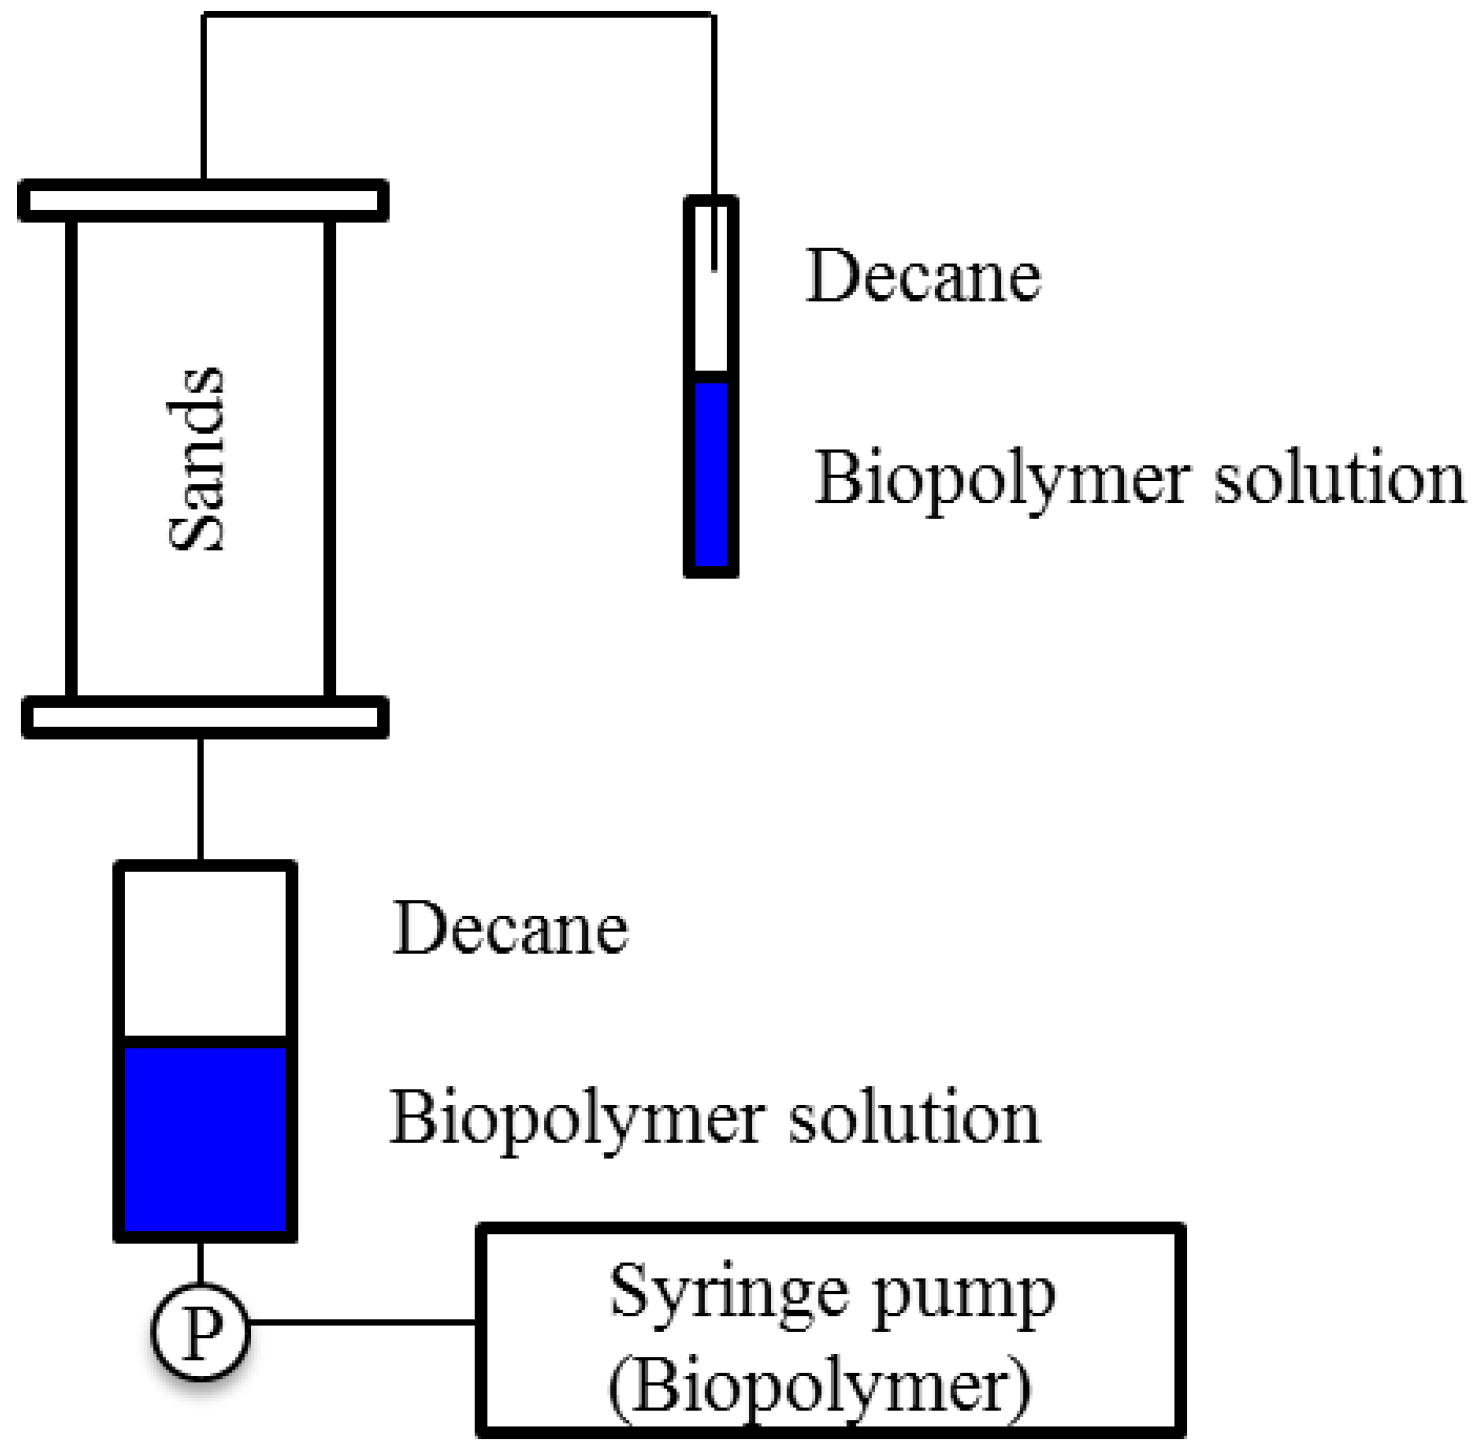
3.5. Biopolymer Solution-Decane Displacement
4. Results and Discussion
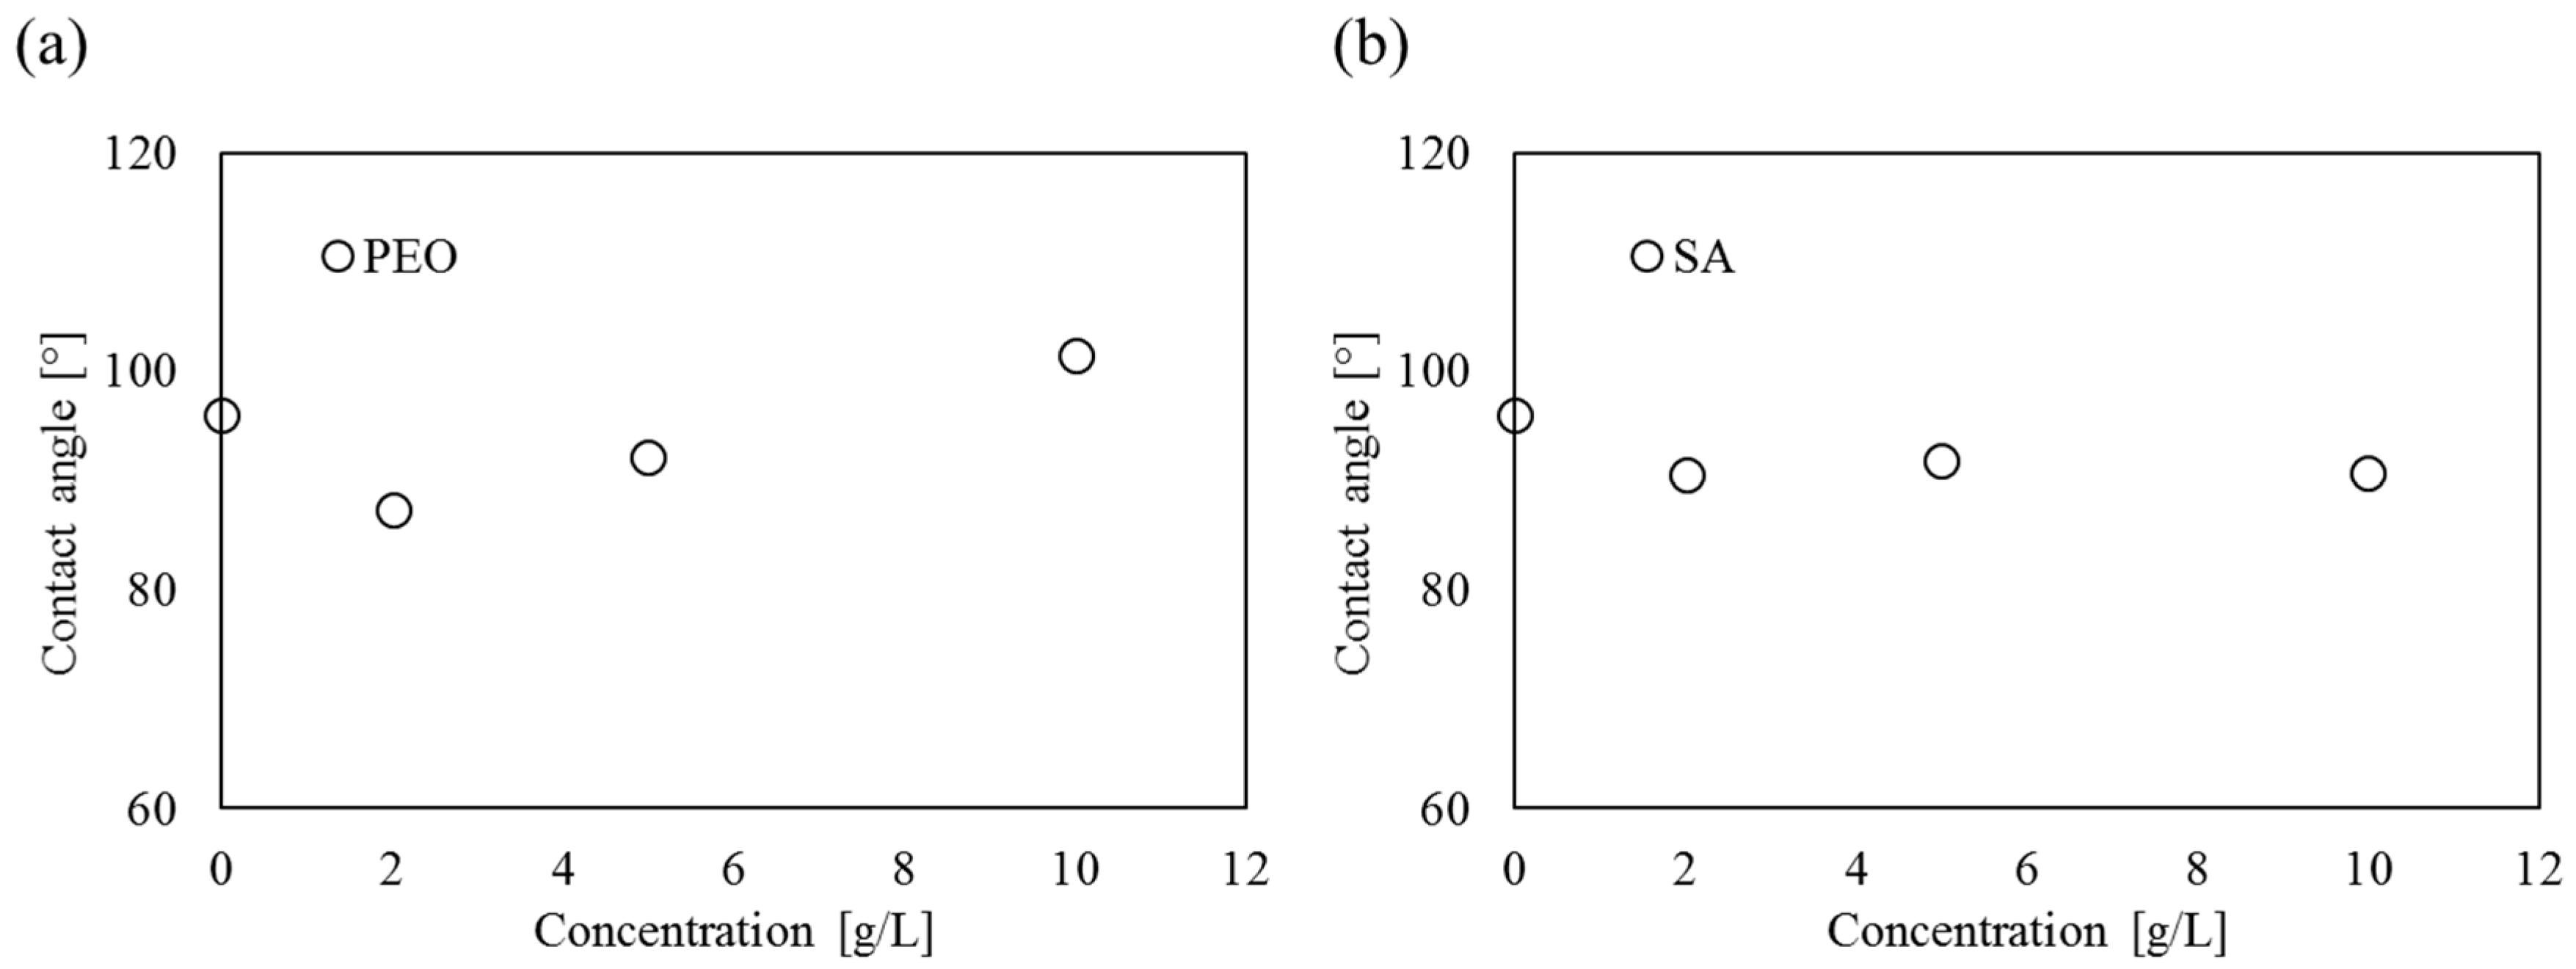
4.1. Contact Angle
4.2. Interfacial Tension
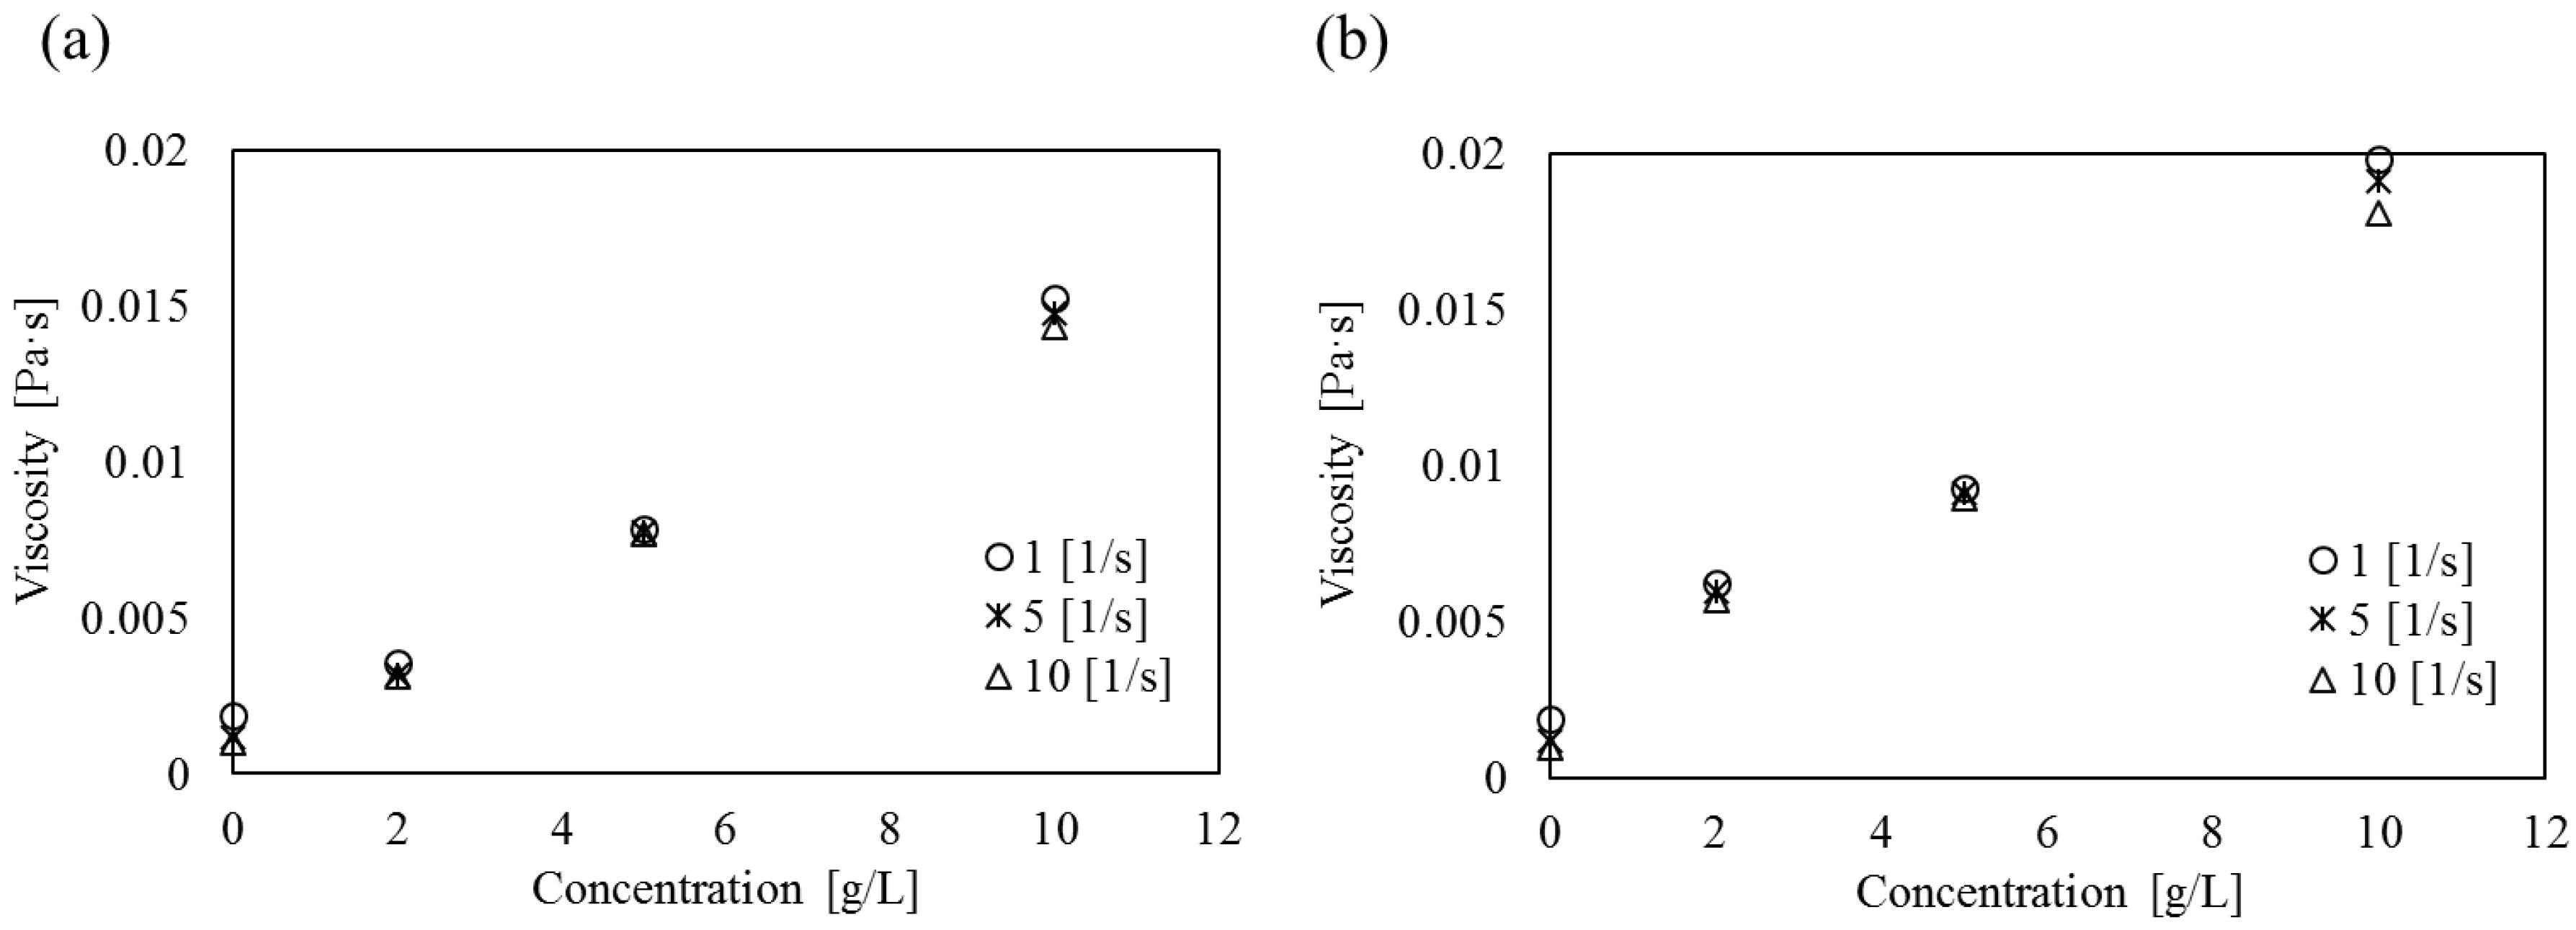
4.3. Viscosity
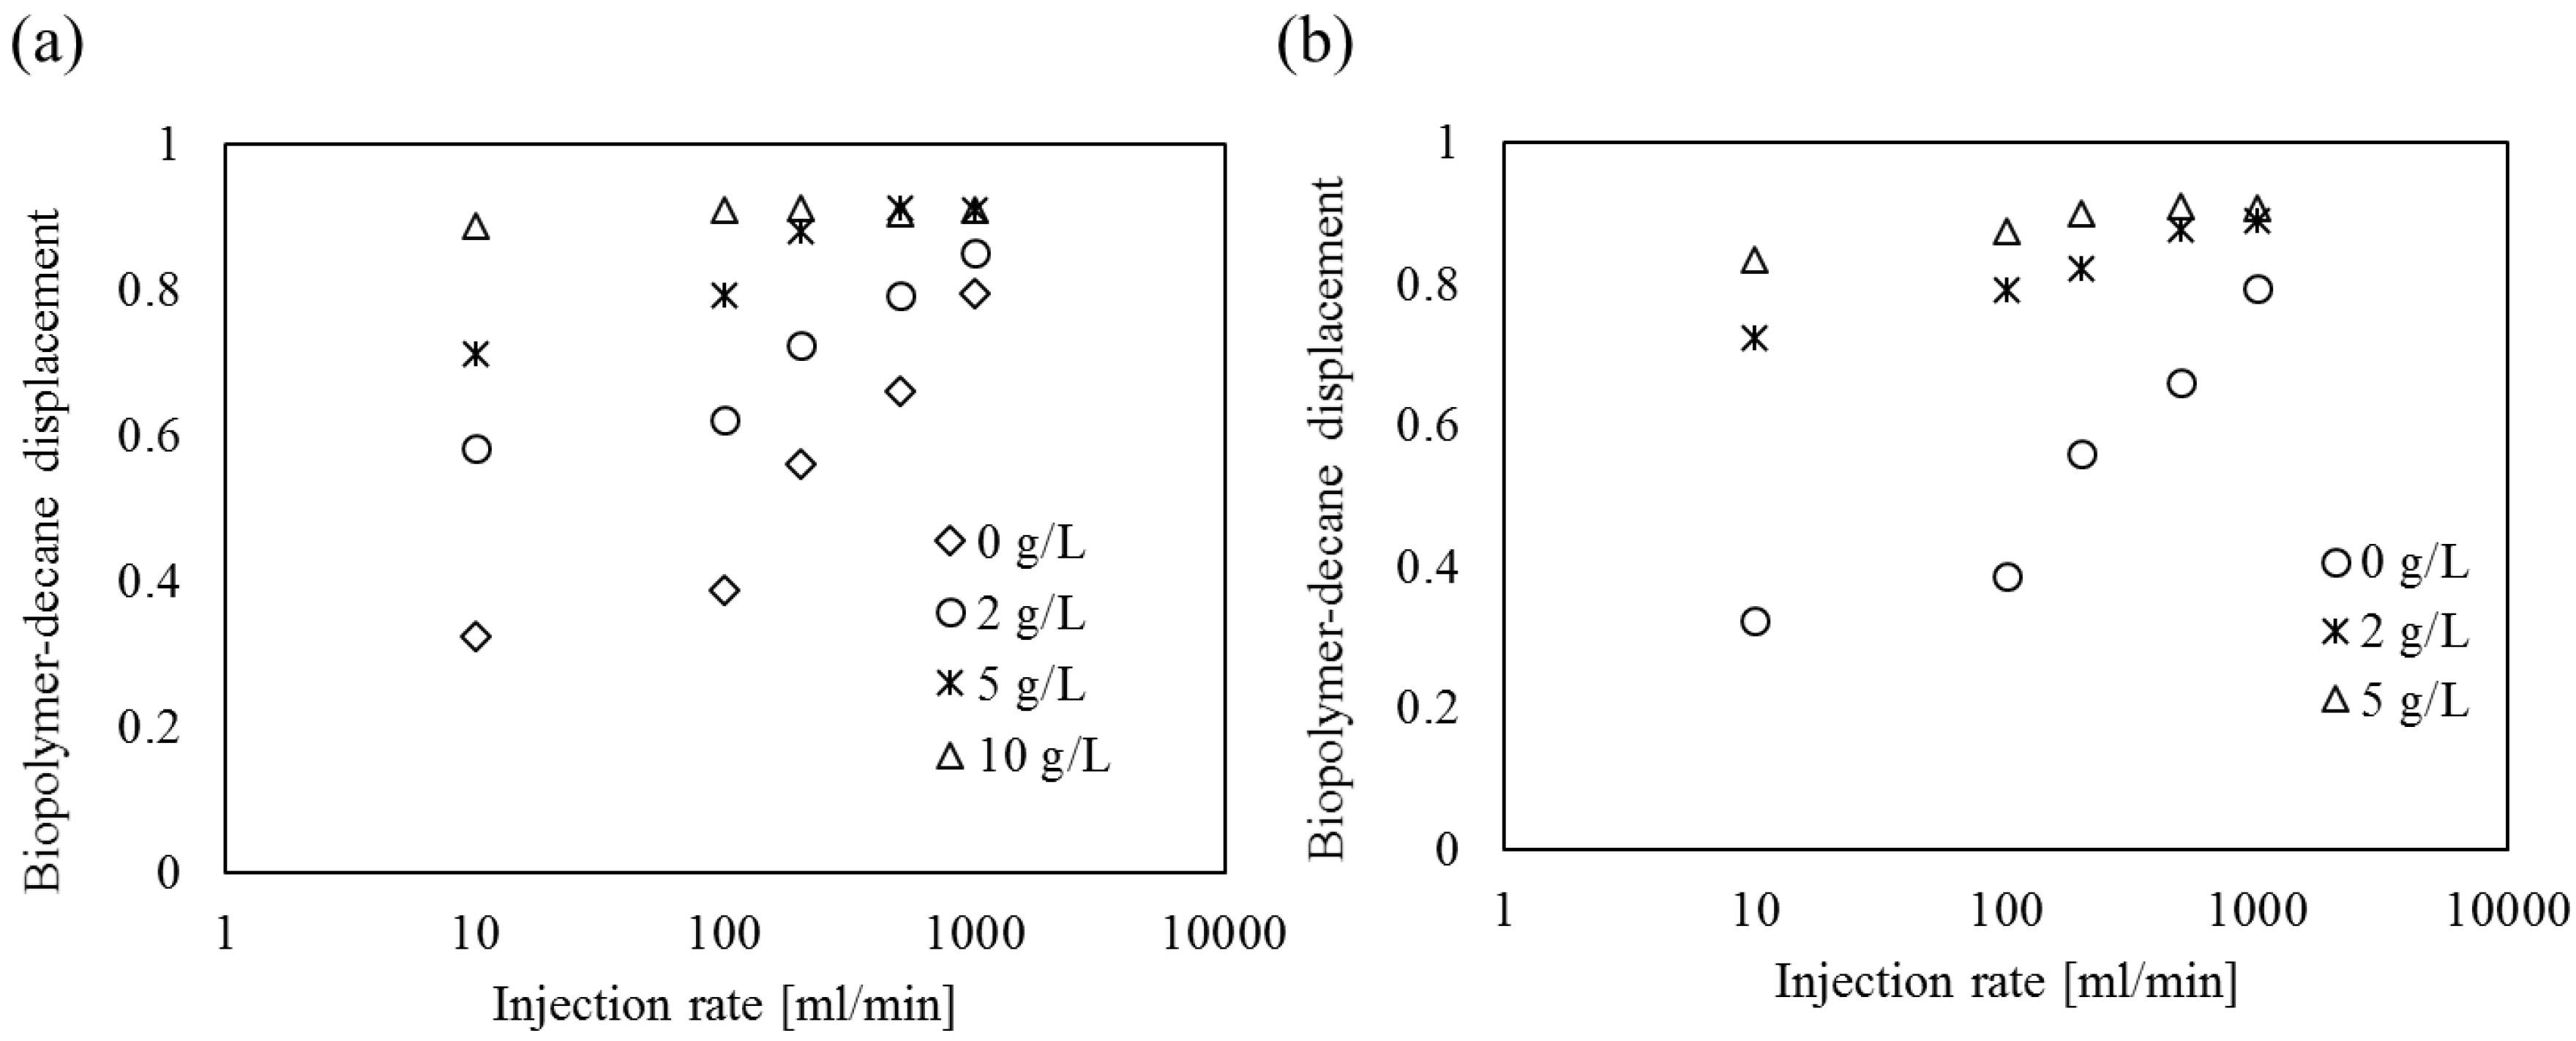
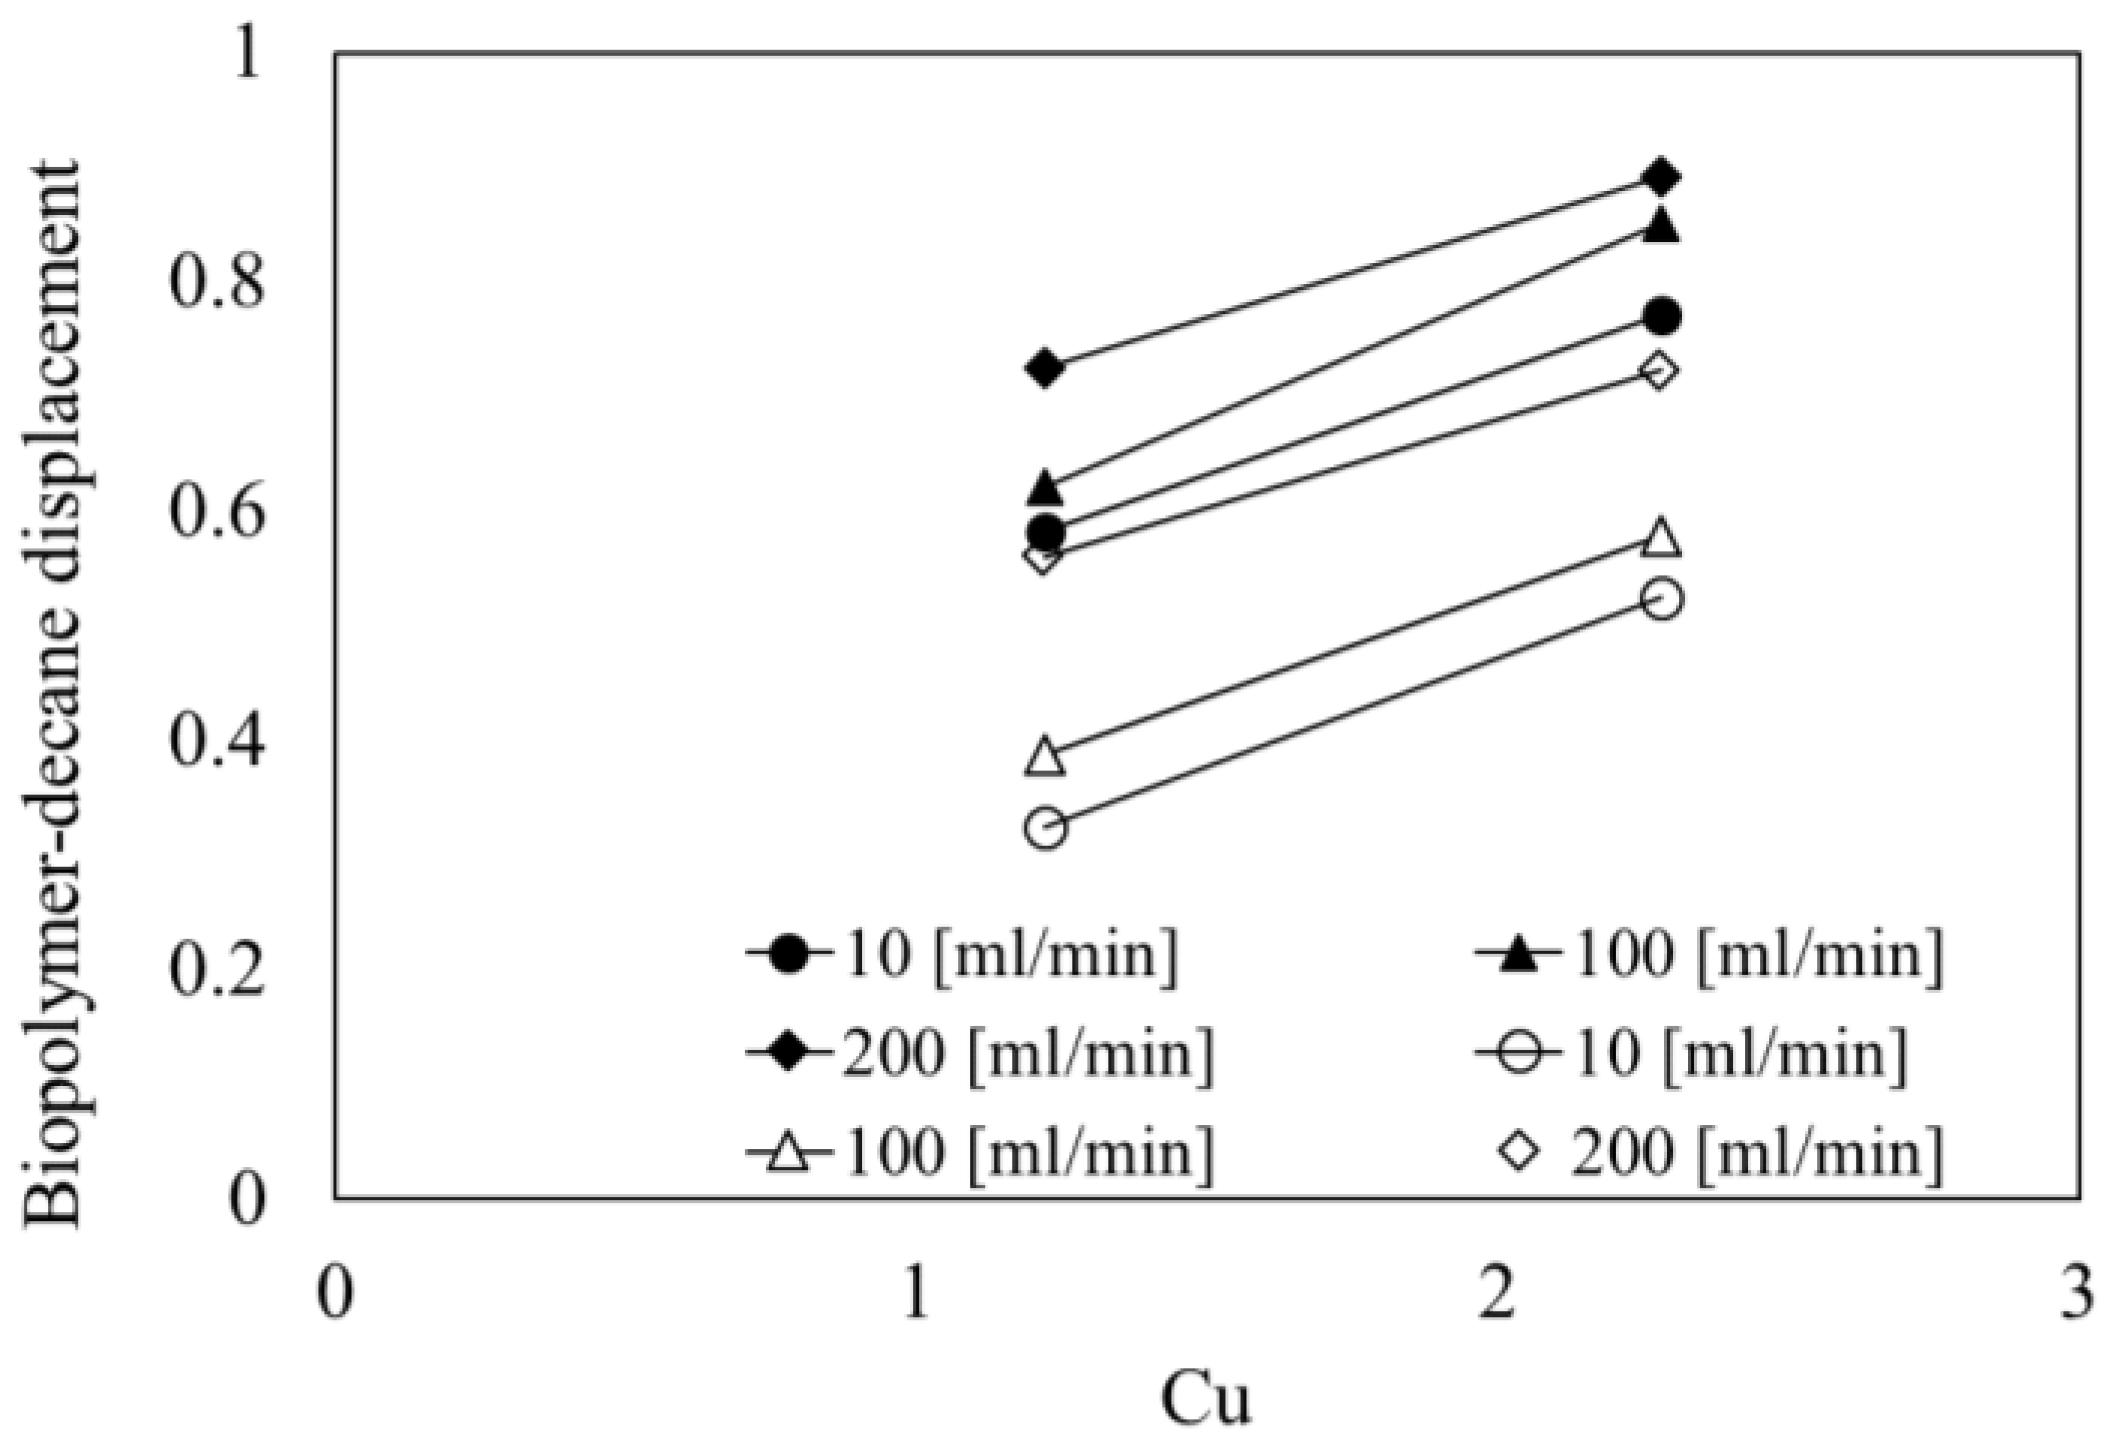
4.4. Biopolymer Solution-Decane Displacement
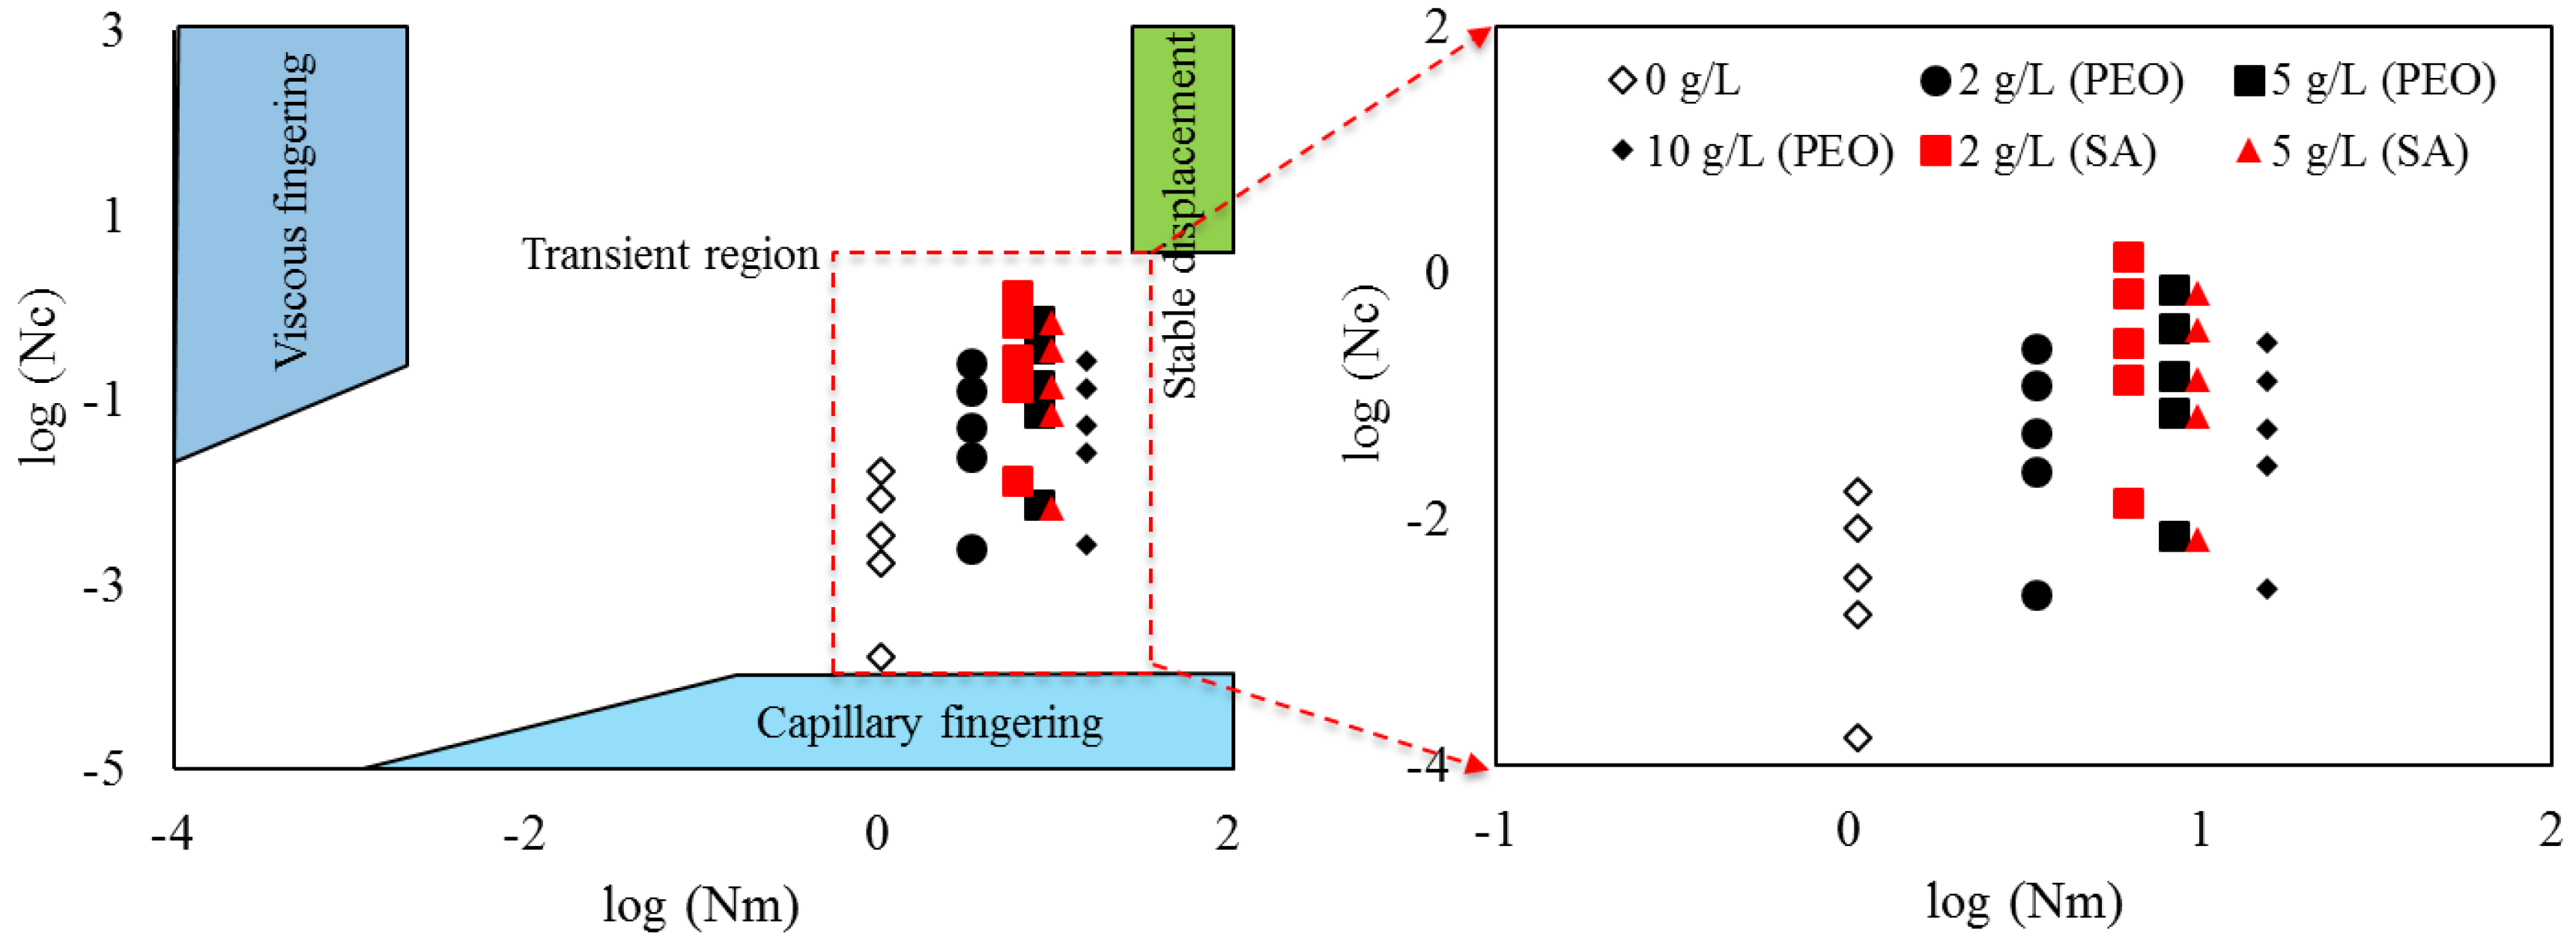
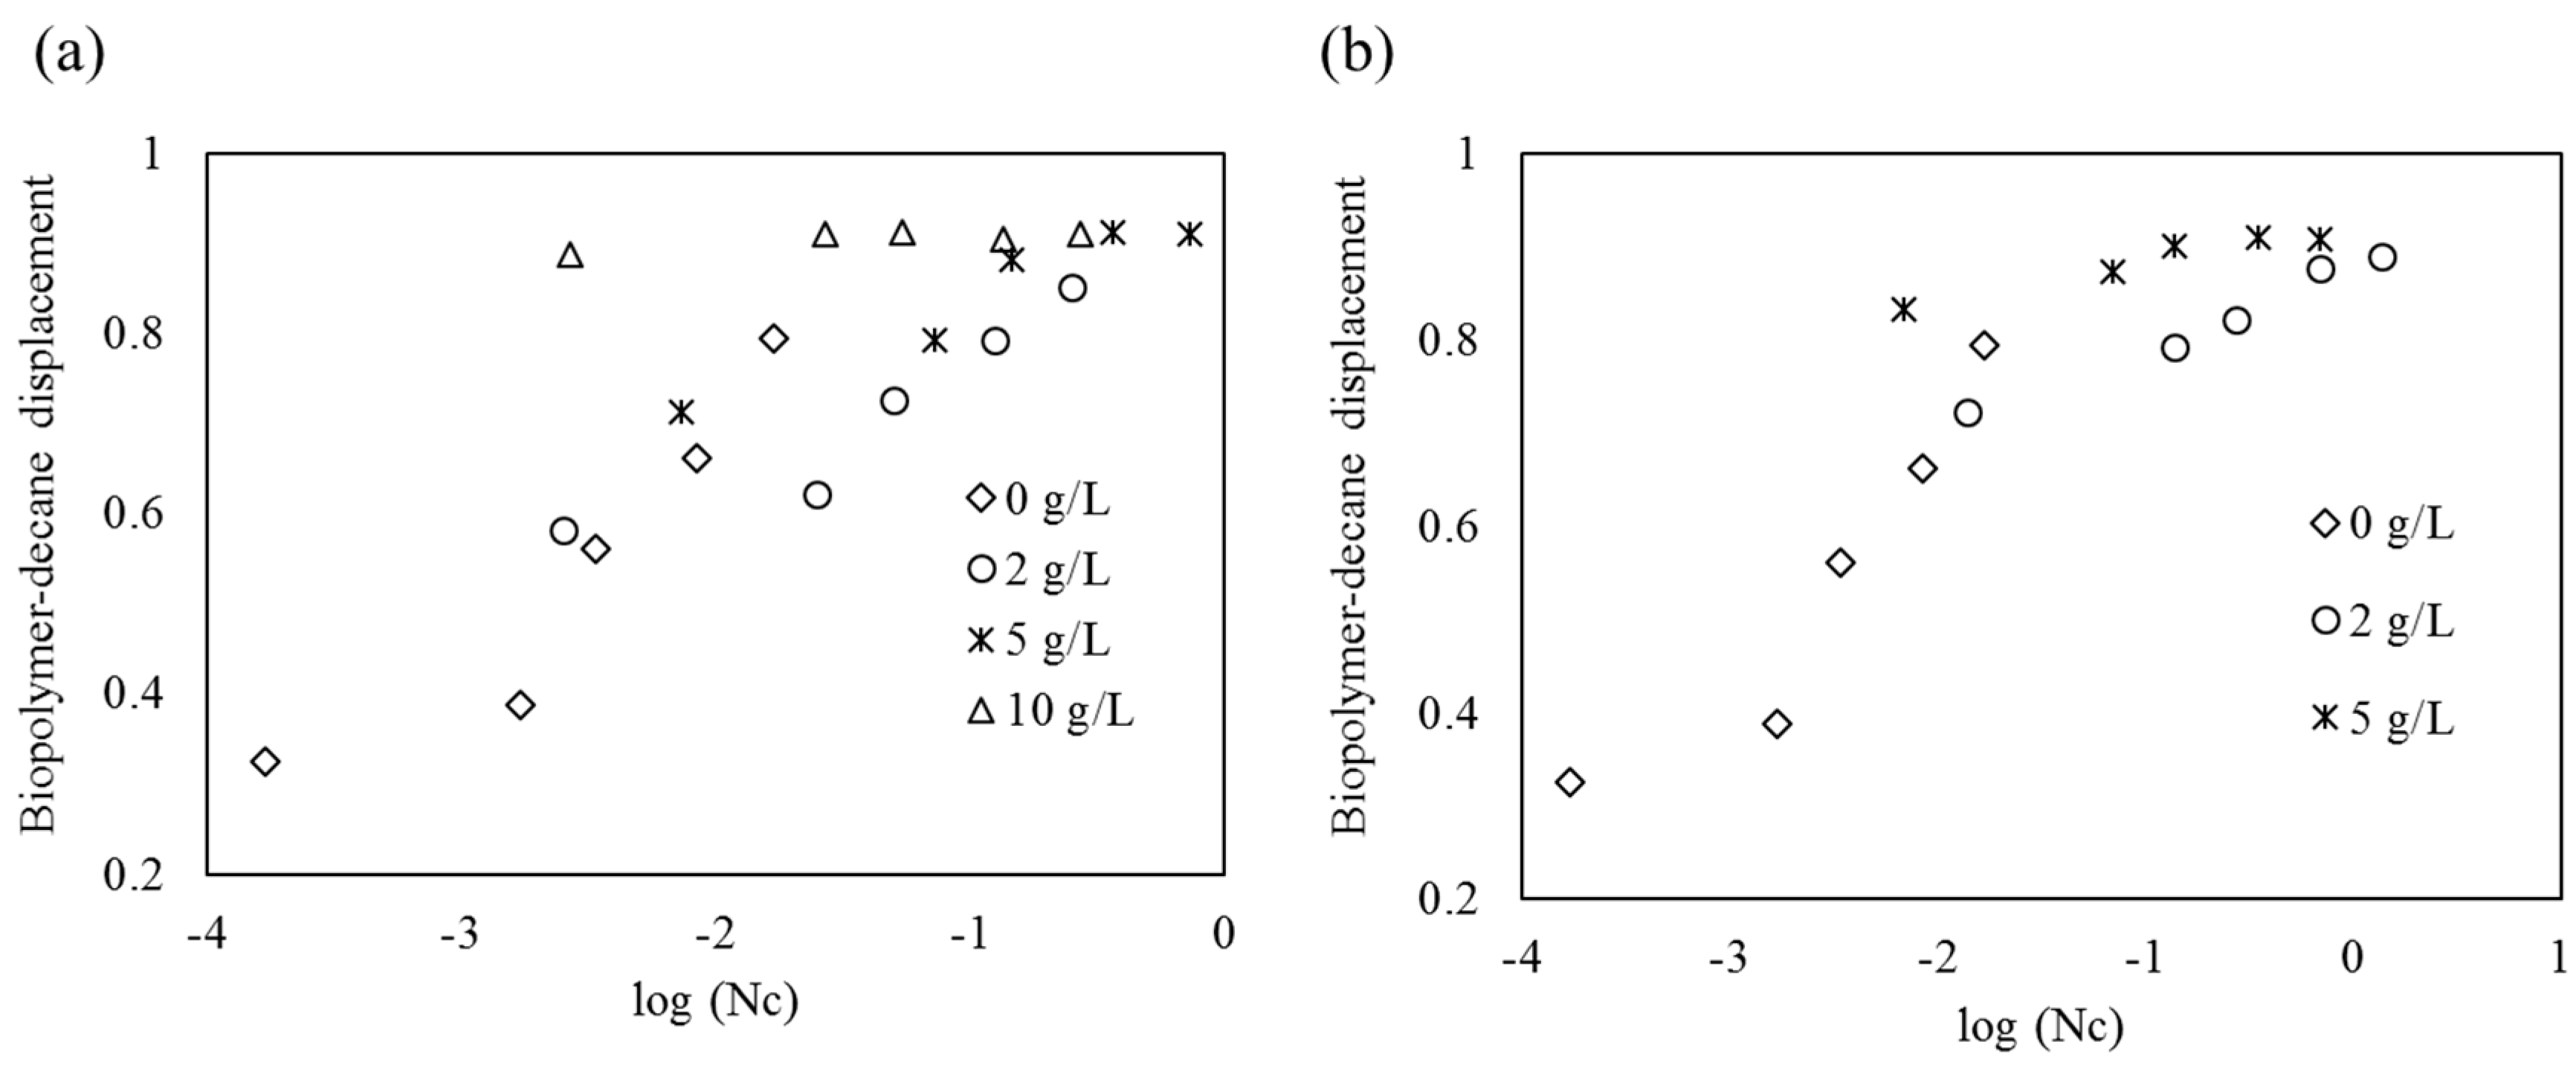
4.5. Displacement Ratios as a Function of Viscous Number (Nm) and Capillary Number (Nc)
4.6. Effect of Particle Size Distribution on Biopolymer-Decane Displacement
5. Conclusions
Author Contributions
Conflicts of Interest
References
- Mitchell, R.; Nevo, Z. Effect of bacterial polysaccharide accumulation on infiltration of water through sand. Appl. Microbiol. Biotechnol. 1964, 12, 219–223. [Google Scholar]
- Bate, B.; Zhao, Q.; Burns, S. Impact of organic coatings on frictional strength of organically modified clay. J. Geotechn. Geoenviron. Eng. 2013, 140, 228–236. [Google Scholar] [CrossRef]
- Briscoe, W.H.; Klein, J. Friction and adhesion hysteresis between surfactant monolayers in water. J. Adhes. 2007, 83, 705–722. [Google Scholar] [CrossRef]
- Cabalar, A.; Canakci, H. Ground Improvement by Bacteria; Taylor and Francis Group: Abingdon, UK, 2005. [Google Scholar]
- Kang, X.; Kang, G.C.; Bate, B. Shear wave velocity anisotropy of kaolinite using a floating wall consolidometer-type bender element testing system. Geotech. Test. J. 2014, 37, 1–15. [Google Scholar] [CrossRef]
- Kavazanjian, E., Jr.; Iglesias, E.; Karatas, I. Biopolymer soil stabilization for wind erosion control. In Proceedings of the 17th International Conference on Soil Mechanics and Geotechnical Engineering, Alexandria, Egypt, 5–9 October 2009; pp. 881–884.
- Jung, J.; Jang, J.; Ahn, J. Characterization of a polyacrylamide solution used for remediation of petroleum contaminated soils. Materials 2016, 9, 16. [Google Scholar] [CrossRef]
- Cao, S.C.; Bate, B.; Hu, J.W.; Jung, J. Engineering behavior and characteristics of water-soluble polymers: Implication on soil remediation and enhanced oil recovery. Sustainability 2016, 8, 205. [Google Scholar] [CrossRef]
- Sojka, R.E.; Bjorneberg, D.L.; Entry, J.A.; Lentz, R.D.; Orts, W.J. Polyacrylamide in agriculture and environmental land management. Adv. Agron. 2007, 92, 75–162. [Google Scholar]
- Jung, J.; Jang, J. Soil-water characteristic curve of sediments containing a polyacrylamide solution. Geotech. Lett. 2016, 1, 1–6. [Google Scholar] [CrossRef]
- Inbar, A.; Ben-Hur, M.; Sternberg, M.; Lado, M. Using polyacrylamide to mitigate post-fire soil erosion. Geoderma 2015, 239–240, 107–114. [Google Scholar] [CrossRef]
- Lentz, R.D. Polyacrylamide and biopolymer effects on flocculation, aggregate stability, and water seepage in a silt loam. Geoderma 2015, 241–242, 289–294. [Google Scholar] [CrossRef]
- Lee, S.S.; Shah, H.S.; Awad, Y.M.; Kumar, S.; Ok, Y.S. Synergy effects of biochar and polyacrylamide on plants growth and soil erosion control. Environ. Earth Sci. 2015, 74, 1–11. [Google Scholar] [CrossRef]
- Hove, A.O.; Nilson, V.; Loknes, J. Visualization of xanthan flood behavior in core samples by means of X-ray tomography. SPE Reserv. Eng. 1990, 5, 475–480. [Google Scholar] [CrossRef]
- Philips, J.C.; Miller, J.W.; Wernau, W.C.; Tate, B.E.; Auerbach, M.H. A high-pyruvate xanthan for EOR. Soc. Pet. Eng. J. 1985, 25, 594–602. [Google Scholar] [CrossRef]
- Pollock, T.J.; Thorne, L. Xanthomonas Campestris Strain for Production of Xanthan Gum. U.S. Patent 5,279,961 A, 18 January 1994. [Google Scholar]
- Sandiford, B.B. Laboratory and field studies of water floods using polymer solutions to increase oil recoveries. J. Pet. Technol. 1964, 16, 917–922. [Google Scholar] [CrossRef]
- Strom, T.E.; Paul, J.M.; Phelps, C.H.; Sampath, K. A new biopolymer for high-temperature profile control: Part 1-laboratory testing. Soc. Pet. Eng. J. 1991, 6, 360–364. [Google Scholar] [CrossRef]
- Blokker, N.C.M. Analysis of alginate-like exopolysaccharides for the application in enhanced oil recovery. Master’s Thesis, Delft University of Technology, Delft, The Netherlands, 2014. [Google Scholar]
- Bailey, S.A.; Bryant, R.S.; Duncan, K.E. Use of Biocatalysts for Triggering Biopolymer Gelants; Society of Petroleum Engineers: Tulsa, OK, USA, 2000. [Google Scholar]
- Kosaric, N. Biosurfactants and their application for soil bioremediation. Food Technol. Biotechnol. 2001, 39, 295–304. [Google Scholar]
- Leveratto, M.A.; Lauri, J.; Sanz, C.; Sigal, J.; Farouq Ali, S.M. EOR polymer screening for an oil field with high salinity brines. Soc. Pet. Eng. J. 1996, 4, 73–81. [Google Scholar] [CrossRef]
- Kahovec, J.; Fox, R.B.; Hatada, K. Nomenclature of regular single-strand organic polymers. Pure Appl. Chem. 2002, 74, 1921–1956. [Google Scholar] [CrossRef]
- Martin, G.; Yen, T.; Karimi, S. In Application of biopolymer technology in silty soil matrices to form impervious barriers. In Proceedings of the 7th Australia-New Zealand Geomechanics Conference, Adelaide, Australia, 1–5 July 1996.
- Meuser, H. Soil Remediation and Rehabilitation; Springer: Dordrech, The Netherlands, 2010; Volume 23, pp. 1–2. [Google Scholar]
- Daripa, P.; Paşa, G. On capillary slowdown of viscous fingering in immiscible displacement in porous media. Transp. Porous Med. 2008, 75, 1–16. [Google Scholar] [CrossRef]
- Mulligan, C.N. Environmental applications for biosurfactants. Environ. Pollut. 2005, 133, 183–198. [Google Scholar] [CrossRef] [PubMed]
- Chai, J.-C.; Miura, N. Field vapor extraction test and long-term monitoring at a PCE contaminated site. J. Hazard. Mater. 2004, 110, 85–92. [Google Scholar] [CrossRef] [PubMed]
- Cho, J.S.; Wilson, J.T.; DiGiulio, D.C.; Vardy, J.A.; Choi, W. Implementation of natural attenuation at a JP-4 jet fuel release after active remediation. Biodegradation 1997, 8, 265–273. [Google Scholar] [CrossRef] [PubMed]
- Tse, K.K.; Lo, S.-L.; Wang, J.W. Pilot study of in-situ thermal treatment for the remediation of pentachlorophenol-contaminated aquifers. Environ. Sci. Technol. 2001, 35, 4910–4915. [Google Scholar] [CrossRef] [PubMed]
- Mulligan, C.N.; Eftekhari, F. Remediation with surfactant foam of PCP-contaminated soil. Eng. Geol. 2003, 70, 269–279. [Google Scholar] [CrossRef]
- Knox, R.C.; Sabatini, D.A. Transport and Remediation of Subsurface Contaminants; American Chemical Society: Washington, DC, USA, 1992. [Google Scholar]
- Lee, M.; Kim, J.; Kim, I. In-situ biosurfactant flushing, coupled with a highly pressurized air injection, to remediate the bunker oil contaminated site. Geosci. J. 2011, 15, 313–321. [Google Scholar] [CrossRef]
- Khatami, H.R.; O’Kelly, B.C. Improving mechanical properties of sand using biopolymers. J. Geotech. Geoenviron. Eng. 2012, 139, 1402–1406. [Google Scholar] [CrossRef]
- Chang, I.; Cho, G.-C. Strengthing of Korean residual soil with β-1,3/1,6-glucan biopolymer. Constr. Build. Mater. 2012, 30, 30–35. [Google Scholar] [CrossRef]
- Chang, I.; Im, J.; Prasidhi, A.K.; Cho, G.-C. Effect of Xanthan gum biopolymer on soil strengthening. Constr. Build. Mater. 2015, 74, 65–72. [Google Scholar] [CrossRef]
- Jafvert, C.T. Surfactants/Cosolvents; Ground-Water Remediation Technologies Analysis Center: Pittsburgh, PA, USA, 1996. [Google Scholar]
- Jawitz, J.W.; Annable, M.D.; Rao, P. Miscible fluid displacement stability in unconfined porous media: Two-dimensional flow experiments and simulations. J. Contam. Hydrol. 1998, 31, 211–230. [Google Scholar] [CrossRef]
- Lee, M.; Kang, H.; Do, W. Application of nonionic surfactant-enhanced in situ flushing to a diesel contaminated site. Water Res. 2005, 39, 139–146. [Google Scholar] [CrossRef] [PubMed]
- Mulligan, C.; Yong, R.; Gibbs, B. Remediation technologies for metal-contaminated soils and groundwater: An evaluation. Eng. Geol. 2001, 60, 193–207. [Google Scholar] [CrossRef]
- Park, J.-Y.; Kim, S.-J.; Lee, Y.-J.; Baek, K.; Yang, J.-W. Ek-fenton process for removal of phenanthrene in a two-dimensional soil system. Eng. Geol. 2005, 77, 217–224. [Google Scholar] [CrossRef]
- Tsai, T.-T.; Kao, C.-M.; Yeh, T.-Y.; Liang, S.-H.; Chien, H.-Y. Remediation of fuel oil-contaminated soils by a three-stage treatment system. Environ. Eng. Sci. 2009, 26, 651–659. [Google Scholar] [CrossRef]
- Zhou, W.; Fu, H.; Pan, K.; Tian, C.; Qu, Y.; Lu, P.; Sun, C.-C. Mesoporous TiO2/α-Fe2O3: Bifunctional composites for effective elimination of arsenite contamination through simultaneous photocatalytic oxidation and adsorption. J. Phys. Chem. C 2008, 112, 19584–19589. [Google Scholar] [CrossRef]
- Sorbie, K. Introduction to polymer flooding. In Polymer-Improved Oil Recovery; Springer: Dordrech, The Netherlands, 1991; pp. 1–5. [Google Scholar]
- Kim, P.; Wong, T.S.; Alvarenga, J.; Kreder, M.J.; Adorno-Martinez, W.E.; Aizenberg, J. Liquid-infused nanostructured surfaces with extreme anti-ice and anti-frost performance. ACS Nano 2012, 6, 6569–6577. [Google Scholar] [CrossRef] [PubMed]
- Bruun, J.; Hicks-Bruun, M. Isolation of n-decane from petroleum by distillation and equilibrium melting. J. Res. Natl. Bur. Stand. 1932, 8, 583–589. [Google Scholar] [CrossRef]
- Fan, R.; Guo, S.; Li, T.; Li, F.; Yang, X.; Wu, B. Contributions of electrokinetics and bioremediation in the treatment of different petroleum components. Clean Soil Air Water 2015, 43, 251–259. [Google Scholar] [CrossRef]
- Fu, W.J.; Chi, Z.; Ma, Z.C.; Zhou, H.X.; Liu, G.L.; Lee, C.F.; Chi, Z.M. Hydrocarbons, the advanced biofuels produced by different organisms, the evidence that alkanes in petroleum can be renewable. Appl. Microbiol. Biotechnol. 2015, 99, 7481–7494. [Google Scholar] [CrossRef] [PubMed]
- Margesin, R.; Moertelmaier, C.; Mair, J. Low-temperature biodegradation of petroleum hydrocarbons (n-alkanes, phenol, anthracene, pyrene) by four actinobacterial strains. Int. Biodeterior. Biodegrad. 2013, 84, 185–191. [Google Scholar] [CrossRef]
- Bertrand, E.M.; Keddis, R.; Groves, J.T.; Vetriani, C.; Austin, R.N. Identity and mechanisms of alkane-oxidizing metalloenzymes from deep-sea hydrothermal vents. Front. Microbiol. 2013, 4, 109. [Google Scholar] [CrossRef] [PubMed]
- Zemo, D.A.; Bruya, J.E.; Graf, T.E. The application of petroleum hydrocarbon fingerprint characterization in site investigation and remediation. Ground Water Monit. Remediat. 1995, 15, 147–156. [Google Scholar] [CrossRef]
- Rayner, J.L.; Snape, I.; Walworth, J.L.; Harvey, P.M.; Ferguson, S.H. Petroleum-hydrocarbon contamination and remediation by microbioventing at sub-antarctic macquarie island. Cold Reg. Sci. Technol. 2007, 48, 139–153. [Google Scholar] [CrossRef]
- Nadim, F.; Hoag, G.E.; Liu, S.; Carley, R.J.; Zack, P. Detection and remediation of soil and aquifer systems contaminated with petroleum products: An overview. J. Pet. Sci. Eng. 2000, 26, 169–178. [Google Scholar] [CrossRef]
- Zyakun, A.; Nii-Annang, S.; Franke, G.; Fischer, T.; Buegger, F.; Dilly, O. Microbial activity and 13C/12C ratio as evidence of N-hexadecane and N-hexadecanoic acid biodegradation in agricultural and forest soils. Geomicrobiol. J. 2012, 29, 570–584. [Google Scholar] [CrossRef]
- Lenormand, R. Liquids in porous media. J. Phys. Condens. Matter 1990, 2, 79. [Google Scholar] [CrossRef]
- Lenormand, R.; Touboul, E.; Zarcone, C. Numerical models and experiments on immiscible displacements in porous media. J. Fluid Mech. 1988, 189, 165–187. [Google Scholar] [CrossRef]
- Lenormand, R.; Zarcone, C.; Sarr, A. Mechanisms of the displacement of one fluid by another in a network of capillary ducts. J. Fluid Mech. 1983, 135, 337–353. [Google Scholar] [CrossRef]
- Buchgraber, M. An Enhanced Oil Recovery Micromodel Study with Associative and Conventional Polymers; University of Leoben: Leoben, Austria, 2008; pp. 16–30. [Google Scholar]
- Ferer, M.; Bromhal, G.S.; Smith, D.H. Pore-level modeling of carbon dioxide sequestration in brine fields. J. Energy Environ. Res. 2002, 2, 120–132. [Google Scholar]


| Ottawa Sand A | Ottawa Sand A | |
|---|---|---|
| *D10 | 0.23 | 0.18 |
| *D50 | 0.25 | 0.32 |
| *Cu | 1.22 | 2.28 |
| *Cc | 0.86 | 0.72 |
| Concentration (g/L) | PEO | SA | ||||
|---|---|---|---|---|---|---|
| Contact Angle (°) | Mean | Standard Deviation | Contact Angle (°) | Mean | Standard Deviation | |
| 0 | 95.2 | 96.0 | 0.59 | 95.2 | 96.0 | 0.59 |
| 96.6 | 96.6 | |||||
| 96.2 | 96.2 | |||||
| 2 | 87.2 | 87.4 | 0.17 | 90.1 | 90.6 | 0.68 |
| 87.6 | 90.2 | |||||
| 87.5 | 91.6 | |||||
| 5 | 92.2 | 92.2 | 0.16 | 91.2 | 91.8 | 0.97 |
| 92.0 | 91.1 | |||||
| 92.4 | 93.2 | |||||
| 10 | 100.8 | 101.4 | 0.59 | 90.3 | 90.7 | 0.39 |
| 102.2 | 90.5 | |||||
| 101.2 | 91.2 | |||||
| Biopolymer Types | p Value | |||
|---|---|---|---|---|
| ANOVA | t-Test | |||
| 0 g/L~10 g/L | 0 g/L~2 g/L | 2 g/L~5 g/L | 5 g/L~10 g/L | |
| PEO | 6.21 × 10⁻⁹ | 3.86 × 10⁻⁵ | 8.89 × 10⁻⁶ | 2.87 × 10⁻⁵ |
| SA | 1.51 × 10⁻⁴ | 1.10 × 10⁻³ | 0.225 | 0.188 |
| Concentration (g/L) | PEO | SA | ||||
|---|---|---|---|---|---|---|
| Interfacial Tension (mN/m) | Mean | Standard Deviation | Interfacial Tension (mN/m) | Mean | Standard Deviation | |
| 0 | 51.2 | 51.2 | 0.21 | 51.2 | 51.2 | 0.21 |
| 51.0 | 51.0 | |||||
| 51.5 | 51.5 | |||||
| 2 | 26.2 | 26.0 | 0.16 | 34.2 | 34.7 | 0.41 |
| 26.0 | 34.8 | |||||
| 25.8 | 35.2 | |||||
| 5 | 25.8 | 25.5 | 0.25 | 37.2 | 37.4 | 0.16 |
| 25.4 | 37.4 | |||||
| 25.2 | 37.6 | |||||
| 10 | 25.1 | 25.0 | 0.12 | 39.5 | 39.5 | 0.33 |
| 25.0 | 39.1 | |||||
| 24.8 | 39.5 | |||||
| Biopolymer Types | p-Value | |||
|---|---|---|---|---|
| ANOVA | t-Test | |||
| 0 g/L~10 g/L | 0 g/L~2 g/L | 2 g/L~5 g/L | 5 g/L~10 g/L | |
| PEO | 1.85 × 10⁻¹⁴ | 1.76 × 10⁻⁸ | 0.06 | 0.06 |
| SA | 5.38 × 10⁻¹¹ | 9.00 × 10⁻⁷ | 1.03 × 10⁻³ | 1.24 × 10⁻³ |
© 2017 by the authors; licensee MDPI, Basel, Switzerland. This article is an open access article distributed under the terms and conditions of the Creative Commons Attribution (CC-BY) license (http://creativecommons.org/licenses/by/4.0/).
Share and Cite
Jung, J.; Hu, J.W. Characterization of Polyethylene Oxide and Sodium Alginate for Oil Contaminated-Sand Remediation. Sustainability 2017, 9, 62. https://doi.org/10.3390/su9010062
Jung J, Hu JW. Characterization of Polyethylene Oxide and Sodium Alginate for Oil Contaminated-Sand Remediation. Sustainability. 2017; 9(1):62. https://doi.org/10.3390/su9010062
Chicago/Turabian StyleJung, Jongwon, and Jong Wan Hu. 2017. "Characterization of Polyethylene Oxide and Sodium Alginate for Oil Contaminated-Sand Remediation" Sustainability 9, no. 1: 62. https://doi.org/10.3390/su9010062