Article

Experimental Measurement of Wave Field Variations around Wave Energy Converter Arrays

by
Louise O’Boyle
1,*,
Björn Elsäßer
1,2 and
Trevor Whittaker
1
1
School of Natural and Built Environment, Queen’s University Belfast, David Keir Building, Stranmillis Road, Belfast BT7 1NN, UK
2
Danish Hydraulic Institute (DHI), Agern Allé 5, Hørsholm DK-2970, Denmark
*
Author to whom correspondence should be addressed.
Sustainability 2017, 9(1), 70; https://doi.org/10.3390/su9010070
Submission received: 31 October 2016 / Revised: 12 December 2016 / Accepted: 22 December 2016 / Published: 5 January 2017
(This article belongs to the Special Issue Wave Energy Converters)

Abstract

:
Wave energy converters (WECs) inherently extract energy from incident waves. For wave energy to become a significant power provider in the future, large farms of WECs will be required. This scale of energy extraction will increase the potential for changes in the local wave field and coastal environment. Assessment of these effects is necessary to inform decisions on the layout of wave farms for optimum power output and minimum environmental impact, as well as on potential site selection. An experimental campaign to map, at high resolution, the wave field variation around arrays of 5 oscillating water column WECs and a methodology for extracting scattered and radiated waves is presented. The results highlight the importance of accounting for the full extent of the WEC behavior when assessing impacts on the wave field. The effect of radiated waves on the wave field is not immediately apparent when considering changes to the entire wave spectrum, nor when observing changes in wave climate due to scattered and radiated waves superimposed together. The results show that radiated waves may account for up to 50% of the effects on wave climate in the near field in particular operating conditions.

1. Introduction

Wave power is a promising contributor to a global sustainable energy portfolio; a global resource which is estimated to be comparable to consumption [1]. Wave energy converters (WECs) are devices designed to generate renewable energy through the conversion of the potential and kinetic energy contained in ocean waves into electricity. WEC technology development has been the subject of decades of research with various different concepts being proposed [2,3,4], however no single concept has yet emerged as the optimum design. Regardless of the technology type, all WECs, by their presence in the ocean and their design, inherently extract energy from incident waves and alter the surrounding wave field. At present, the wave energy industry is in the development stages with laboratory testing of potential technologies and a small number of full scale ‘proof of concept’ machines being tested at various test sites individually [5,6] or in small arrays [7]. For the industry to progress in order for wave energy to become a significant provider of power in the future, large wave farms (consisting of 10 s–100 s of WECs) will be required. This scale of energy extraction will increase the potential for significant changes in the wave field around the farm, which may, in turn influence other energy dissipating processes and ecologies in the coastal zone.
Assessment of the effect of wave farms (or arrays of WECs) on the local wave field is necessary to inform decisions on the layout of wave farms to utilise array interactions for optimisation of power output and also for minimising the environmental impact of such developments. In a recent review article [4], alterations in flow patterns, wave structures, and sediment dynamics were listed among the main expected environmental impacts of WEC developments, suggesting that localised environmental impacts should be the focus of future research. Variations in hydrodynamics caused by arrays of WECs in the marine environment may impact many physical and biological processes. These include variation in wave climate, water particle velocity, sediment transport, organism transport, pollution dispersal, and biogeochemical processes; a summary of these processes and modelling considerations is available in [8]. It should be noted that not all impacts are undesirable. There is a growing interest in the use of WEC farms for purposes of coastal protection [9,10,11]. Observation of the variation in wave climate is the first step in determining the effects of WEC farms on the other environmental aspects of sediment transport, organism transport, pollution dispersal, and biogeochemical processes.
A great deal of research has been carried out in the area of wave energy device development and, in recent years, on the optimisation of WEC array power production [12,13,14,15,16]. Only a small number of studies consider the environmental impact of such devices. To date, the impact of wave farms on wave climate has mainly been modelled numerically using wave propagation models such as mild-slope, Boussinesq, and Spectral Wave models [17] (examples include [18,19,20,21,22,23,24,25,26,27,28]). Within these studies, individual devices or entire wave farms are usually represented using partially transmitting obstacles, which do not represent the full hydrodynamic behaviour of the WEC. There are a limited number of publications concerning physical measurements of wave field impacts for numerical model validation. Experimental measurements of the transformation of irregular waves, by an array of 5 and 10 heaving point absorber WECs, was presented by Alexandre et al. [26]. The transformation of the wave spectra was derived using wave gauges up- and down-wave of the array, accounting for tank effects and finding some reduction in significant wave height downstream, which is dependent on the WEC performance. Ashton et al. [29] carried out tests in regular and irregular waves with 1, 3, and 5 Oscillating Water Column (OWC) WECs demonstrating the difficulty in deriving an understanding of the wave field hydrodynamics using point wave measurements from a total of 5 wave gauges. Recent investigations into the performance and reflection coefficients for shoreline OWCs have also been carried out (e.g., [30,31,32]) using a number of point measurements to determine wave reflection from shoreline OWCs. Haller et al. [33] present experiments using 1, 3 and 5 ‘Manta’ WECs, again using groups of wave gauges up- and down-wave of the array to assess the effects on the wave climate. In this study, plots of the variation of measured wave heights within the wave basin are presented and show a strong dependence on the WEC density, performance, and wave period. Zanuttigh and Angelelli [9] measured the transmission and reflection coefficients for an array of 3 DEXA WECs, using arrays of wave gauges in front of and behind the array, and found a modest reduction in the wave energy with transmission to be dependent on the wavelength to device length ratio. The largest experimentally tested WEC array known to the authors was undertaken within the WECwakes Project and consisted of arrays of up to 25 devices tested in the Shallow Water Wave Basin of DHI in Denmark [10]. A large number of tests were conducted utilising multiple geometric layouts and regular, irregular, long, and short created seas, resulting in a valuable data set for numerical model validation. A maximum wave height attenuation in the region of 20% is observed for arrays of 5 × 5 heaving buoy devices. The studies discussed above show progress towards quantification of the overall far field wave attenuation caused by a WEC array. However, due to the experimental set-up and the relatively small number of point measurements of the wave field, it is difficult to extract the influence of individual WEC effects on the overall wave field modification. Furthermore, unless great care is taken to account for baseline variation of wave field within the wave basin, it is difficult to determine WEC array impacts apart from experimental errors. This paper intends to further the understanding of the processes causing the observed wave field variations and to resolve the wave field around different array layouts at high resolution, accounting for wave basin homogeneity.
The potential effects of a WEC on the local wave field may be subdivided into two separate processes; i.e. wave scattering and wave radiation. Wave scattering includes the diffraction and reflection of wave energy due to the physical presence of the obstacle in the water column. Wave radiation, on the other hand, describes waves radiated by the motion or oscillation of the body. The effect of WECs on the wave field is a combination of these processes, and the magnitude of the effects these have on the wave field is dependent upon many factors. These include the incident wave climate, the size of the device, the mode of motion of the WEC, the WEC tuning, the number of bodies in the array, and the array spacing. This paper describes an experimental investigation into wave field variations around arrays of Oscillating Water Column WECs and a methodology for extracting radiated and scattered waves from the resulting wave field maps for different incident wave conditions. This will be influential in understanding the factors effecting the impact of WECs on the wave field and informing an accurate hydrodynamic representation of WECs in wave propagation models for further environmental impact investigations.

2. Materials and Methods

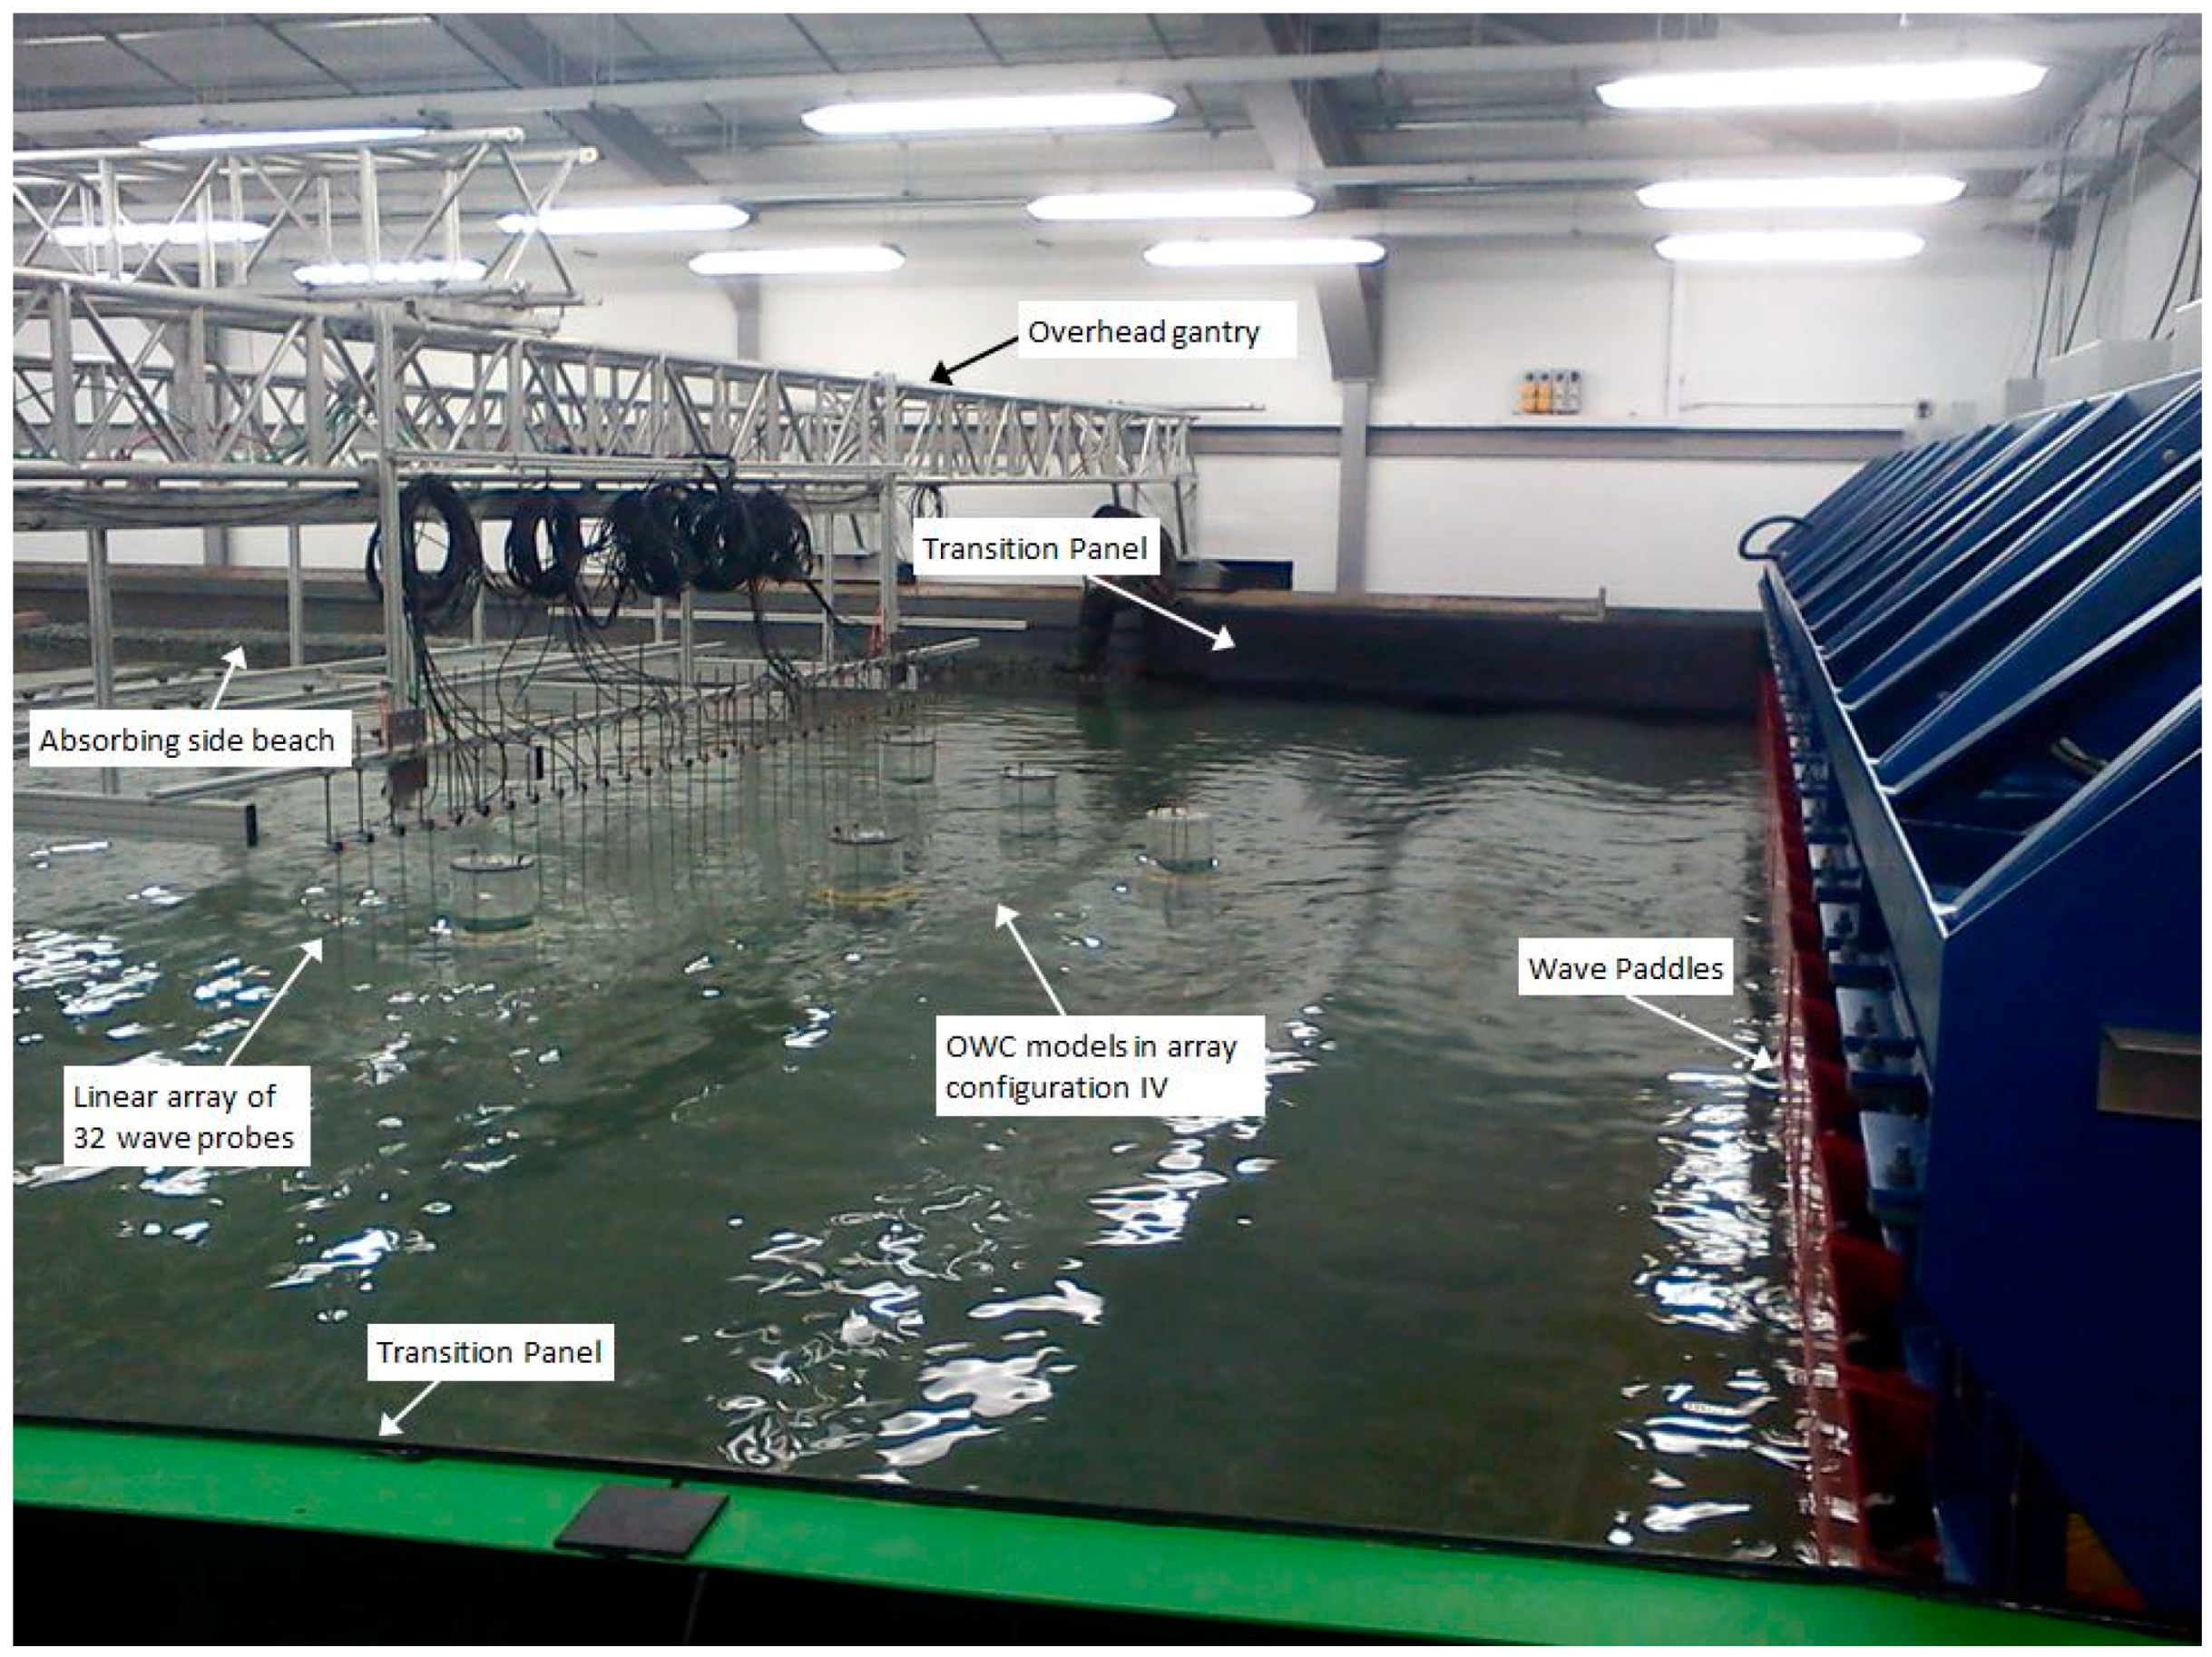
2.1. Experimental Set-Up

Experiments were carried out in the Queen’s University 3D coastal wave basin in Portaferry. The set-up and design of the wave basin has been described in [34,35]. The basin is 18 m long by 16 m wide; the water depth was set to 550 mm for this set of experiments. Waves are generated by a 12 m wide bank of 24 top hinged, force feedback, sector carrier wave paddles designed by Edinburgh Designs. The basin is fitted with curved transition panels leading to gravel side beaches, which dissipate wave energy on the remaining three sides and are capable of absorbing up to 99% of the incident wave energy [35].

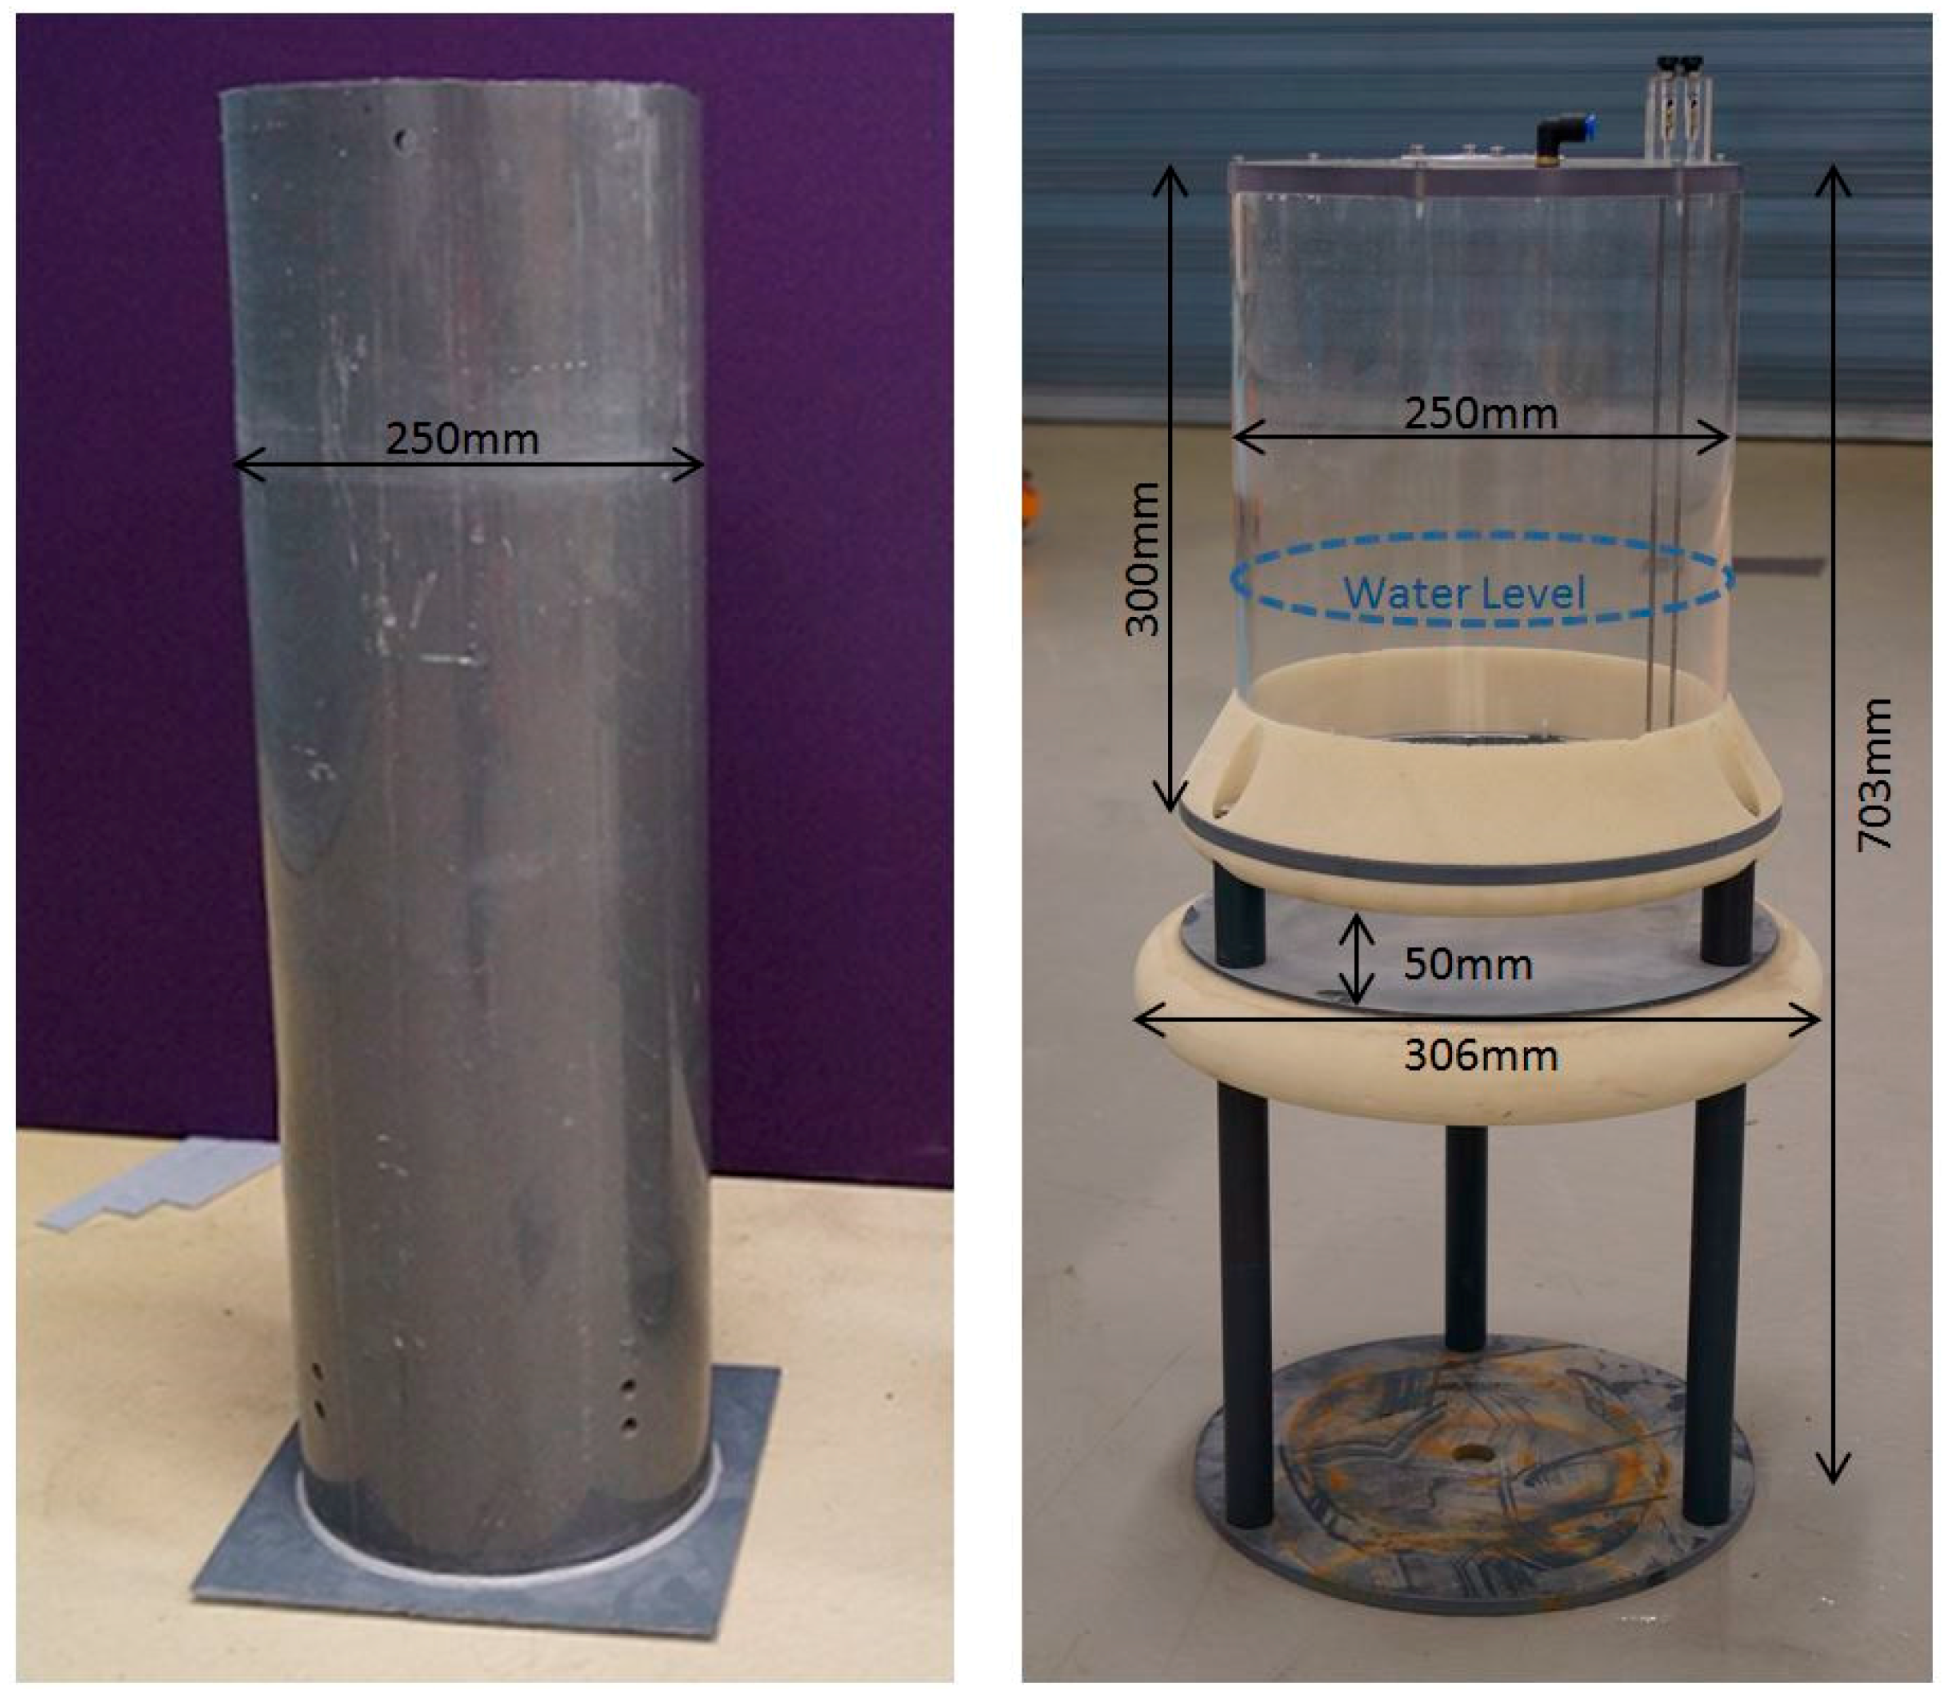
Description of WEC Models

The wave field variations around wave energy converter arrays are investigated using WECs of the Oscillating Water Column (OWC) type. OWCs are one of the primary classes of WEC and can be bottom mounted, floating, or integrated into the shoreline/breakwater. The only moving part of an OWC is the air turbine used to generate electricity. A comprehensive review of OWC technologies and air turbines is available in [36].
A typical OWC device consists of a chamber, partially submerged and open below the water surface, in which air is trapped above the water surface. The pressure of the air inside the chamber periodically varies due to the motion of the water surface caused by incident waves. Figure 1 shows the bottom mounted OWC model used in these experiments. These are point absorbers, which respond to the heaving motion of the incident waves and which not only reflect, diffract, and absorb wave energy, but also radiate waves. This is as a result of the oscillations of the internal body of water within the chamber of the OWC, while the OWC itself remains fixed in position. The oscillation of the internal water column is influenced by the simulated power take off (PTO). In this way, the interaction of the OWC device with the wave climate is typical for many other point absorbing WECs. The main body of the model consists of a Perspex tube, 250 mm in outside diameter (240 mm inside diameter) and 300 mm in height. Water enters the model through an opening between the bottom of the column and the base plate. The entrance is profiled with high density modelling foam to streamline the inflow. It is possible to tune the response of the device to particular incident waves by varying the submergence of the main body of the model [37]. In this experiment, water depth was 550 mm; therefore the model submergence between the still water level and the top of the base plate was 232 mm. While these OWC models do not represent a scaled version of any particular WEC concept under development, the approximate scale of the experiments is in the range 1:25 to 1:50.
A total of five models are tested individually and in 4 different array configurations. Mapping is also carried out for arrays of fully reflective vertical cylinders 250 mm in diameter (see Figure 1). This allows the wave disturbance pattern due wave scattering and wave radiation to be extracted and compared during the processing of the results.
In a fully operational OWC, the change in pressure would force the air through a turbine, which in turn drives an electric generator producing power. The models used here simulate the PTO by restricting the air flow through an orifice mounted on top of the device, which exerts a quadratic damping force, verified in [38]. Varying damping forces are applied to each device by varying the size of the PTO orifice at the top of the model. Figure 2 shows a detailed view of the orifice. By damping the inflow and outflow of air through the orifice, the response of the model may be tuned to particular wave conditions. A heavily damped, or over-damped, OWC (i.e., small orifice opening) experiences large pressure fluctuations in the air chamber but does not generate much power as the rate of flow of air through the orifice is minimised. Similarly if the airflow is not restricted (i.e., large orifice opening), the flow rate will be high but the pressure inside the air chamber will be minimal. Optimum damping is the level of flow restriction that achieves maximum power output from the OWC in a particular wave condition. In studies where the performance and optimisation of full scale devices based on small scale experiments is required, it may be necessary to consider the differences in thermodynamics between the small and large scale WECs [39]. This is not within the scope of this investigation.
Two damping levels are used in this investigation; an optimum damping level where the diameter of the orifice opening is 36 mm diameter and an over damped setting with an orifice opening of 12 mm. This allows the variation in wave disturbance due to the operating conditions of the OWC (or device tuning) to be assessed. The optimum damping level was determined through experiments presented in [34].
The performance of the OWC has been assessed by several authors; detailed analysis can be found in [34,38]. Results from physical testing of individual models show that these particular models have a narrow banded frequency response with peak performance values occurring between 0.85 Hz and 1 Hz, depending on the applied damping. The natural frequency of the models with a submergence of 232 mm is approximately 0.9 Hz. Due to the circular design of the OWC chamber opening, these models are not sensitive to wave direction. Experimental results in irregular seas have also shown that the performance of individual OWCs within the array can be greatly influenced by both their position within the array and the array layout. Constructive and destructive interference of the range ±20% of the isolated OWC performance is to be expected. Thus the individual OWC captures power not only from the incident waves, but also from radiated waves generated by neighbouring devices.

2.2. Methodology

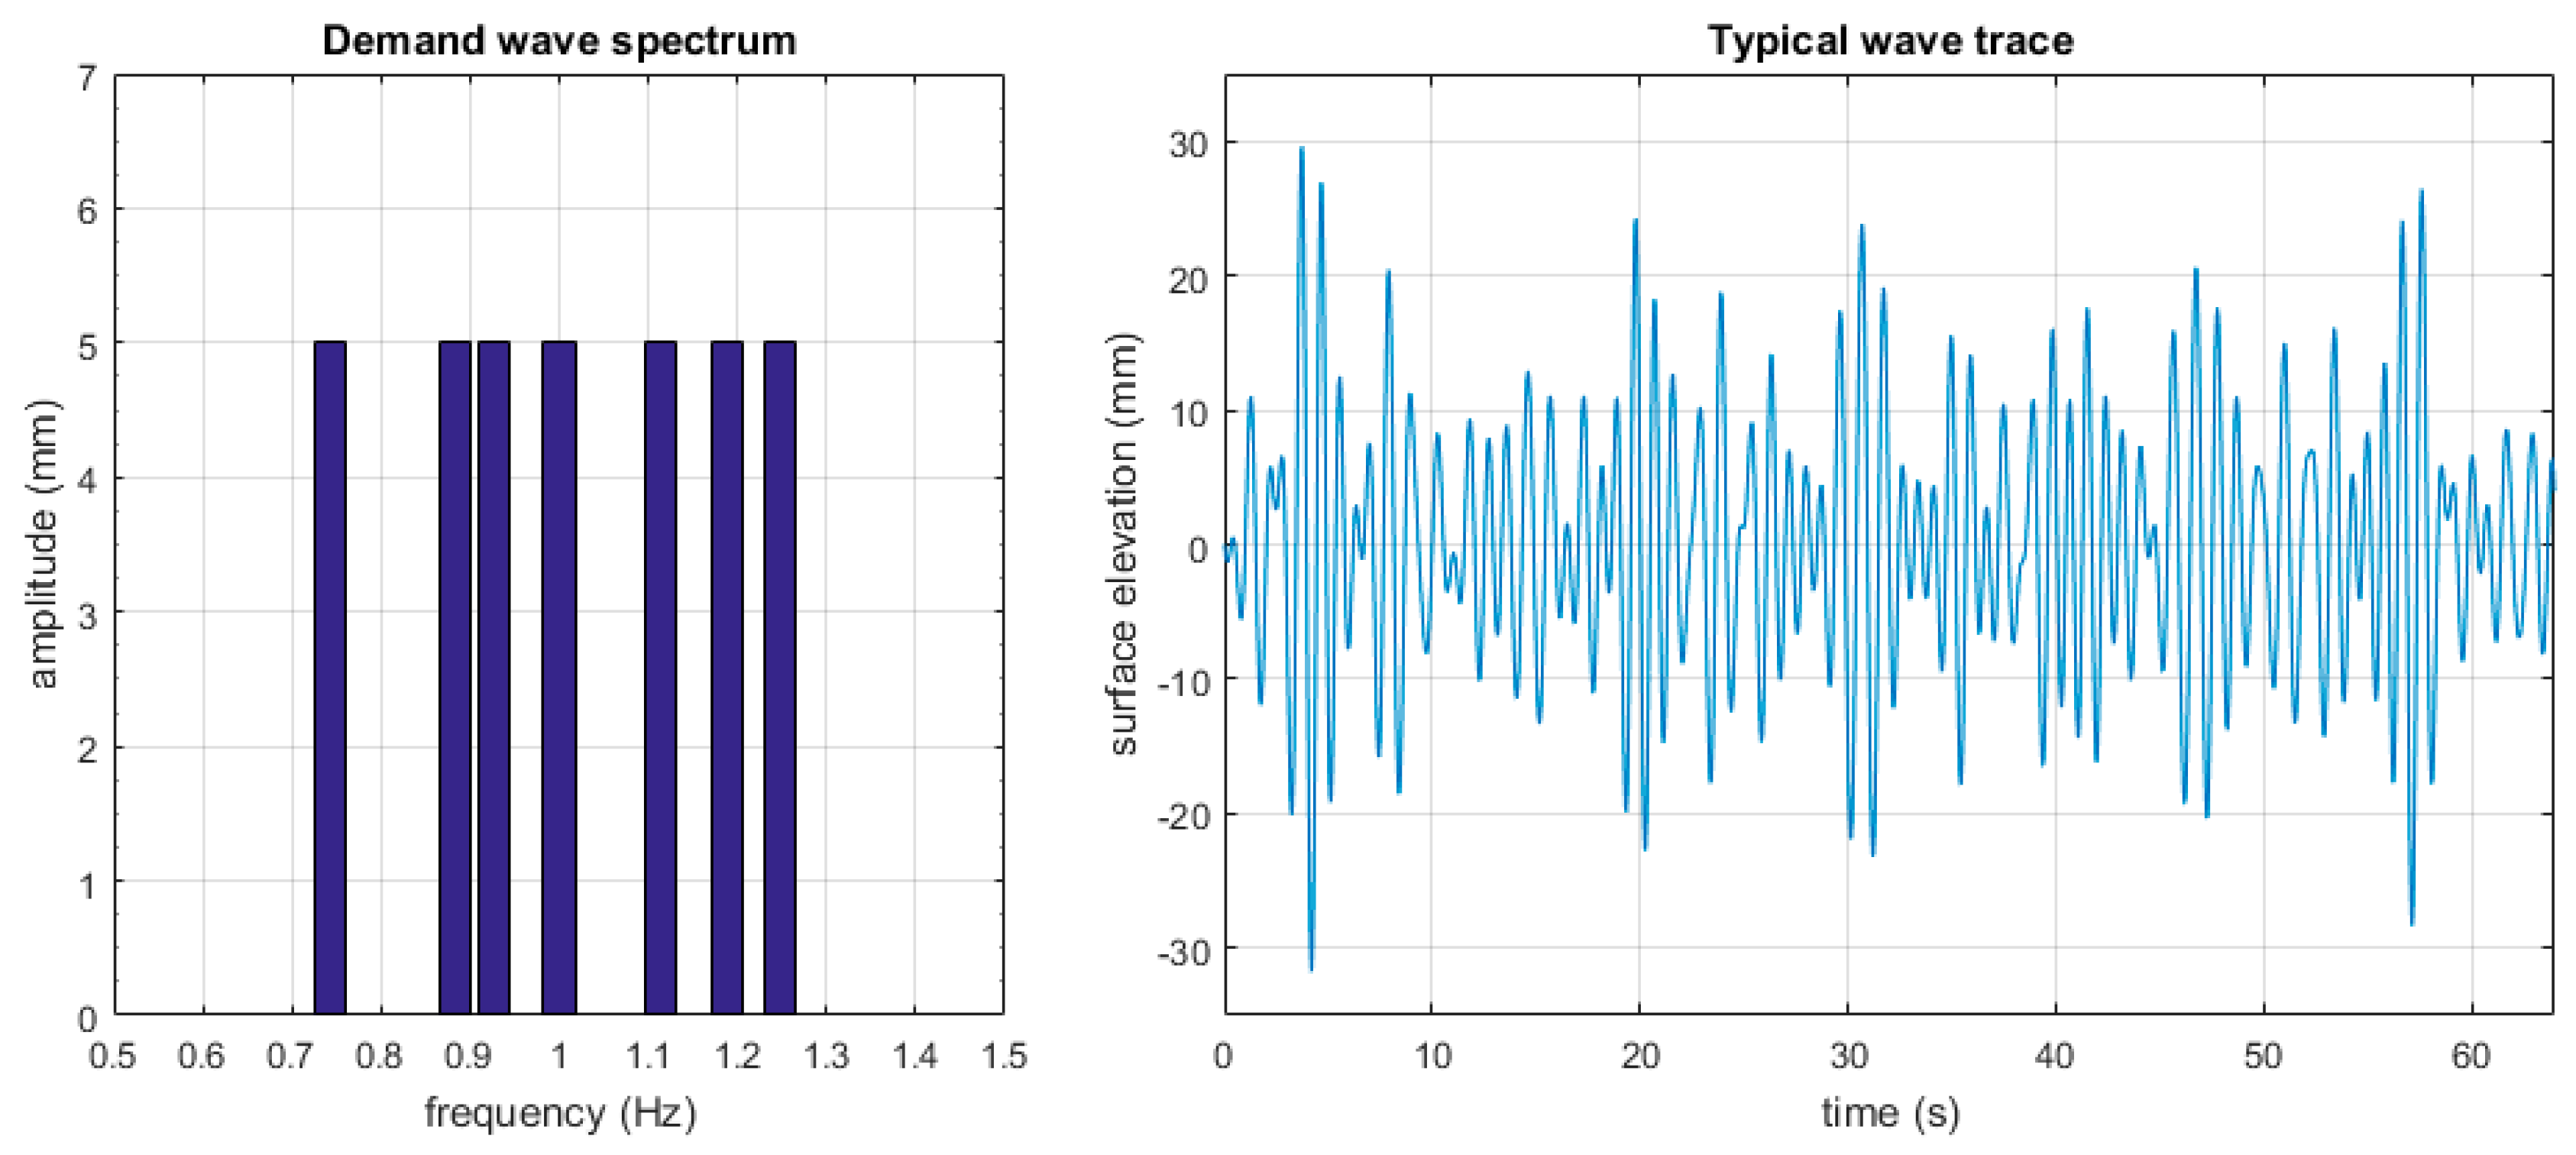
2.2.1. Polychromatic Wave Packet

WEC array interaction patterns are likely to be related to the ratio of wavelength to device spacing or device diameter. Hence it is desirable to determine the wave field variation for each device type, damping level, and array layout in a range of wave frequencies and to assess the dependence on wavelength. Mapping the wave field at high resolution for each wave frequency individually would be prohibitively time consuming; therefore it was necessary to reduce the number of sea states as much as possible. Experimental tank time was minimised by testing each array once using a carefully designed polychromatic wave packet rather than individual monochromatic waves. A wave packet containing seven individual wave components was designed to cover a range of device wavelength to diameter and wavelength to spacing ratios. Each wave component (single wave frequency) was generated simultaneously by the wave maker. The advantage being that, through the use of Fast Fourier Transform (FFT) analysis on the wave traces, it is possible to determine the interference patterns in a range of wave conditions, without the need to test each individually. Therefore each device type, array layout, and damping level need only be tested in a single sea state. This is similar to testing in a spectral sea, however the limited number of components in the wave packet means that the amplitude of each may be larger than it would be in a spectral wave. This aspect is particularly advantageous when measuring the, perhaps very small [15], effects on wave climate due to the presence of these obstacles. Assessment of wave field variations for different wavelengths using this technique has been validated in [34].
Details of each frequency component making up the wave packet are given in Table 1. The frequency discretisation ( Δ F ) of waves generated using the wave paddle control software, Ocean [40], is governed by the selection of run number ( r n u m ) as follows:
Δ F ( Hz ) = C l o c k   R a t e ( Hz ) 2 r n u m
where the clock rate for these particular wave paddles is 32 Hz. The run number is also related to the repeat time of the paddle motion, such that the repeat time is the inverse of frequency discretisation. Here a run number of 11 was chosen to allow the generated wavelength to be correct to less than 1.6% of the required wavelength for the wavelength to device spacing ratios given in Table 1. This corresponds to a frequency discretisation of 0.016 Hz and a repeat time of 64 s. The demand wave spectrum and typical wave trace are shown in Figure 3.

2.2.2. Data Acquisition

The effect of the obstacles on wave climate is mapped at high resolution, recording the surface elevation using twin wire resistance type wave probes at a minimum spacing of 6 points/wavelength. A total of 32 wave probes are used, mounted at 150 mm centres on an overhead gantry in a linear array spanning in the transverse direction, across the wave basin. An area with a total width of 4.65 m in the wave basin is mapped in only one longitudinal run, achieving a total of 1120 data points.
The wave probes are calibrated to an accuracy of 0.5%, using a pneumatic lifting system, which raises all probes by a known distance automatically without the need to enter the wave basin and disturb the water. Probes are mounted onto the support structure in such a way that the wires of individual probes may be raised to clear the height of the obstacles in the situation in which the positions of the probes and obstacles clash. No data is required from probes in this position. Probes are then lowered back into position when the gantry traverse has gone past the position of the obstacle.
After calibration, and following raising and lowering of the probes to clear obstacles, a still water test is carried out. This involves recording the surface elevation at all probes in still water (i.e., no wave propagation) and is used to account for potential movement of the support structure and any discrepancies in returning probes to their original positions. Post-processing and FFT analysis of the surface elevation allows plots of the wave disturbance to be compiled for each test case and frequency component.

2.2.3. Array Layouts

Mapping is carried out for individual models and for four different array layouts, as shown in Figure 4. Configuration I is an attenuator array, containing a single line of obstacles aligned parallel to the direction of wave propagation so that each successive obstacle is in the ‘shadow’ of those ahead of it. Configuration II also contains only a single row of obstacles, this time in a terminator configuration; i.e. obstacles are set next to each other perpendicular to the direction of wave travel so that in plane waves should each experience an identical incident wave climate. Configuration III is a diagonal array aligned at 45° to the incident wave direction, while configuration IV is a ‘V’ shaped array, where each limb is orientated at 45° to the incident wave direction, as in configuration III. One obstacle remains in the same position in the basin in all array configurations (shown hatched in Figure 4). This is the position of the single obstacle when tested individually. This allows for ease of comparison of interaction patterns due to various aspects of the array configuration.

2.2.4. Testing Procedure

Experimental testing was carried out according to the following procedure:
  • The water depth was set to 550 mm in the test area in front of the wave paddles.
  • Wave probes were calibrated and a still water test was recorded.
  • Waves were generated continuously by the wave paddles, using the polychromatic wave packet defined in Table 1.
  • A minimum time of 3 min was allowed for wave disturbance patterns to reach a stable state before commencing data capture.
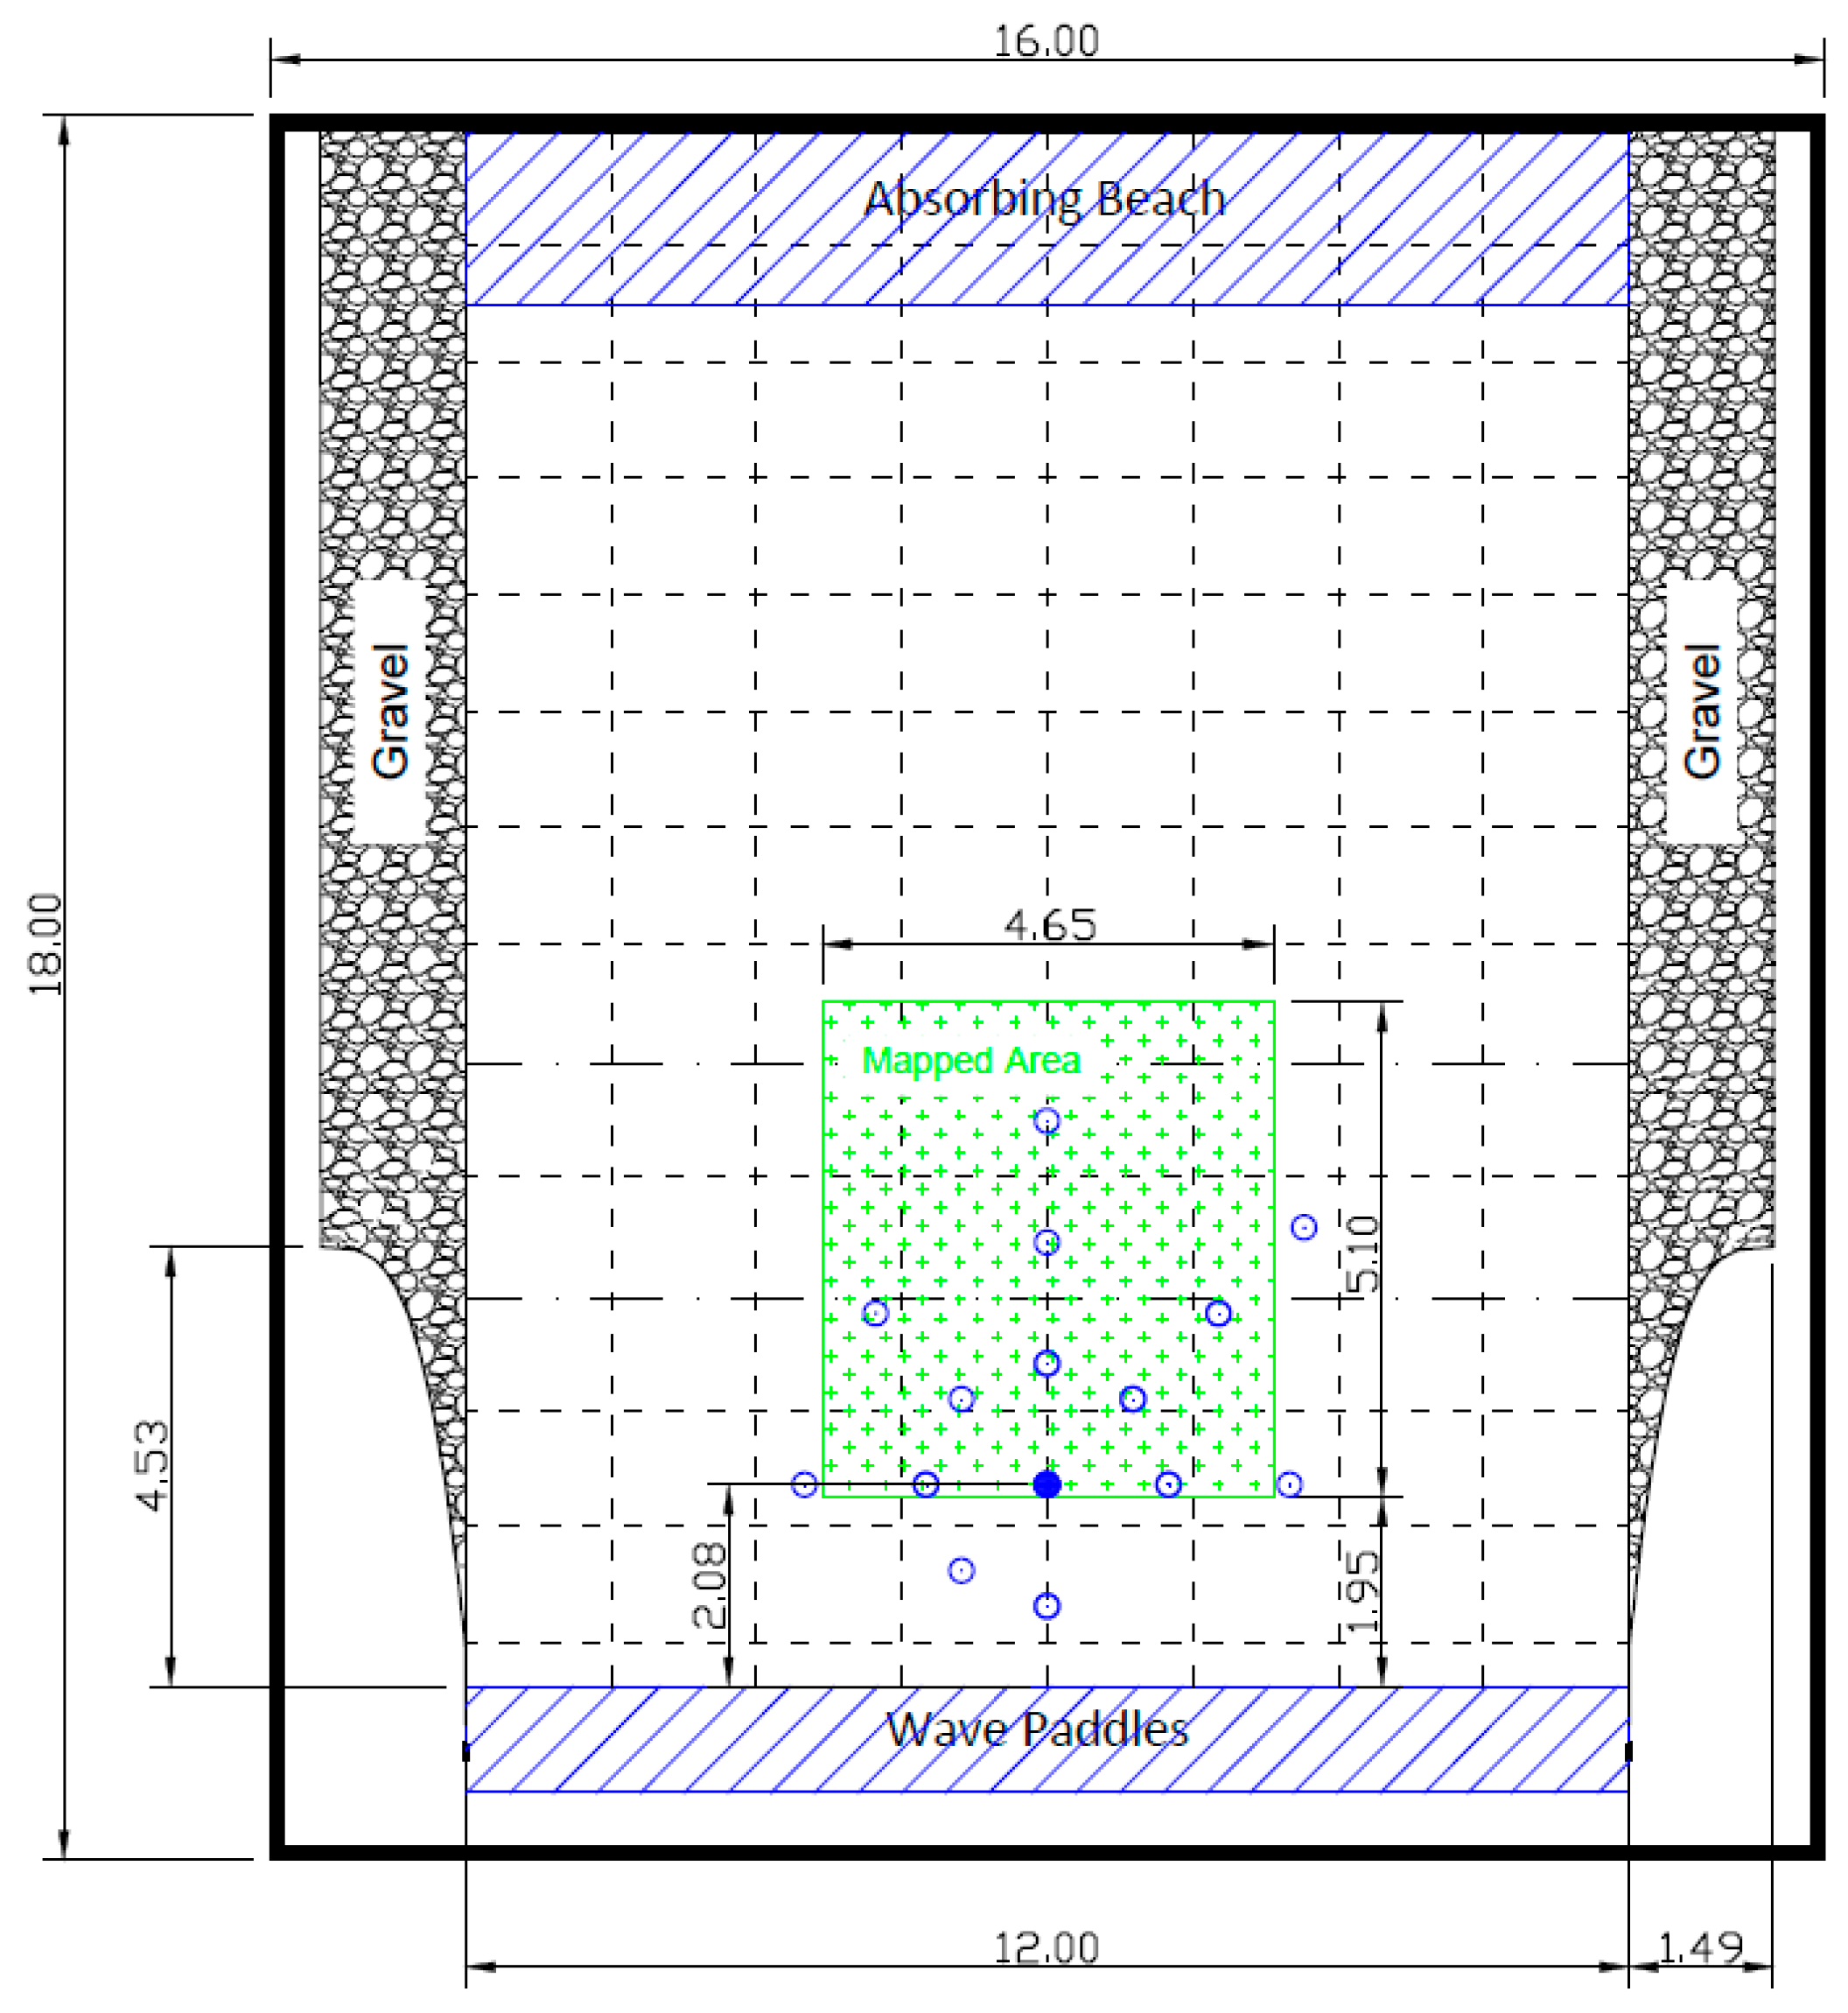
  • Surface elevation data was recorded by 32 wave probes spaced at 150 mm centres in a linear array traversing the wave basin, perpendicular to the wave propagation direction.
  • Data was recorded for a total of 64 s in each position before the gantry was moved a distance of 150 mm in the longitudinal direction.
  • If necessary, probes were raised over obstacles and lowered back into position behind the obstacle.
  • Steps 5–7 were repeated to map an area of 4.65 m by 5.1 m in the centre of the basin.
Figure 5 shows the position of the OWC models in the wave basin relative to the wave paddles and absorbing beach. The area mapped by the wave probes is also shown. This procedure was carried out once for the empty wave basin (i.e., no obstacles) to provide the baseline wave field variation of the basin in this sea state. The complete mapping exercise was then repeated for single obstacles and each array configuration, for both fully reflective and OWC models at 2 damping levels. Figure 6 shows a photograph of the experimental setup.

2.2.5. Data Analysis

Surface elevation (η) data at each probe position was collated and analysed using a Matlab R2016a routine. Firstly the wave probe offset from the zero position (Φ) was determined from the mean value of the appropriate still water test at each probe position. This was then subtracted from the raw wave trace at each probe position ( i ). FFT analysis of the recorded surface elevation time trace ( η Φ ) allowed the measured amplitude of each wave component ( a ( f ) ) to be determined. The baseline wave frequency amplitudes ( a b a s e l i n e ( f ) ), obtained in the same way but from the mapping of the empty wave basin, were subtracted from the wave component amplitude at each probe position, such that the remaining values give the wave disturbance ( μ i ( f ) ) due to the presence/operation of the obstacle and any tank effects on the interference pattern only.
μ i ( f ) = a i ( f ) a b a s e l i n e i ( f )   in   ( mm )
The mean wave disturbance ( μ ¯ ( f ) ) is the mean value of the absolute of each value of μ derived by averaging within the mapped area for each wave frequency and array configuration.
μ ¯ ( f ) = i = 1 n | μ i ( f ) | n   in   ( mm )
The normalised mean wave disturbance ( μ ¯ ^ ( f ) ) is normalised based on the demand wave amplitude ( a d e m a n d ) as defined in Table 1.
μ ¯ ^ ( f ) = μ ¯   ( f ) a d e m a n d ( f )

3. Results

Contour plots of the variation in wave disturbance from the baseline wave basin performance for each wave component and array configuration have been created. This allows assessment of the effects of wavelength, array spacing, array layout, and device type to be observed. Figure 7 and Figure 8 are examples showing the wave disturbance from the baseline performance for fully reflective obstacles in Array configurations I and II respectively. This wave disturbance is caused by the scattered wave only. All contour plots are plotted to the same scale of ± 4.5 mm, therefore covering a wave disturbance range due to the array of ± 4.5 mm from the baseline performance of the basin, or ± 90% of the incident wave amplitude of that component. Waves propagate in the y direction from the wave paddles, positioned at y = 0.
There is a clear difference in the wave disturbance patterns caused by each array layout, and the patterns vary depending on the wavelength of the individual wave component. Similar results have been observed for other array configurations and OWC tests. In Array Configuration I, the obstacles are aligned parallel to the incident wave direction. The plots show a standing wave pattern, particularly evident when the wavelength is equal to the device spacing of 1.25 m (1.109 Hz). Array Configuration II is a terminator array of 5 obstacles aligned at 90° to the incident wave direction. Where the wavelength is equal to or less than the device spacing, significant wave disturbance in the form of a diffraction pattern is observed in the lee of the array. However, where the wavelength is greater than the device spacing, the wave disturbance is minimal. In fact, of all configurations tested, Array Configuration II caused the least wave disturbance in all components where wavelength is greater than 1.25 m.
The results presented so far are for fully reflective obstacles only, however they demonstrate that the scattered wave field has a clear dependency on the wavelength of incident waves. Figure 9 contains plots of the variation in observed mean wave disturbance ( μ ¯ ( f ) ) , with the wavelength to device spacing ratio for each device type (fully reflective, over damped OWC, and optimally damped OWC) and different array layouts. Mean wave disturbance is defined by Equation (3) and normalised to the demand wave amplitude ( a d e m a n d ), as given in Equation (4), such that a normalised mean wave disturbance of 0.1 corresponds to 10% of the requested incident wave amplitude of that frequency component. These plots give an indication of the scale of wave disturbance within the entire mapped area. This figure shows that, regardless of device type and array configuration, the wave disturbance is generally reduced as the wavelength to spacing ratio increases.
The plots in Figure 9 also allow comparison of the amount of wave disturbance for different device types and damping levels. For the single obstacle, the mean wave disturbance is similar for all device types; however there is a slight increase for the OWC at both damping levels, which can be attributed to wave radiation. Wave radiation has a more pronounced effect when the OWC is optimally damped. This effect is also visible in plots for each array layout, particularly around the 1.75 m wavelength (wavelength to spacing ratio = 1.4), which corresponds to a frequency of 0.92 Hz and has been shown to be close to the natural frequency of the OWC model [34]. When the device is optimally damped, oscillations are near resonance, the power captured by the device is maximised and radiated waves, resulting from oscillation of the water inside the OWC chamber, are greatest. This leads to greater variations in the wave field around the array, with increased mean wave disturbance of up to 100% in Array Configuration II, compared to the over damped OWC. In arrays I, III, and IV, the over damped OWC actually reduces the wave disturbance when compared to the fully reflective obstacle. This is not the case in Array Configuration II, where increased wave disturbance is recorded at both OWC damping settings.
Figure 9 allows comparison of the mean wave disturbance in the mapped area for OWC models when compared to that of fully reflective obstacles. However these values report the combined effects of reflection, transmission, and radiation by the OWC on the wave climate. From this information alone, it is difficult to detect whether the differences are due to radiation from the device or simply due to energy absorption by the more efficient optimally damped OWC. Further insight may be gained by separation of these effects.
Subtracting the wave disturbance pattern obtained from experiments involving only the fully reflective obstacles allows the effect of radiation from the OWC to be revealed. The wave disturbance due to only the radiation effect of OWC in array configuration IV has been plotted in Figure 10 and Figure 11 for over damped and optimally damped OWCs respectively. Note that there is a substantial wave quilting effect that is visible only in the optimally damped case and occurring most strongly in the 1.75 m wavelength plot, which corresponds to the natural frequency of the model. When optimum damping is applied to the OWC, it is allowed to resonate at its natural frequency leading to optimum wave radiation. Waves radiated from individual devices, as a result of resonance, combine to form a coherent radiation wave field around the array. This effect does not occur when the OWC is over damped as oscillations within the OWC water column are restricted, due to the narrow orifice opening, and so the operation does not reach resonance.

4. Discussion

Oscillating Water Column WEC models have been used to measure the effect of WEC arrays on the local wave climate experimentally. Although the effects were expected to be small, it has been possible to measure them efficiently using a high-density wave mapping technique and a specially designed polychromatic wave packet containing seven discrete frequency components. An essential step for the investigation of WEC arrays is to account for the homogeneity of the wave field in the test area of the basin. Spatial variability in waves measured in experimental wave basins originate from imperfect wave generation, wave spreading, bathymetric variation, and reflections from the boundaries of the basin. Although every effort has been made to produce a homogenous wave field [35,41], it is not possible to fully remove all tank effects. Therefore, for certain studies such as measuring the wave field around WEC arrays, these effects must be accounted for; for example, by mapping the baseline variations in wave climate in the basin without any models installed. This prevents contamination of wave field caused by tank effects from the array, which would lead to misleading results.
The potential effects of a WEC on the local wave field are a combination of both wave scattering and wave radiation. Wave scattering describes the diffraction and reflection of wave energy due to the physical presence of the obstacle in the water column. In this study, the scattered wave field has been investigated separately through the use of fully reflective vertical cylinders with the same diameter as the OWC models. This allows an assessment of the scattered wave field only. The results show evidence of coherent/standing wave patterns between obstacles, which are particularly evident when the wavelength is equal to the device spacing (1.25 m). In Array Configuration II, there is a noticeable wave diffraction pattern, which is observed only when the wavelength is equal to or less than the spacing between obstacles. When the wavelength is greater than the device spacing, waves are able to pass through the array relatively unaffected. This is concurrent with the diffraction theory of optics (e.g., [42]) and suggests that, when designing a wave farm layout, the effect on hydrodynamics due to wave scattering can be controlled by considering the typical wavelength at the site with respect to device spacing. Where the aim is to reduce changes in hydrodynamics due to the array, the spacing should be kept greater than the typical wavelength at the site.
In addition to wave scattering, the wave disturbance patterns produced by the OWC arrays also include wave radiation, which is caused by the oscillatory motion of the water-air interface within the OWC chamber. Thus the wave radiation is dependent upon the performance of the OWC itself and thus the level of damping applied to the motion. Results for both optimally damped and over damped OWC arrays have been compared to that of fully reflective obstacles of the same diameter. It has been shown that the mean wave disturbance values are fairly similar to those produced by fully reflective models, particularly for single devices. However the wave field around OWC arrays that are optimally damped shows greater wave disturbance as a result of the combined wave scattering and significant radiation of the OWC models. These plots show that radiated waves from individual devices, as a result of resonance at the natural frequency, combine to form a coherent radiation wave field around the array, consisting of nodes and antinodes. This effect occurs through operation of the OWC at the optimal conditions and is therefore likely to be difficult to avoid in practice; however specific layouts or operational strategies may be adopted to maintain these effects below a critical value. Interestingly the wave disturbance caused by both fully reflective obstacles and heavily over damped OWC models is fairly similar. However there is still a detectable difference, indicating that, however small the power capture from a WEC, it may still be important to model the absorption and radiation behavior of the device rather than just the wave scattering due to the presence of the obstacle in the water column.
For all device types and array configurations, the wave disturbance generally decreases for increased wavelength. This is beneficial in terms of limiting the effect on coastal processes such as sediment transport. Long wavelengths have a greater influence on coastal sedimentary processes, and thus changes to the energy present in these waves could lead to more significant environmental impact. Overall Array Configuration II, a terminator array, demonstrates the least amount of wave disturbance over the majority of wave conditions. This configuration has also emerged as having the best overall performance in terms of power capture [34], indicating that terminator arrays with device spacing greater than the incident wave length may offer the most optimum configuration.
It has been shown that radiated waves account for a significant proportion of the effects on wave climate in particular operating conditions. Previous numerical studies into the impact of WEC arrays on the wave field have looked solely at the effects of reduction of wave energy either over the entire wave spectrum (e.g., in [24]) or tuned to the optimum operating frequency of the device (e.g., in [26]), neglecting to include the effects of radiated waves. The experimental data presented here highlights the importance of accounting for the full extent of the device behaviour when assessing the impact of a particular wave farm on the wave field and consequently on coastal processes. The effects of radiated waves on the wave field are not immediately apparent when considering changes to the entire wave spectrum, nor when observing changes in wave climate due to scattered and radiated waves superimposed together. The results show that radiated waves may account for a significant proportion of the effects on wave climate in particular operating conditions (up to 50% in the near field). Therefore these effects should not be ignored when investigating near field effects of wave farms on wave fields and coastal processes. To enable accurate numerical modelling for investigation of WEC array optimisation, wave climate impact, and effects on coastal processes, further work should include the development of a methodology to represent these interactions in large scale wave propagation models. The data obtained and presented here may be used for validation of such numerical tools, which can, in turn, be expanded to array studies comprising various other WEC concepts, wave farm configurations, site specific wave climates, and bathymetric conditions.

5. Conclusions

The wave field variation around arrays of five Oscillating Water Column WECs has been assessed in multiple configurations experimentally in the Queen’s University Belfast 3D coastal wave basin. The wave field due to wave scattering by arrays of fully reflective cylinders was also measured for comparison. Mapping of the wave climate in a range of frequencies was made possible through high-resolution measurement of surface elevation in the vicinity of the array using a specially designed polychromatic wave packet. The baseline homogeneity of waves within the wave basin was measured and subtracted from the wave field measured around the array, such that the remaining values gave only the wave disturbance, due to the presence/operation of the WEC and any tank effects on the interference pattern. The resulting wave disturbance pattern has been shown to be highly dependent on the array layout, the wavelength to device spacing ratio, and the applied PTO damping.
Furthermore it is shown that the effects of radiated waves due to the operation of the OWC models become more apparent when the scattered wave field, due to the reflective obstacles, was removed from the OWC wave disturbance plots. This demonstrates the importance of representing the device performance characteristics when modeling wave farms, for either the optimisation of array layout for power capture or assessing the impact on wave climate and coastal processes.

Acknowledgments

The authors wish to acknowledge a grant from the Department of Employment and Learning, Northern Ireland facilitated by the Institute for a Sustainable World, Queen’s University Belfast (http://www.qub.ac.uk/sites/isw/) which funded the PhD under which this work was carried out. The authors would particularly like to thank all those who assisted in collecting wave tank data. The authors would also like to thank those who have contributed to the review process and have helped to improve the quality of this paper.

Author Contributions

Louise O’Boyle, Björn Elsäßer and Trevor Whittaker conceived and designed the experiments; Louise O’Boyle performed the experiments with the assistance of colleagues at the Marine Research Group in QUB; Louise O’Boyle analysed the data and wrote the paper with support discussion and reviews from Björn Elsäßer and Trevor Whittaker.

Conflicts of Interest

The authors declare no conflict of interest.

References

  1. Falnes, J. A review of wave-energy extraction. Mar. Struct. 2007, 20, 185–201. [Google Scholar] [CrossRef]
  2. Clément, A.; McCullen, P.; Falcão, A.; Fiorentino, A.; Gardner, F.; Hammarlund, K.; Lemonis, G.; Lewis, T.; Nielsen, K.; Petroncini, S.; et al. Wave energy in Europe: Current status and perspectives. Renew. Sustain. Energy Rev. 2002, 6, 405–431. [Google Scholar] [CrossRef]
  3. De, O.; Falcão, A.F. Wave energy utilization: A review of the technologies. Renew. Sustain. Energy Rev. 2010, 14, 899–918. [Google Scholar]
  4. Uihlein, A.; Magagna, D. Wave and tidal current energy—A review of the current state of research beyond technology. Renew. Sustain. Energy Rev. 2016, 58, 1070–1081. [Google Scholar] [CrossRef]
  5. O’Boyle, L.; Doherty, K.; van’t Hoff, J.; Skelton, J. The Value of Full Scale Prototype Data—Testing Oyster 800 at EMEC, Orkney. In Proceedings of the 11th European Wave and Tidal Energy Conference (EWTEC), Nantes, France, 6–11 September 2015; pp. 1–10.
  6. Yemm, R.; Pizer, D.; Retzler, C.; Henderson, R. Pelamis: Experience from concept to connection. Philos. Trans. R. Soc. A Math. Phys. Eng. Sci. 2012, 370, 365–380. [Google Scholar] [CrossRef] [PubMed]
  7. Fiévez, J.; Sawyer, T. Lessons Learned from Building and Operating a Grid Connected Wave Energy Plant. In Proceedings of the 11th European Wave and Tidal Energy Conference (EWTEC), Nantes, France, 6–11 September 2015; pp. 4–9.
  8. Folley, M. Numerical Modelling of Wave Energy Converters. State-of-the-Art Techniques for Single Devices and Arrays, 1st ed.; Elsevier: Amsterdam, The Netherlands, 2016. [Google Scholar]
  9. Zanuttigh, B.; Angelelli, E. Experimental investigation of floatingwave energy converters for coastal protection purpose. Coast. Eng. 2012, 80, 148–159. [Google Scholar] [CrossRef]
  10. Stratigaki, V.; Troch, P.; Stallard, T.; Forehand, D.; Kofoed, J.P. Modelling of wave attenuation induced by multi-purpose floating structures used for power supply and coastal protection. Coast. Eng. Proc. 2014. [Google Scholar] [CrossRef]
  11. Abanades, J.; Greaves, D.; Iglesias, G. Coastal defence using wave farms: The role of farm-to-coast distance. Renew. Energy 2015, 75, 572–582. [Google Scholar] [CrossRef]
  12. Fitzgerald, C.; Thomas, G. A preliminary study on the optimal formation of an array of wave power devices. In Proceedings of the 7th European Wave and Tidal Energy Conference, Porto, Portugal, 11–14 September 2007.
  13. Child, B.F.M.; Venugopal, V. Optimal configurations of wave energy device arrays. Ocean Eng. 2010, 37, 1402–1417. [Google Scholar] [CrossRef]
  14. Borgarino, B.; Ferrant, P.; Mecanique, L. De, Impact of the separating distance between interacting wave energy converters on the overall energy extraction of an array. In Proceedings of the 9th European Wave and Tidal Energy Conference, Southampton, UK, 5–9 September 2011.
  15. Babarit, A. On the park effect in arrays of oscillating wave energy converters. Renew. Energy 2013, 58, 68–78. [Google Scholar] [CrossRef]
  16. Renzi, E.; Dias, F. Relations for a periodic array of flap-type wave energy converters. Appl. Ocean Res. 2013, 39, 31–39. [Google Scholar] [CrossRef] [Green Version]
  17. Folley, M.; Mendes, L.; Fortes, C.J.; Brito-Melob, A.; Sarmento, A. A Review of Numerical Modelling of Wave Energy Converter Arrays. In Proceedings of the ASME 31st International Conference on Ocean, Offshore and Artic Engineering, Rio de Janeiro, Brazil, 1–6 July 2012.
  18. Venugopal, V.; Smith, G.H. Wave climate investigation for an array of wave power devices. In Proceedings of the 7th European Wave and Tidal Energy Conference, Porto, Portugal, 11–14 September 2007; pp. 1–10.
  19. Vidal, C.; Méndez, F.J.; Díaz, G.; Legaz, R. Impact of Santoña WEC installation on the littoral processes. In Proceedings of the 7th European Wave and Tidal Energy Conference, Porto, Portugal, 11–14 September 2007; pp. 1–7.
  20. Palha, A.; Mendes, L.; Fortes, C.J.; Brito-Melo, A.; Sarmento, A. The impact of wave energy farms in the shoreline wave climate: Portuguese pilot zone case study using Pelamis energy wave devices. Renew. Energy 2010, 35, 62–77. [Google Scholar] [CrossRef]
  21. Le Crom, I.; Sarmento, A. Maritime Portuguese Pilot Zone for Wave Energy Conversion: Modelling Analysis of the Impact on Surfing Conditions. In Proceedings pf the 2nd International Conference on Ocean Energy (ICOE), Brest, France, 15–17 October 2008.
  22. Troch, P.; Beels, C.; De Rouck, J.; De Backer, G. Wake Effects Behind a Farm of Wave Energy Converters for Irregular Long-Crested Waves. In Proceedings of the 32nd International Conference on Coastal Engineering, Shanghai, China, 30 June–5 July 2010; pp. 1–15.
  23. Beels, C.; Troch, P.; De Visch, K.; Kofoed, J.P.; De Backer, G. Application of the time-dependent mild-slope equations for the simulation of wake effects in the lee of a farm of Wave Dragon wave energy converters. Renew. Energy 2010, 35, 1644–1661. [Google Scholar] [CrossRef]
  24. Millar, D.L.; Smith, H.C.M.; Reeve, D.E. Modelling analysis of the sensitivity of shoreline change to a wave farm. Ocean Eng. 2007, 34, 884–901. [Google Scholar] [CrossRef]
  25. Smith, H.C.M.; Millar, D.L.; Reeve, D.E. Generalisation of wave farm impact assessment on inshore wave climate. In Proceedings of the 7th European Wave and Tidal Energy Conference, Porto, Portugal, 11–14 September 2007; pp. 1–7.
  26. Alexandre, A.; Stallard, T.J.; Stansby, P.K. Transformation of Wave Spectra across a Line of Wave Devices. In Proceedings of the 8th European Wave and Tidal Energy Conference, Uppsala, Sweden, 7–10 September 2009; pp. 1–9.
  27. Silverthorne, K.E.; Folley, M. A New Numerical Representation of Wave Energy Converters in a Spectral Wave Model. In Proceedings of the 9th European Wave and Tidal Energy Conference, Southampton, UK, 5–9 September 2011.
  28. Chang, G.; Ruehl, K.; Jones, C.A.; Roberts, J.; Chartrand, C. Numerical modeling of the effects of wave energy converter characteristics on nearshore wave conditions. Renew. Energy 2016, 89, 636–648. [Google Scholar] [CrossRef]
  29. Ashton, I.G.C.; Johanning, L.; Linfoot, B. Measurement of the effect of power absorption in the lee of a WEC. In Proceedings of the 28th International Conference on Ocean, Offshore and Arctic Engineering, Honolulu, HI, USA, 31 May–5 June 2009; pp. 1–10.
  30. Tseng, R.S.; Wu, R.H.; Huang, C.C. Model study of a shoreline wave-power system. Ocean Eng. 2000, 27, 801–821. [Google Scholar] [CrossRef]
  31. Viviano, A.; Naty, S.; Foti, E.; Bruce, T.; Allsop, W.; Vicinanza, D. Large-scale experiments on the behaviour of a generalised Oscillating Water Column under random waves. Renew. Energy 2016, 99, 875–887. [Google Scholar] [CrossRef]
  32. Ashlin, J.S.; Sundar, V.; Sannasiraj, S.A. Effects of bottom profile of an oscillating water column device on its hydrodynamic characteristics. Renew. Energy 2016, 96, 341–353. [Google Scholar] [CrossRef]
  33. Haller, M.C.; Porter, A.; Lenee-bluhm, P.; Rhinefrank, K.; Hammagren, E. Laboratory Observations of Waves in the Vicinity of WEC-Arrays. In Proceedings of the 9th European Wave and Tidal Energy Conference, Southampton, UK, 5–9 September 2011; pp. 3–9.
  34. O’Boyle, L. Wave Fields around Wave Energy Converter Arrays. Ph.D. Thesis, Queen’s University Belfast, Belfast, UK, 2013. [Google Scholar]
  35. O’Boyle, L.; Elsaesser, B.; Whittaker, T. Methods to Enhance the Performance of a 3D Coastal Wave Basin. Ocean Eng. 2016. submitted. [Google Scholar]
  36. Falcão, A.F.O.; Henriques, J.C.C. Oscillating-water-column wave energy converters and air turbines: A review. Renew. Energy 2016, 85, 1391–1424. [Google Scholar] [CrossRef]
  37. Whittaker, T.J.T. A Hydrodynamic Study of Wave Energy Converters with Particular Reference to Oscillating Water Columns. Ph.D. Thesis, Queen’s University Belfast, Belfast, UK, 1981. [Google Scholar]
  38. Lamont-Kane, P. Physical and Numerical Modelling of Wave Energy Converter Arrays. Ph.D. Thesis, Queen’s University Belfast, Belfast, UK, 2015. [Google Scholar]
  39. Sheng, W.; Alcorn, R.; Lewis, A. On thermodynamics in the primary power conversion of oscillating water column wave energy converters. J. Renew. Sustain. Energy 2013, 5. [Google Scholar] [CrossRef]
  40. Rogers, D.; Bolton King, G. Wave Generation Using Ocean and Wave; Edinburgh Designs Ltd.: Edinburgh, UK, 1997. [Google Scholar]
  41. O’Boyle, L.; Elsaesser, B.; Folley, M.; Whittaker, T. Assessment of Wave Basin Homogeneity for Wave Energy Converter Array Studies. In Proceedings of the 9th European Wave and Tidal Energy Conference, Southampton, UK, 5–9 September 2011.
  42. Band, Y.B. Light and Matter. Electromagnetism, Optics, Spectroscopy and Lasers; John Wiley & Sons Ltd.: Chichester, UK, 2006. [Google Scholar]
Figure 1. Fully Reflective Obstacle (left) and Oscillating Water Column model (right).
Sustainability 09 00070 g001
Figure 2. Photograph showing orifice plate at the top of the Oscillating Water Column model.
Sustainability 09 00070 g002
Figure 3. Polychromatic wave demand wave spectrum and typical surface elevation time trace.
Sustainability 09 00070 g003
Figure 4. Array Layouts: Solid hatching indicates position of single obstacle when tested individually.
Sustainability 09 00070 g004
Figure 5. Plan view of QUB Portaferry wave basin showing the area mapped by the wave probes and the location of the wave paddles, curved transition panels and the back and side beaches. The positions of the OWC models are indicated for array configurations I–IV (positions indicated with open and hatched circles as shown in Figure 4). Dimensions are in metres.
Sustainability 09 00070 g005
Figure 6. Photograph of QUB Portaferry wave basin showing the experimental set-up and position of the wave paddles, absorbing side beach, curved transition panel, overhead gantry, and OWC models in Array Configuration IV.
Sustainability 09 00070 g006
Figure 7. Wave disturbance (μ(f)) caused by fully reflective obstacles in array configuration I (device spacing = 1.25 m).
Sustainability 09 00070 g007
Figure 8. Wave disturbance (μ(f)) caused by fully reflective obstacles in array configuration II (device spacing = 1.25 m).
Sustainability 09 00070 g008
Figure 9. Variation in normalised mean wave disturbance ( μ ¯ ^ ) with the wavelength to spacing ratio for each array configuration. Results are presented for fully reflective obstacles and Oscillating Water Column (OWC) devices with different levels of applied damping.
Sustainability 09 00070 g009
Figure 10. Wave disturbance due to wave radiation for over damped OWC models in Array Configuration IV.
Sustainability 09 00070 g010
Figure 11. Wave disturbance due to wave radiation for optimally damped OWC models in Array Configuration IV.
Sustainability 09 00070 g011
Table 1. Properties of each wave component in the wave packet showing ratios of wavelength (λ) to device spacing and diameter, where S is the device spacing (m) and D is the device diameter (m). Water Depth = 550 mm.
f (Hz)λ (m) a d e m a n d (mm)λ/Sλ/D
0.7342.55210
0.8901.95--
0.9221.7551.47
1.0001.535--
1.1091.25515
1.18751.105--
1.2501.0050.84

