1. Introduction
In order to optimize the internal combustion engine efficiency, different authors suggest the combination of gasoline–ethanol addition into the internal combustion engine. According to the works presented in [
1,
2,
3,
4], when gasoline–ethanol blends are used, it is important to estimate the concentration of ethanol content in the blend, in order to maintain the air–fuel ratio (AFR) and increase the combustion efficiency of the internal combustion (IC) engines. The authors in [
5] remarked that increasing the concentration of gasoline–ethanol blend leads to a fuel octane number increase. This allows an increment of the compression ratio in the IC engine in such a way that it can achieve a higher engine energy efficiency.
The authors in [
6] used the addition of hydrogen because the combustion speed of the gasoline enriched with this gas is higher than the pure gasoline. Therefore, the combustion efficiency increases significantly, so a higher thermodynamic efficiency is reached. In this work, the authors showed a significant reduction of bsfc (brake specific fuel consumption), between approximately 10% to
, by using hydrogen-enriched gasoline for a hydrogen to fuel mass ratio of 2% to
. According to the authors in [
6,
7], the addition of hydrogen into an internal combustion engine is feasible due to the high laminar speed flame and high energy content characteristics of the hydrogen. These characteristics improve the thermal efficiency and engine performance and considerably reduce the emission of gases such as CO, CO
, HC and NO
.
In relation to hydrogen production, different authors [
6,
7,
8,
9,
10] showed that it is possible to produce hydrogen employing different techniques from hydrocarbons, for example: steam reforming, partial oxidation, and exhaust gas fuel reforming on-board. However, the above techniques produce high levels of CO and CO
.
Other investigation works are focused on the production of hydrogen gas on board by using the renewable energy through the water electrolysis [
11,
12]. The characteristic of these works is that all report a constant amount of hydrogen produced that is added to the engine. The reported results showed an increment in the engine efficiency, a decrement of the pollutant gases, and a reduction in the gasoline consumption.
The use of hydrogen to feed IC engines has environmental and economic advantages as is shown in the works presented by different authors [
13,
14,
15,
16,
17]. On the one hand, different authors [
16,
17] have reported that, by using hydrogen, the CO and CO
in the exhaust gas emissions decrease. In relation to the NO
exhaust gas emissions, there are some experimental results in [
14,
15] where the authors made tests using a gasoline–hydrogen blend. They reported an increase of the NO
in the exhaust gas emissions. In [
18], the authors used an ethanol–hydrogen blend, and the results reported showed an increase of the NO
in the exhaust gas emissions. Furthermore, they reported that the NO
increased as the percentage of hydrogen addition increased.
In this work, a fuel control scheme is developed in order to regulate the hydrogen production on demand and control the air–fuel (hydrogen-enriched-E10) ratio.
2. Methodology to Design the Control Scheme
In order to perform the fuel control scheme in an IC engine, dynamic and thermodynamic engine models were developed. In the first analysis, pure gasoline as the injected fuel is considered. The model equations were then parameterized using experimental measures and real equipment dimension. A second analysis was developed using gasoline–ethanol blend (E10) as the injected fuel and hydrogen as an additive.
Afterwards, a hydrogen production model was integrated using the proposed theory by [
19], where the hydrogen production is described from the alkaline water electrolysis in an electrolytic reactor. The electrolysis process of the water was chosen because it requires low instrumentation for its implementation, high resistance to corrosion, and a long useful life. In addition, the hydrogen produced has a purity greater than 98%. Compared with the reformed process, the water electrolysis does not require high temperatures (60
C–80
C). The reformed process requires high temperatures between 800
C and 1000
C, and much more instrumentation.
Finally, the main control loops were established: air–fuel hydrogen-enriched-E10 stoichiometric ratio control and hydrogen on demand production control.
Table 1 shows the IC engine parameters that were obtained from a NISSAN IC engine (Cuernavaca, Mor., Mexico).
Once the proposed methodology is finished, the control scheme will be tested in a simulation in order to prove that with the hydrogen addition in an E10 blend, it is possible reduce the gasoline consumption without IC engine power loss.
3. Internal Combustion Engine Model
In the last few decades, the internal combustion engine dynamic modeling has been widely researched in order to improve the engine performance and reach the highest fuel efficiency. In this research, a theory proposed by different authors was used [
20,
21,
22] about IC engine modeling in order to develop a control scheme for gasoline–ethanol blend.
In order to carry out the IC engine simulations, the following assumptions were made:
- (1)
The fuel gas composition into the cylinder is known in the instant when the valves are closing before the compression process begins. The air–fuel mixture and the exhaust gas amount in the cylinder are known.
- (2)
The gas into the cylinder before the compression and after the combustion is considered an ideal gas.
- (3)
The compression process is considered isentropic (adiabatic and reversible).
- (4)
Because the cylinder is a closed system, the mass is considered constant.
- (5)
The shape of the flame front is assumed to be spherical.
- (6)
The ignition angle is considered optimal.
3.1. Fuel Injection
According to the authors in [
23,
24], the injected fuel (
) has two components: the fuel film flow introduced to the cylinder as a liquid
and the steam
. Thus, the overall flow entering the combustion chamber is given in Equation (
3), which is not measured. The dynamic of the fuel injection is given in the following equations:
where the term
is the mass fuel rate deposited in the intake as a fuel film, and
is the boiling time constant.
3.2. Air Flow Dynamic
Throttle Valve
The problem of modeling the air flow dynamic is solved considering the air flow as a fluid passing through an orifice that has a section reduction (reduction due to the throttle valve) [
21], so the expression that represents the air flow rate passing through the throttle valve is:
Equation (
6) represents the mass air flow rate induced into the cylinder [
25,
26]:
where
V is the cylinder displacement volume (
) and
is the cylinder volumetric efficiency Equation (
7).
In [
26], the author considers the inclusion of
in Equation (
7) because a linear dependency is not enough to approximate the cylinder volumetric efficiency:
3.3. Intake Manifold Pressure and Temperature
Equations (
8) and (
9) represent the intake manifold pressure and the intake manifold temperature, respectively [
22,
23,
25]:
where
,
and
represent pressure, temperature and volume in the intake manifold. The mass air flow rate through the throttle valve to the intake manifold is denoted by
, and the inlet mass air flow rate to the cylinders from the intake manifold is denoted by
.
3.4. Forces Acting on the Crankshaft Drive
The indicated work per engine cycle is the sum of all the forces acting on the crankshaft drive by the pistons [
22]:
In order to determine the network with the addition of multiple fuels, the mathematical model of the engine should consider the influence of the percentage of ethanol and hydrogen in the mixture. According to the authors in [
27,
28], when a mixture of ethanol and gasoline is used, the lower heating value (LHV) tends to decrease as the ethanol of the mixture increases.
The thermal efficiency is the fraction of usable gasoline energy to produce mechanical work. According to [
20], it is not possible to find a model that determines the value of
, but its value can be approximated due to its dependency on
, considering the ignition angle optimum:
3.5. Air–Fuel Ratio
If hydrogen is added to the E10 blend (gasoline–ethanol blend), then the AFR needs to be modified. Hence, it is proposed to use Equation (
23) to determine the air–fuel ratio when using the fuel mixture (gasoline–ethanol–hydrogen):
where
is the calculated fraction of hydrogen supplied to the blend and
is the ethanol fraction contained in the gasoline–ethanol blend. Thus, the lambda factor is an important factor that indicates if the combustion was carried out completely, shown in Equation (
24), which determines the leanness or richness of the blend:
where
for the E10 blend and
for hydrogen.
3.6. Electrolytic Cell Model
The water electrolysis consists of a reaction of oxi-reduction induced by the application of electric current, which generates the decomposition of the water into the H and O molecules. Water electrolysis is one of the cleanest procedures for obtaining hydrogen.
The overall reaction for the water breakdown is:
The following assumptions are considered for the reaction of the water dissociation:
- *
Hydrogen and oxygen are ideal gases.
- *
Water is an incompressible fluid.
- *
Liquid and solid phases are separate.
In standard conditions, water dissociation is an non-spontaneous reaction, and the standard Gibbs free energy is kJ/mol.
To induce the reaction, a minimum voltage is required, also called reversible voltage, which corresponds to 1.23 V per cell in standard conditions. For this work, the electrolyzer was designed to have 15 cells connected in series, so the corresponding minimum theoretical voltage is .
In practice, the required voltage for the cell is higher than the reversible voltage due to the overvoltage. Thus, the required voltage for the cell can be defined as:
The reversible voltage is denoted by and the irreversible overvoltage is denoted by , where the irreversible voltage is formed by the activation overvoltage and the ohmic overvoltage. The activation overvoltage is generated by the electrochemical kinetics, which mainly depends on the temperature, the electrode properties and the composition of the solution. The ohmic overvoltage is generated by the electric resistances of the solution compounds, the resistance of the electrolyte, and the resistance of the bubbles, among others.
With the purpose of modeling the dependency of the overvoltage on the temperature, Equation (
26) was modified as follows [
19]:
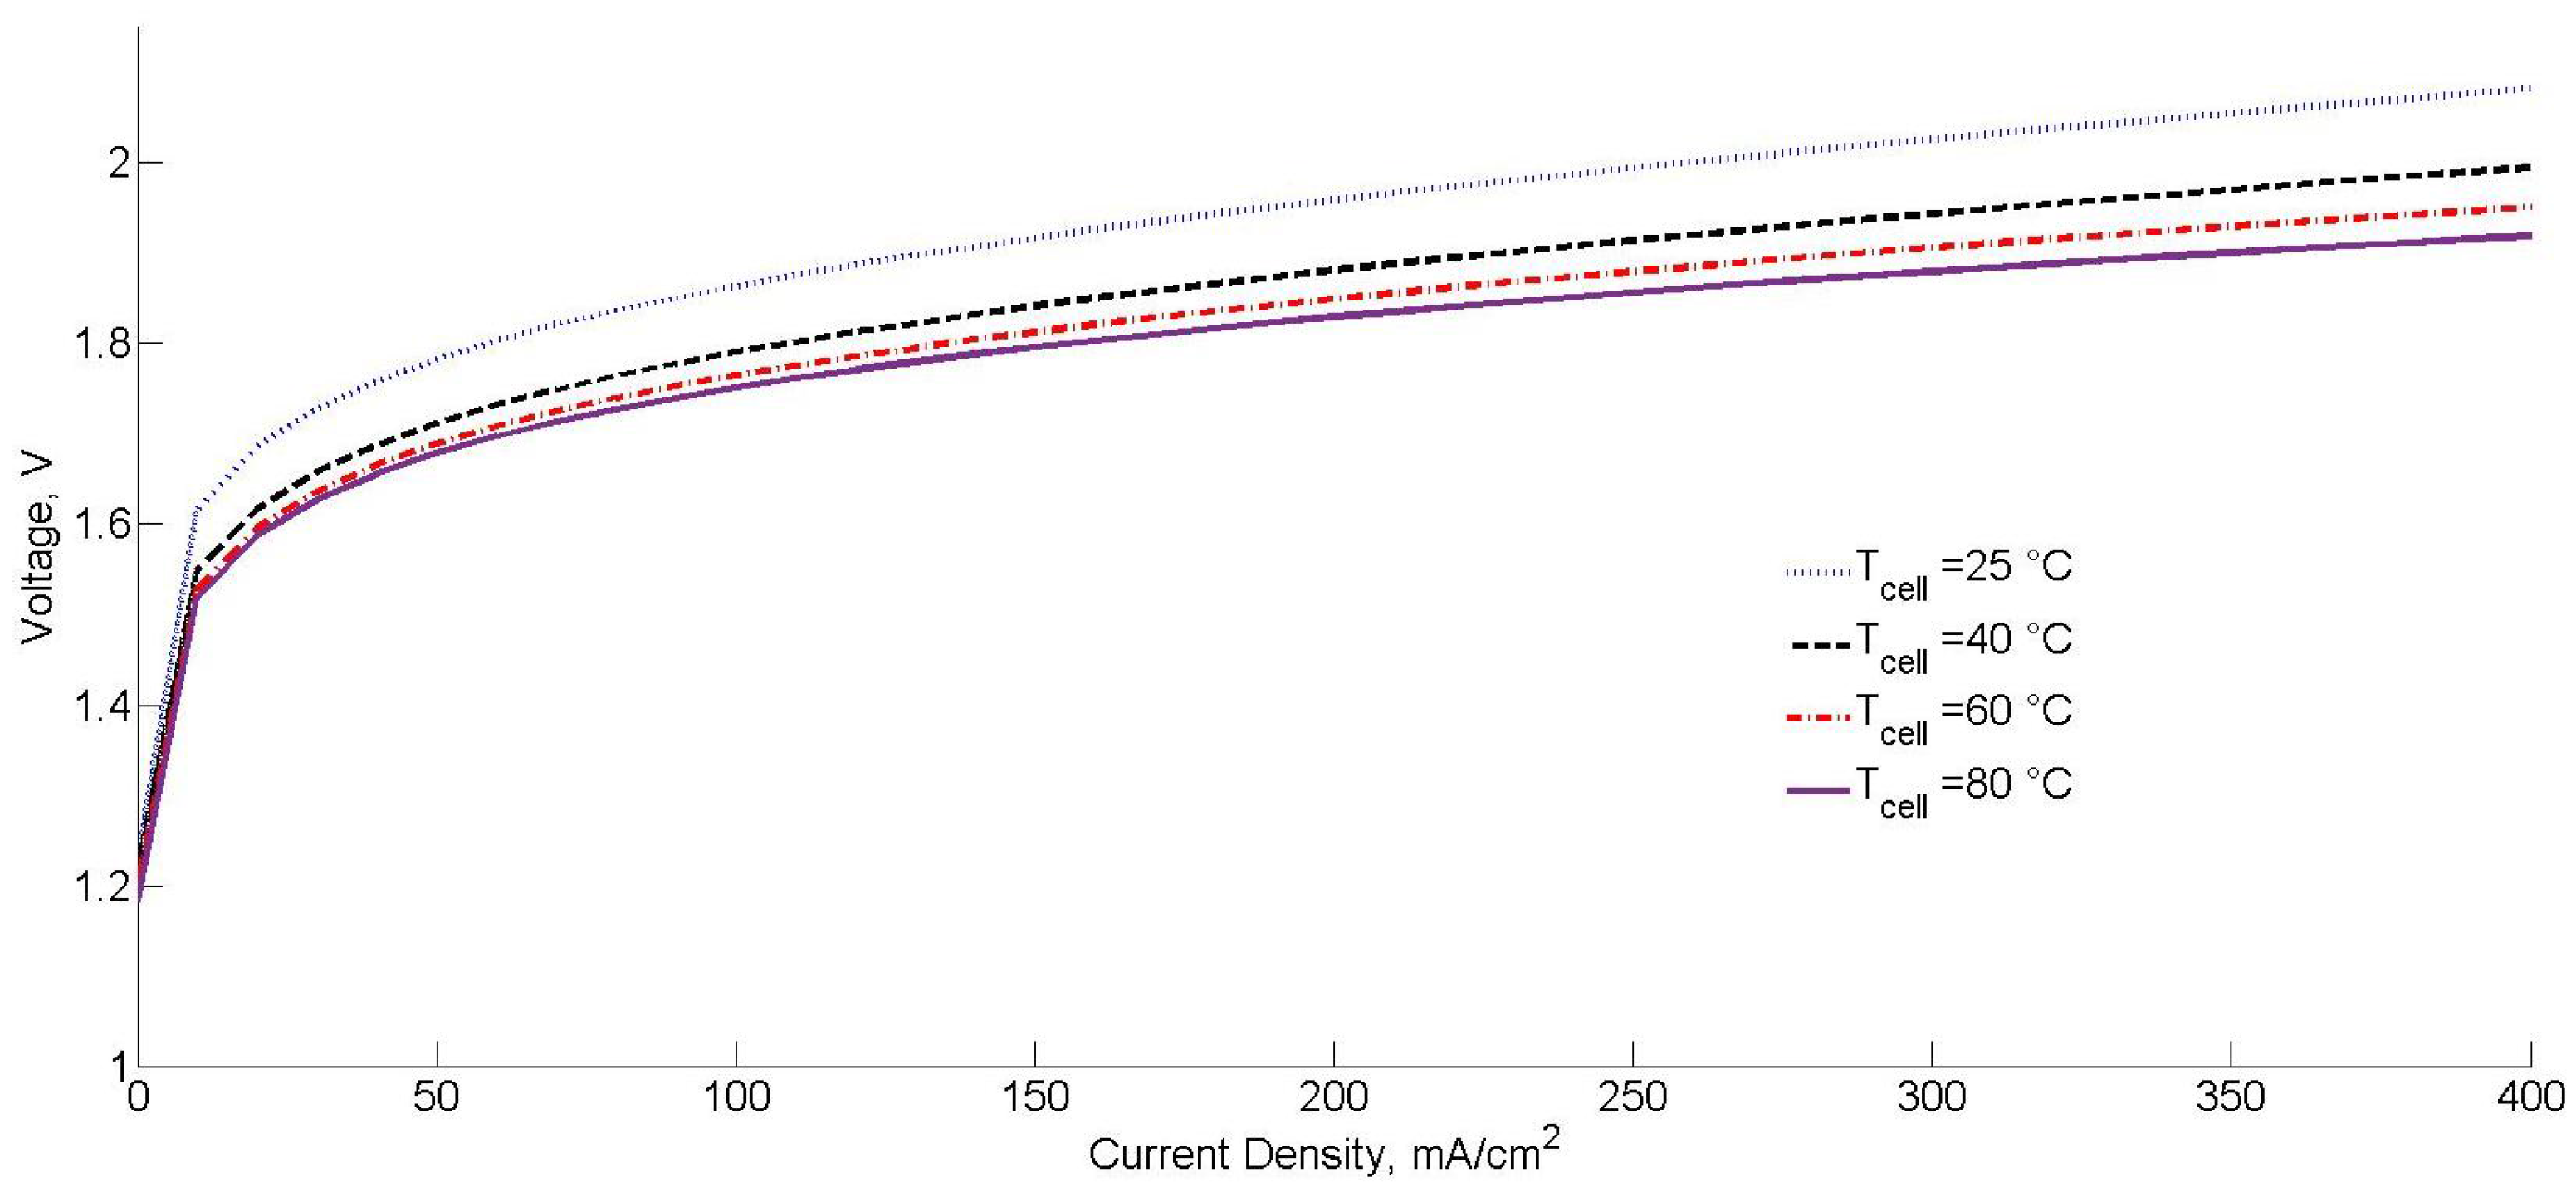
In
Figure 1, the cell voltage Equation (
27) versus the current density at different operating temperatures is shown. As it can be seen, at higher temperatures, the required cell voltage for the splitting of water is lower. This is mainly due to the dependency of the overvoltage on the temperature. Therefore, it is convenient to work at higher temperatures, without impairing the conductivity of the electrolyte. In this work, it is intended to operate the electrolyzer’s temperature at 80
C.
According to Faraday’s law, the hydrogen production rate in a cell is directly proportional to the electrical current supplied. The Faraday efficiency, also known as the conversion efficiency of the electrolyzer, is defined as the ratio between the actual amount of hydrogen produced in the electrolyzer and the theoretical maximum amount of hydrogen produced in the electrolyzer [
29]. For simulation purposes, the theoretical flow used was unique. Therefore, the total hydrogen production rate in an electrolyzer depends on the number of cells connected in series, which can be calculated by:
where
.
4. Control Strategy
According to [
28], the E10 blend has a lower heating value between
and 41 MJ/kg. In order to compensate the lower heating value in an IC engine fueled by E10 blend, it is possible to use the 7% of mass of hydrogen as an additive.
For the combustion of the hydrogen-enriched E10 blend in the IC engine,
of the mass flow of the intake air reacts with the hydrogen and the other
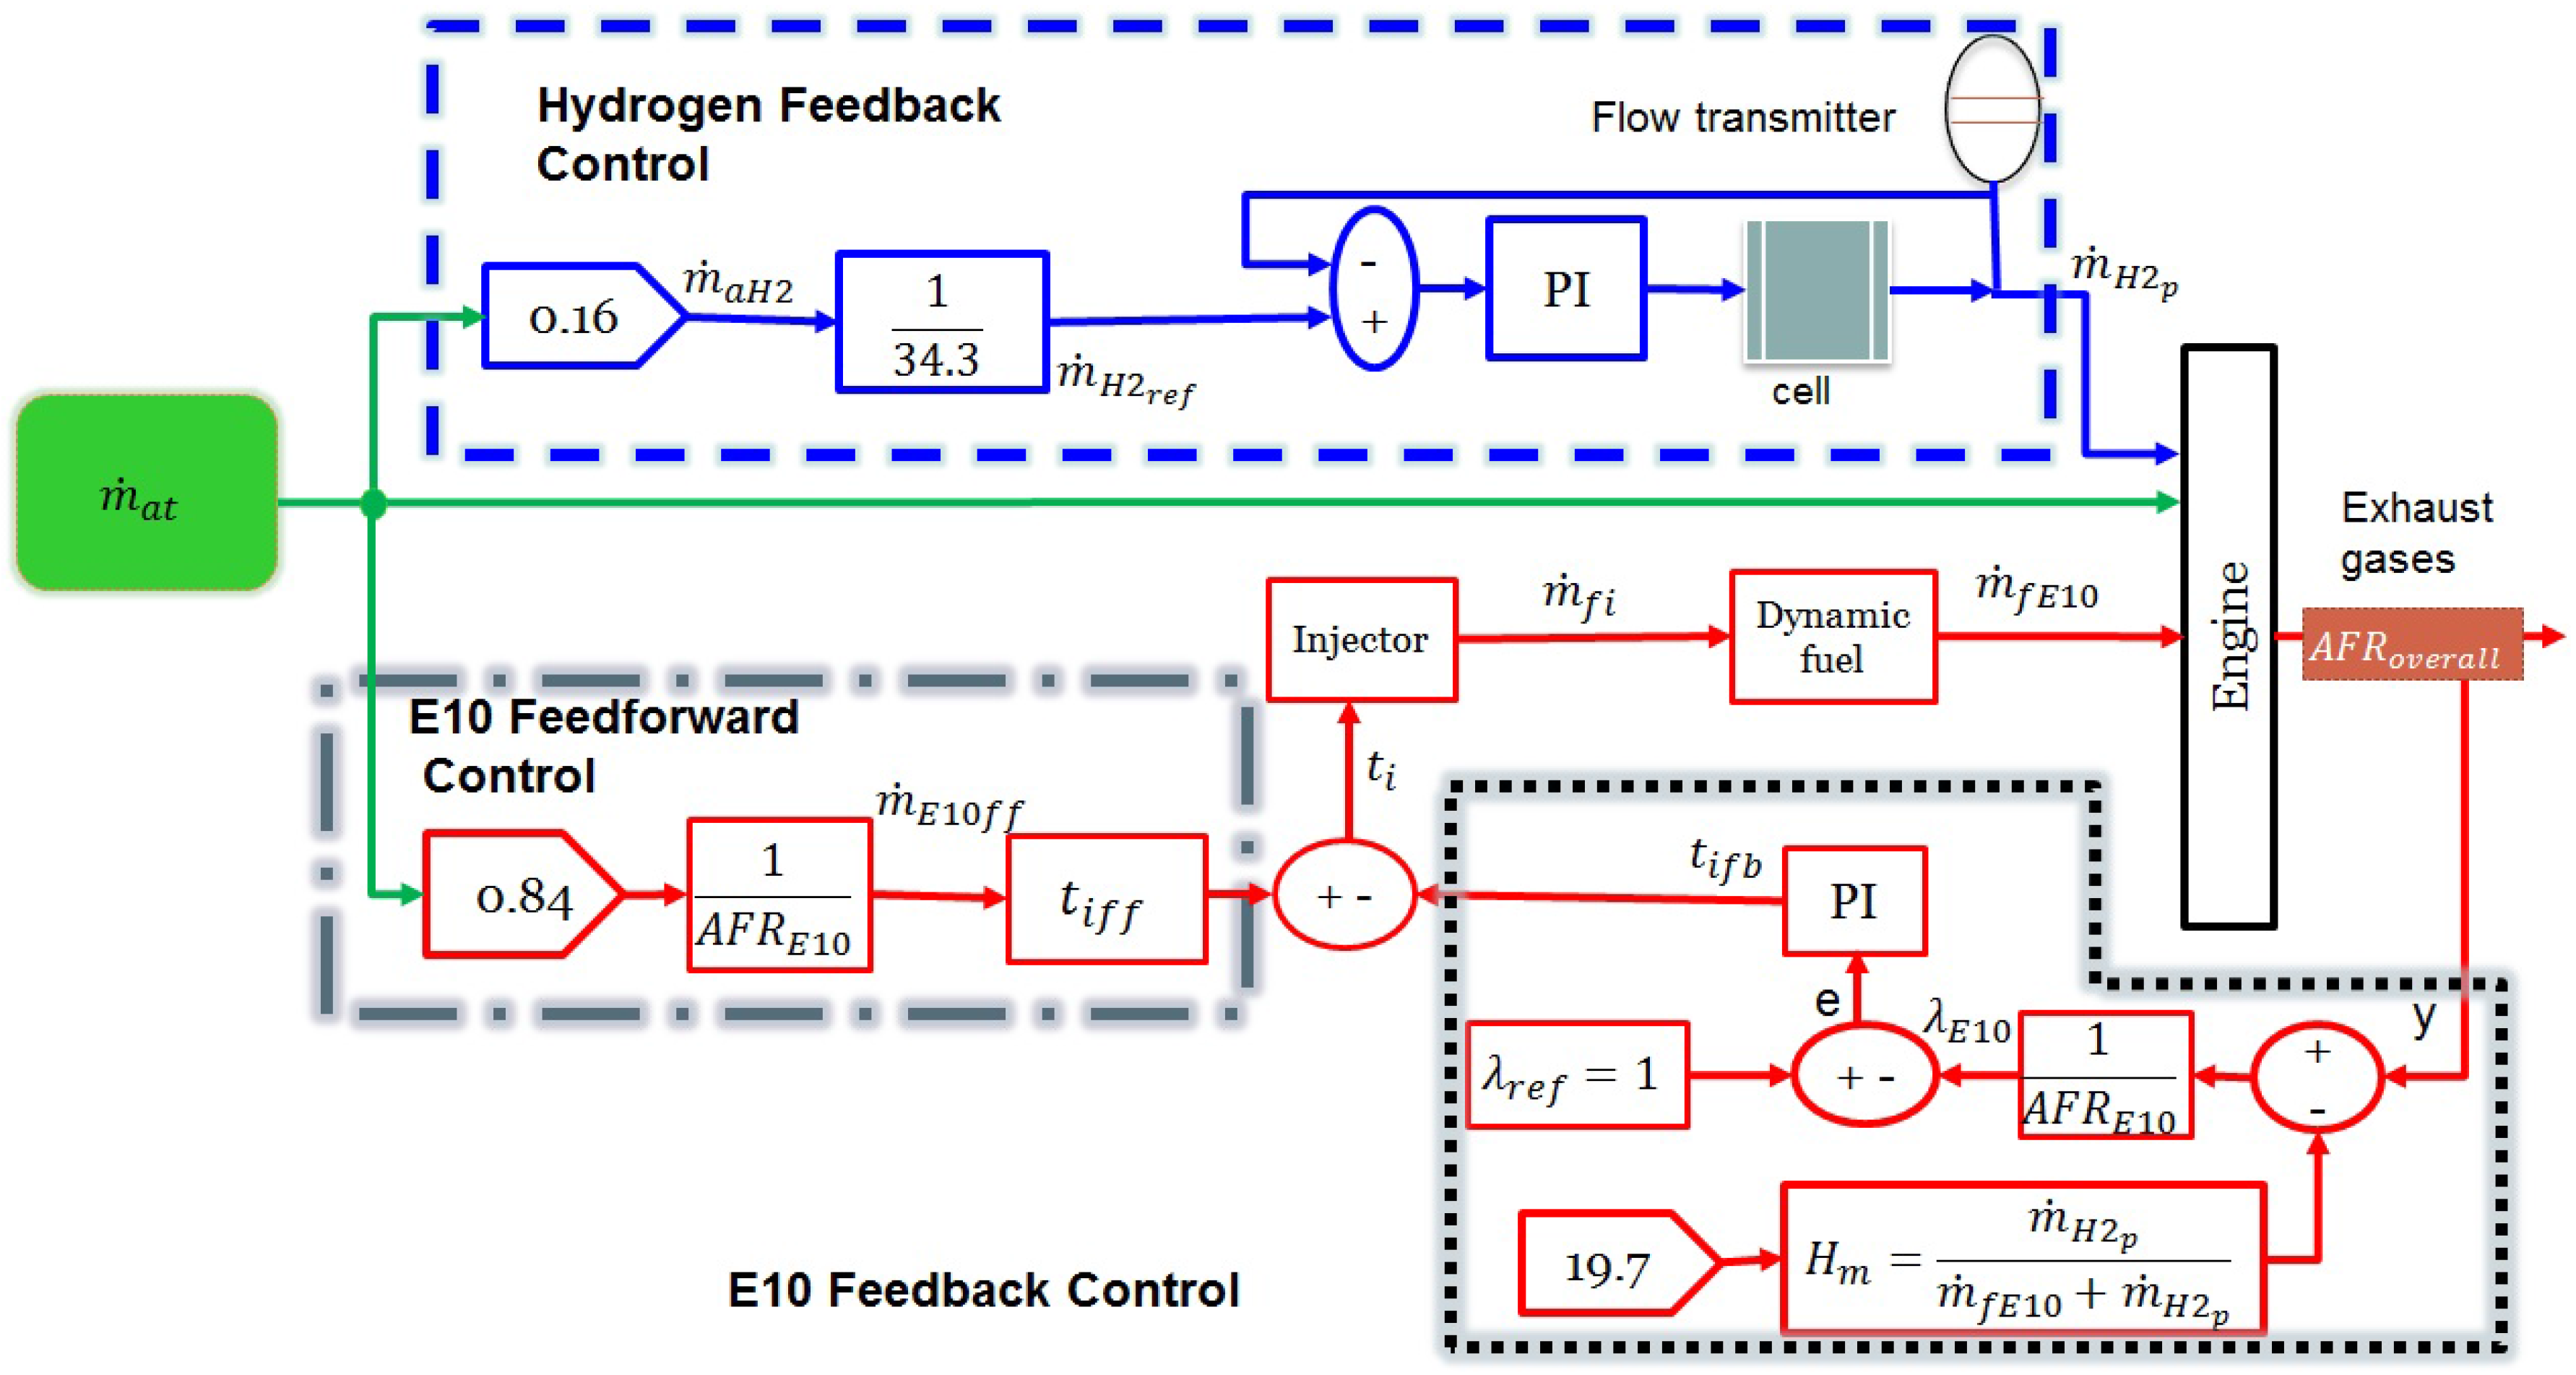
of the mass flow reacts with the E10 blend. In order to control the production of the hydrogen on demand in this work, a control scheme is proposed (
Figure 2).
Figure 2 shows the control scheme for the hydrogen-enriched E10 blend. For the hydrogen production control, a feedback P.I. control (blue dashed line) was introduced, which is responsible for generating a pulse-width modulation (PWM) with the purpose of manipulating the current fed to the electrolyzer. The reference signal for this controller is the hydrogen mass calculated by a stoichiometric balance considering that
of the mass flow fraction of the intake air reacts with the hydrogen. In order to control the injection of the E10 blend, a feedforward controller and a feedback controller were used. On the one hand, the purpose of the feedforward controller (on the left-hand side of
Figure 2) is to estimate the opening time injection based on the mass flow rate only for
of air, such that the stoichiometric ratio for the E10 blend (
) has to be satisfied (
). On the other hand, the purpose of the feedback controller (on the right-hand side of
Figure 2) is to adjust the fueled flow of the E10 blend. Therefore, the oxygen sensor (UEGO) provides the overall air–fuel ratio (
) of three compounds of the blend (gasoline–ethanol–hydrogen), and it is necessary to subtract the oxygen fraction corresponding to the hydrogen AFR (
) in order to obtain the
corresponding to the E10 blend so that the factor lambda can be calculated (
).
An advantage of the proposed control scheme to fuel a gasoline–ethanol blend with hydrogen as an additive in an IC engine is that, for its implementation, the IC engine will not require modifications. It is only necessary to install an electrolyzer in the vehicle and modify the computer’s control law in order to establish the correct dosage of gasoline–ethanol blend. The effects of the hydrogen and ethanol used in the IC engine are not significant because the concentrations of these are low, so no additional maintenance will be required. The purpose of the hydrogen-enriched E10 blend control scheme design (showed in
Figure 2) is to develop a simulation analysis for future implementation of this scheme in an experimental IC engine.
5. Results
For simulation purposes, a 1.6 L and 78 kW IC engine is considered. The IC engine parameters were shown previously in
Table 1. The electrolyzer parameters are the following: dry cell with stainless steel electrodes of 316 L, comprising a total area of 0.032 cm
per electrode composed of 15 cells with circulating water between the electrolyte (KOH) at 30% in wt. For this work, it is assumed that an additional battery supplies the current to the electrolyzer, the maximum current-fed to the electrolyzer was 50 A and the electrolyzer temperature was operated at 80
C.
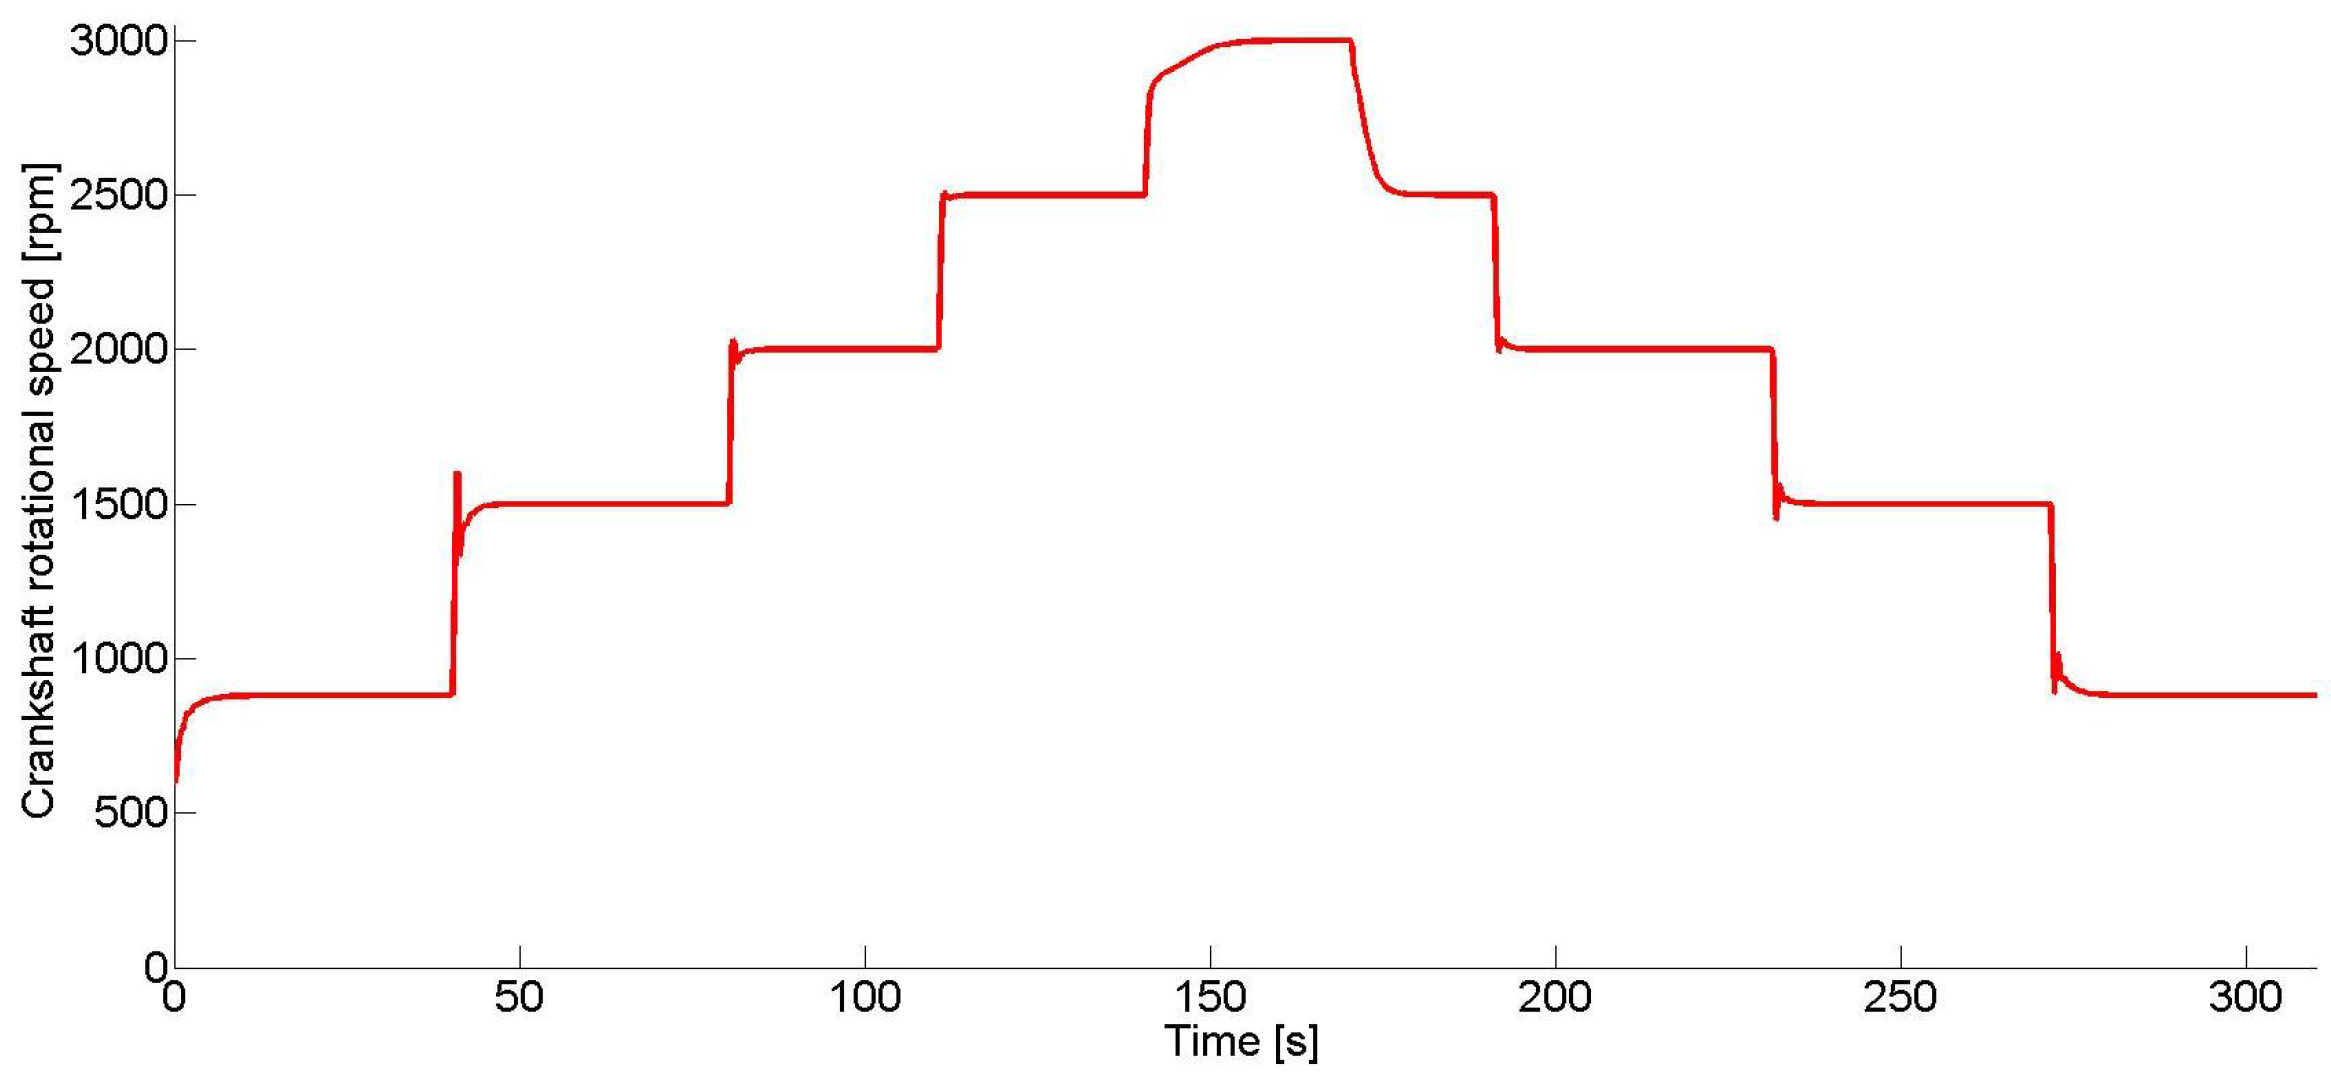
In
Figure 3, the IC engine crankshaft speed, at which the proposed control scheme was tested, is shown. The test was made for 300 s changing the crankshaft speed between 870 and 3000 rpm, in order to show the control performance under different operating points.
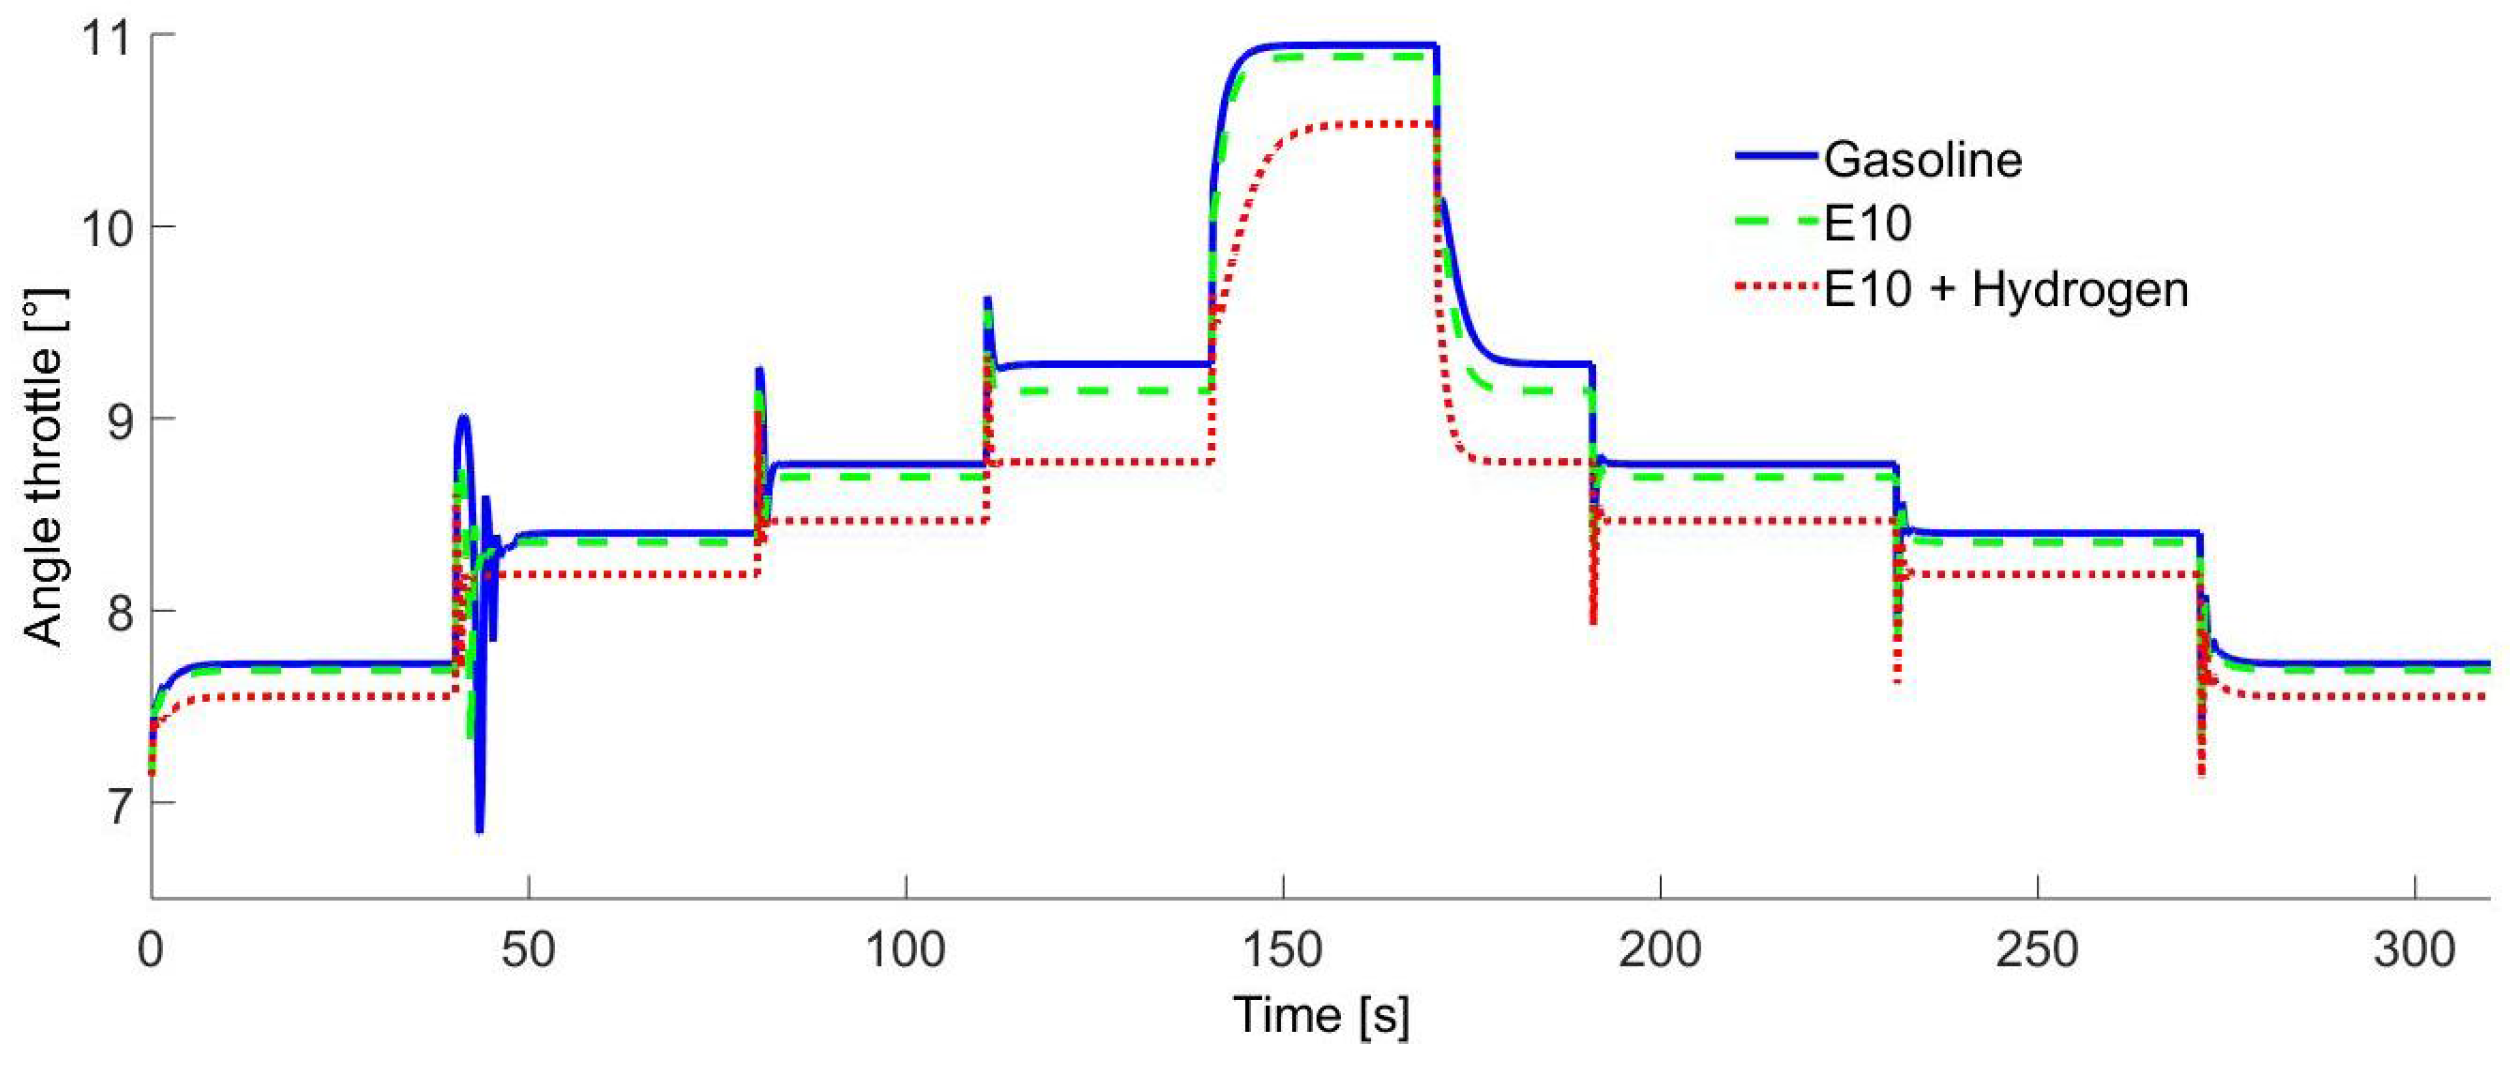
In
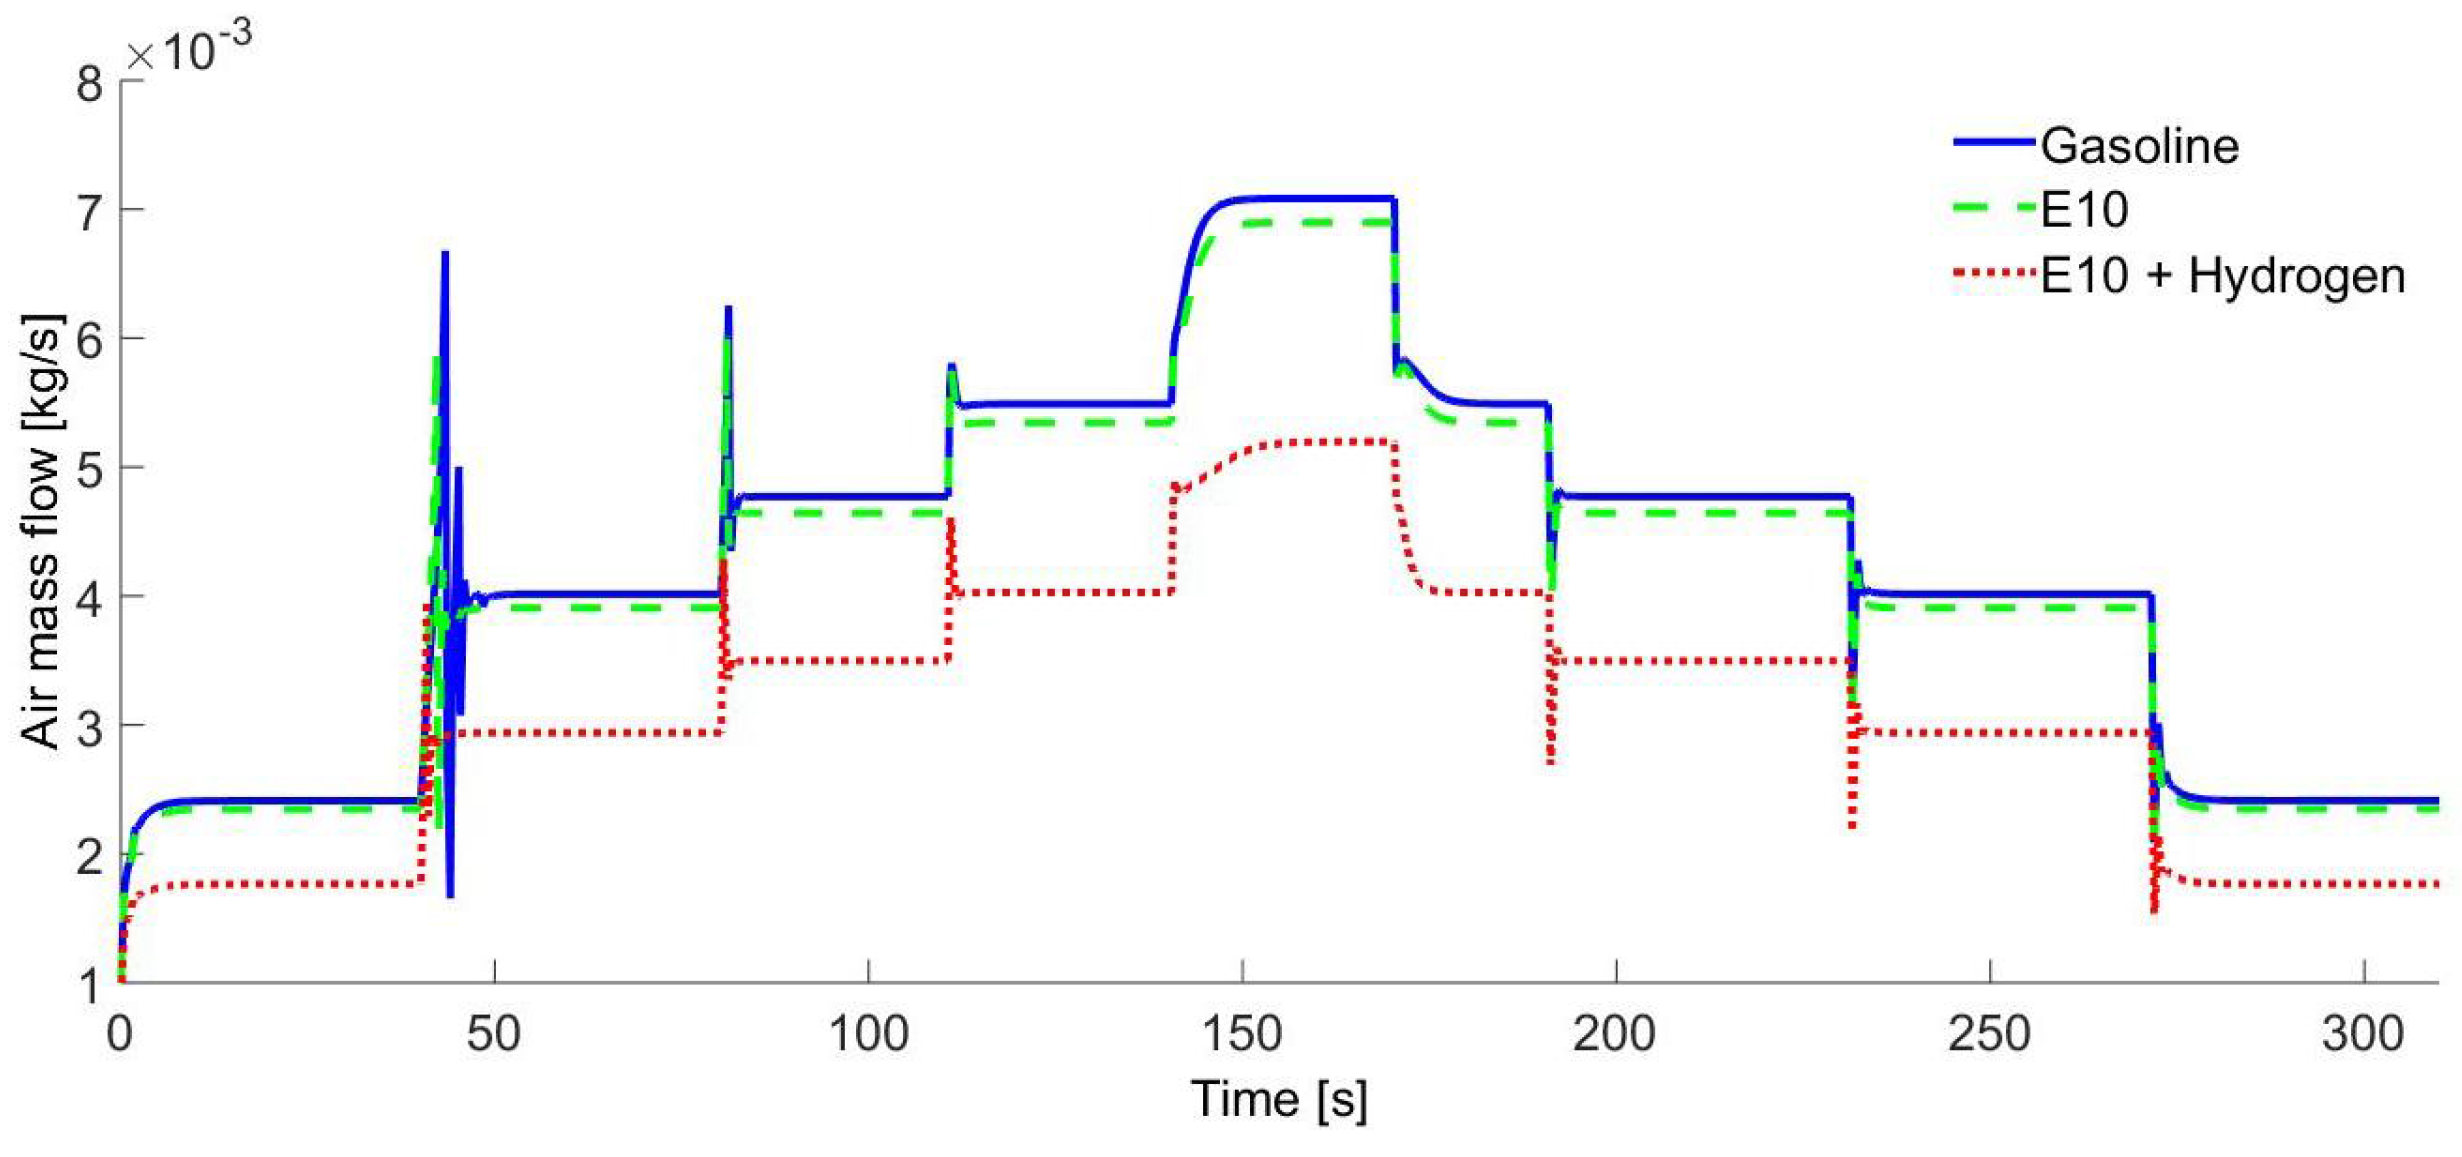
Figure 4, the throttle valve opening for each different time is shown. These results showed that if the IC engine is operated only with pure gasoline, the air requirements are higher than if it is operated with an E10 blend or E10-Hydrogen blend. This is because the ethanol contains oxygen in its molecular structure, so the AFR tends to decrease such that using an E10-Hydrogen blend requires a lower mass air flow to reach the same speed. Furthermore, the hydrogen LHV (Lower Heat Value) is higher than the E10 blend.
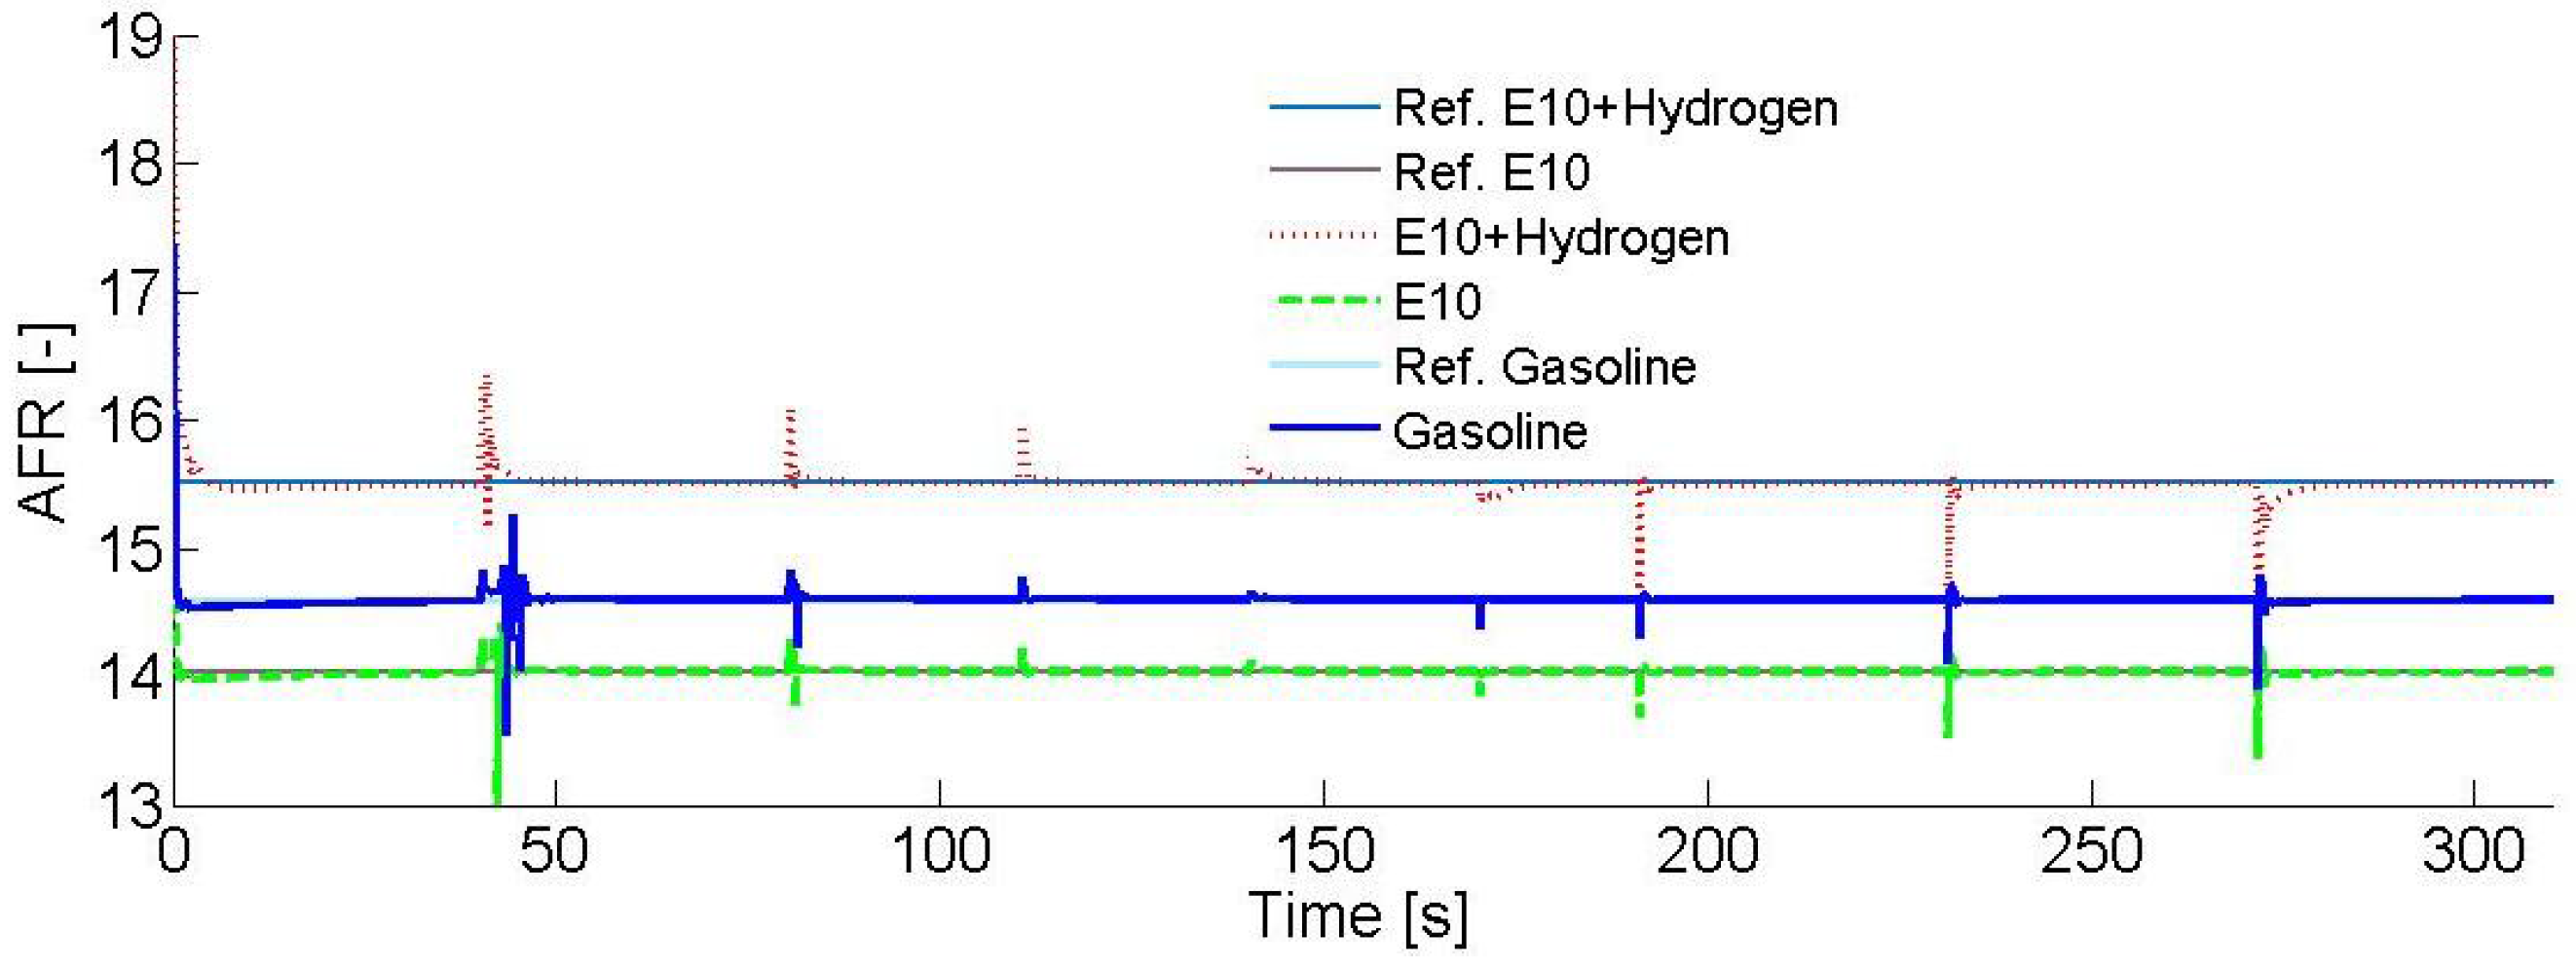
Figure 5 shows the AFR for each fuel. When pure gasoline is used, the AFR value was regulated at 14.6. For the E10 blend, it was regulated at 14.04. Finally, for the gasoline–ethanol–hydrogen blend, it was regulated at 15.51, maintaining the stoichiometric ratio at all times.
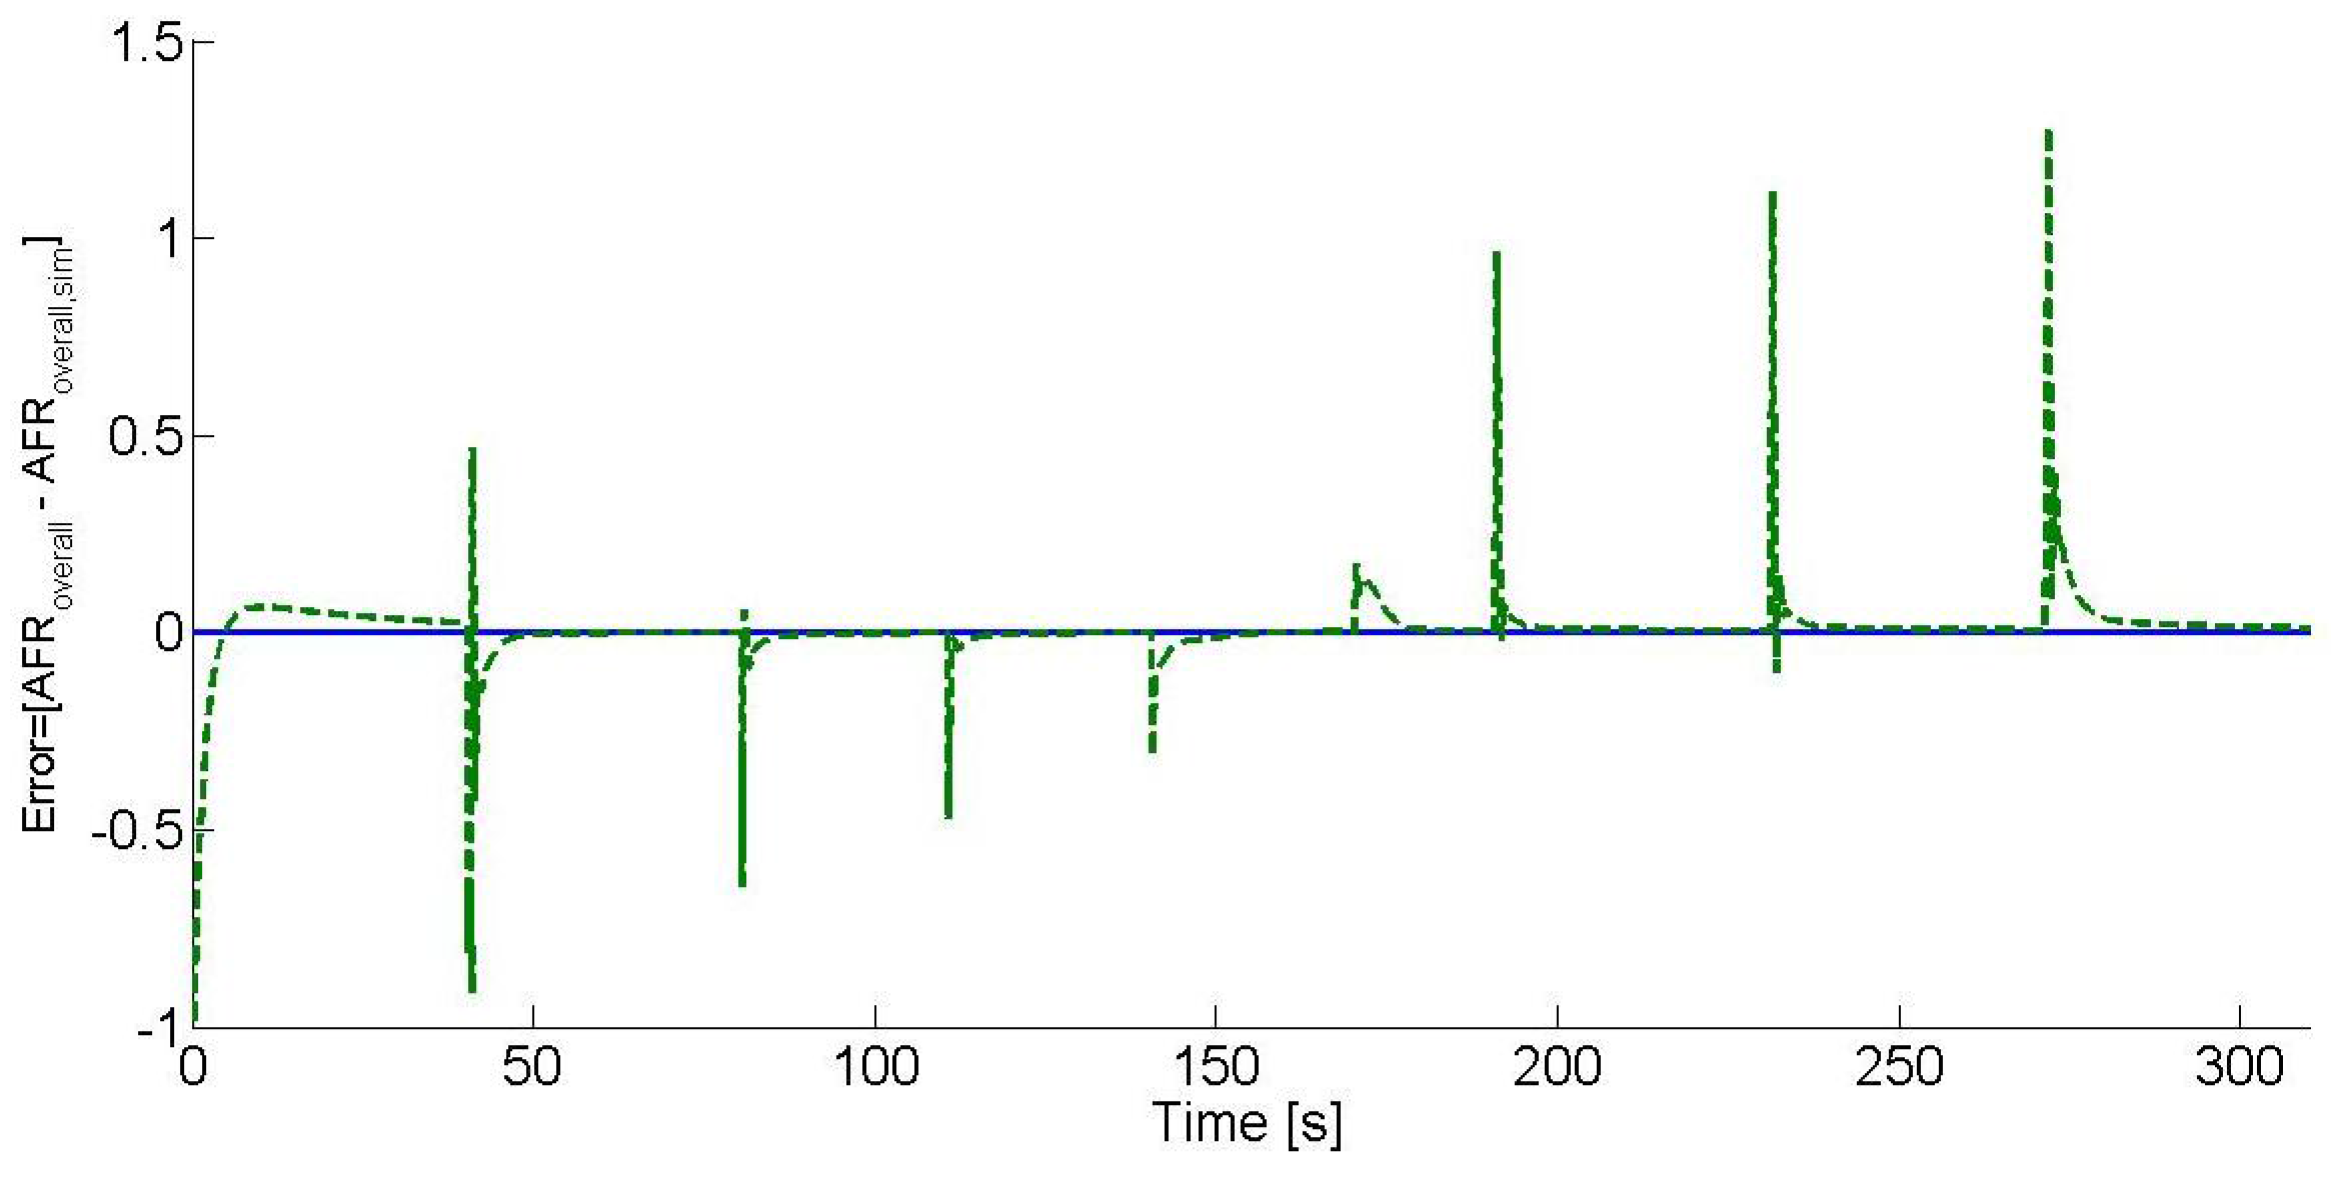
Figure 6 shows the E10 blend error analysis, where the error is defined as the difference between the E10 blend AFR set-point, which is 14.04, and the estimated E10 blend AFR. As it can be seen, the estimated E10 blend AFR tends to zero after each operating point change, and the overshoots are due to the control effects.
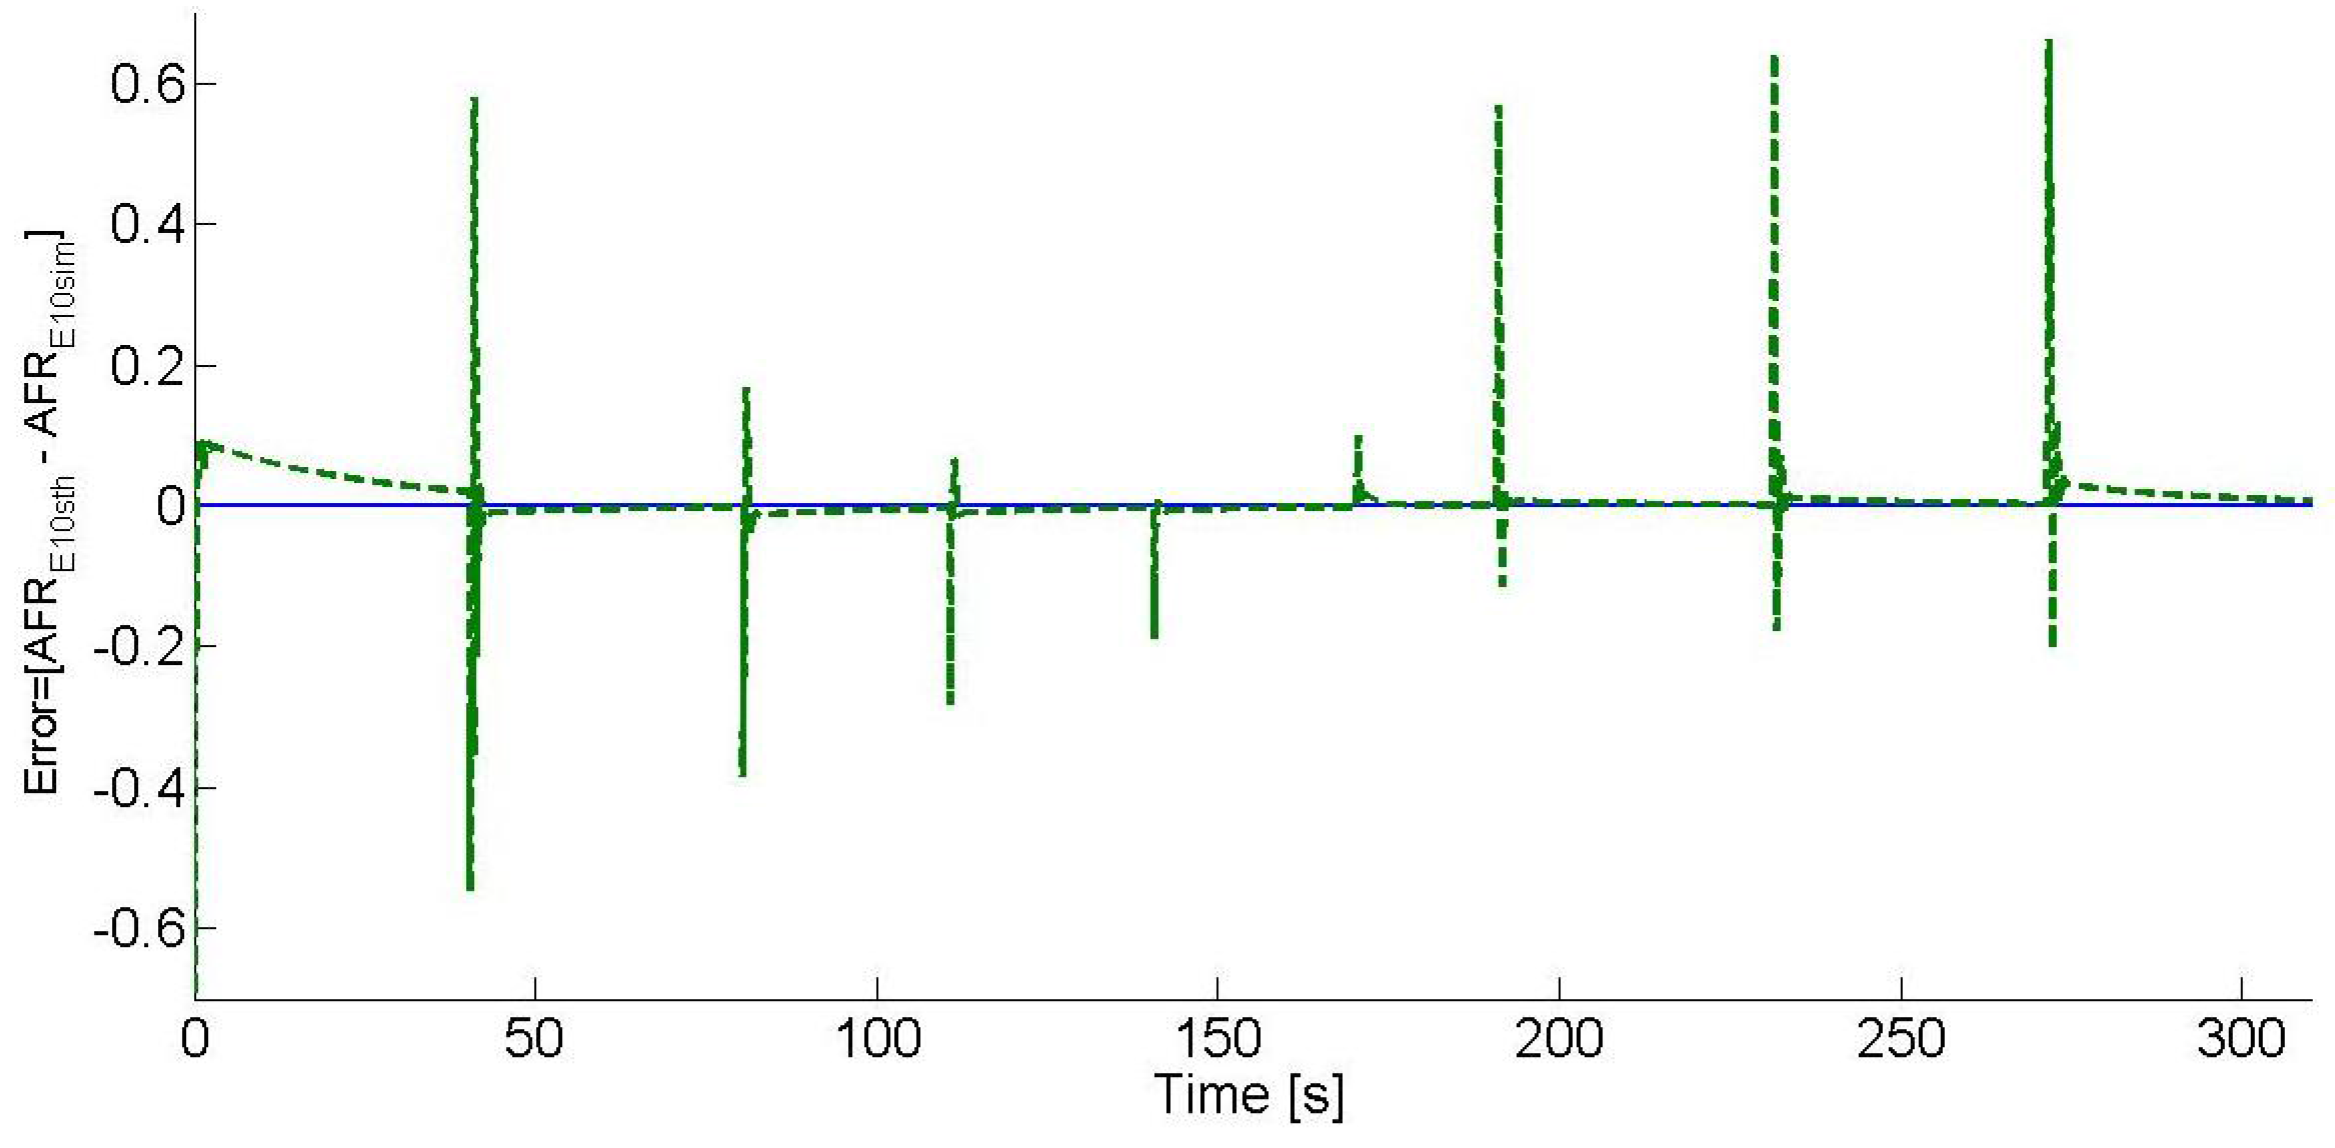
Figure 7 shows the hydrogen-enriched E10 blend AFR (overall AFR) error analysis, where the error is defined as the difference between the overall AFR set-point, which is 15.51, and the estimated overall AFR. As it can be seen, the estimated overall AFR tends to zero after each operating point change, and the overshoots are due to the control effects.
In
Figure 8, the air mass flow rate added to the IC engine is shown according to the crankshaft speed changes.
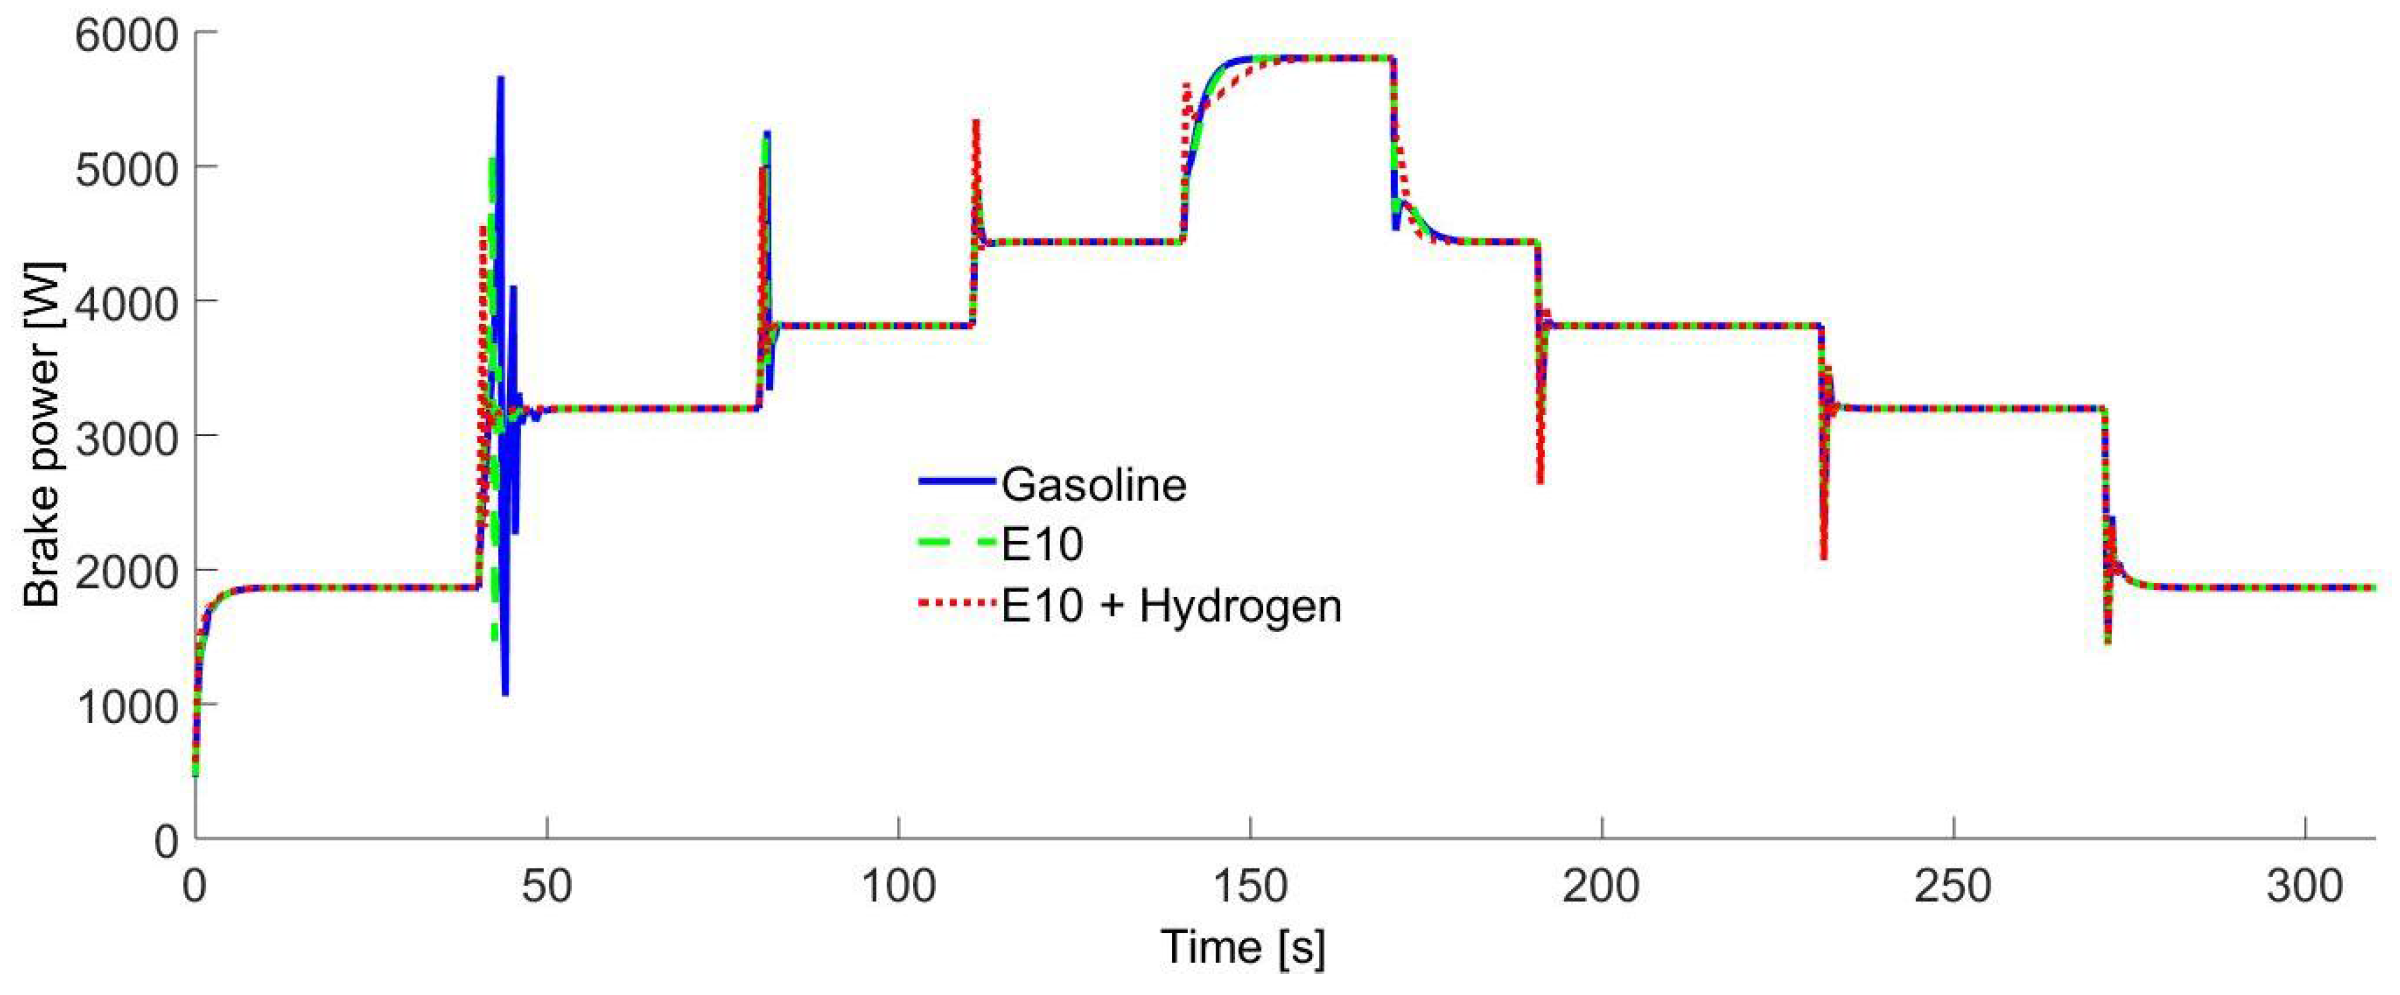
Figure 9 shows the obtained brake power for the fuels. As it can be seen, all of them are very similar. This was reached due to the fuel control strategy, so it is assumed that it is possible to maintain the same
by reducing the fossil fuel.
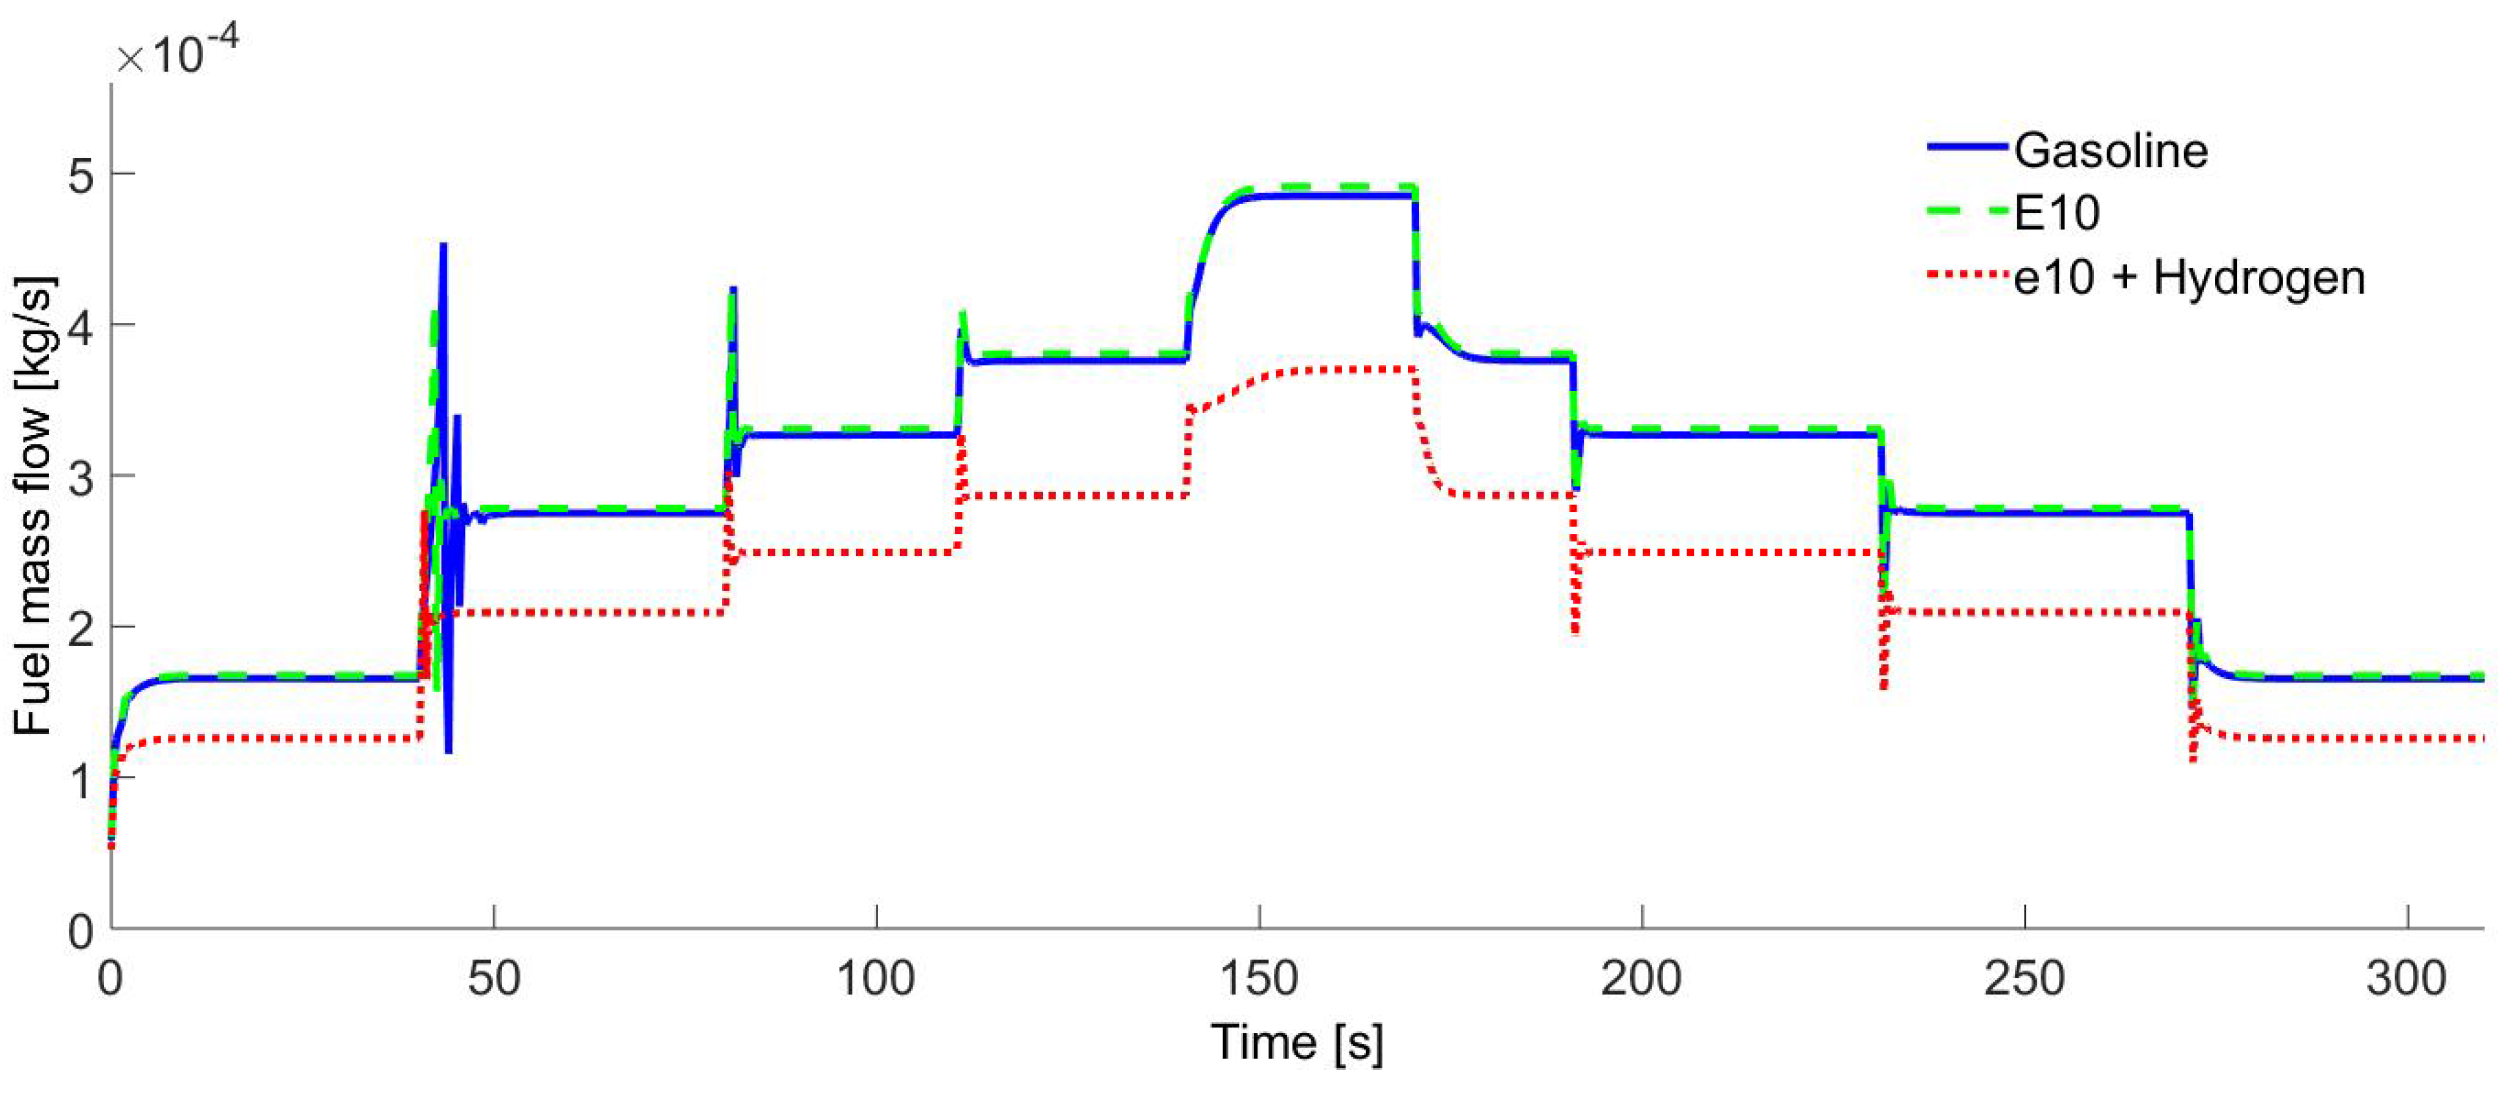
Figure 10 shows the gasoline fuel consumption compared to the E10 and E10-hydrogen consumption. When the E10 blend is used, the fuel consumption is slightly superior to the gasoline and E10-hydrogen consumption. This is due to the E10 blend LHV, since the ethanol has a lower value of LHV. When the hydrogen-enriched E10 blend is used, the gasoline use has a reduction average of 23%. This is because 10% of the gasoline is substituted by ethanol and another 13% of the gasoline reduction is due to the use of the energy provided by the hydrogen addition, since 7% of the hydrogen mass is induced into cylinders. In other words, the gasoline use reduction is due to the increment of the LHV when ethanol and hydrogen are used.
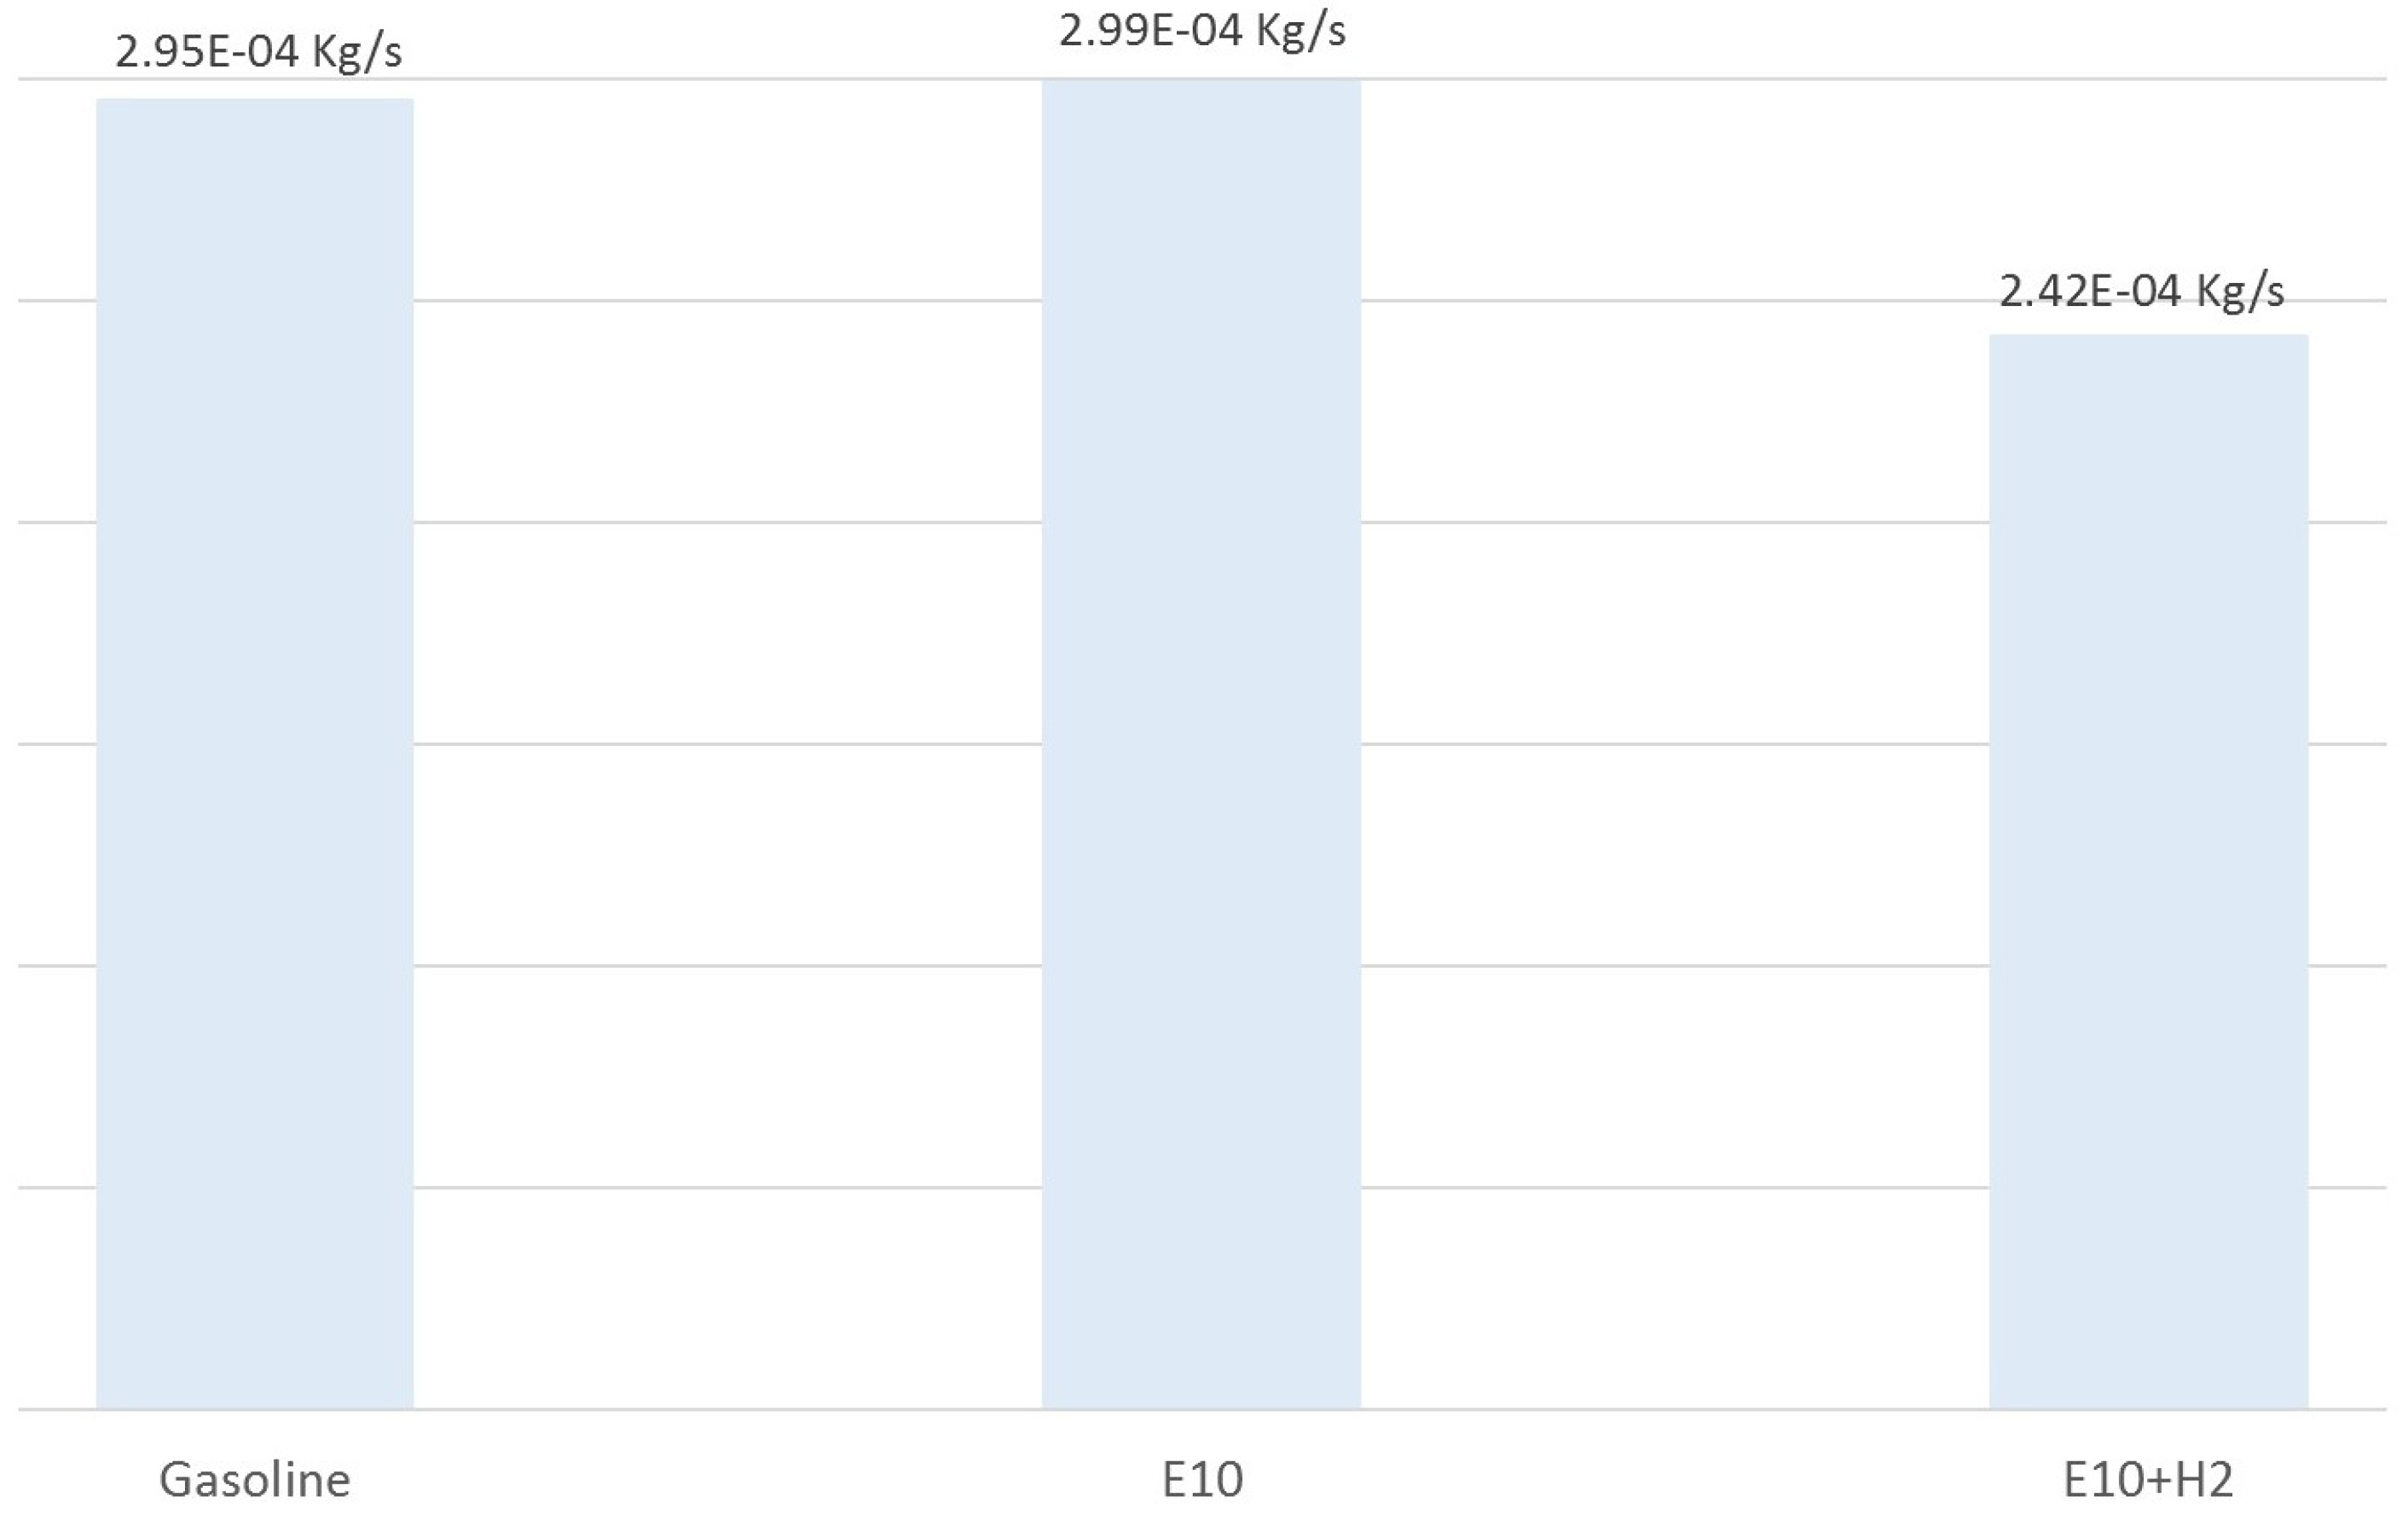
Figure 11 represents the average of fuel used by an IC engine during a 300 s test while considering the crankshaft speed changes showed in
Figure 3. The first bar represents the average of gasoline consumption used by the IC engine (when the IC engine is fueled only with gasoline). The second bar represents the average of gasoline–ethanol blend consumption in the IC engine (when the IC engine is fueled only with E10 blend). Finally, the third bar represents the average of E10 blend consumption using hydrogen as an additive in the IC engine (when the IC engine is fueled by E10 blend with hydrogen as an additive).
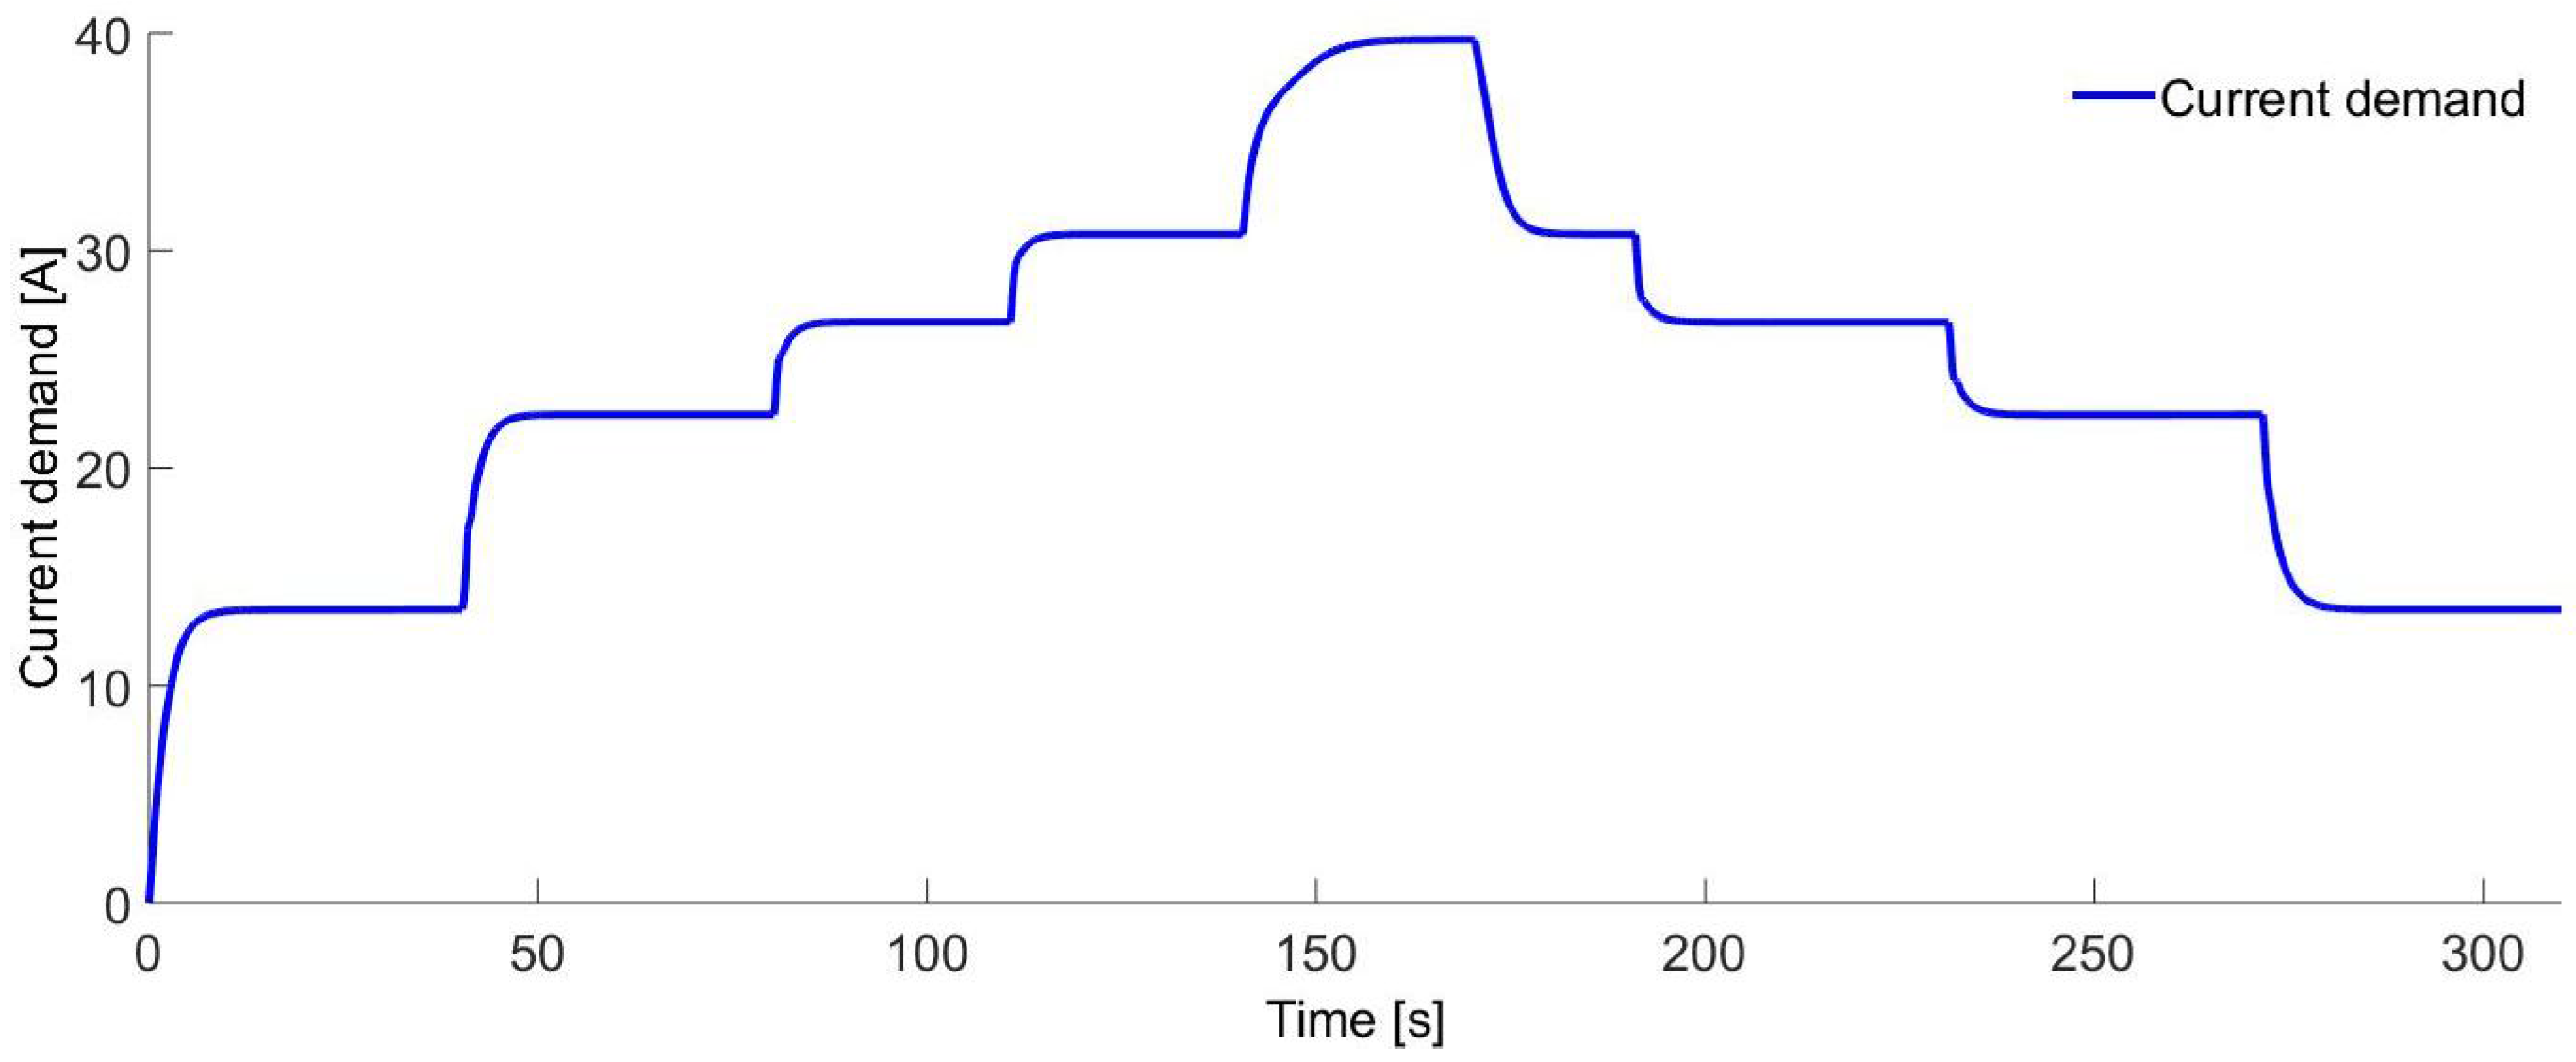
Figure 12 shows the current consumption of the electrolyzer. The current variations are due to the demand of hydrogen caused by the IC crankshaft speed variations. The variations are about
to 39.6 A.
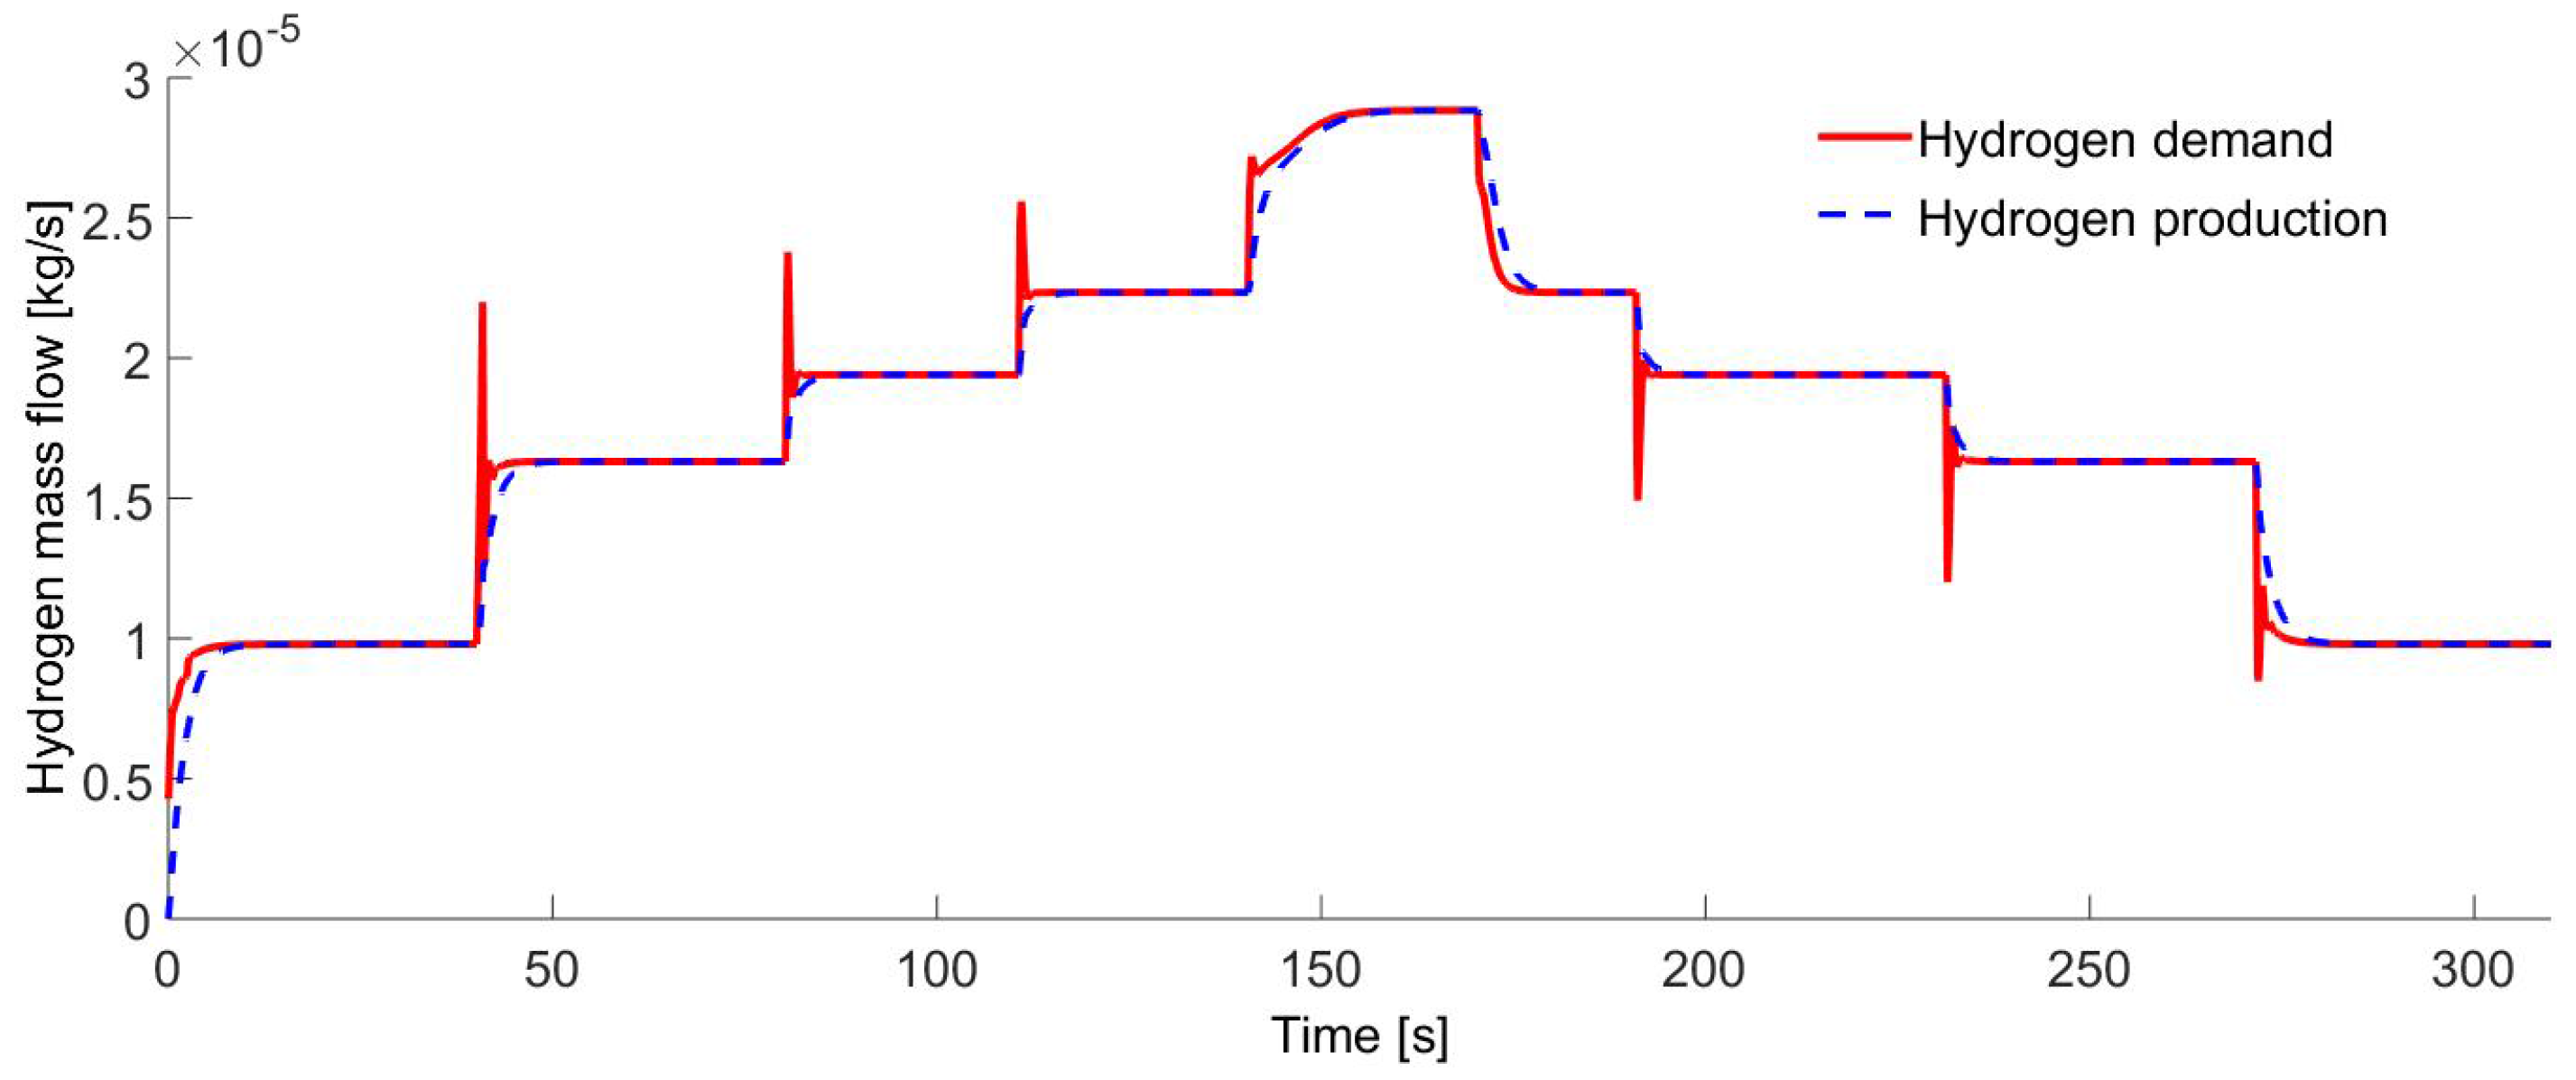
Figure 13 shows the hydrogen supplied to the IC engine that varies from
kg/s to
kg/s, which covers the IC engine demand on different operating speeds. The energy source for the electrolyzer is independent of the electric system of the engine.
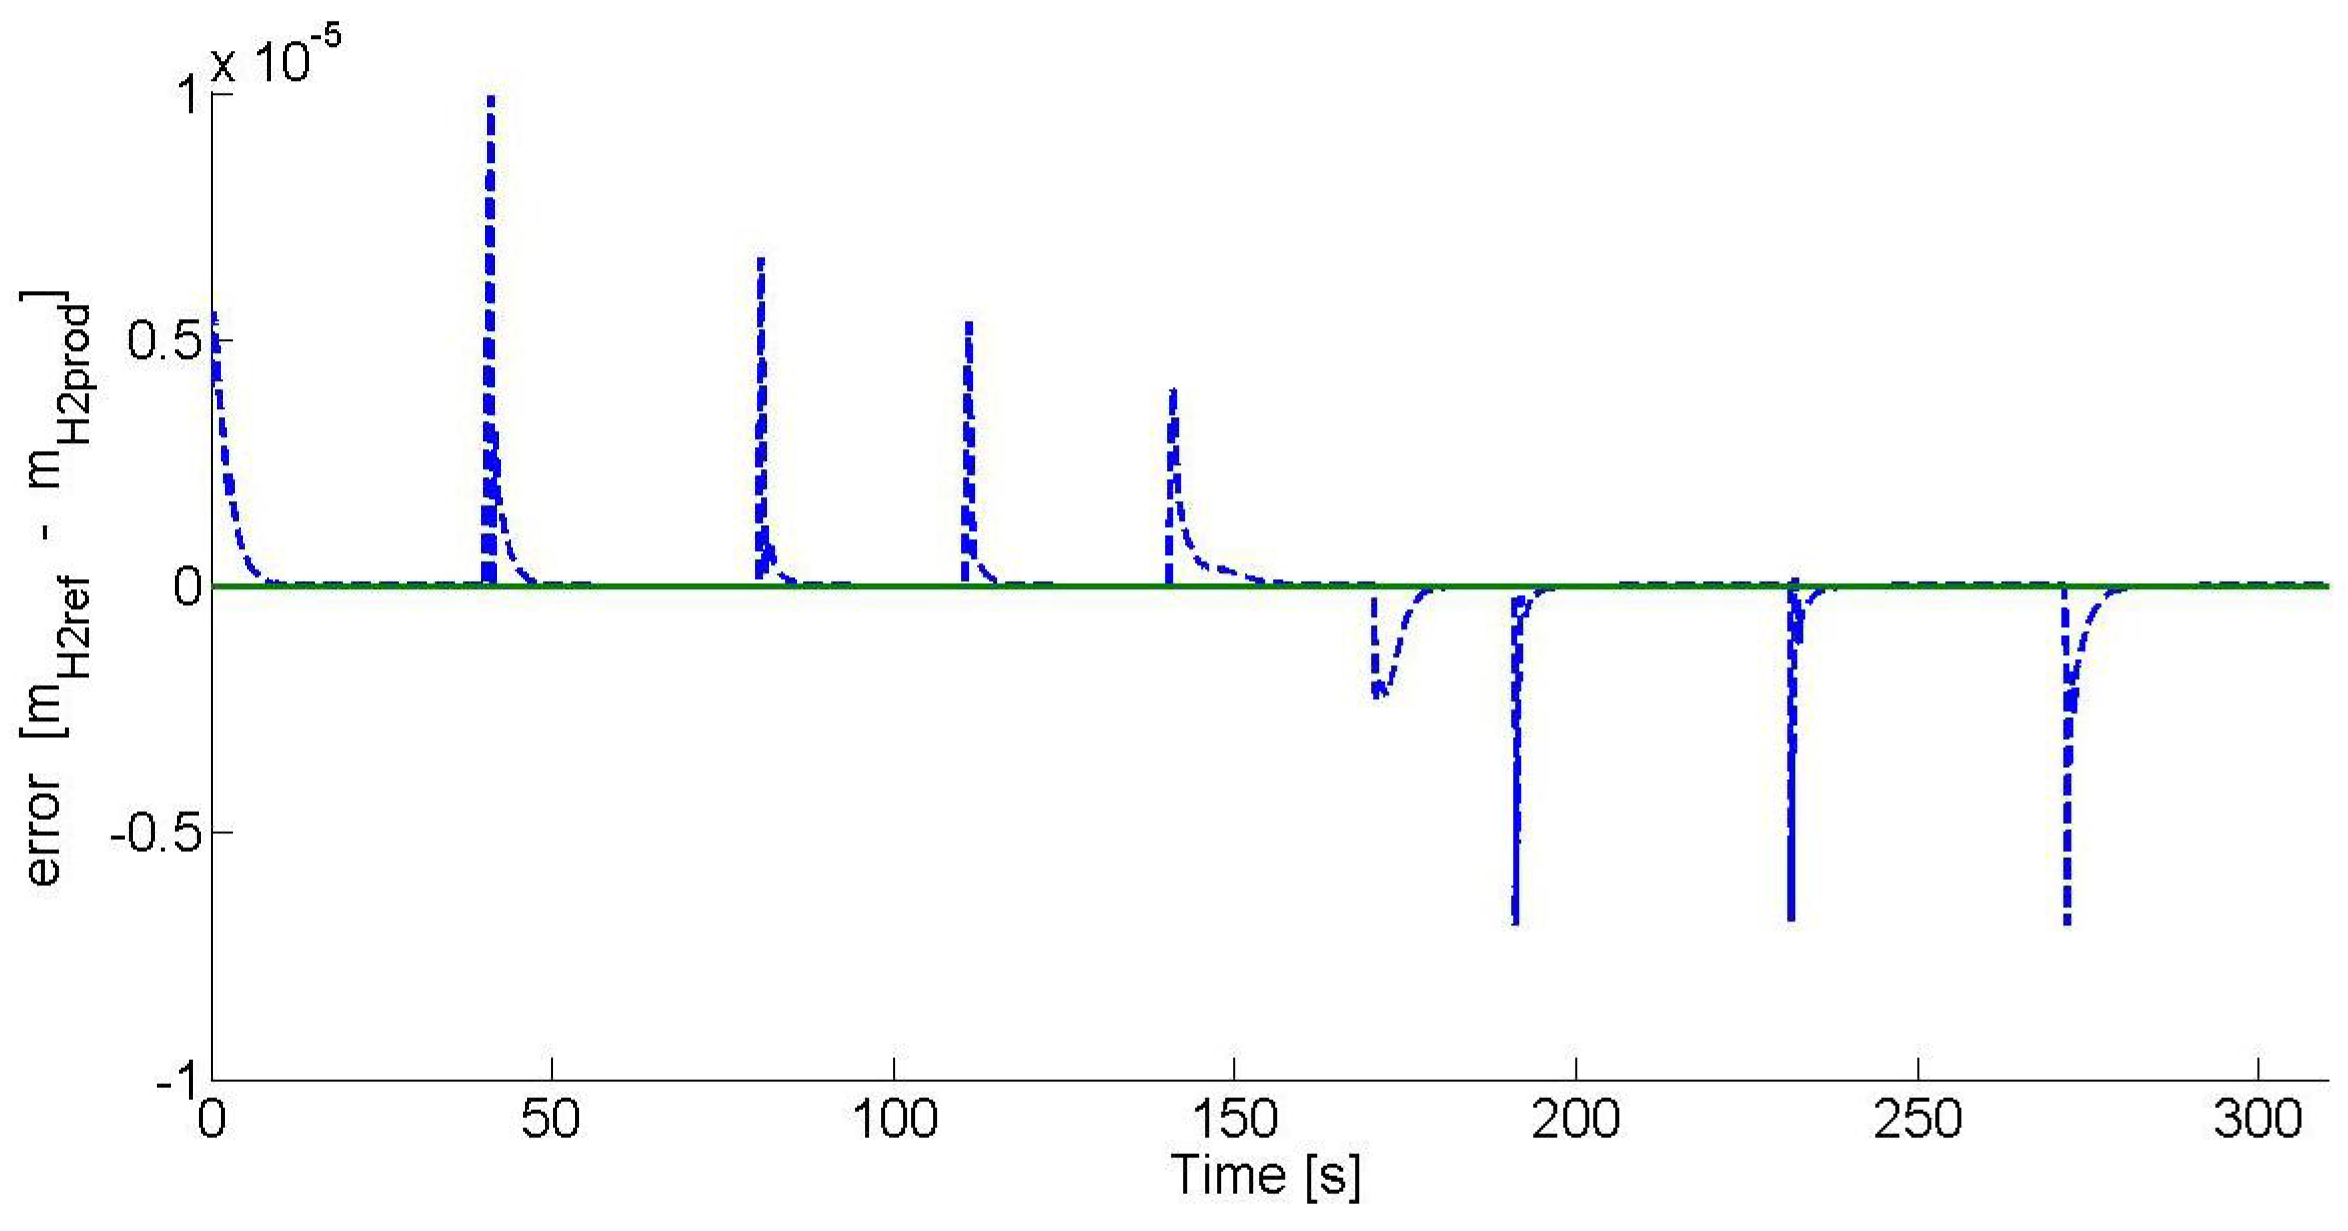
Figure 14 shows the hydrogen production error analysis, where the error is defined as the difference between the hydrogen production set-point and the hydrogen production at the current time. As it can be seen, the error tends to zero after each set-point change. The overshoots on the hydrogen production are due to the set-point change.
6. Conclusions
According to the presented simulations results, it is concluded that by controlling the hydrogen addition and maintaining control of the AFR in the IC engine, it is possible to have a favorable impact on the energy use by reducing about 23% of fossil fuel use, which means a significant savings in the economy without modifying the IC engine. The only requirement is to install an electrolyzer to produce the hydrogen and control the mass fraction of hydrogen by about 7%. It is necessary that the hydrogen mass fraction not surpass 7% of the mixture in the cylinder because if it surpasses this value, the cylinder volume efficiency will be reduced due to the hydrogen arriving more quickly to the combustion chamber, preventing air from entering. As a consequence, the power of the IC engine will be decreased. Another aspect to be careful of is the ignition angle when the hydrogen-enriched E10 blend is used because it has to be optimal. In this sense, therefore, the angle of ignition must be advanced and adjusted until the optimal angle is reached, due to the combustion rate increase as a consequence of the hydrogen addition. In futures work, experimental results on the proposed control scheme will be shown.


 ,
, 


