1. Introduction
The new forest management planning concept is designed to accommodate both Non-Wood Forest Products (NWFPs) and ecosystem services (carbon sequestration, soil protection and water production) in addition to timber products. Over the last two decades, sustainable management of forest ecosystems focusing on the collection, consumption, and trading of NWFPs has become an important issue for both forest managers and local people. While wild mushrooms have been used for household consumption since ancient times, they have recently become one of the most valuable NWFPs worldwide, due to their importance in medicine, food, and recreational activities [
1,
2]. Recently, market demand for mushroom has increased and their commercial value has largely exceeded timber value [
3,
4].
Lactarius is one of the most known ectomycorrhizal fungi that has certain ecological roles in forest ecosystems as a mycorrhizal fungus. Based on the symbiotic association, the
Lactarius species can take carbohydrates that are needed for growth from the host trees. On the other hand,
Lactarius species absorb more minerals and water needed by trees. In addition,
Lactarius sp. are valued wild fungi due to their socioeconomic importance. The trading of this resource provides supplementary income for rural people. Furthermore, these mushrooms represent recreational opportunities in some countries [
2]. They grow in acidic or calcareous soil and generally associate with Pinaceae hosts [
5].
Removal of photosynthetic host trees, which are the main energy sources for sporocarp production, causes the decrease of ectomycorrhizal mushrooms in the short term [
6]. Thus, forest management practices such as clear-cutting, selective cutting or thinning of forest stands and natural disturbances such as wildfire influence the occurrence and abundance of ectomycorrhizal mushroom species [
7]. Empirical models may contribute to integrating mushrooms into forest management planning. While a number of studies showed the relationships between mushroom occurrence and stand variables (basal area, stand age and dominant height) and climatic parameters (rainfall, temperatures) and topographic characteristics (elevation, slope and aspect), only a few empirical models of productivity [
8,
9,
10,
11,
12], or spatial distribution of mushrooms [
13,
14] have been developed to date.
The increasing importance of NWFPs worldwide and higher community demand in favor of these products have led to multipurpose forest management [
15,
16,
17,
18]. However, the integration of NWFPs, e.g., seeds, leaves, roots, barks, flowers, in forest management increases the complexity of the planning processes. To overcome this problem, appropriate information technologies are required to facilitate the decision making process such as forecasting models for each product, mechanisms to promote standards, and robust decision making tools [
18,
19] that use multi-criteria techniques (i.e., linear programming and goal programming). Comprehensive computer based analytical tools like Decision Support Systems (DSS) have emerged as potential solution techniques to overcome that problem [
20]. A DSS refers to “a set of computer based tools composed of a language system, presentation system, knowledge system, and problem-processing system that support decision making activities” [
21].
Though there is a wide range of forest management planning models that integrate wood and other ecosystem services worldwide, only a few of them are designed to integrate NWFPs. Such models use various optimization techniques that accommodate one or two NWFPs into forest management plans. The most common NWFP integrated DSSs include EMDS [
22] accommodating wildlife populations through artificial intelligence and fuzzy logic; MONTE [
23,
24] integrating mushrooms with genetic algorithms, tabu search, random search and simulated annealing; MONSU [
25] incorporating mushroom and various berries with genetic algorithms, tabu search, random search, simulated annealing and cellular automato; PractSFM [
26] dealing with woody debris and wildlife populations with simulation; ProgettoBosco [
27] taking care of truffles; ToSIA [
28] dealing with pine nut, mushroom and reindeer with heuristic and VDD-Path [
29] incorporating wildlife population with simulation technique; and SADfLOR [
30,
31] addressing the supply of pine cones and of cork with both mathematical programming and heuristic techniques.
ETÇAP
Optimization is a long-term strategic forest planning model developed to address the ecosystem based multiple use forest management planning concept in Turkey [
18,
32]. The model provides a conceptual framework to incorporate multiple forest ecosystem services using spatial database management systems with the capability to articulate silvicultural actions for forecasting future forest development, and providing tools for reports in graphic, tabular and mapped formats. The DSS uses linear programming (LP) and spatial information technologies and prepares both long-term strategic and medium-term tactical plans, depending on user demand and stand based data. With the combination of stand growth models and mushroom productivity models, mushroom yield can easily be estimated under different stand, climate, topographic condition and silvicultural regimes. This optimization-based model considers various performance indicators including economic values, which can be used to compare the effects of several alternative planning strategies on forest management. ETÇAP
Optimization documents the spatial lay out of management plans in accordance with the management guidelines prepared in Turkey to be readily applicable on the ground. Hence, the DSS has the capability to improve the effectiveness, efficiency and the applicability of decision making processes on the ground.
To date, a number of studies have incorporated some important forest ecosystem services such as amenities, recreation, soil protection, carbon sequestration, and water production into forest management plans and have further analyzed the interactions among these forest ecosystem services [
15,
33,
34,
35,
36,
37,
38]. However, there have been very limited attempts to develop NWFP integrated DSS to address the effects of various forest management intensities or actions on mushroom production at stand or regional level [
3,
16,
39]. Furthermore, very few studies [
17,
31,
40] have dealt with the trade-offs between NWFP and timber based on the effects of various forest management scenarios on forest dynamics. The principal objective of this study is to introduce an optimization based multiple use forest management planning model (called mushroom integrated ETÇAP
Optimization) that enables the integration of NWFPs and timber as well as other forest ecosystem services such as soil protection, water production, carbon sequestration and biodiversity. The subsequent objective of the study is to analyze the long-term effects of six alternative forest management scenarios with different objectives and constraints on mushroom production (
Lactarius deliciosus and
Lactarius salmonicolor) and on the supply of other forest ecosystem services.
2. Materials and Methods
2.1. Mushroom Integrated ETÇAPOptimization Model
ETÇAP is an acronym for an ecosystem based multiple use forest management DSS that accommodates several sub modules using various decision making techniques and forest management features [
17,
32]. Being the part or module of ETÇAP, ETÇAP
Optimization is a stand based DSS that uses linear programming techniques and ArcGIS (ESRI, Redlands, CA, USA) for assessing the long-term effects of forest management interventions on forest dynamics [
32]. Recently, the DSS was redesigned and upgraded to integrate non-wood forest products modules such as mushroom [
41] and is called a mushroom integrated ETÇAP
Optimization model. The renewed tool or the forecasting model is now able to facilitate the decision making process to evaluate the joint production and trade-off analysis of wood and NWFPs. Using the DSS, the effects of the management interventions on the performance of the mushroom production as well as wood and the other ecosystem services can also be analyzed.
The main principles of mushroom integrated DSS are the reliability, flexibility and functionality for multiple use forest management planning. Designed and programmed using DELPHI (Embarcadero Technologies, San Francisco, CA, USA), an object-oriented programming language, ETÇAP
Optimization is user-friendly in terms of modification. It ensures functionality for checking database consistency, editing management scenarios, generating LP compatible matrices, and solving the matrices and reporting the results in a desirable format.
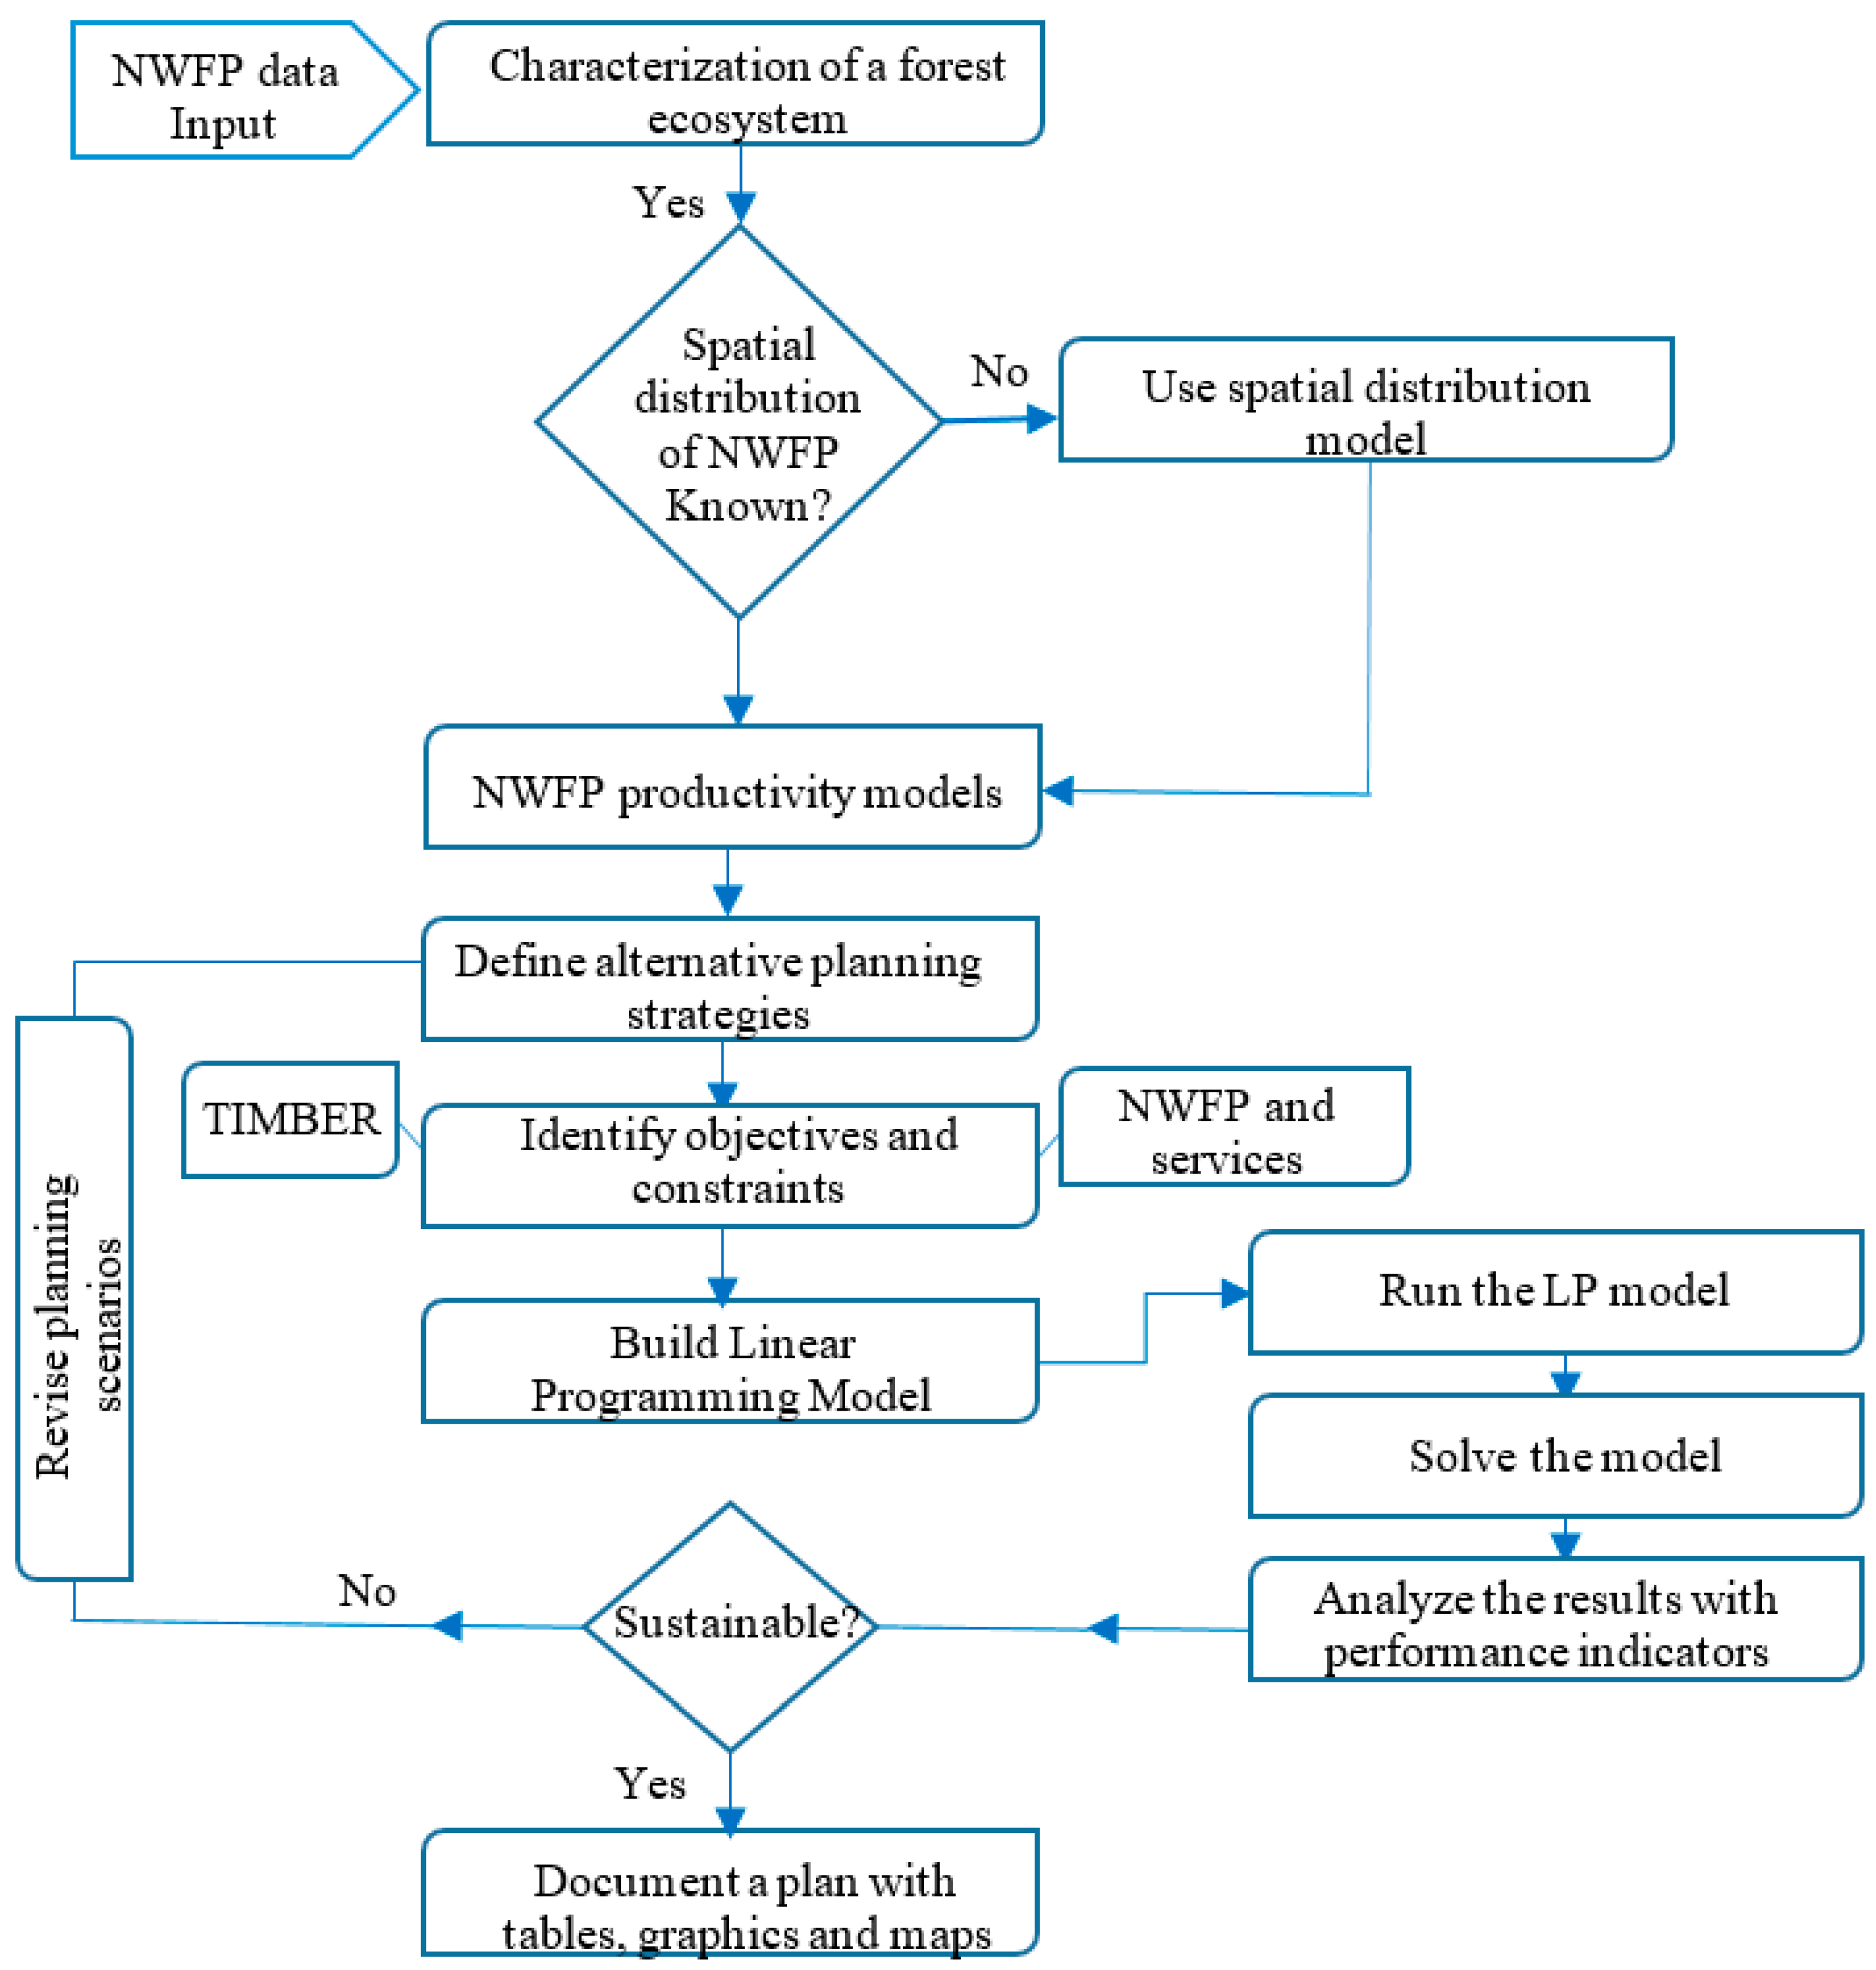
Figure 1 shows a typical process of a mushroom integrated ETÇAP
Optimization model. It starts with a stand based data entry with the characterization of a given forest ecosystem. In this stage, DSS requires the user to enter the spatial data about initial forest structure, yield tables, economic revenues and costs, silvicultural regimes and management policies. Management prescriptions in the form of valid alternative silvicultural treatments such as clear-cutting, thinning and planting, as well as management policies such as area or volume control regulations and initial parameters over a planning horizon (simulation time), are identified for each stand type either automatically or manually.
The next important step of the optimization model process is to identify the characterization of the related mushroom. The users must then select a supplementary model that determines spatial distribution of the related mushroom. To calculate the productivity of the mushroom, the user selects a yield model and its related parameters such as calibration models, p threshold value for the spatial distribution model, the correction factor to calibrate the yield model, and the fresh/dry rate of mushroom and rotation time (one year for the mushroom). According to the process, first of all, the DSS specifies the spatial distribution areas of the related mushroom and then the productivity of the mushroom is calculated for the areas or stands where they exist. If a user does not choose a spatial distribution model, the DSS assumes that the related mushroom is present everywhere or in each stand of a given planning unit.
After setting the initial data and the supporting models, the planning scenarios including management objectives and constraints of the problem are then determined by the users. At this point, objective function of the optimization model can be maximization or minimization of each forest ecosystem service (timber, NWFP, soil, water, carbon or oxygen) in terms of either amount, economic value or even cumulative total of some forest ecosystem services in terms of total economic net income from timber and mushroom production. In the updated DSS, some objectives and constraints are incorporated into the current system. The objective functions were updated with the total amount of mushroom production, the Net Present Value (NPV) of mushroom production, the NPV of water production, soil erosion, carbon sequestration, oxygen production and mushroom production and the total NPV of all forest ecosystem services. Constraints can be designed to reflect the forest management policy requirements, regulatory restrictions, periodic flow of some forest ecosystem services and target values of other planning parameters. Moreover, additional constraints such as target mushroom production for one or more time periods over a planning horizon and total mushroom yield can be imposed on the model. However, natural events or disturbances such as forest fires, climate change, insect or storm damage, and pollution are not currently considered in this study. The modular structure of the DSS allows easy integration of empirical models predicting these kinds of events when they are available.
Given the initial forest condition and the management scenarios, the DSS generates matrices based on the LP structure. The optimization model uses a commercial software program such as LINGO or LINDO (Lindo Systems Inc., Chicago, IL, USA) to solve the generated LP model. The DSS is also equipped with additional capability of a report writer to document the output in the form of a table, graphic and map, and of forest performance indicators through which forest dynamics can be evaluated and understood for better decision making.
2.2. Growth and Yield Projection of Timber
ETÇAP
Optimization DSS uses an empirical growth and yield model to project the development of stands over time. This optimization model predicts the growth of current stands and the regenerated stands separately. The growth of current stands is estimated depending on the allometric relationship between the stand parameters collected from field inventory and the same stand parameters from empirical yield tables such as mean diameter, height, dominant height, basal area, volume and increment [
32]. The regenerated stands are assumed to develop according to the empirical yield tables prepared for each species and site type. In both approaches, the growth of stands was terminated as soon as they reach the age of mortality and regeneration starts afterwards. The growth model provides important stand characteristics such as basal area, annual volume increment, standing volume, and number of stems for each stand type.
2.3. Spatial Distribution of Mushroom
The presence of mushroom in a specific stand is predicted with a spatial distribution model. The prediction of spatial distribution of
L. deliciosus and
L. salmonicolor mushroom in each period was determined by logistic regression models [
14] in the mushroom integrated ETÇAP DSS module. The DSS includes a number of logistic models to predict spatial distribution of each kind of mushroom species. In this study, the following equation was used to predict the spatial distribution of related mushroom [
14,
41] (Equation (1)). In the mushroom integrated ETÇAP DSS, 0.5 was used as
p threshold value; hence, a stand whose
p threshold value is equal or greater than 0.5 was assumed to have mushroom otherwise no mushroom exists:
where
p is the probability of
Lactarius mushroom presence,
e is the “euler” number,
CC is crown closure (%),
S is slope (%),
Aa is aspect (°),
AC is classes of age,
VC is classes of volume and
T is increment per hectare of volume (m
3/ha).
The coefficients of AC and VC as categorical variables can be seen in the following table (
Table 1).
2.4. Yield Productivity of Mushroom
The mushroom integrated ETÇAP DSS projects annual
L. deliciosus and
L. salmonicolor productivity per hectare for each stand where spatial distribution of mushroom was determined to exist. In this study, the following mushroom growth equation was used to predict the productivity of mushroom for the appropriate stands [
41] (Equation (2)):
where
is total yield of
i plot in year
j (kg/ha),
Asp is aspect (°),
Ele is elevation (m),
d is mean diameter of stand (cm),
is age of stand,
is random plot factor,
is random year factor and
is residual.
When only a fixed part of the mixed model is used, the model should be multiplied with a Snowdon correction factor (0.667) [
42] after exponentiation of the logarithmic model. When plot factor is used as a random factor with a fixed part of the mixed model, the Snowdon correction factor becomes 0.637.
2.5. Financial Analysis
The financial incomes from various timber assortments were calculated by average market sale prices, and the costs were determined as the sum of regeneration, stumpage price for timber, thinning, harvesting and reforestation costs derived from the financial databases of the Cide state forest enterprise [
43]. The economic values of mushroom production were calculated based on the revenues and costs from related mushroom sales. While the financial revenues of mushroom were determined by average market sale prices of the last 10 years, the costs were calculated according to stumpage price, sale and general expenses such as administration and maintenance costs. Mushroom integrated ETÇAP DSS uses the NPV economic approach and a flexible discount rate is used to project the total revenues and costs in each period to the current economic situation.
2.6. Study Area and the Dataset
The study area of the Kızılcasu Planning Unit covering a 9166 ha area, is situated in Kastamonu province in Northwest Turkey. The planning unit consists of high mountain forests characterized by highly steep slopes and elevations from 350 m to 1350 m a.s.l. This wider range of elevation in the study area causes sharp changes in temperature and rainfall. Mean annual temperature and annual rainfall are about 13 °C and 1230 mm, respectively, based on the measurements from 1984 to 2005 of the nearest meteorology station of Cide [
44]. A large part of the region is covered by mixed stands of Oriental beech (
Fagus orientalis), Hornbeam (
Carpinus betulus), Nordmann fir (
Abies bormülleriana), Oak (
Quercus sp.), Scots pine (
Pinus sylvestris), Black pine (
Pinus nigra), Anatolian chestnut (
Castanea sativa), Ashen (
Fraxinus excelsior), Alder (
Alnus glutinosa), Maple (
Acer sp.) and Oriental plane (
Platanus orientalis). The total number of stands (sub-compartments) in the area is 1196 determined based on the stand types according to the mix of tree species, development stages and crown closures. The dataset utilized in the case study area includes mainly in-house empirical yield tables for main tree species, forest cover type maps of the Kızılcasu planning unit for 2008 that were built with Arc/Info GIS and the other rudimentary forest inventory database by the forest management department updated in the same year. The region is very rich in terms of mushroom species so that picking of
L. deliciosus and
L. salmonicolor has long become a cultural activity for both household consumption and additional income.
2.7. Model Development
Among many alternatives, six prevailing planning strategies were designed to analyze their spatio-temporal effects on forest dynamics based on the combination of various management objectives with a different set of constraints. The NPV of both timber and mushroom were incorporated separately into the model as management objectives. Therefore, two different management objectives were developed based on even timber flow, 10% variation of timber flow among periods and no restriction policies in the form of constraints (
Table 2). Three percent interest rate was used in all strategies.
A number of assumptions were recognized in the optimization based model to elucidate the interactions among various management strategies. The planning horizon is 120 years and the planning period is 10 years. Regeneration is assumed to follow immediately after the final harvesting of stands. The regenerated stands grow according to the empirical yield table and follow the same stand type and site index. Growth and yield projection of actual stands is estimated according to typical simulation of growth potential of stands. Timber, mushroom and their monetary values as well as all stand parameters for each sub-compartment are calculated separately at the midpoint of each period. Silvicultural prescriptions were identified for each stand type or management unit. A management unit is identified and delineated based on similar forest structure, development patterns, primary forest use (function) and the management objectives. Here, three distinct management units were identified for management planning: “Scots pine and Black pine forests”, “Nordmann fir and Oriental beech forests” and “Oriental beech and Oak”. Minimum cutting age for “Scots pine and Black pine forests” management unit is 140 years, for “Nordmann fir and Oriental beech forests” and “Oriental beech and Oak” management unit is 120 years and for conservation dominated areas is 200 years. Maximum harvesting ages are also set to be 180, 160 and 220 years, respectively. Commercial thinning actions were implemented for the stands whose ages range between 30–80, 50–90 and 40–120 years in the respective management units with a removal rate of 10% to 15% of standing volume for each period. All economic calculations were conducted based on the NPV of both income and expenses provided by the related state forest enterprise with a 3% interest rate, the generally accepted rate in Turkish forestry.
3. Results and Discussions
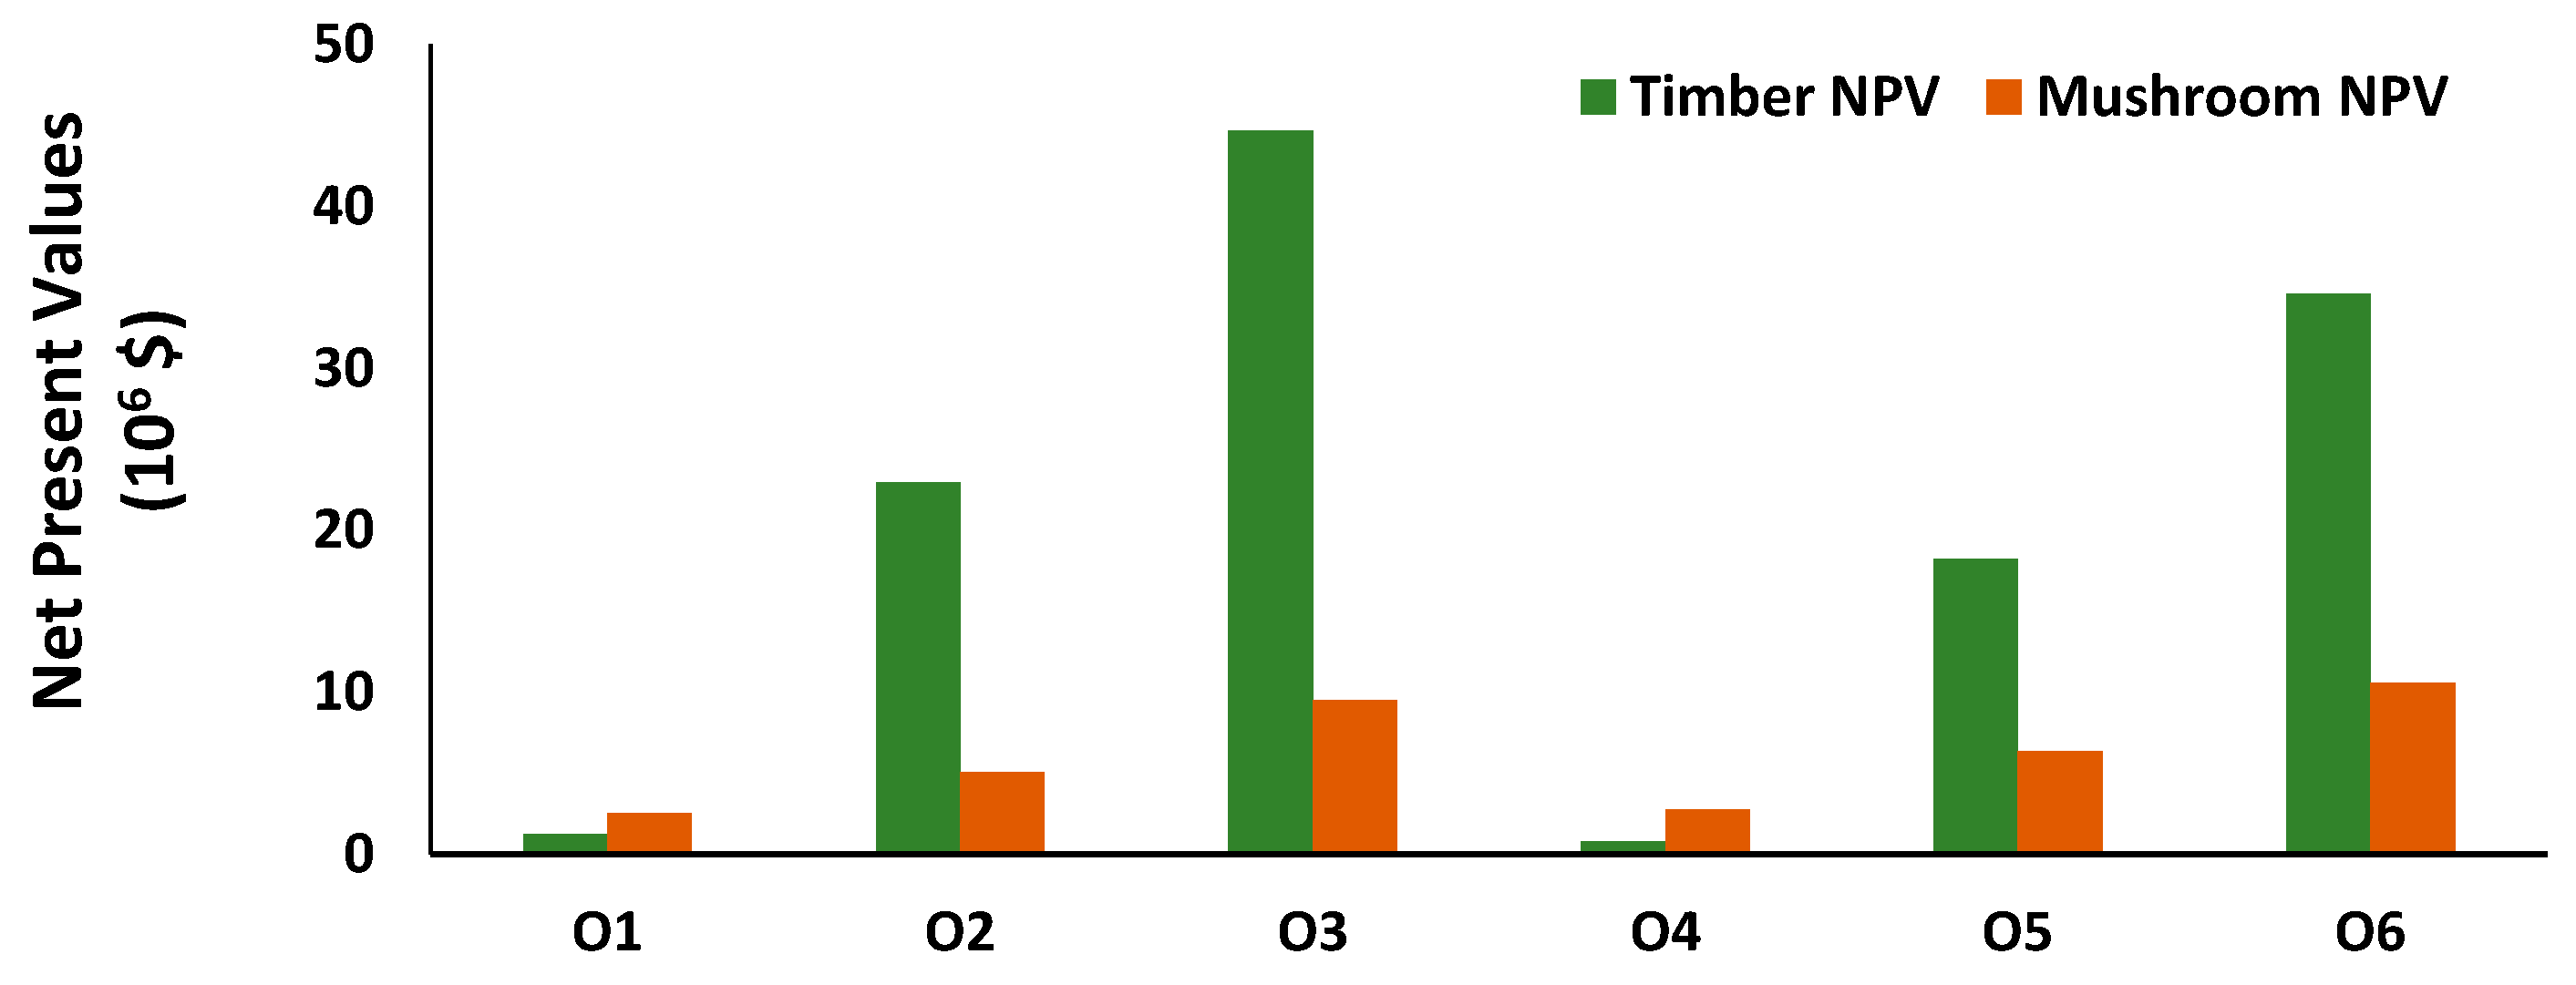
The projected amount and NPVs of forest ecosystem services such as timber and mushroom for each strategy at the end of the planning horizon can be seen in
Table 3 and
Figure 2. Obviously, the O3 and O6 strategies produced the highest total NPV of timber and mushroom due mainly to no restrictions. Compared to each other, the forest management strategies with timber and/or timber NPV objectives (O1, O2, O3) produced about 20% more total economic income than that of forest management strategies with the mushroom NPV objective (O4, O5, O6). The results indicated that the forest management planning strategies including the maximization of mushroom NPV cause substantial decrease in total income from forest ecosystem services because of the protection of the forest to produce mushroom.
Among all strategies, the strategy O3 contributed the highest amount and NPV of timber with 3,979,594 m
3 and $44,713,208, respectively. This is mainly due to the fact that the optimization based model simply maximized the timber production without any restrictions. Compared to O3, the amount and NPV of timber over the planning horizon that the O1 strategy produced decreased by 98% and 97%, respectively, because of even timber flow constraint. Among all of the strategies, the strategy O4 produced the lowest timber volume and its monetary income (65,111 m
3 and $814,862) at the end of the planning horizon. Such outcomes are probably caused by both the maximization of mushroom NPV and even timber flow constraint (
Table 2). The results show that the total timber production and its NPV decreased by 98% when mushroom NPV was maximized. Changing objective functions to the maximization of NPV of mushroom and adding an even flow constraint together forced the optimization model to cut the same volume in each period. Some studies [
45,
46] showed that an optimization model with a volume regulation constraint generally causes a significant reduction in timber NPV given the same initial age class structure.
The highest and the lowest amount of mushroom productions, similar to the NPV of mushroom, were generated by the O6 and O1 strategies, respectively. Changing the objective from the NPV of mushroom to the NPV of timber with even timber flow constraint caused a significant reduction of 90% and 76% in mushroom production and the NPV of mushroom, respectively (
Table 3). As expected, the integration of regulatory constraints into forest management plans has greatly affected both economic profit and the amount of forest ecosystem services, such as timber and mushroom, negatively [
36,
45,
46,
47,
48].
When all planning strategies were compared to each other in terms of NPV, surprisingly the O1 and O4 strategies drew attention with NPV of mushroom that is about two and three and a half times more than the amount of NPV of timber, respectively (
Figure 2). The main reason of such results would be issuing from the imposed constraints. As is already known, incorporating volume control policies into the forest management plans generally causes limitations in timber production as well as monetary income from timber.
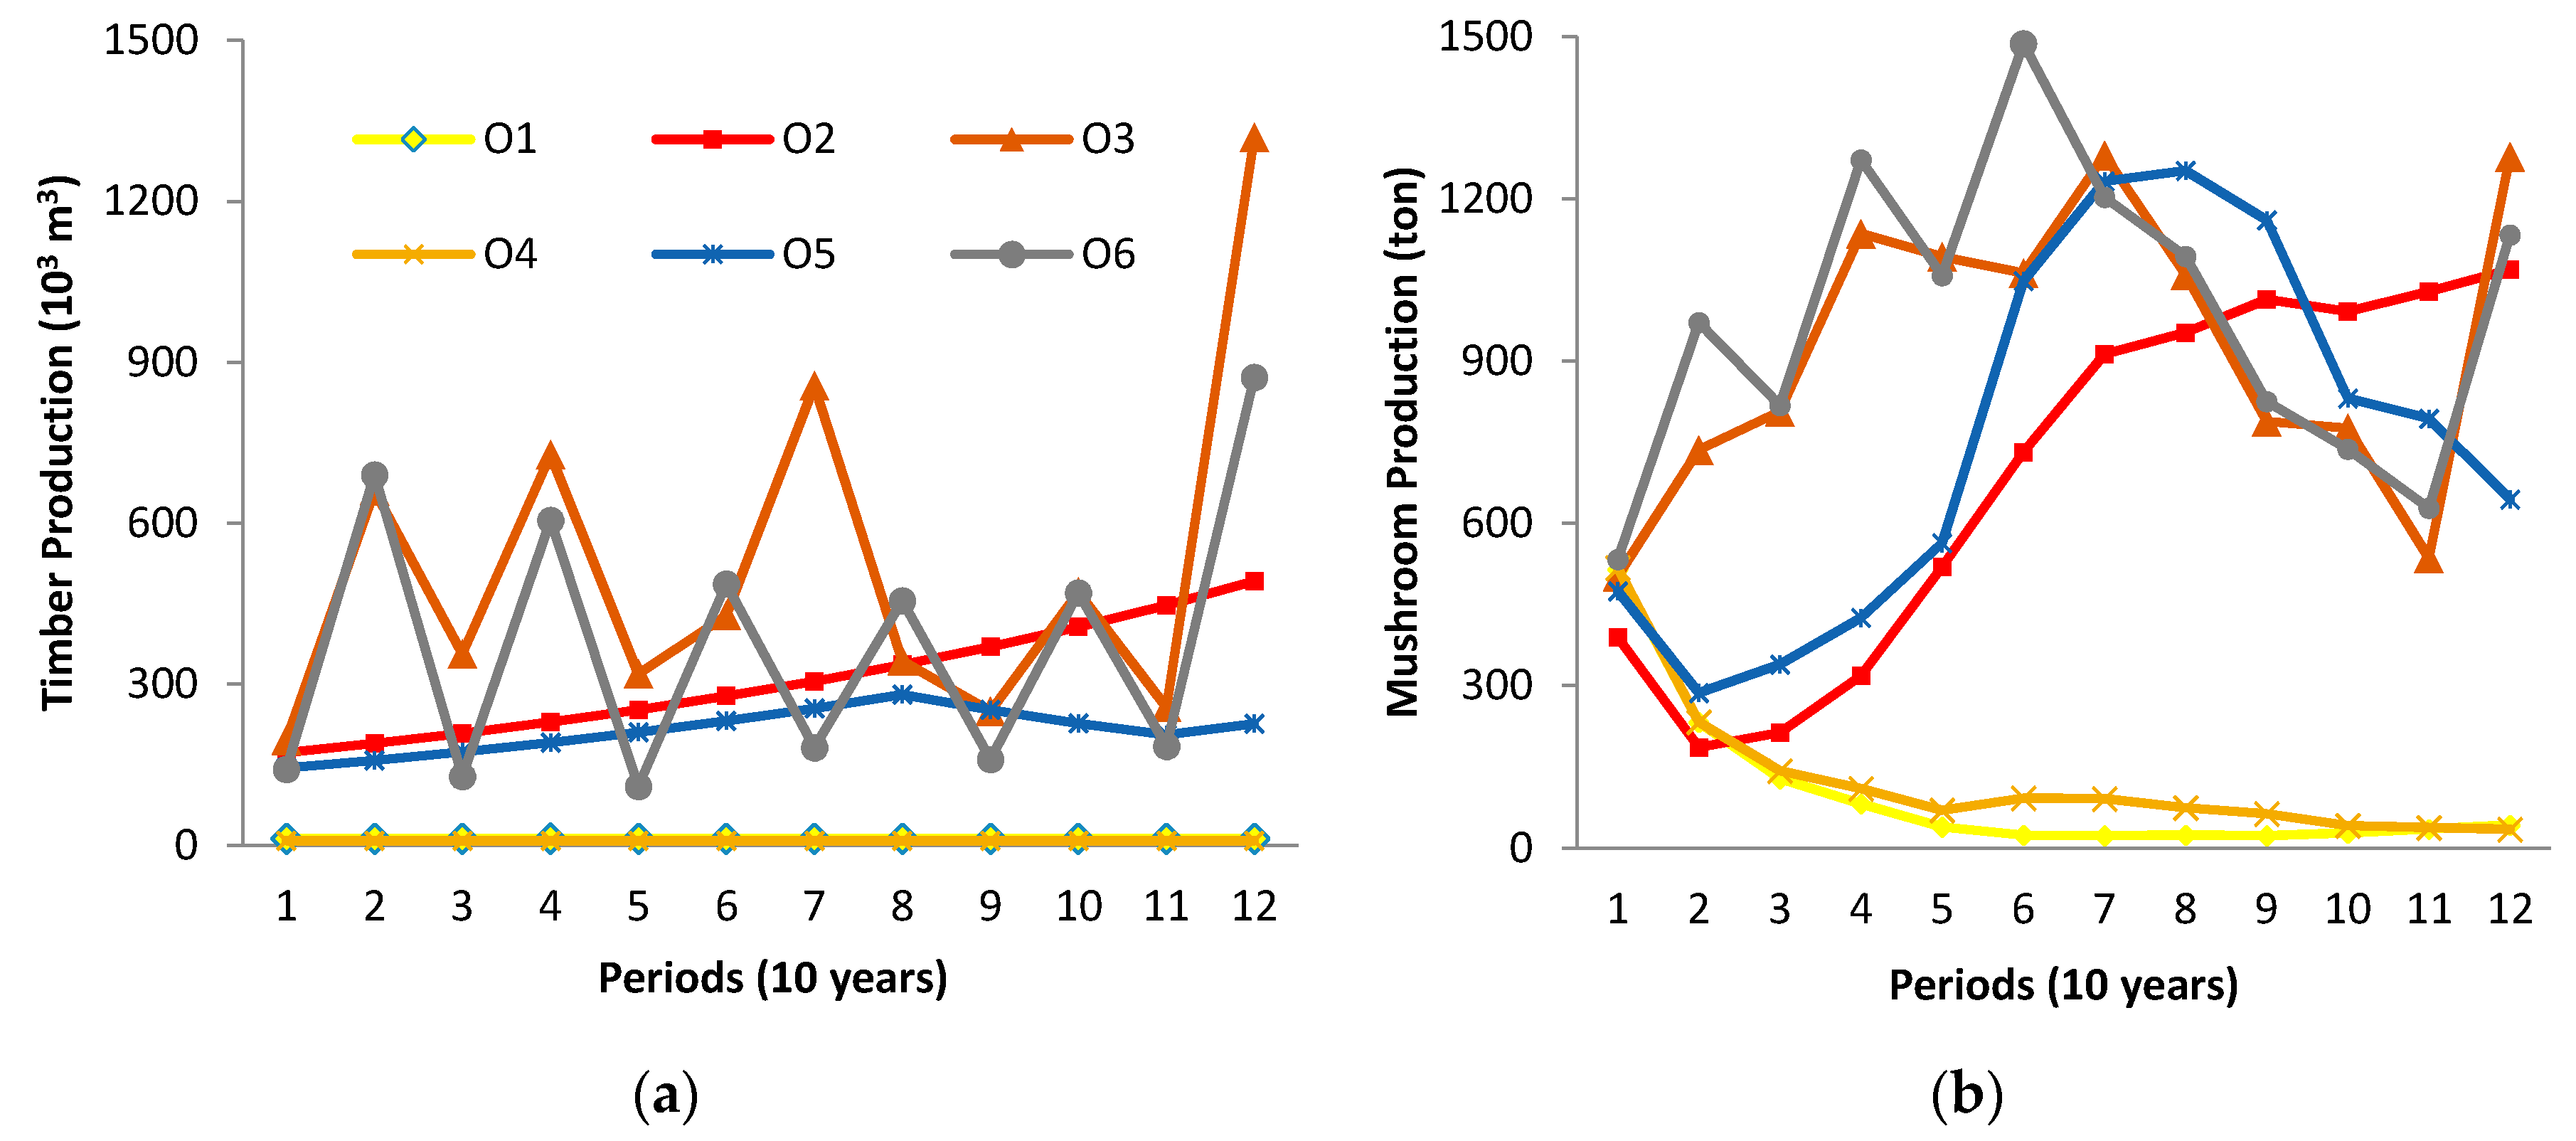
Besides the characteristic analysis of total amount and the NPV of forest ecosystem services, the temporal dynamics of forest outputs can also be evaluated to better understand and elaborate the trade-offs between timber and NWFPs such as mushroom.
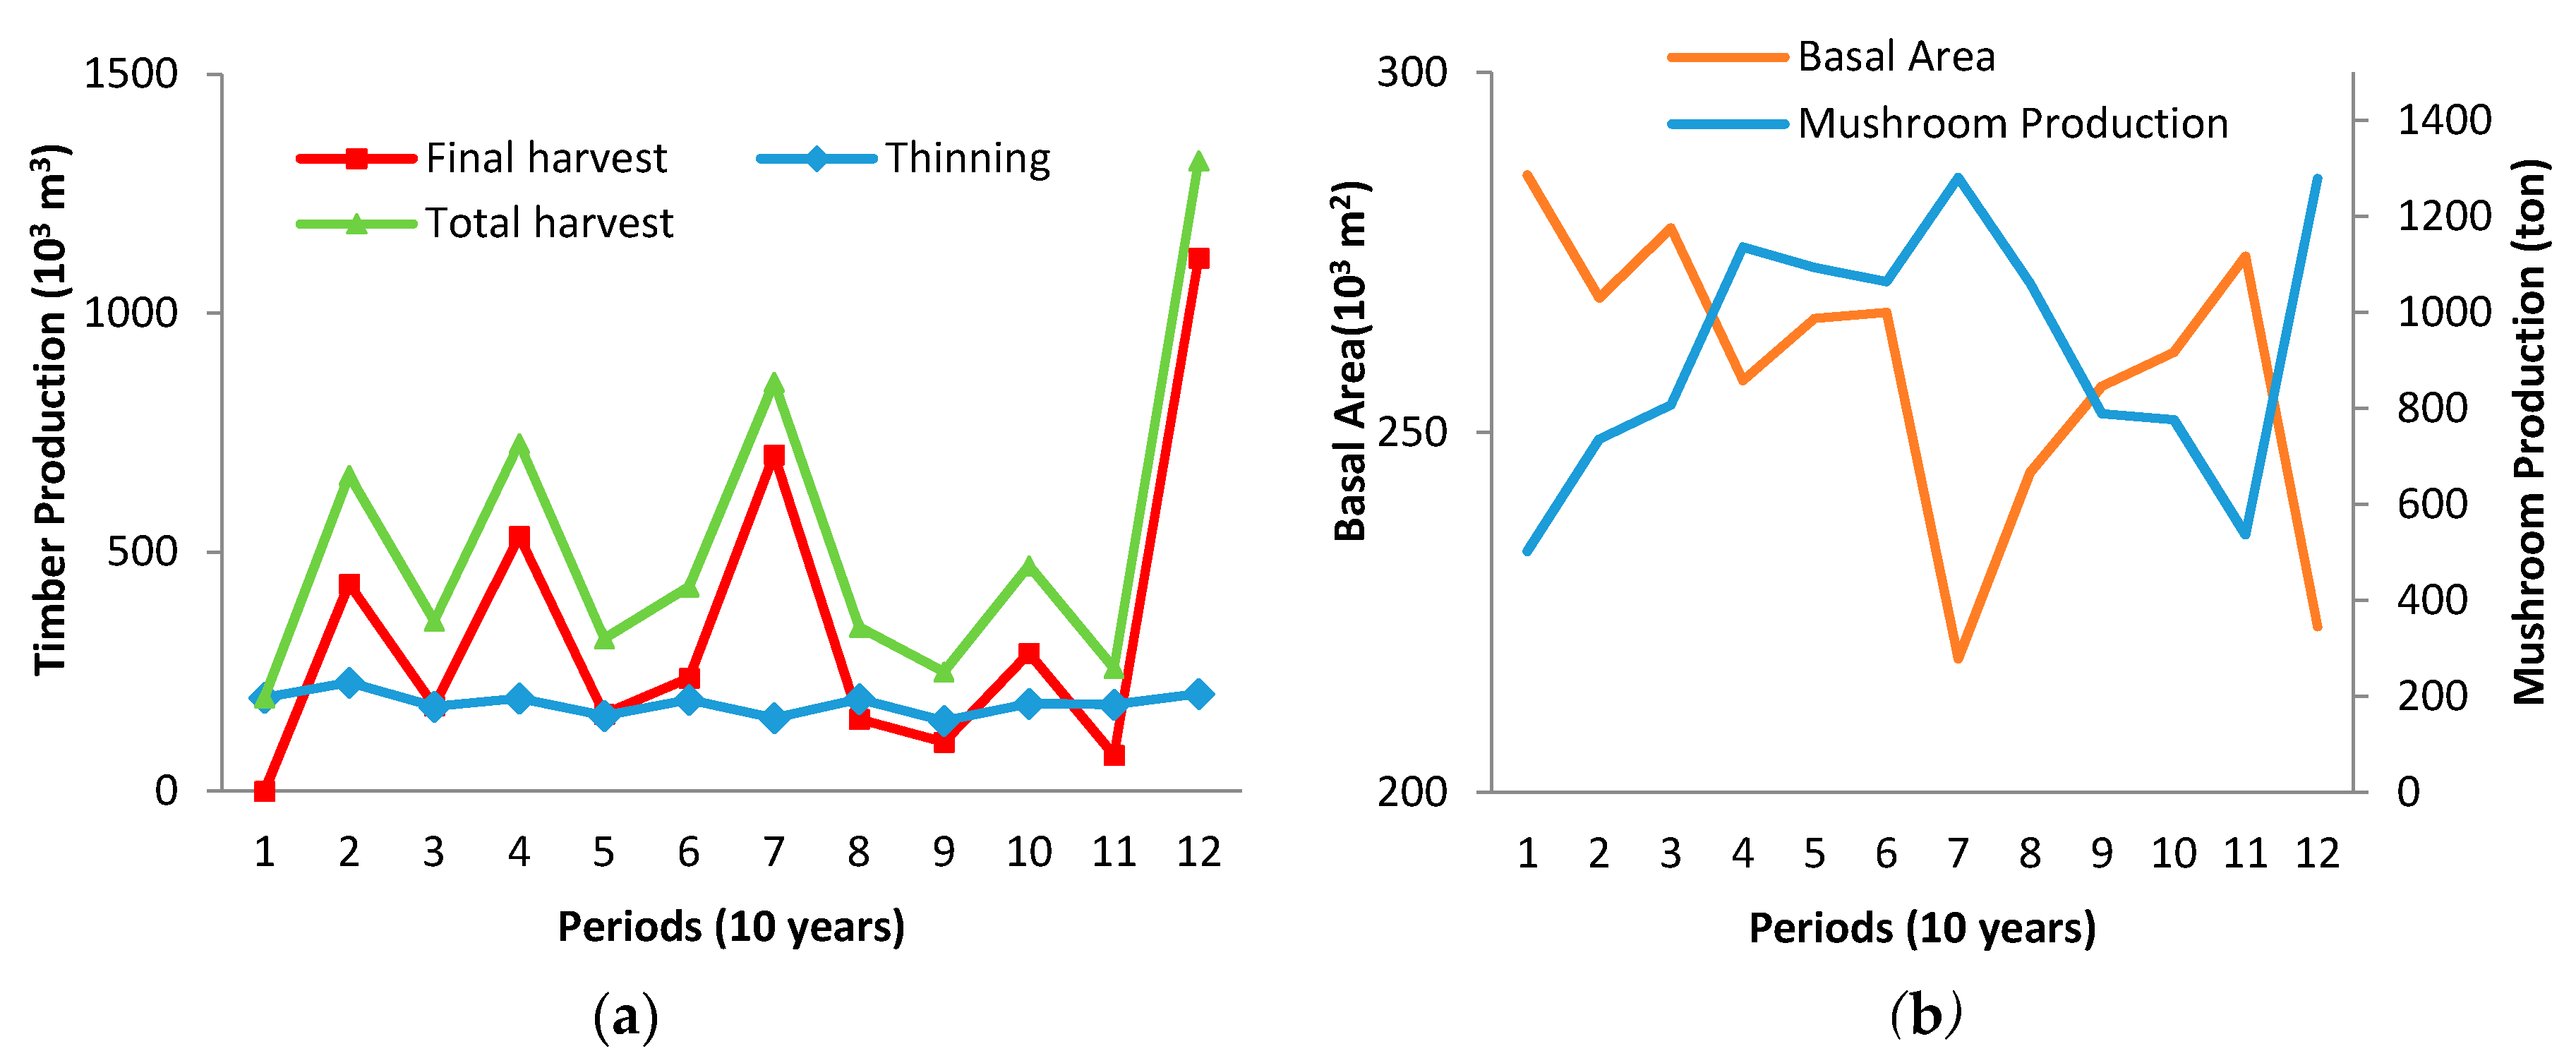
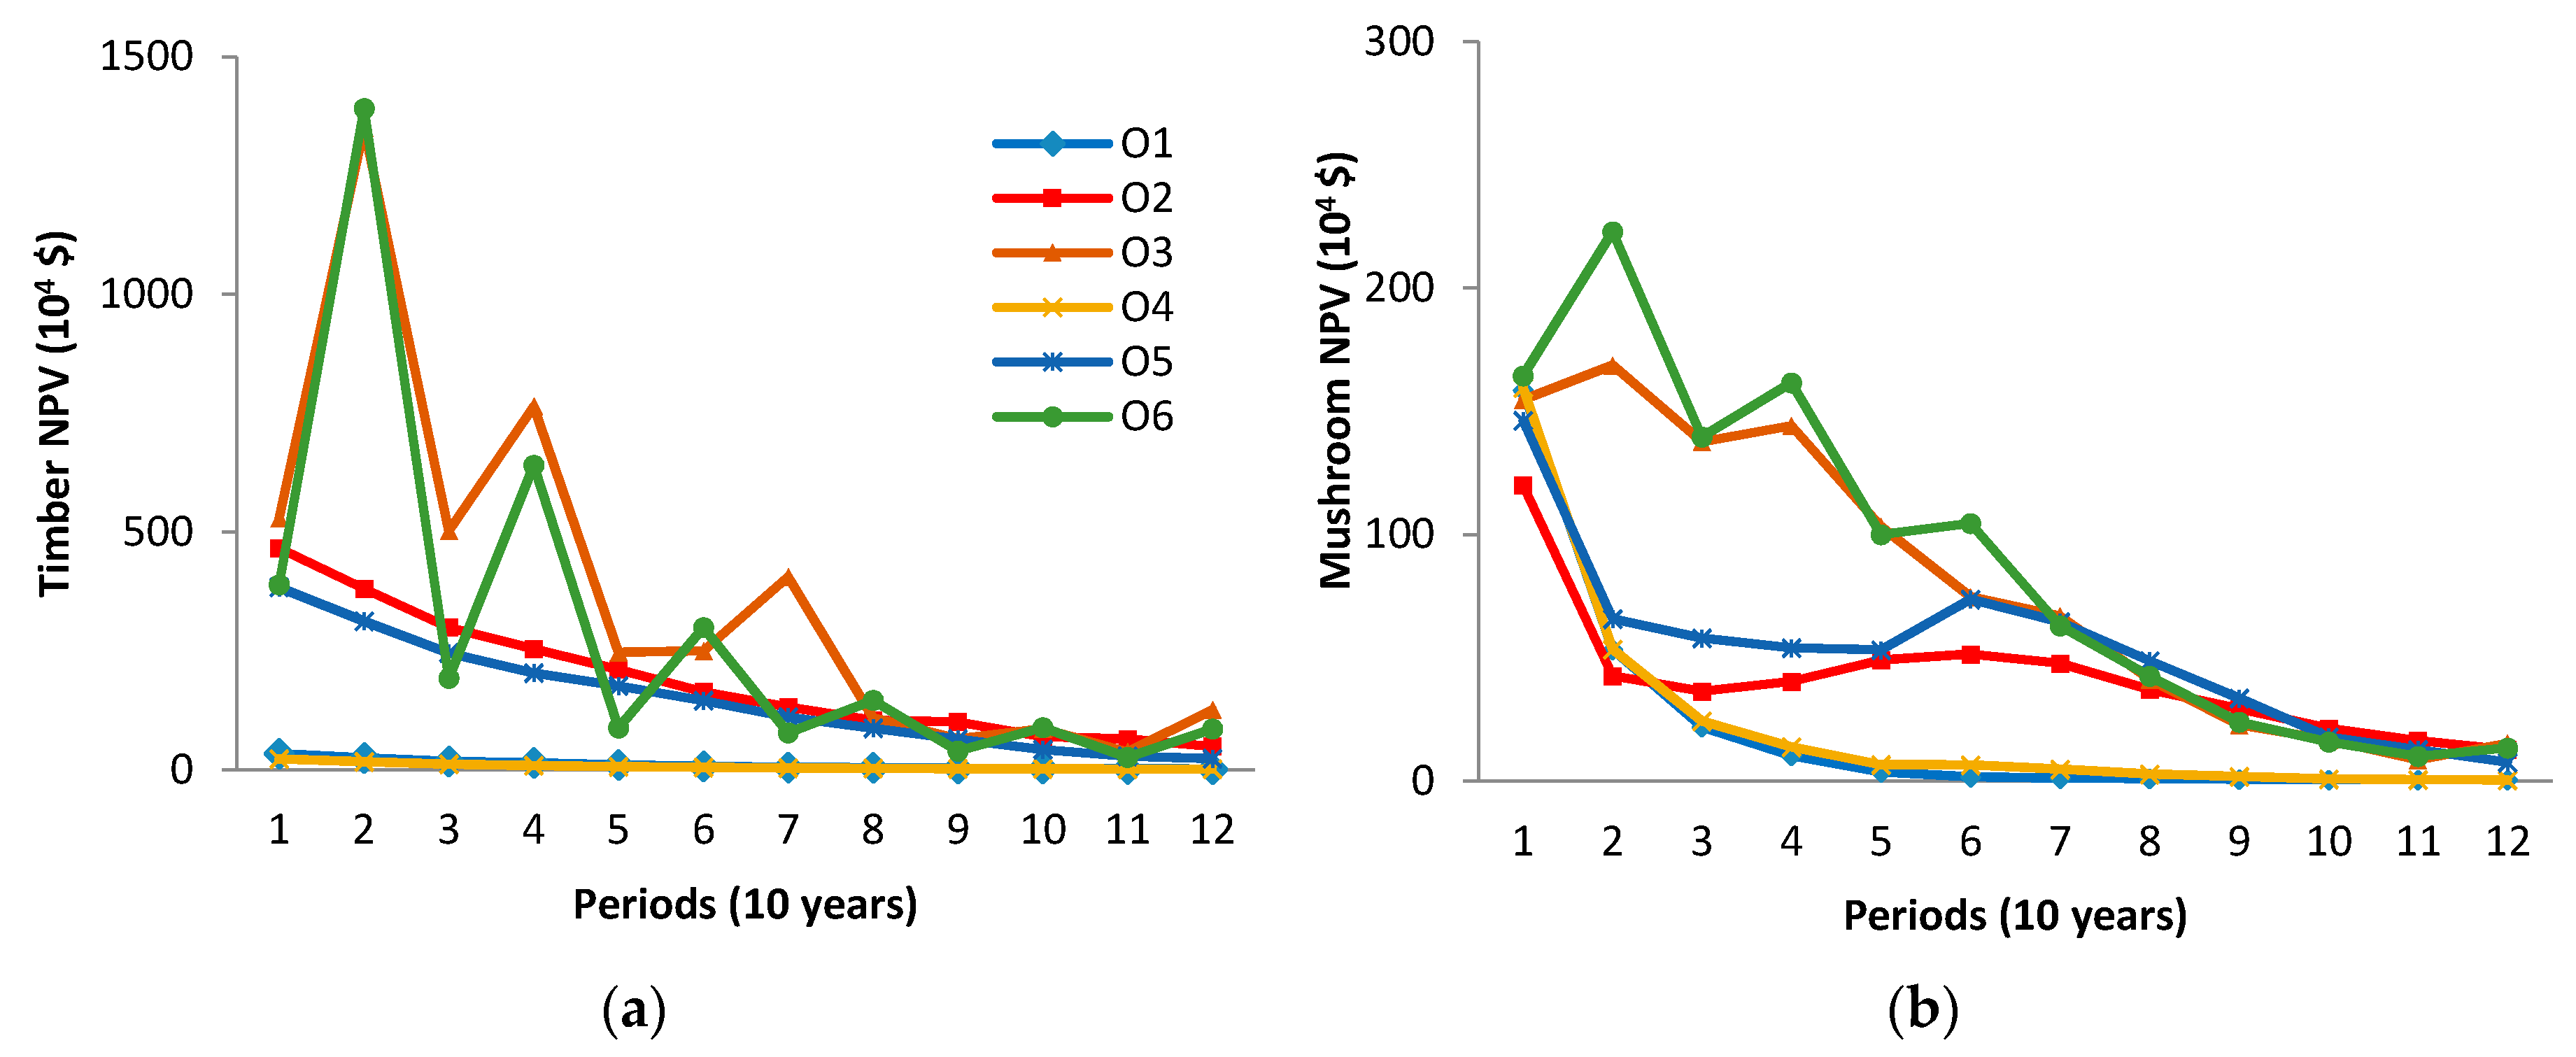
Figure 3a,b shows the periodical change of timber and mushroom productions for each forest management strategy over 120 years of planning horizon. While total timber production is rather low and regularly distributed for each period, the mushroom production shows a mostly decreasing trend in successive periods in the O1 and O4 strategies. This would be attributed primarily to the even timber flow restriction among periods. However, total timber and mushroom productions show a quite high yet unstable trend of flow over consecutive periods in the O3 and O6 strategies. Such changes in the output would easily be related to the unrestricting conditions in the related management strategies. Furthermore, the dynamics of financial incomes from timber and mushroom for all strategies over time were evaluated and illustrated in
Figure 4a,b. The similar results about mushroom and timber productions in successive periods were observed with respect to the NPV of both forest ecosystem services.
Each management strategy is unique and thus may need to be further explored for better understanding of forest dynamics and trade-offs between mushroom and timber production.
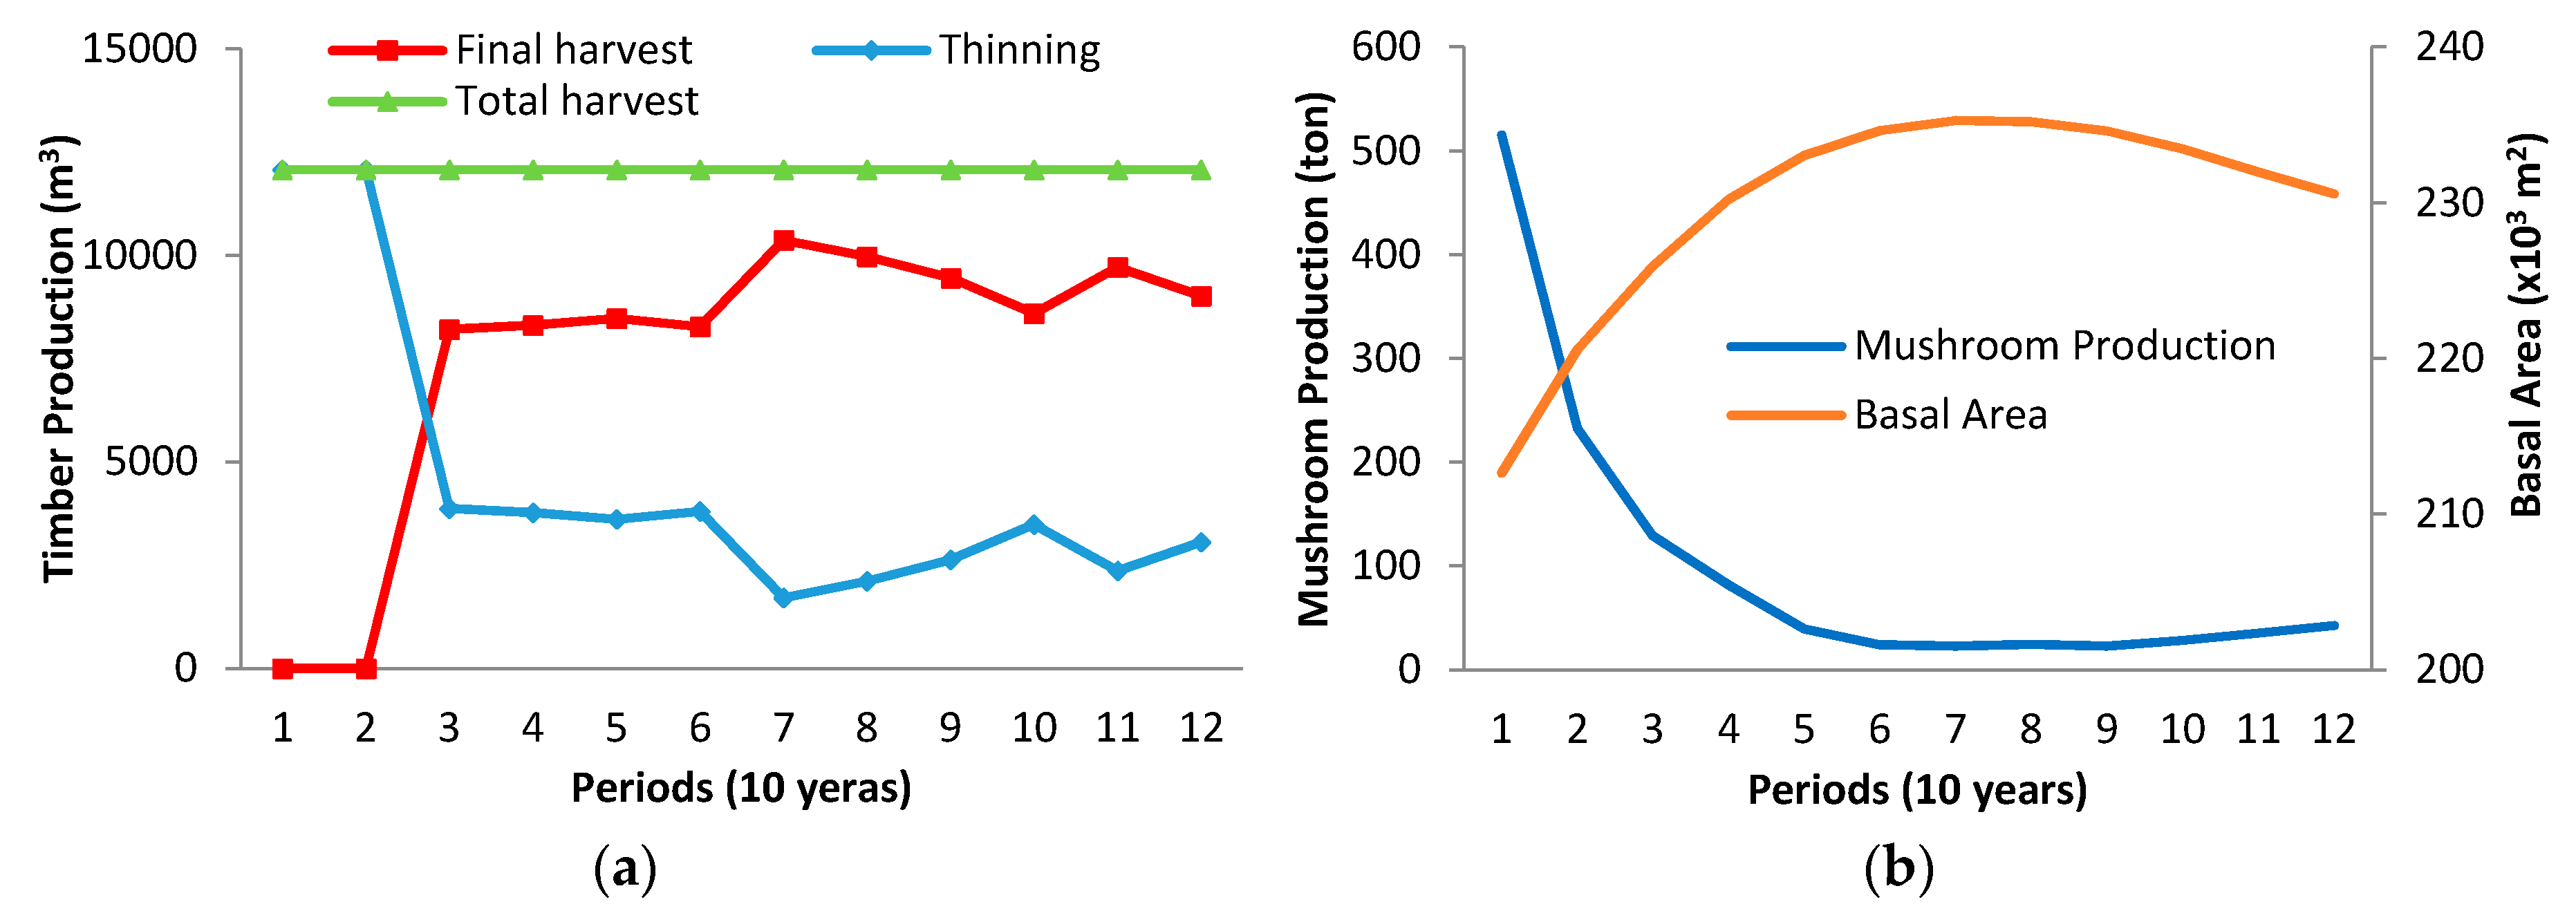
Figure 5a,b shows the relationships between some stand parameters and the amount of mushroom for the strategy O1. Here, the basal area showed an increasing trend for the first five periods and a decreasing trend after the ninth period. The level of mushroom production, however, showed the opposite trend. It can be seen in
Figure 5 that increasing basal area decreases mushroom production and vice versa. Some studies [
8,
9] observed similar results in circumstances when the highest mushroom production occurs at a lower basal area from 10 to 20 m
2/ha in pine stands. In another study [
10], the authors showed that when the basal area is removed from 10 to 35 m
2/ha with a thinning experiment, the productivity of
Lactarius mushroom increases. This result could be explained with the dynamics of growing stock. As is already known, growing stock is an important performance indicator in analyzing the effects of management alternatives on forest developments including mushroom production. According to the results, regeneration of the present older stands that have slower growth rate creates more basal area and thus results in lower amounts of mushroom production and its NPV. As indicated earlier, the regenerated stands are assumed to develop along with a regulated forest with an optimal stand growth pattern that has faster growth rates than that of current stands. In short, it could be stated that while some silvicultural treatments such as selective cutting cause a reduction in
Lactarius yield, thinning treatments cause an increase in
Lactarius yield because of the relationship between mushroom production and the basal area.
The outputs for the O3 strategy such as mushroom and timber productions, in association with the basal area changing over time, were illustrated in
Figure 6a,b. The O3 strategy focuses on the maximization of the amount of timber without any restrictions in management plans. The change of outputs indicates that the final harvest volume has affected the basal area negatively. Furthermore, the basal area relates to a reverse trend in final and total harvest volume over the planning horizon. As already indicated, there is an opposite relationship between basal area and mushroom production. In general, higher basal area generates greater stand moisture and crown closure. Therefore, increasing basal area causes a decreasing amount of light and moisture and such a situation conduces to the reduction in mushroom production.
4. Conclusions
Integrated management of both timber and NWFPs and ecosystem services in a typical forest management setting has become a major challenge in multiple use forest management planning. As a start, a conceptual framework of integration of NWFP with timber management needs to be fully developed before the realization of an integrated management planning on the ground. Here, this study presented a prototype forest management decision support systems of ETÇAP, modified to accommodate mushroom and timber production using an optimization technique of linear programming. Similar to timber inventory, mushroom inventory has already been conducted to predict the spatial distribution of mushroom existence and then associate forest stands to mushroom data to set up initial forest conditions. Mushroom productivity was estimated and modelled to project the potential growth of appropriate stands. Based on the data input, ETÇAP DSS was modified to accommodate the joint production of mushroom and timber and demonstrate the performance of forest development with a number of alternative planning strategies. The six management strategies were developed to demonstrate the capability of the DSS and understand forest dynamics with maximization of timber and mushroom productions and their NPV under various constraints such as even timber flow and 10% variations of timber production over 120 years of planning horizon.
The results indicate that it is possible to integrate both timber and mushroom productions into a real case study area of a planning unit. Timber and mushroom productions are complementary in a sense that forest management setting makes the difference. When timber and mushroom productions are maximized separately without any constraints, the highest NPV of both timber and mushroom are generated. The maximization of the mushroom NPV caused substantial decrease in total income from forest ecosystem services because of the protection of the forest to produce mushroom. The regulatory constraints limited both the production of timber and mushroom as well as their economic return. The maximization of the mushroom NPV negatively affected timber production. The optimization-based model forecasted various outputs of each management strategy over a planning horizon to set up a causative basis for better understanding of forest dynamics including the interactions and trade-offs of timber and mushroom productions. The trend of timber and mushroom productions over time is mostly regulated by either initial age class structure or management constraints. The study concludes that a joint production of timber and NWFP is quite possible and understanding of their interactions is paramount in designing and implementing multiple use forest management plans based on sustainability.
The modular structure of the DSS provides an opportunity to integrate easily any new empirical models estimating the spatial distribution and productivity of other NWFPs into the plans. The use of information technologies in the model provides additional capability to the forest management plans to be faster and sound. The user can select total amount or financial income of mushroom as an objective function. Likewise, the users can also set up the periodic level of target mushroom production as additional constraints. The ability of the model to forecast and analyze long-term effects of given forest management actions on forest values provides an opportunity to the forest owners or decision makers to evaluate a wider range of management prescriptions in the plans. However, better growth projection systems of NWFP is necessary for a comprehensive integration process and particularly spatial control of model outputs needs to be investigated to prepare on-the-ground management plans. The DSS model, however, overlooks biological and environmental risks for natural events such as fire, pollution, insect and storm damages due to its current deterministic structure. The lack of spatial objectives causes ecological and environmental problems to rise. The most important limitation of this optimization based model is the solo focus on just Lactarius mushroom. Since there are not any empirical yield models readily available for the other mushrooms, it is quite difficult for the ETÇAPOptimization model to test a larger set of management scenarios.


