Stormwater Treatment Evaluation of a Constructed Floating Wetland after Two Years Operation in an Urban Catchment


1
Covey Associates Pty Ltd., 124 Duporth Ave, Maroochydore, QLD 4558, Australia
2
Stormwater Research Group, University of the Sunshine Coast, Sippy Downs Drive, Sippy Downs, QLD 4558, Australia
*
Author to whom correspondence should be addressed.
Sustainability 2017, 9(10), 1687; https://doi.org/10.3390/su9101687
Submission received: 6 September 2017
/
Revised: 14 September 2017
/
Accepted: 20 September 2017
/
Published: 22 September 2017
Abstract
:Constructed Floating Wetlands (CFW) for stormwater treatment are increasingly used to treat urban runoff. However, studies of large-scale systems and the long-term evaluation of their treatment efficiency are scarce. This article presents the final results of a two-year study of the pollutant removal performance of a CFW in a stormwater pond capturing runoff from a low-residential catchment in South-East Queensland (Australia) under subtropical conditions. Although the CFW treatment area to catchment ratio was only 0.14%, the results demonstrated a significant removal of both Total Suspended Solids (TSS) and Total Phosphorus (TP) from the stormwater inflows by the CFW. The efficiency ratios for TSS and TP were 81% and 52%, respectively. While the removal rate for total nitrogen was not significant for the CFW evaluated in this study, the ER was still 17%. However, the ERs for nitrate and nitrogen oxide were both 47%. The study results suggest that it may be possible to increase the pollution removal performance of the CFW by upsizing the system and including intermittent re-aeration zones in the surrounding stormwater pond. The results of this research study clearly demonstrate that CFW can be an effective treatment solution for the removal of pollution from urban stormwater runoff.
1. Introduction
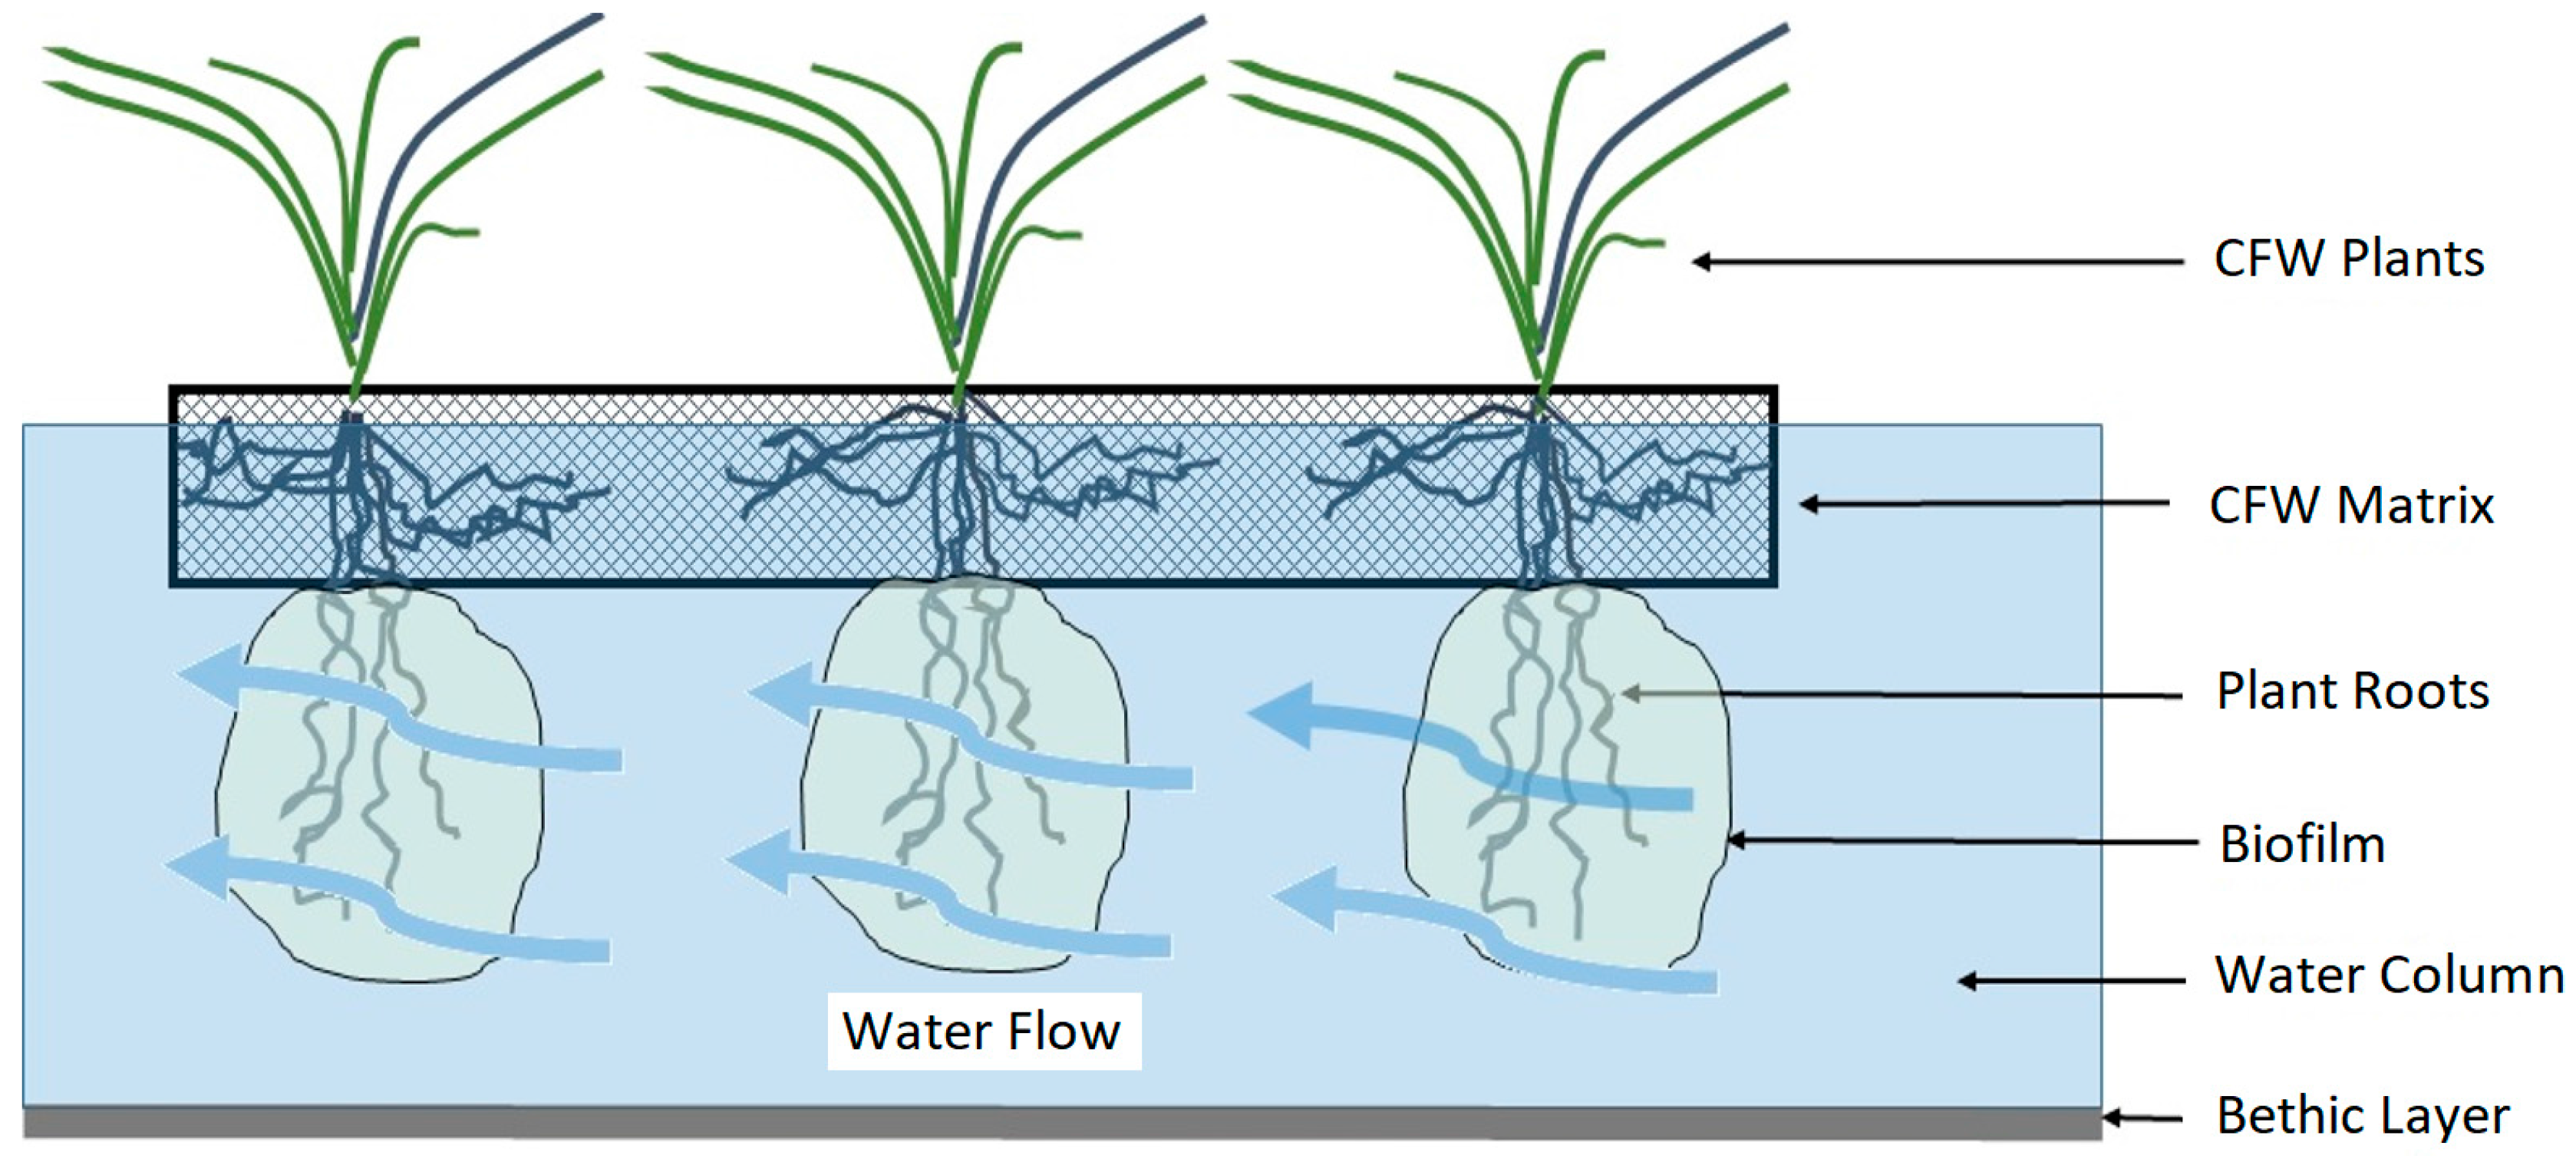
Constructed Floating Wetlands (CFW) consist of a buoyant artificial medium (i.e., a planting mat) which facilitates plant root growth into the water column beneath it. The artificial medium can be manufactured from a variety of materials including woven plastic (Figure 1). Additional buoyancy is often achieved by either attaching lightweight materials underneath the mats, by way of a hollow frame structure, or by injecting synthetic foam into the mats. An organic layer, such as coconut fibre, is often added to the top of the mats to serve as a growth medium for the wetland plants. The CFW islands are generally anchored to avoid drifting, to ensure they are located where they can intercept the most polluted inflow water, to allow maintenance access, and to cater for water level variations within the water body.
The principle for CFW design has been adapted from naturally occurring, floating vegetated islands in freshwater lakes and ponds. Naturally occurring, floating vegetated islands are generally comprised of a matrix of floating organic material with plants growing at the water surface. The buoyant forces for the islands are produced from organic decomposition gas emissions (N2 and CO2 under aerobic conditions and, additionally, CH4 under anoxic conditions) that are trapped beneath the organic mat, as well as air stored within the roots and leaves of the island vegetation [1,2].
The main treatment mechanism of CFWs is performed by the roots of CFW plants. The roots can substantially reduce the velocities of the inflowing stormwater, thereby promoting settlement of the suspended solids. They also physically filter suspended solids through the interaction of plant roots in the water (Figure 1) which can grow to a depth of up to three metres in length [3]. Since biofilm forms on the root mass below the water surface, additional water treatment processes occur through adhesion, filtration, nutrient uptake (direct use by plants), and sequestration [4,5]. The oxygen depletion under the mats can provide ideal conditions for denitrification, due to low oxygen levels and a carbon-rich environment from plant debris [6].
An increasing amount of research has been conducted on CFWs over the last 10 years. However, most of the previous research has been conducted as mesocosm studies in laboratory-type settings. In order to assess the true stormwater treatment performance of CFWs, evaluations of large-scale, operational field treatment facilities are required.
A literature review identified six previous studies [5,6,7,8,9,10] which investigated the removal of total suspended solids (TSS) and nutrients from stormwater ponds by CFWs at seven different locations. All of the stormwater ponds investigated had a surface area of 100 m2 or larger. The variation in results among the six studies was found to be quite high, which made meaningful comparisons difficult.
This paper describes the results of a two-year field study undertaken to evaluate the pollution removal performance of a CFW designed to treat stormwater runoff from an existing urban development in Queensland, Australia. Preliminary results of this study were presented in Nichols et al. [11] and Schwammberger et al. [12].
2. Materials and Methods
2.1. Site Description
The monitoring site was located at Bongaree, on Bribie Island in Queensland, Australia. The entire site is zoned low-density residential and has a total area of 42.3 ha. The contributing catchment area of the development site treated by the CFW is 7.46 ha (Figure 2), with 2.2 ha comprised of a development under construction. The CFW installation (101 m2) was sized as approximately 0.14% of the contributing catchment area. This treatment area to catchment ratio is very small compared with other treatment systems. For example, bioretention systems are often sized at between 1% and 2% of the catchment, while constructed wetlands can be between 4% and 8% [13].
Stormwater runoff from the catchment was collected by road kerb inlets (catch basins) and conveyed via an underground drainage network and stormwater channel to a stormwater pond containing the CFW. Flow from the channel into the pond was immediately directed to the CFW treatment zone forebay using flexible, impermeable polyvinyl chloride (PVC) curtains, which were secured to the sides of the CFW and the pond bed. This was done to prevent short-circuiting of the flows and to ensure all flow passed through and was treated by the CFW.
The modular CFW was constructed using four 50 mm thick layers of recycled Polyethylene terephthalate (PET) fibre. The four PET layers were injected with marine-grade expanding foam to provide sufficient buoyancy for the wetlands and to ensure an appropriate amount of freeboard was available for the plant roots to grow. This PET matrix was covered with a natural coir mat and planted-out with a sedge mono-culture (Carex appressa) at a density of approximately three plants/m2 (Figure 3).
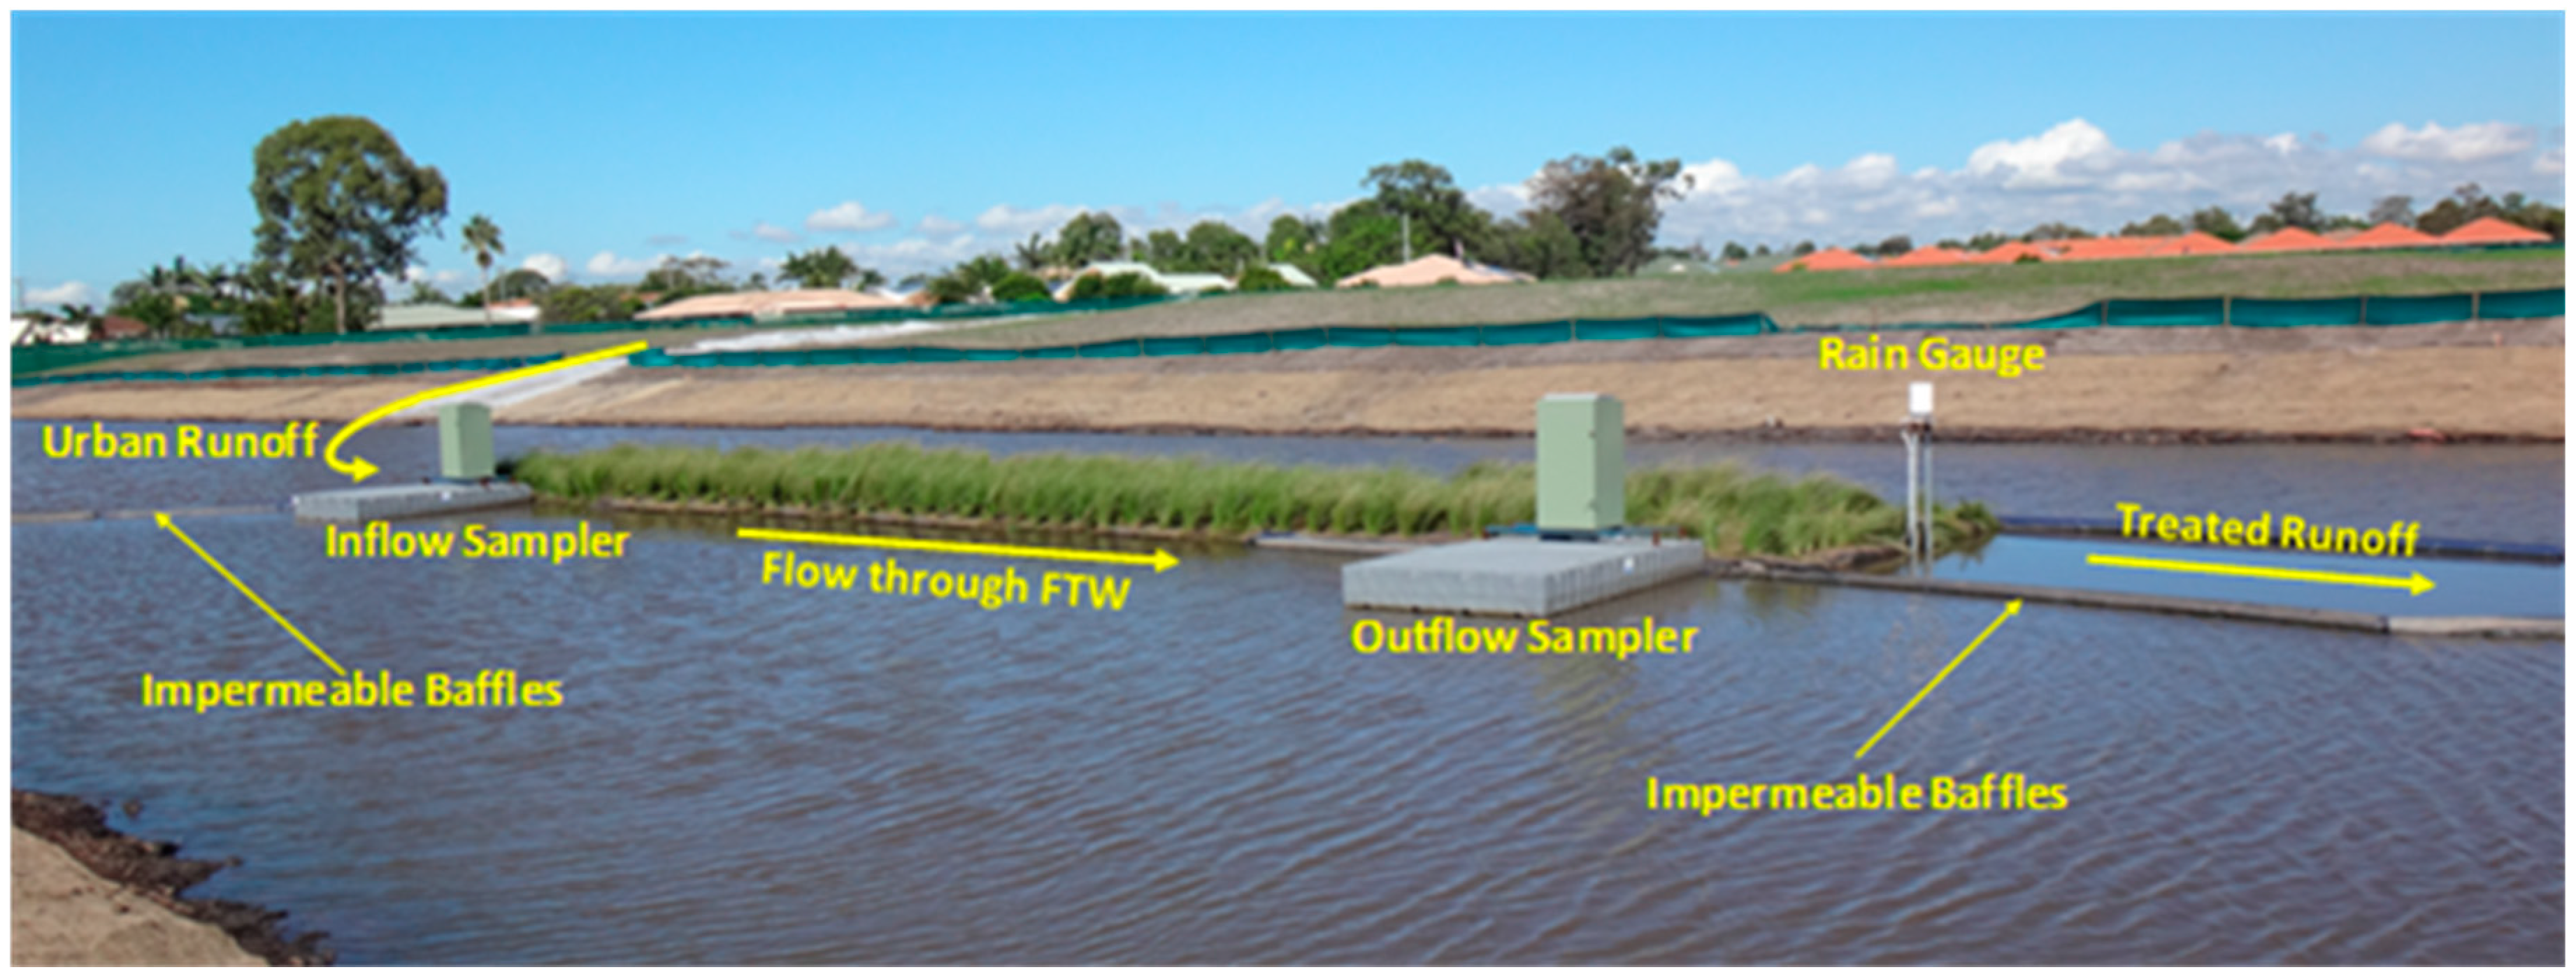
Each of the 11 individual CFW modules was 9.2 m2 in area (total area of 101 m2). The area of the CFW treatment zone (including a sediment forebay) for the study was 130 m2. Installation of impermeable baffles along the sides of the CFW ensured that 100% of the water treatment surface area was covered with CFW. The baffles also ensured that all stormwater flowing into the pond was treated by the CFW (Figure 3). The overall size of the stormwater pond was 5048 m2.
2.2. Sampling Protocol and Methodology
A predetermined sampling protocol was used to identify qualifying rainfall events (Table 1). This protocol was developed to support an objective evaluation of proprietary products used for stormwater runoff treatment, based on the protocol methodology described by the United States Environmental Protection Agency’s (USEPA) Stormwater BMP Monitoring Manual [14] and Auckland Regional Council’s Proprietary Device Evaluation Protocol (PDEP) for Stormwater Quality Treatment Devices [15]. While this protocol was developed prior to the implementation of the Australian Stormwater Quality Improvement Devices Evaluation Protocol, or SQIDEP [16], it is still compliant with it.
Automatic water samplers (ISCO GLS) were installed at the inlet and outlet of the CFW to enable the stormwater treatment performance of the CFW to be evaluated (Figure 3). The sampling equipment was triggered when a tipping bucket rain gauge recorded ≥ 2 mm rainfall in 30 min, and the flow meter (Starflow ultrasonic probe) simultaneously recorded ≥ 0.5 L/s. Samples were collected by the auto-samplers at 5000 L intervals thereafter at the CFW inlet and outlet points until flow ceased.
To account for the potential lag in flow beneath the CFW, a further two sub-samples were taken after flow had dropped below 0.5 L/s. Sample aliquots (200 mL) were composited within the automatic sampler. The composite samples were collected by an independent and suitably qualified contractor within six hours of the end of the rainfall event and delivered to a water laboratory accredited by the National Association of Water Testing Authorities in Australia (NATA) for analysis.
A range of water quality parameters were measured for all water samples, including Total Suspended Solids (TSS), Total Nitrogen (TN), Total Phosphorous (TP), Total Kjeldahl nitrogen (TKN), Ammonia (NH3), Nitrite (NO2−), and Nitrates (NO3−). The sum of NO2− and NO3− is expressed as Nitrogen Oxide (NOx). In order to determine whether the CFW removed more of any particular particle size range, Particle Size Distributions (PSD) for each sample were undertaken using a Malvern Mastersizer 3000 laser particle size analyser.
A range of metrics listed in the SQIDEP protocol [16] were used in order to provide a representative performance evaluation to account for the highly-variable results that were expected in the study. These included the Event Mean Concentration (EMC—Equation (1)) method, which is used to determine the average reduction in pollutant concentration for a given stormwater treatment practice.
The Pollutant Concentration Removal Efficiency (CRE—Equation (2)) is used to determine the reduction in pollutant concentration for a given stormwater treatment device.
The efficiency ratio (ER—Equation (3)) is defined in terms of the average pollutant EMCs calculated over the duration of the analysed storm events for a given stormwater treatment device.
2.3. Statistical Significance
The sampling design resulted in statistically-random water samples with unknown pollutant concentrations. Studies [17] on the probability distribution of stormwater quality parameters on a stormwater pond have concluded that during single events, the water quality parameters follow either normal or lognormal distributions, depending on the parameter characteristic and catchment area. Without further knowledge of the pollutant runoff behaviour from the catchment area, both normal and lognormal sample value distributions were assumed to be equally likely in this study.
Following the sampling design of this study, the resulting concentrations from the laboratory analyses represent a mean value with an unknown standard deviation. The distributions of pollutant concentrations were not assessed. Hence, both distributions—normal and lognormal—can be considered as likely. The resulting distribution for both raw data and log-transformed data follow a t-distribution [18]. Therefore, a paired Student’s t-test was performed to evaluate whether the water quality analysis results demonstrated that the treated outflow was statistically different from the inflow.
3. Results
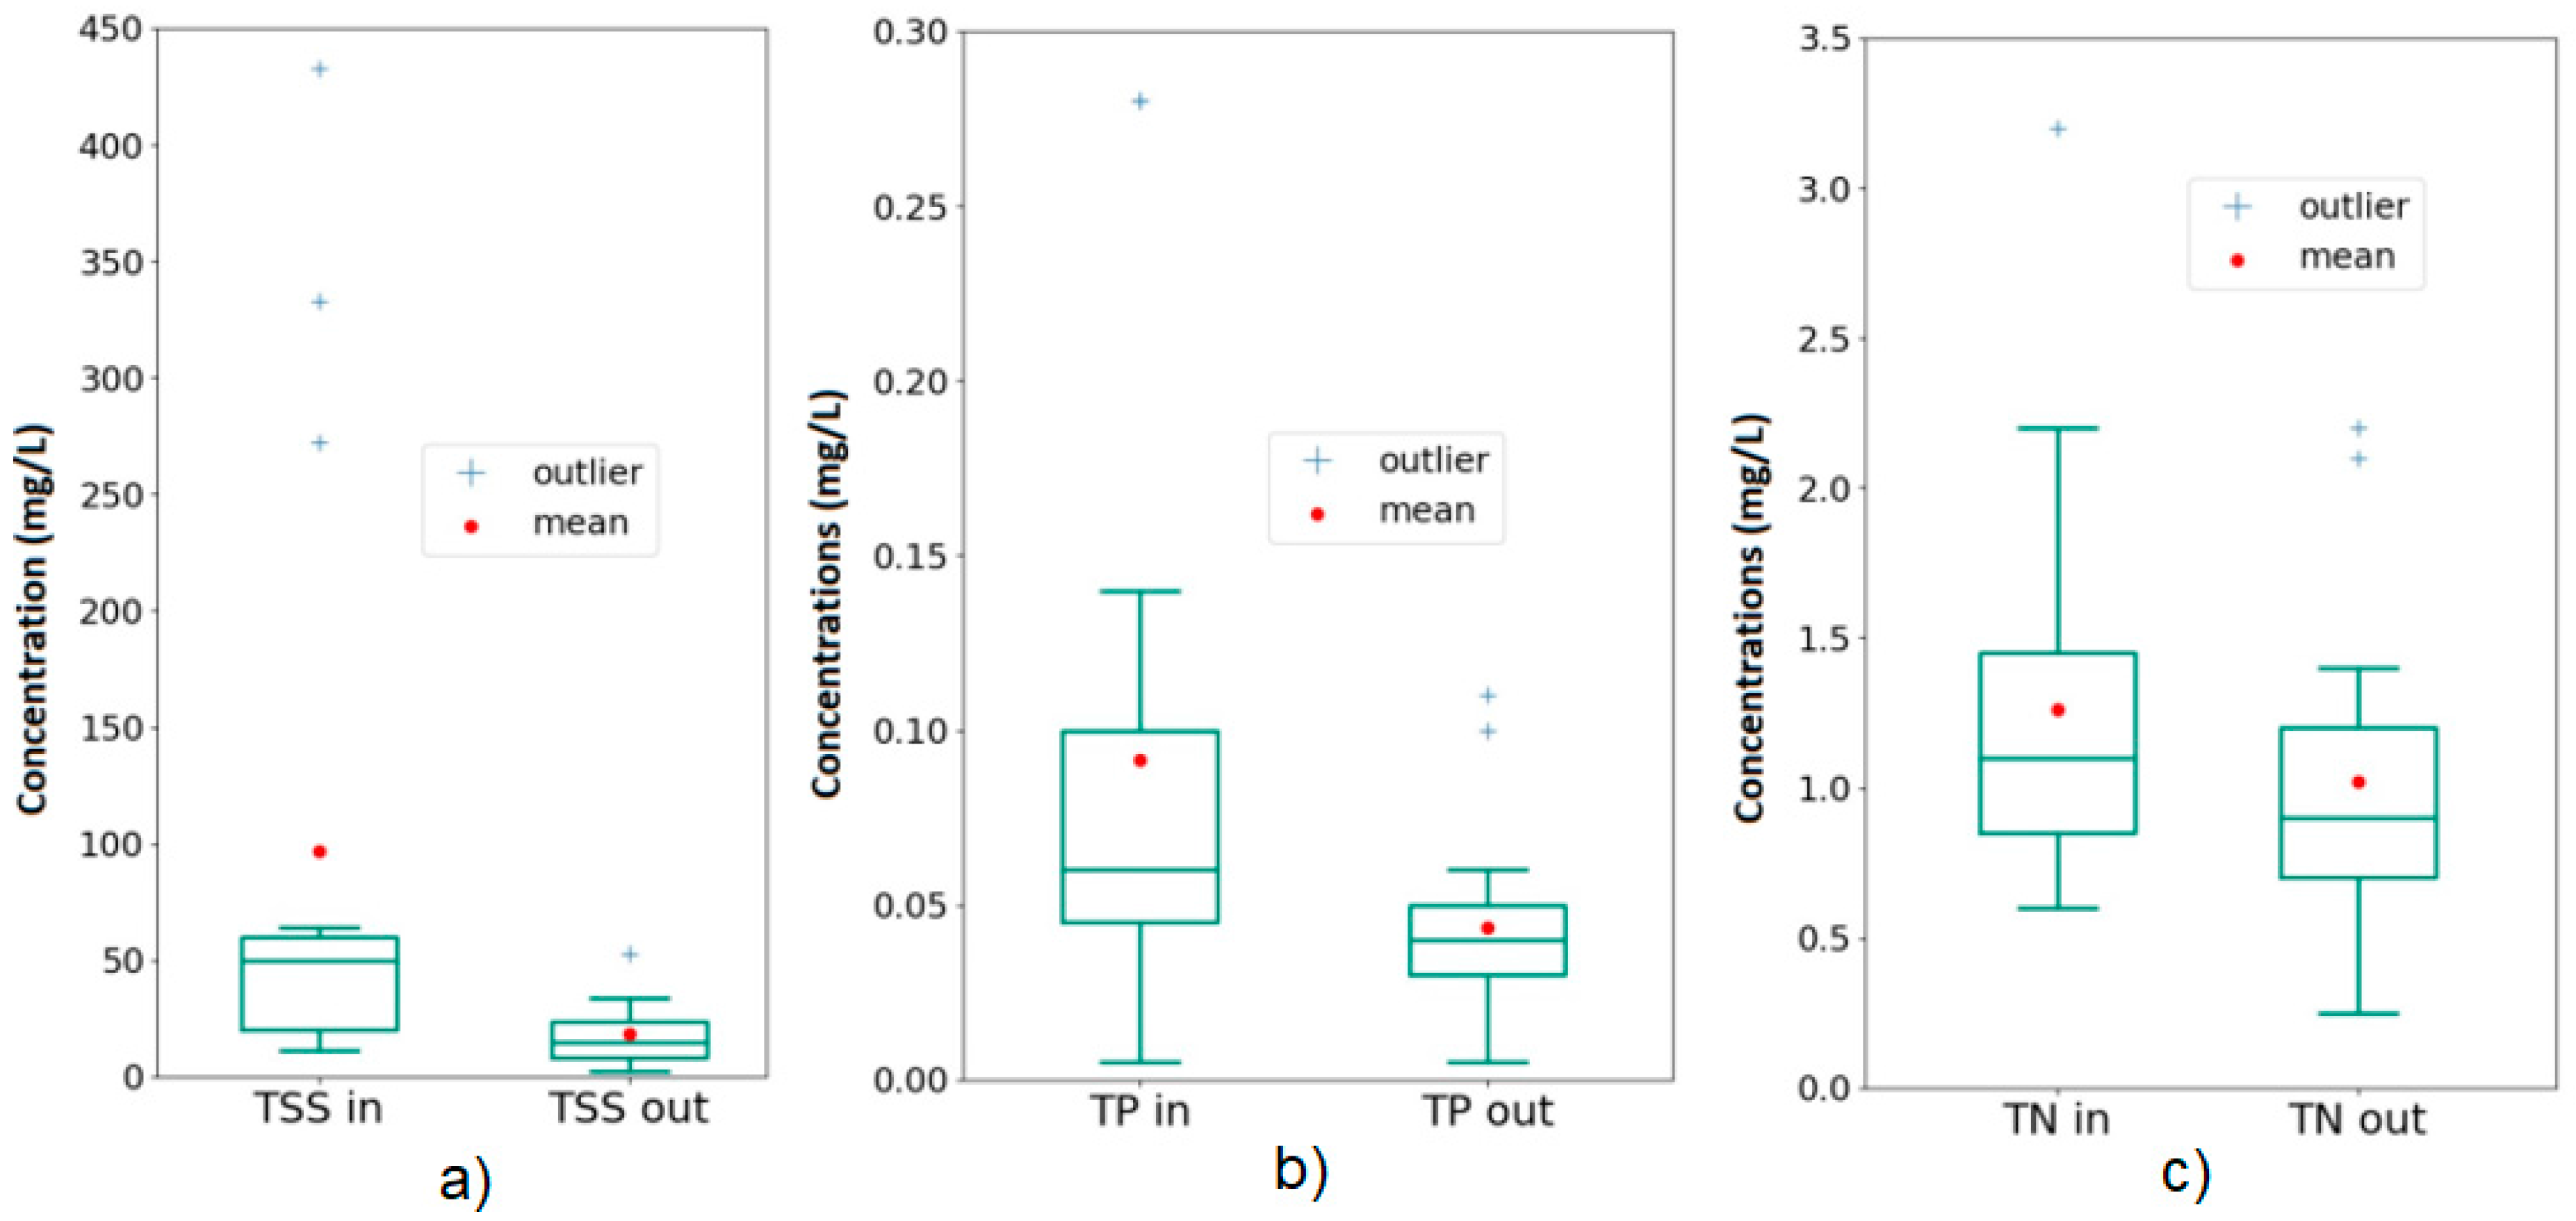
During 23 months of monitoring, 15 qualifying events were recorded (Table 2) with rainfall depths ranging between 3.4 mm and 25.6 mm. As indicated in Table 2, several inflow and outflow EMC values were below the limit of reporting (LOR) value, so these were replaced with the LOR. The calculated ERs (Table 3) are therefore a lower limit of the theoretical removal efficiency (conservative approach). Table 2 and Figure 4 shows that the observed influent pollution concentrations for the measured parameters were highly variable between the individual rainfall events.
The efficiency ratios ERs (Table 3) were highly variable between individual rainfall events for the parameters measured. This is evident by the large CRE standard deviations. The ERs were found to be less than the values specified by the Queensland State Planning Policy [19] regulations, which are 80% for TSS, 60% for TP, and 45% for TN, respectively. However, Table 3 also shows that the outflow concentrations for TSS, TP, NO3-N, and NOx-N were significantly (p < 0.05) lower than the inflow concentrations, irrespective of the underlying distribution.
Observed concentrations for the different inorganic nitrogen compounds are shown in Figure 5. As can be seen in Figure 4 and Figure 5, the mean values of the observed parameters are all substantially higher than the median values. This clearly indicates a strong outlier influence. In the case of the inflow values of TSS (Figure 4a), it even leads to a mean value higher than the 75th percentile. For TSS, TP, and NH3-N, the ER differs considerably from the CRE (Table 3), which is also an indication of the influence of the outliers of the highly variable pollution concentrations observed in this study.
4. Discussion
The inflow pollutant concentrations of the stormwater runoff (Table 2) were highly variable and were often at, or very close to, the LOR values. These concentrations were in the lower range of those identified as “typical” for urban catchments in South-East Queensland (SEQ) [20]. Low inflow concentrations make reductions more difficult. At such low pollutant concentrations, even minor differences can have a significant effect on the performance metrics. Therefore, performance metrics calculated from water samples with pollutant concentration values near, or at, the LOR should be viewed in context.
Fletcher et al. [20] reported EMCs of 130 mg/L for TSS, 0.28 mg/L for TP, and 1.6 mg/L for TN, for urban runoff in South-East Queensland. However, the EMCs observed in the current study (using Equation (1)) were considerably lower, at 97 mg/L for TSS, 0.09 mg/L for TP, and 1.3 mg/L for TN.
In addition, when considering inflow concentrations, the catchment specifics should also be considered. For example, the runoff from low-density residential areas, as presented in this study, may have very different pollutant concentrations from that of highway runoff. As previously discussed, it is difficult to compare treatment performance results of different CFW studies under field conditions when experimental designs vary or when pollutant concentrations are very low.
The ER results (Table 3) demonstrate significant reductions of TSS (81%) and TP (52%) by the CFW. However, only the TSS result exceeded the reduction targets (80% for TSS, 60% for TP, and 45% for TN) set by the Queensland State Planning Policy [19]. The ER for TN for the CFW evaluated in this study was found to be 17%, which is lower than the required 45% reduction. One reason for this low TN reduction may be due to the relatively small area of the CFW. The treatment area ratio for the study CFW system was only 0.14% of the contributing catchment area. It should be noted that only the removal efficiency of the CFW itself was evaluated in the study. The study results excluded any potential influences due to the adjacent pond area due to the impermeable baffles.
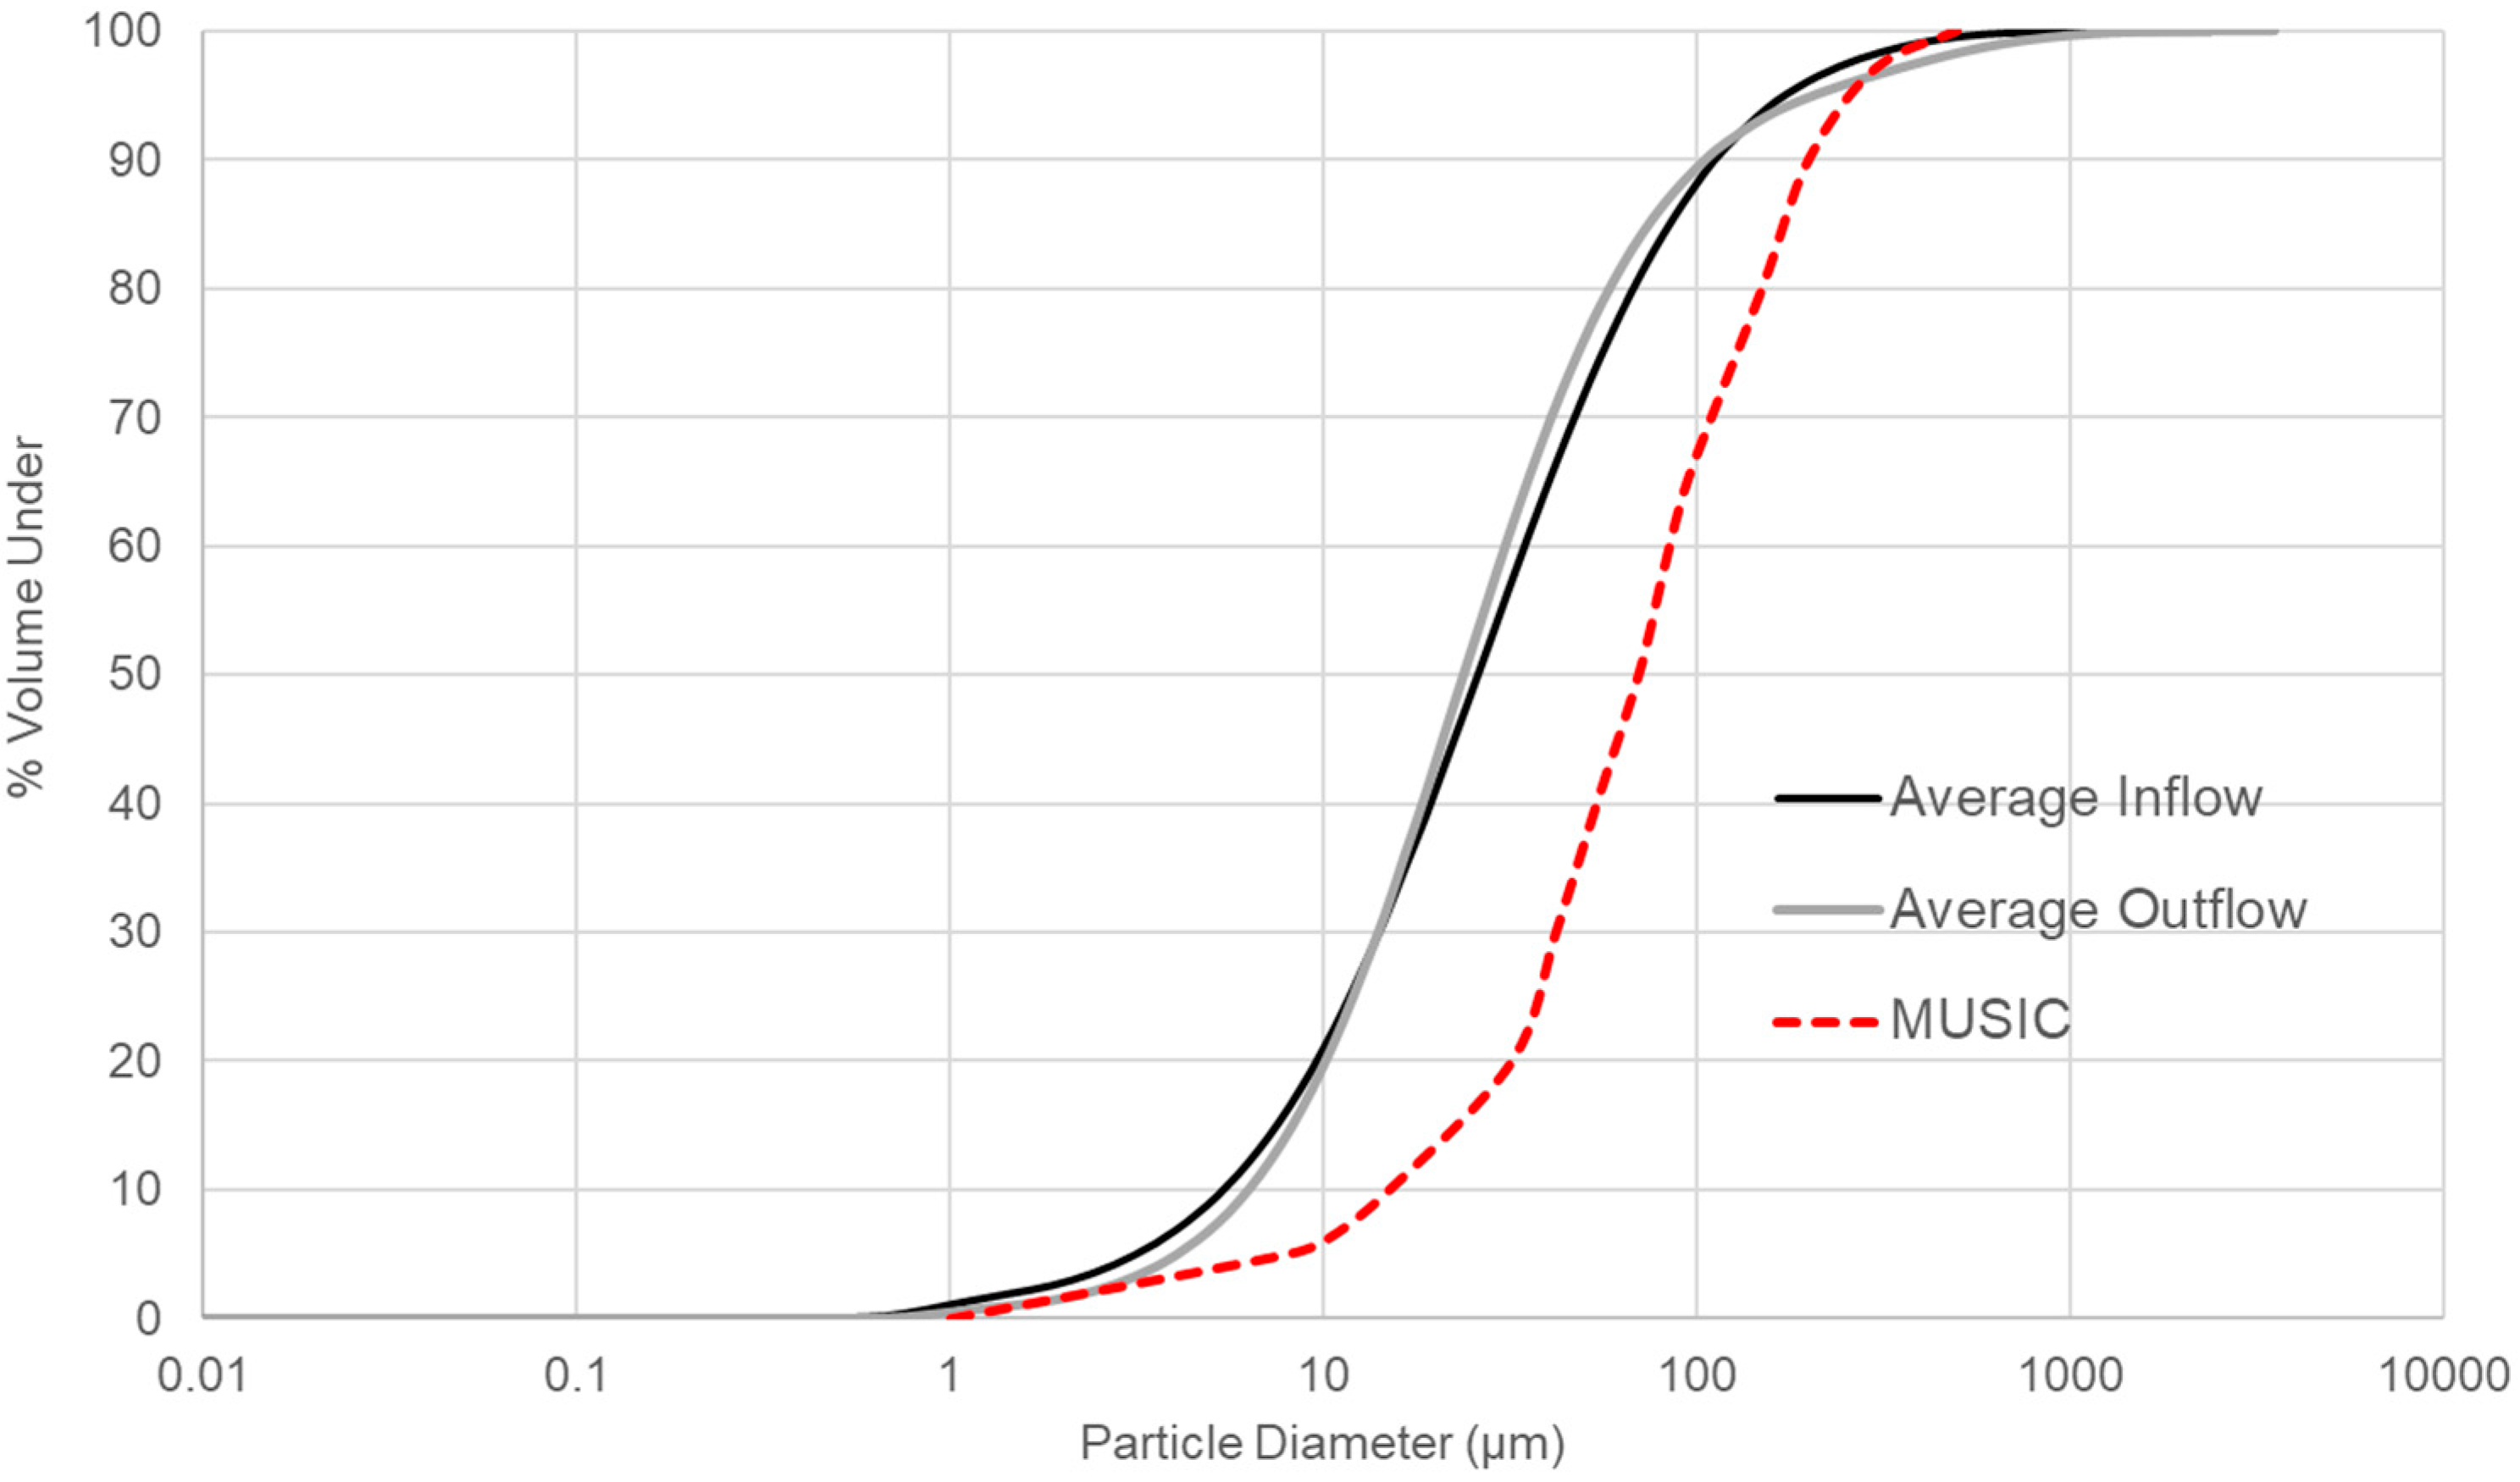
The results in Table 4 and Figure 6 indicate that the inflow and outflow PSD sizes for the CFW were very close. This suggests that the CFW did not favour the removal of any particular particle size range; rather, it removed particles of all sizes equally well.
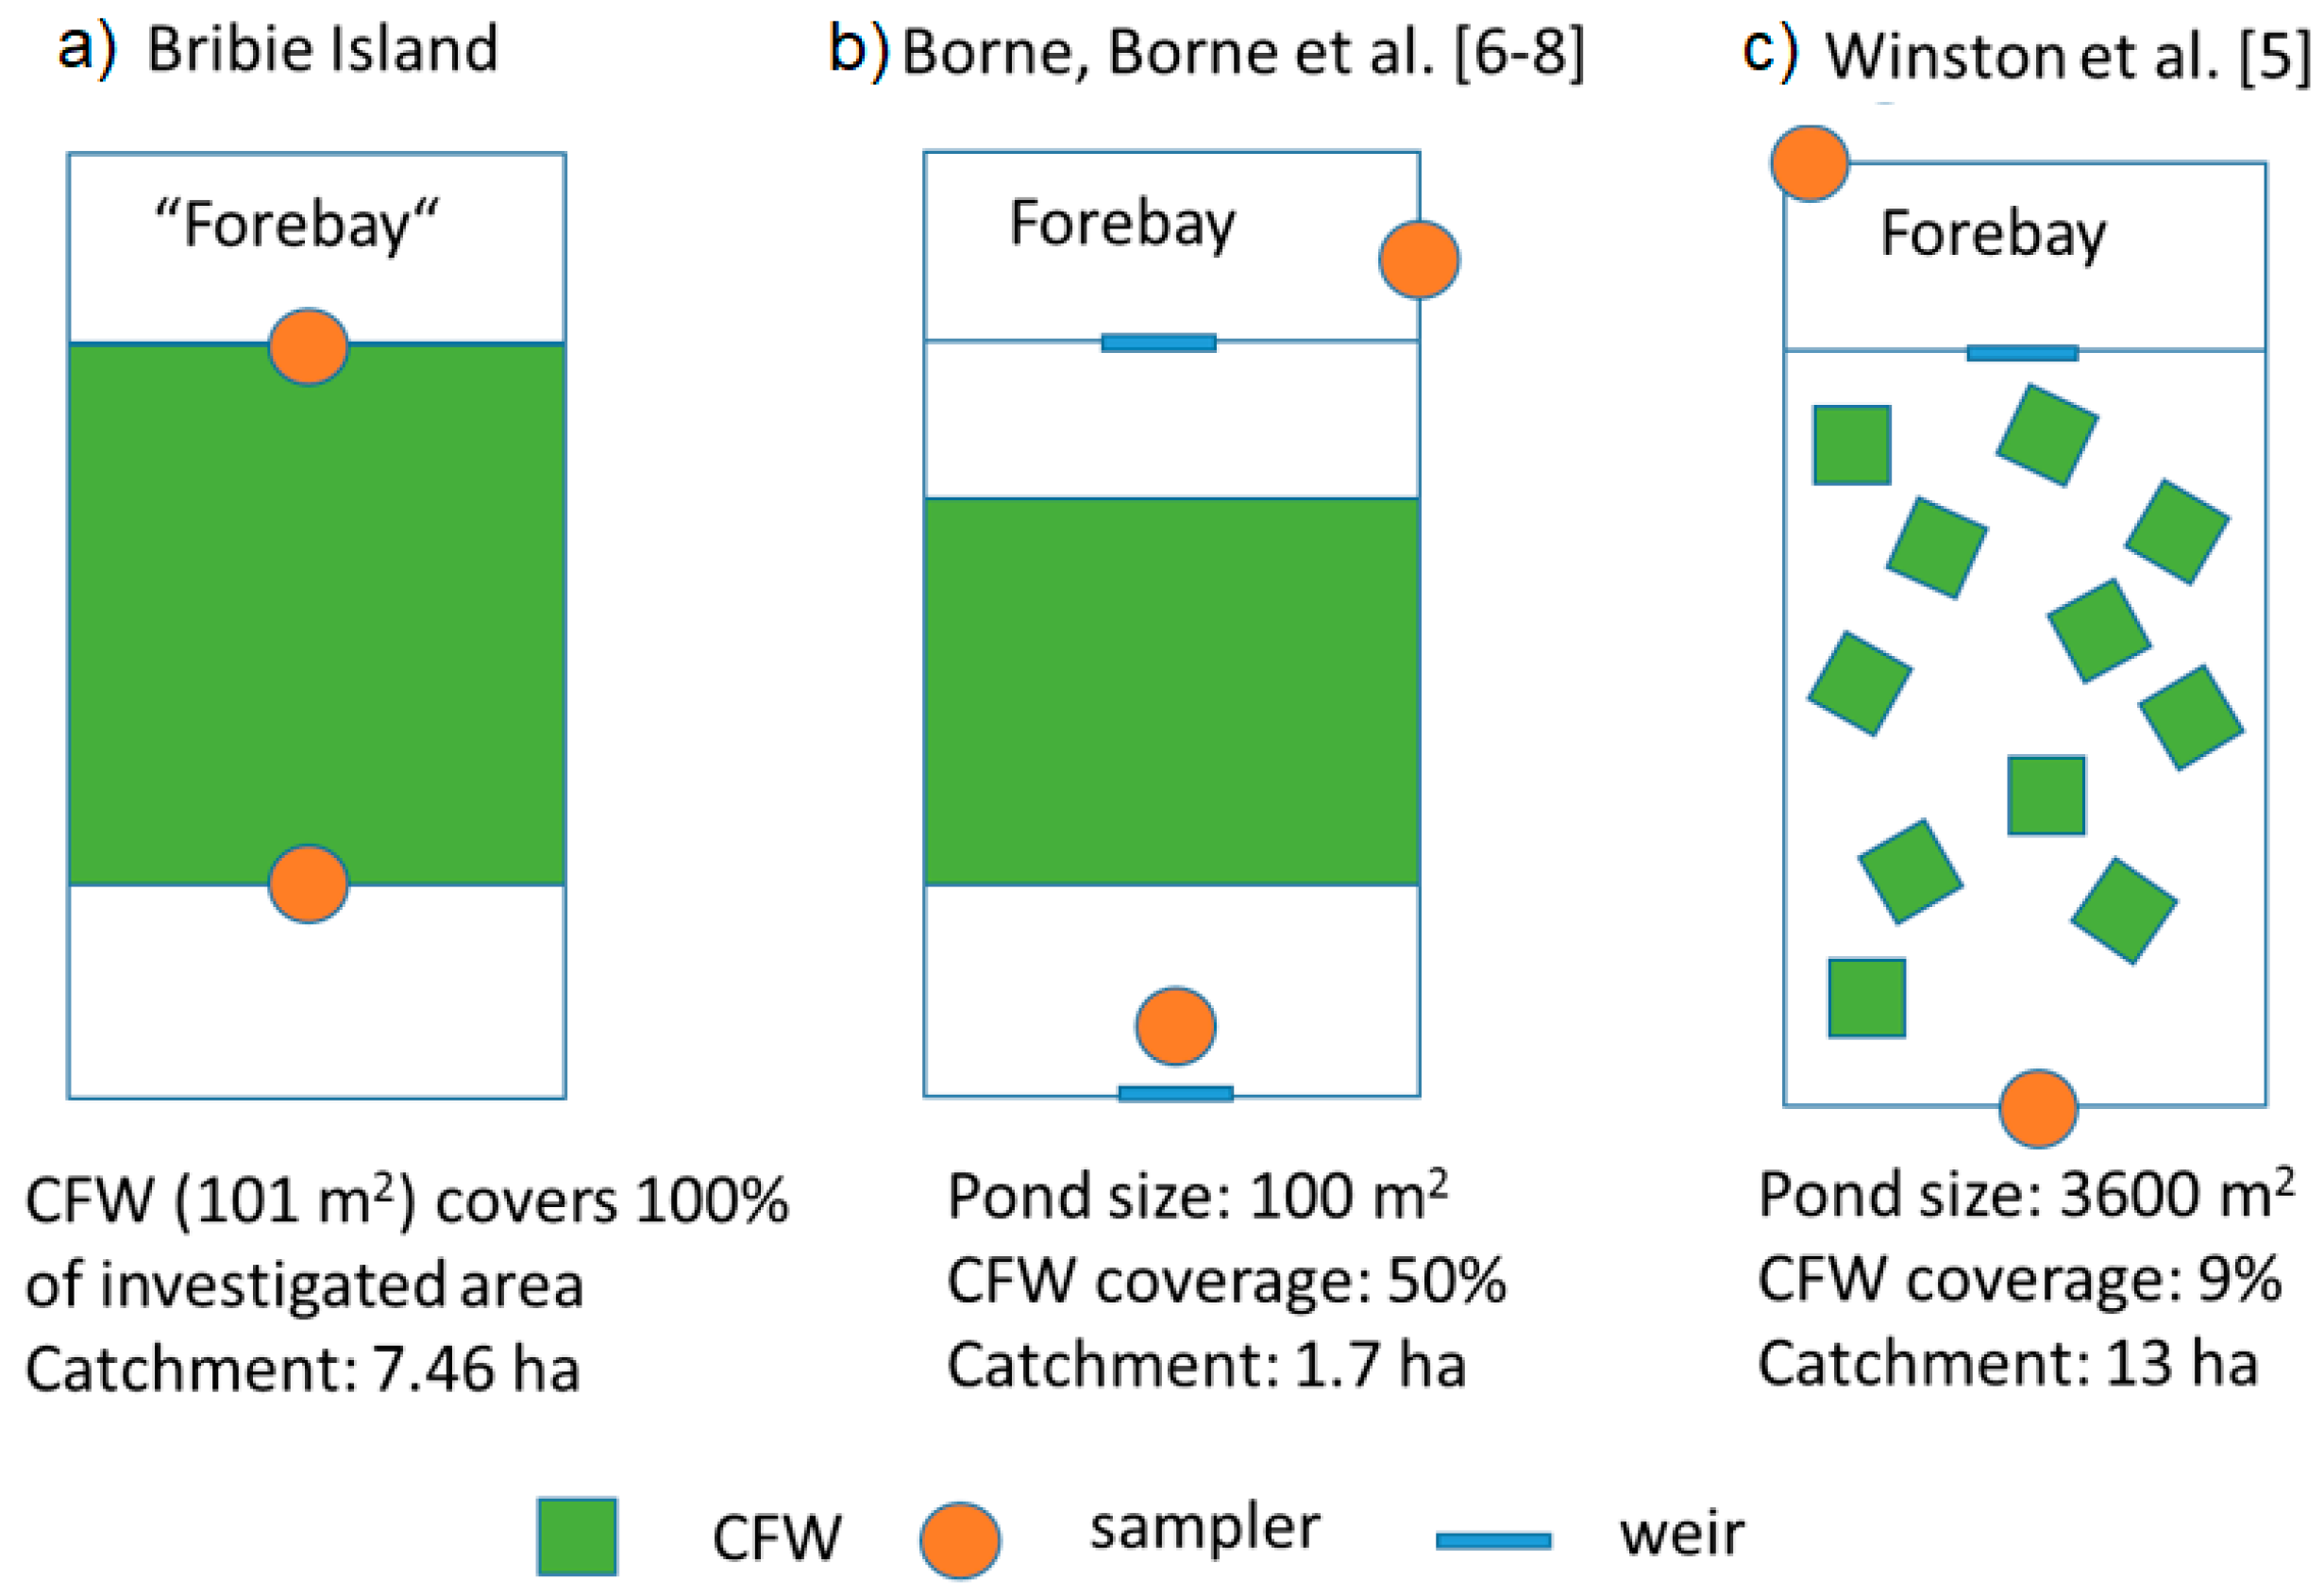
A comparison between the removal efficiencies presented in other studies on large-scale CFWs [5,6,7,8,9,10] and those revealed in this study is difficult due to the different treatment system designs, sampling procedures, and evaluation procedures used in the studies. This difficulty was also discussed by Headley & Tanner [21]. Figure 7 depicts the differences between the treatment system design of the current study (Figure 7a) and those used in other studies [6,7,8] (Figure 7b) and [5] (Figure 7c).
While the experimental design for the current study only considered the differences between the inflow and outflow to the CFW itself (note sampler locations in Figure 7a), the experimental design of the other studies (Figure 7b and Figure 7c) included the inflow and outflows from both the stormwater pond and the CFW. In addition, 100% of the water treatment surface area was covered with CFW in the current study compared to 50% in [6,7,8] (Figure 7b) and only 9% in [5] (Figure 7c). The CFW design used in [5] may also have resulted in short-circuiting of the flow around the island modules.
As previously noted, the SPP targets [19] presently require developments in SEQ to achieve annual pollutant load reductions of 80% TSS, 60% TP, and 45% TN. The pollution removal rates observed in this study for TP (52%) and TN (17%) do not meet these targets. However, based on the study results and the information gathered from this and other international research studies, it may be possible to achieve the SPP targets by increasing the size of the CFW treatment area. For example, to achieve the required TN pollutant reduction target of 45% for an urban residential development, it is hypothesised that the CFW treatment area would need to be between 0.37% and 0.5% of the contributing catchment area. However, further research would be required to verify this hypothesis.
5. Conclusions
This paper presents the results of a two-year field study undertaken to evaluate the pollution removal performance of a CFW designed to treat stormwater runoff from an existing urban development in Queensland, Australia. The results show that even with a CFW treatment area to catchment ratio of only 0.14%, there was significant removal of both total suspended solids (81% ER) and total phosphorus (52% ER). While the removal of total nitrogen was not significant for the CFW evaluated in this study, the ER was still 17%. However, the ER for nitrate was 47%, which is encouraging, as excessive amounts of nitrate can lead to eutrophic conditions.
Based on the study results and the information gathered from this and other international research studies, it may be possible to achieve the SPP targets by increasing the size of the CFW treatment area. For example, to achieve the required TN pollutant reduction target of 45% for an urban residential development, it is hypothesised that the CFW treatment area would need to be between 0.37% and 0.5% of the contributing catchment area. It is also hypothesised that the inclusion of intermittent reaeration zones in the pond would substantially increase the nitrogen removal performance of the CFW. However, further research would be required to verify these hypotheses.
The results of this research study clearly demonstrate that CFWs can be an effective treatment solution for the removal of pollution from urban stormwater runoff.
Acknowledgments
The funding for this research was provided by the Stormwater Research Group at the University of the Sunshine Coast. The authors would like to thank SPEL Environmental, and Darren Drapper in particular, for their help during the undertaking of this research project.
Author Contributions
Terry Lucke and Chris Walker designed the experiments, managed the research, and co-authored the paper; Katharina Tondera assisted with data analysis and co-authored the paper. All authors contributed equally to the data interpretation and editing of the final manuscript.
Conflicts of Interest
The authors declare no conflict of interest.
References
- Hogg, E.H.; Wein, R.W. The contribution of Typha components to floating mat buoyancy. Ecology 1988, 69, 1025–1031. [Google Scholar] [CrossRef]
- Mitsch, W.J.; Gosselink, J.G. Wetlands; Van Nostrand Reinhold: New York, NY, USA, 1993. [Google Scholar]
- Hoeger, S. Schwimmkampen: Germany's artificial floating islands. J. Soil Water Conser. 1988, 43, 304–306. [Google Scholar]
- Stewart, F.M.; Mulholland, T.; Cunningham, A.B.; Kania, B.G.; Osterlund, M.T. Floating islands as an alternative to constructed wetlands for treatment of excess nutrients from agricultural and municipal wastes-results of laboratory-scale tests. Land Cont. Reclam. 2008, 16, 25–33. [Google Scholar] [CrossRef]
- Winston, R.J.; Hunt, W.F.; Kennedy, S.G.; Merriman, L.S.; Chandler, J.; Brown, D. Evaluation of floating treatment wetlands as retrofits to existing stormwater retention ponds. Ecol. Eng. 2013, 54, 254–265. [Google Scholar] [CrossRef]
- Borne, K.; Tanner, C.C.; Fassman-Beck, E. Stormwater nitrogen removal performance of a floating treatment wetland. Water Sci. Technol. 2013, 68, 1657–1664. [Google Scholar] [CrossRef] [PubMed]
- Borne, K.E.; Fassman, E.A.; Tanner, C.C. Floating treatment wetland retrofit to improve stormwater pond performance for suspended solids, copper and zinc. Ecol. Eng. 2013, 54, 173–182. [Google Scholar] [CrossRef]
- Borne, K.E. Floating treatment wetland influences on the fate and removal performance of phosphorus in stormwater retention ponds. Ecol. Eng. 2014, 69, 76–82. [Google Scholar] [CrossRef]
- Chang, N.B.; Wanielista, M.P.; Marimon, Z. Comparative Evaluation of Floating Treatment Wetlands for Nutrient Removal and Algal Toxin Control in Wet Detention Ponds. In Proceedings of the International Low Impact Development Conference 2015: It Works in All Climates and Soils, Houston, TX, USA, 19–21 January 2015. [Google Scholar]
- Hartshorn, N.; Marimon, Z.; Xuan, Z.M.; Chang, N.B.; Wanielista, M.P. Effect of floating treatment wetlands on control of nutrients in three stormwater wet detention ponds. J. Hydrol. Eng. 2016, 21. [Google Scholar] [CrossRef]
- Nichols, P.; Lucke, T.; Drapper, D.; Walker, C. Performance evaluation of a floating treatment wetland in an urban catchment. Water 2016, 8, 244. [Google Scholar] [CrossRef]
- Schwammberger, P.; Walker, C.; Lucke, T. Using floating wetland treatment systems to reduce stormwater pollution from urban developments. Int. J. GEOMATE 2017, 12, 45–50. [Google Scholar] [CrossRef]
- Water by Design, Deemed to Comply Solutions—Stormwater Quality Management, South East Queensland, 2010. Available online: http://healthywaterways.org/u/lib/mob/20141110115217_fbbe727dfdc426363/2009_deemedtocomplysolutions_v1short.pdf (accessed on 21 September 2017).
- United States Environmental Protection Agency. Technical Guidance Manual for Evaluating Emerging Stormwater Treatment Technologies, Technology Assessment Protocol-Ecology (TAPE); Washington Department of Ecology: Washington, WA, USA, 2011.
- Burton, A.G., Jr.; Pitt, R. Stormwater Effects Handbook: A Toolbox for Watershed Managers, Scientists and Engineers; Lewis Publishers: Boca Raton, FL, USA, 2001. [Google Scholar]
- SQIDEP—Stormwater Quality Improvement Devices Evaluation Protocol. Draft in Response to Initial Phase of Consultation. Available online: https://www.stormwater.asn.au/images/publications/SQIDEP_v1_0_2a.pdf (accessed on 21 September 2017).
- Van Buren, M.A.; Watt, W.E.; Marsalek, J. Application of the log-normal and normal distributions to stormwater quality parameters. Water Res. 1997, 31, 95–104. [Google Scholar] [CrossRef]
- Pelosi, M.K.; Sandifer, M.S. Elementary Statistics: From Discovery to Decision; John Wiley & Sons: Hoboken, NJ, USA, 2003. [Google Scholar]
- State Planning Policy, Department of Infrastructure, Local Government and Planning, Queensland Government. Available online: https://planning.dilgp.qld.gov.au/planning/better-planning/state-planning (assessed 30 August 2017).
- Fletcher, T.; Duncan, H.; Poelsma, P.; Lloyd, S. Stormwater Flow and Quality, and the Effectiveness of Non-Proprietary Stormwater Treatment Measures: A Review and Gap Analysis; eWater CRC: Canberra, Australia, 2005. [Google Scholar]
- Headley, T.; Tanner, C.C. Constructed wetlands with floating emergent macrophytes: An innovative stormwater treatment technology. Crit. Rev. Environ. Sci. Technol. 2012, 42, 2261–2310. [Google Scholar] [CrossRef]
Figure 1.
Schematic of Constructed Floating Wetlands (CFW).

Figure 2.
(a) Bribie Island location; (b) study site catchment area.
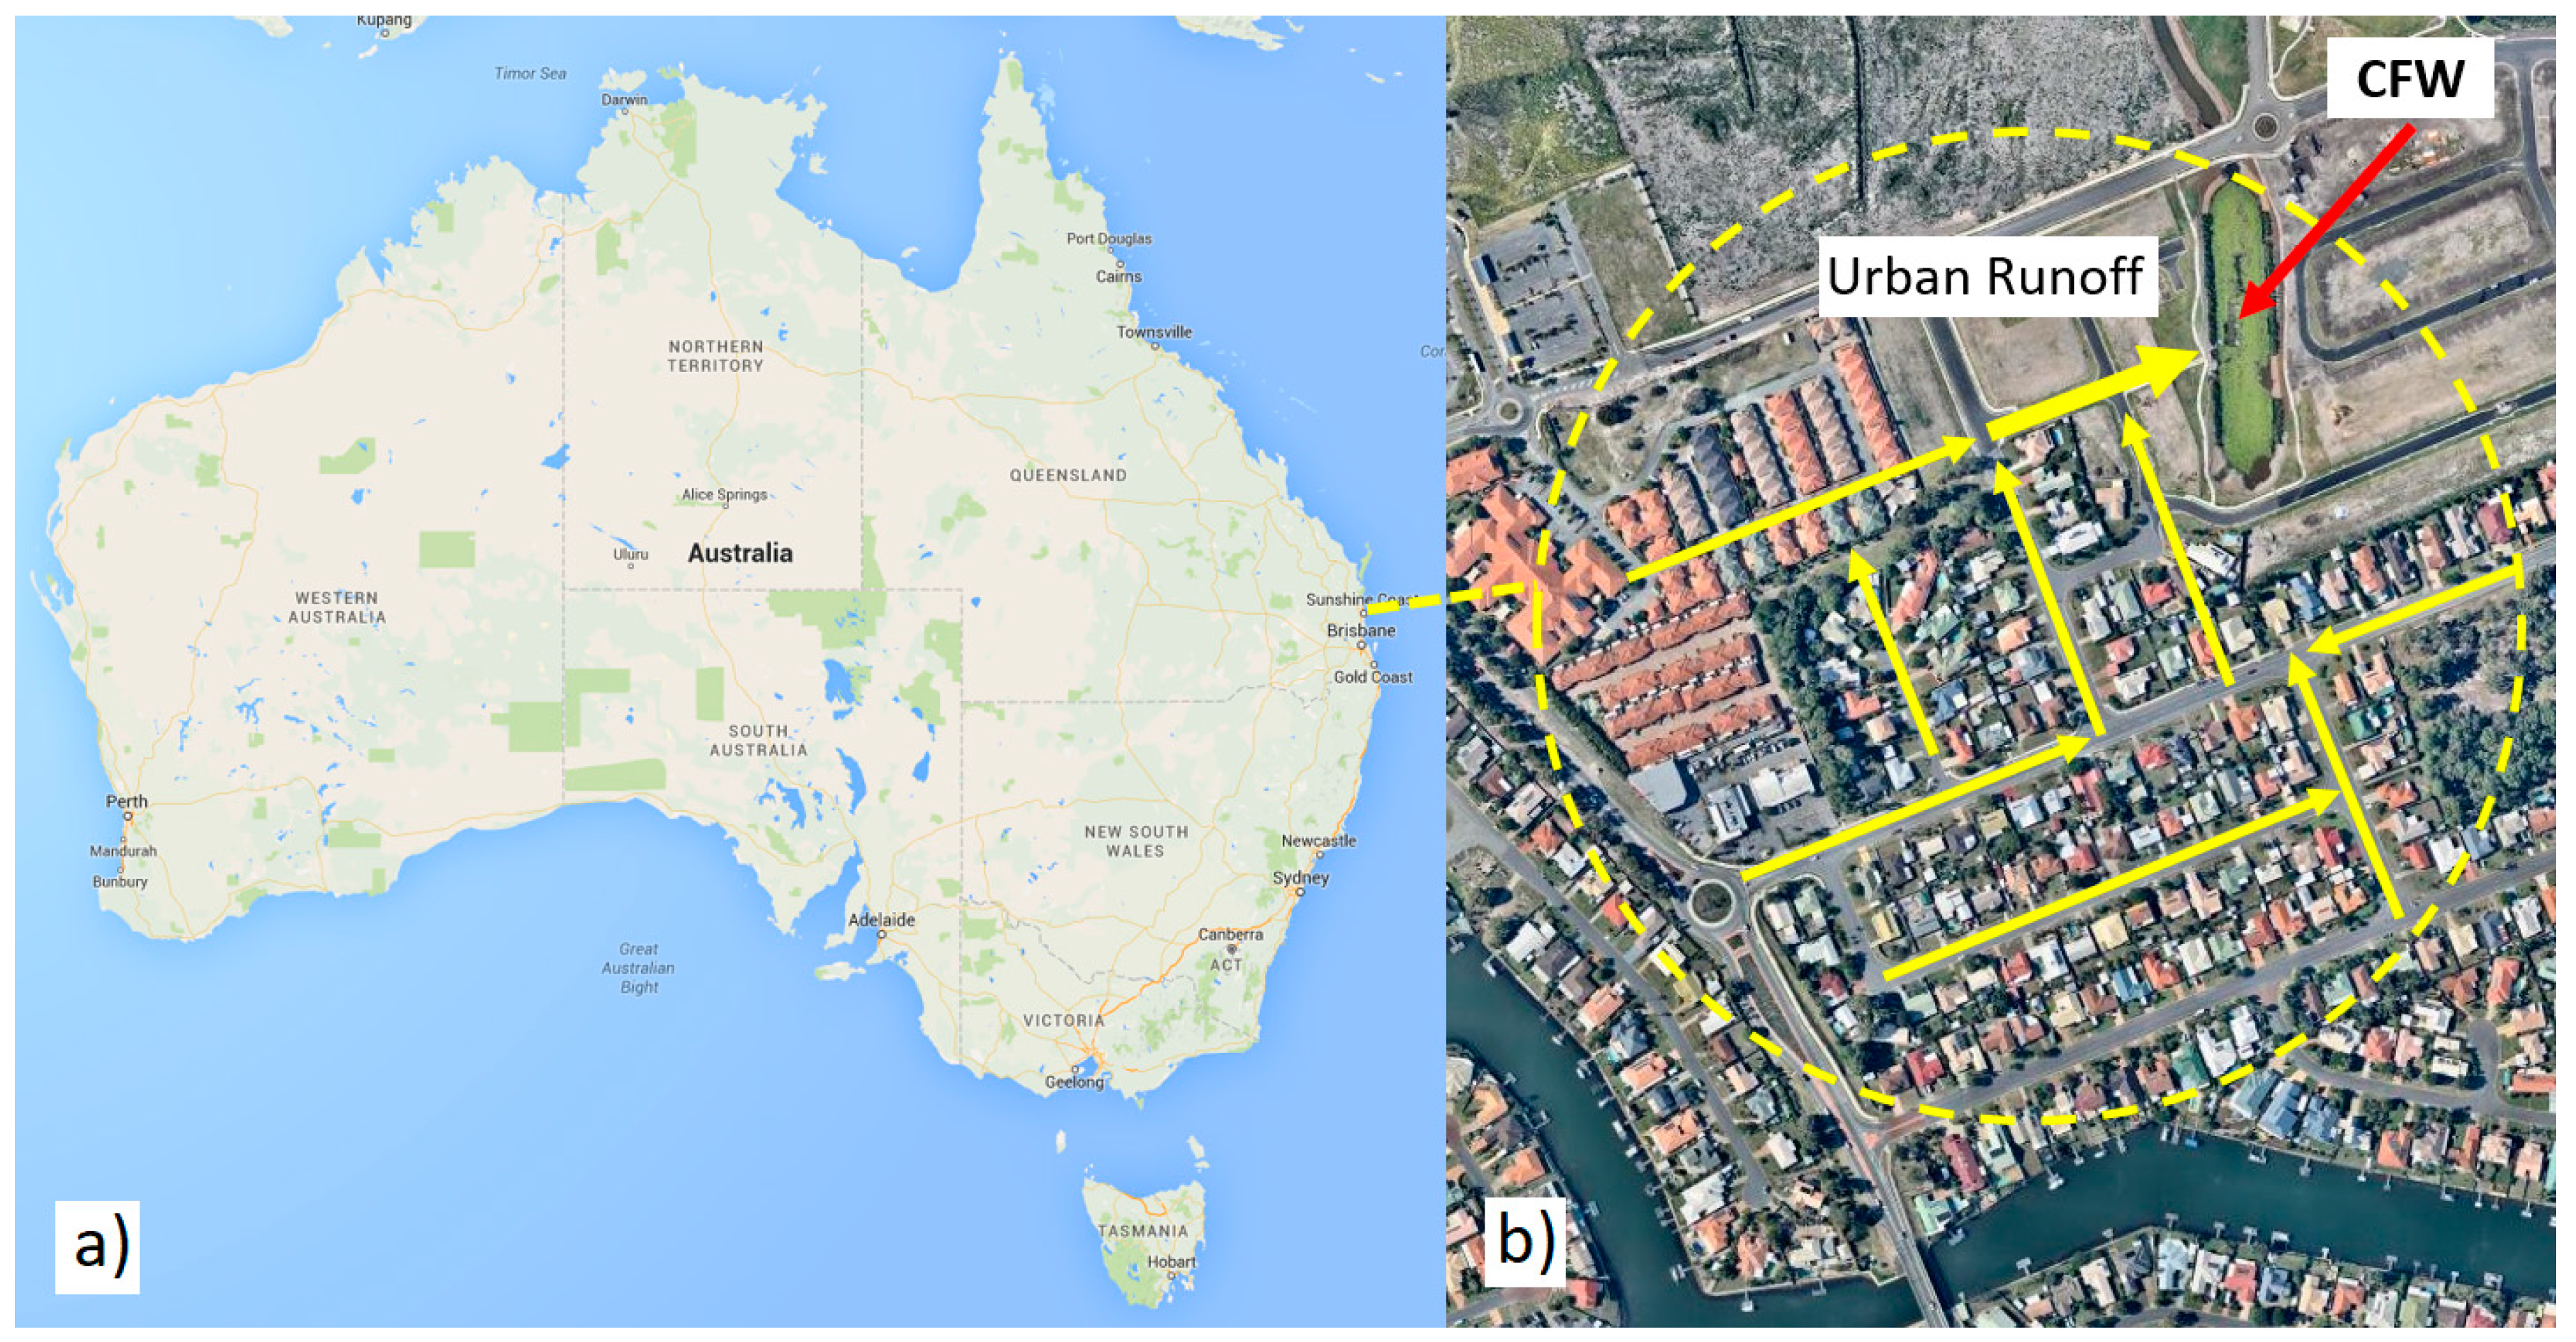
Figure 3.
CFW experimental setup.

Figure 4.
Box and Whisker plot for inflow and outflow concentrations of (a) Total Suspended Solids (TSS); (b) Total Phosphorus (TP); and (c) Total Nitrogen (TN).
Figure 4.
Box and Whisker plot for inflow and outflow concentrations of (a) Total Suspended Solids (TSS); (b) Total Phosphorus (TP); and (c) Total Nitrogen (TN).

Figure 5.
Box and Whisker plots for concentrations of several nitrogen compounds.
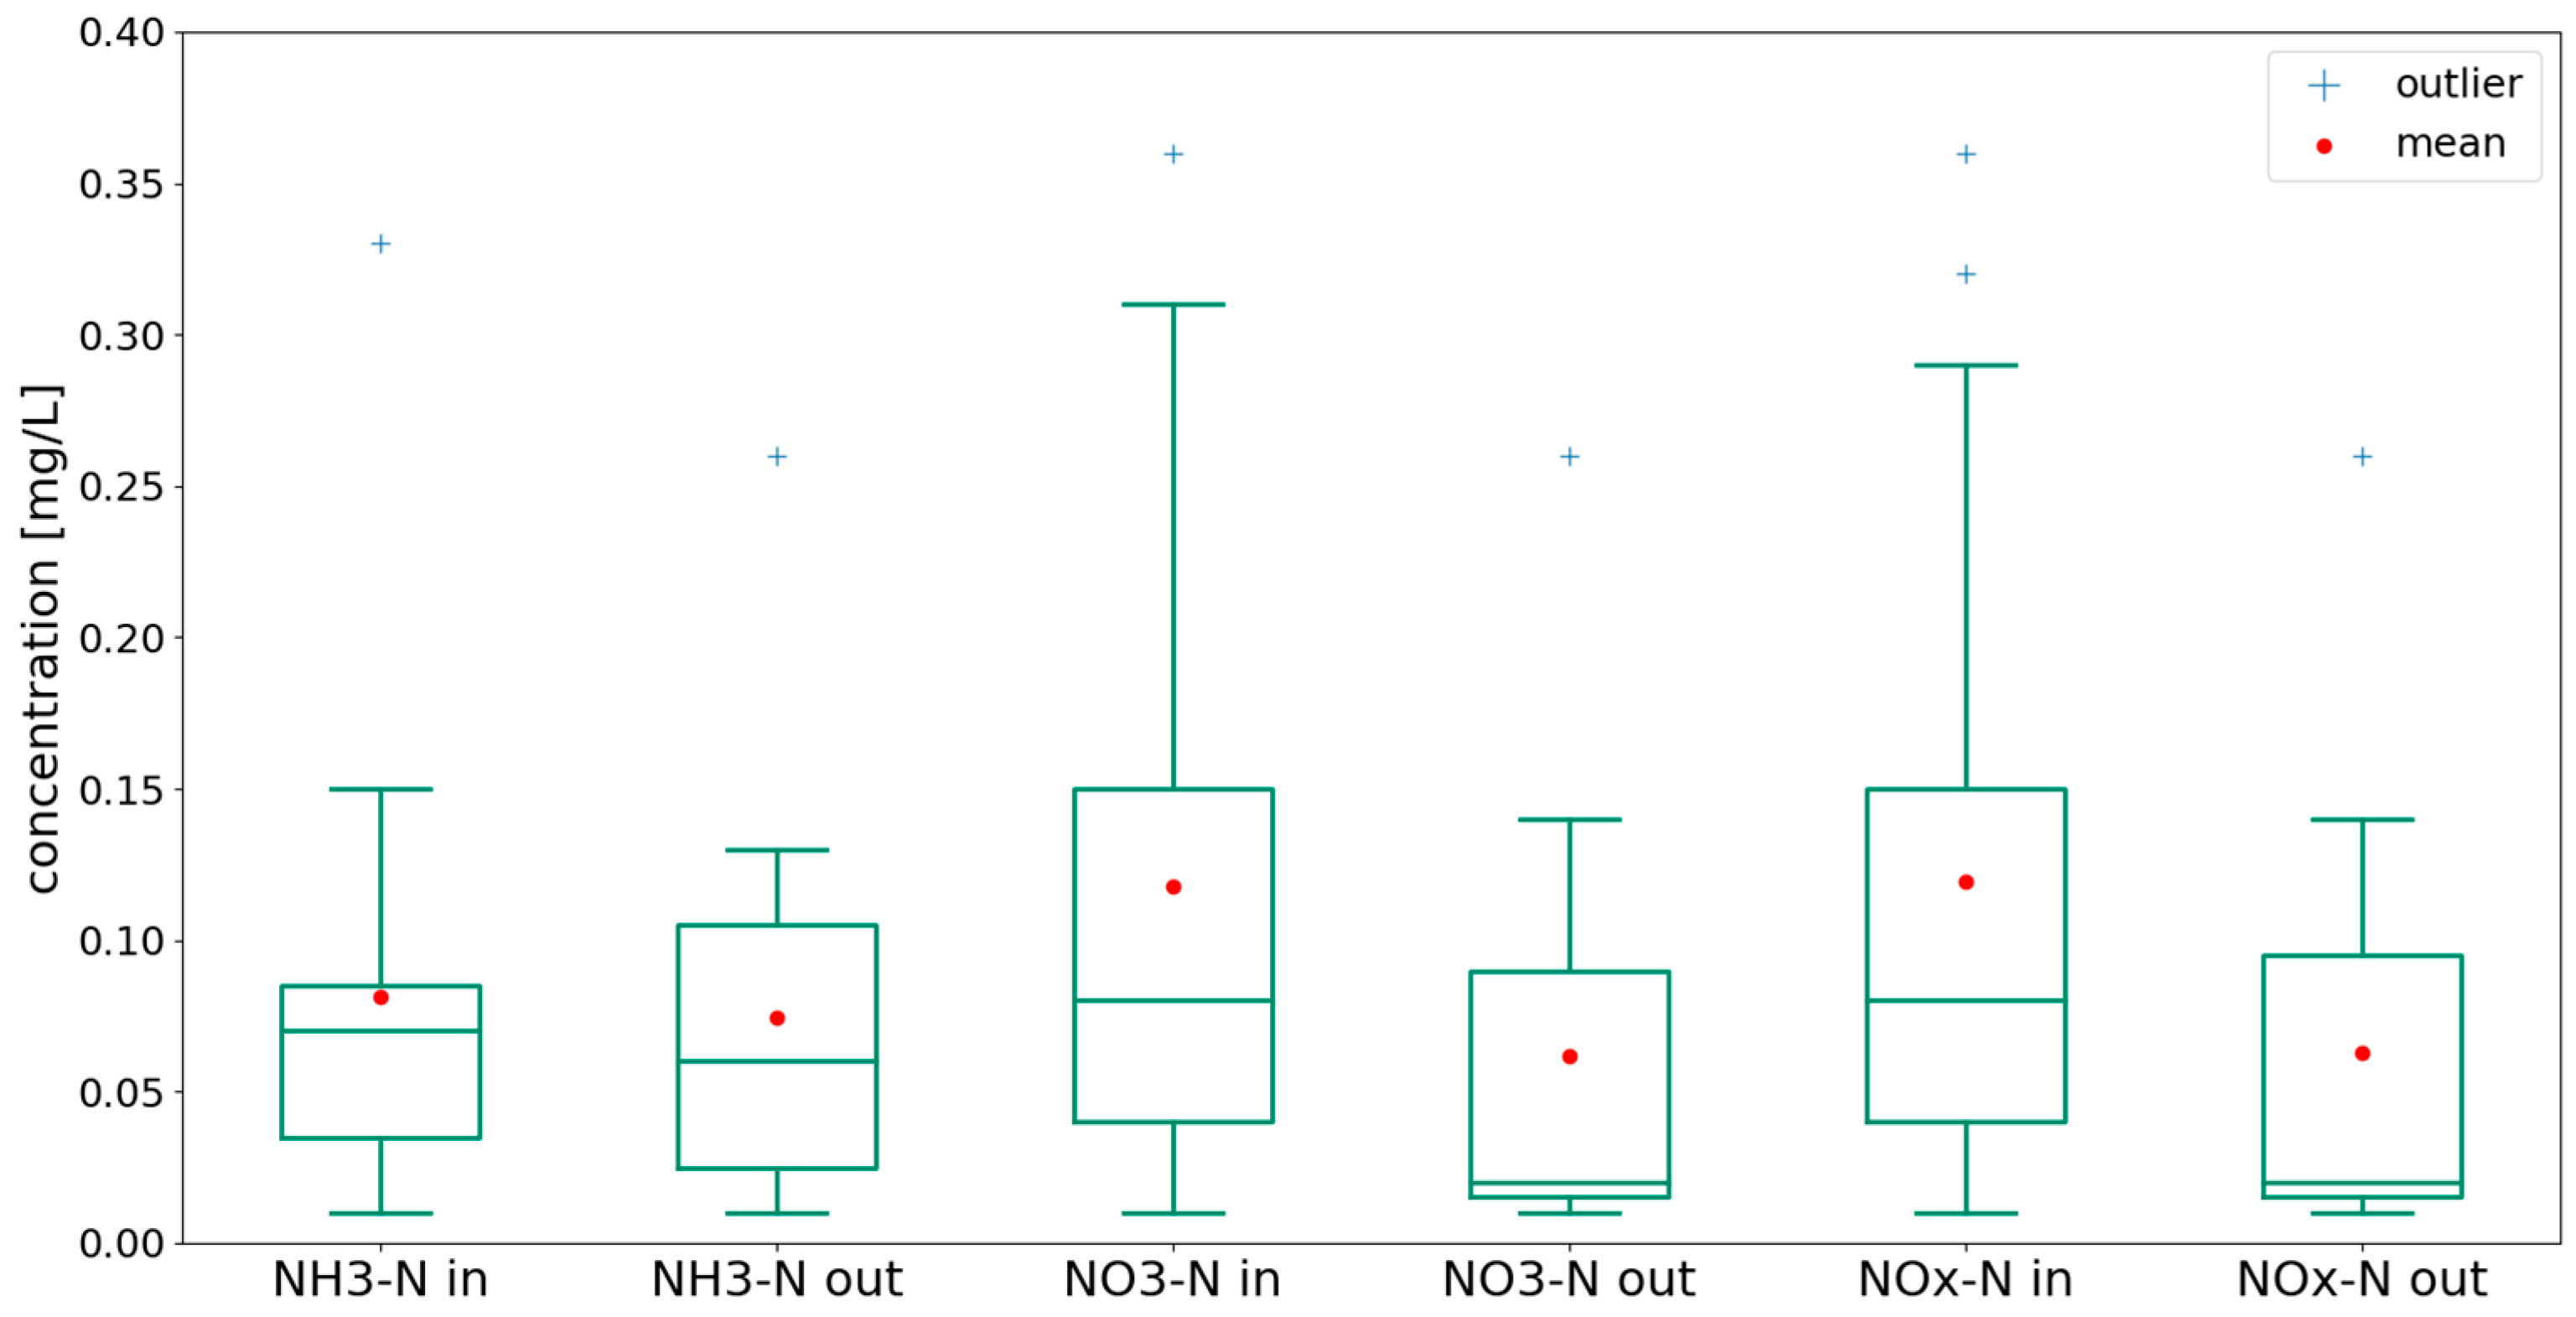
Figure 6.
Particle Size Distribution Curves for Bribie Lakes CFW System.

Figure 7.
Comparison of current study CFW design (a) with those of Bourne et al. [6,7,8] (b) and Winston et al. [5] (c).


Table 1.
Bribie Island CFW study sampling protocol.
| Parameter | Bribie Lakes |
|---|---|
| Minimum storm duration | 5 min |
| Catchment type | Urban Residential |
| Stormwater treatment device type | Constructed Floating Wetland (variable water depth, 1.5 m) |
| Desired number of valid sampling events | 15 |
| Minimum rainfall depth | 2.0 mm |
| Minimum antecedent dry period | 6 h, depending on influent concentrations |
| Minimum hydrograph sampling | 6 h, depending on influent concentrations |
| Minimum hydrograph sampling | First 60% of hydrograph |
| Desired number of water sub-samples | Minimum 8 influent and 8 effluent subsamples per event |
| Sampling method | Auto-sampler (ISCO), flow-weighted in 5000 L intervals |
| Data management | Campbell Scientific CR800 Data logger with Ethernet Modem |
| Total suspended solids (TSS) | APHA (2005) 2540 D |
| Total Nitrogen and species | APHA (2005) 4500 N, APHA (2005) 4500 NH3, APHA (2005) 4500 NO3 |
| Total Phosphorous and Orthophosphate | APHA (2005) 4500 P |
| Laboratory Certification | NATA registered for all parameters |
| QA/QC | Random duplicates and blanks in accordance with the relevant Australian Standard |
Table 2.
Observed pollutant load Event Mean Concentrations (EMCs) for the qualifying events.
| Date | Rainfall (mm) | Sample | TSS (mg/L) | TN (mg/L) | TP (mg/L) | TKN (mg/L) | NH3-N (mg/L) | NOX-N (mg/L) | NO3-N (mg/L) |
|---|---|---|---|---|---|---|---|---|---|
| 29 September 2015 | 9.2 | Inlet | 323 | 1 | 0.28 | 0.6 | 0.01 | 0.36 | 0.36 |
| Outlet | 51 | 0.5 1 | 0.1 | 0.5 1 | 0.02 | 0.26 | 0.26 | ||
| 22–23 September 2015 | 3.8 | Inlet | 11 | 0.7 | 0.03 | 0.6 | 0.08 | 0.1 | 0.1 |
| Outlet | 4 | 0.3 | 0.02 | 0.3 | 0.05 | 0.01 | 0.01 | ||
| 7 November 2015 | 13.2 | Inlet | 433 | 3.2 | 0.28 | 2.9 | 0.06 | 0.29 | 0.28 |
| Outlet | 21 | 0.7 | 0.03 | 0.6 | 0.05 | 0.09 | 0.08 | ||
| 14 November 2015 | 16.6 | Inlet | 22 | 1.1 | 0.05 | 0.8 | 0.07 | 0.32 | 0.31 |
| Outlet | 15 | 0.7 | 0.05 | 0.7 | 0.03 | 0.04 | 0.04 | ||
| 29 November 2015 | 12.4 | Inlet | 272 | 2.2 | 0.14 | 2.2 | 0.11 | 0.05 | 0.05 |
| Outlet | 29 | 1.3 | 0.02 | 1.3 | 0.11 | 0.02 | 0.02 | ||
| 30 January 2016 | 3.4 | Inlet | 50 | 1.1 | 0.04 | 1.0 | 0.02 | 0.12 | 0.12 |
| Outlet | 26 | 2.2 | 0.04 | 2.2 | 0.11 | 0.02 | 0.02 | ||
| 06 February 2016 | 10.8 | Inlet | 19 | 0.6 | 0.05 | 0.6 | 0.01 2 | 0.04 | 0.04 |
| Outlet | 24 | 0.8 | 0.03 | 0.8 | 0.01 | 0.01 2 | 0.01 2 | ||
| 13 February 2016 | 25.6 | Inlet | 37 | 1.4 | 0.06 | 1.3 | 0.06 | 0.05 | 0.05 |
| Outlet | 19 | 2.1 | 0.04 | 2.1 | 0.13 | 0.01 | 0.01 | ||
| 6 March 2016 | 6.2 | Inlet | 56 | 1.2 | 0.1 | 1.2 | 0.08 | 0.04 | 0.04 |
| Outlet | 15 | 1.1 | 0.11 | 1.1 | 0.06 | 0.02 | 0.02 | ||
| 15 July 2016 | 6.2 | Inlet | 54 | 1.5 | 0.1 | 1.4 | 0.15 | 0.12 | 0.12 |
| Outlet | 10 | 1.1 | 0.03 | 1 | 0.1 | 0.1 | 0.1 | ||
| 24 August 2016 | 5.8 | Inlet | 21 | 1.0 | 0.06 | 1 | 0.08 | 0.02 | 0.02 |
| Outlet | 11 | 1.4 | 0.05 | 1.4 | 0.26 | 0.02 | 0.02 | ||
| 7 December 2016 | 10.0 | Inlet | 10 | 0.6 | 0.04 | 0.6 | 0.04 | 0.01 | 0.01 |
| Outlet 3 | 7 | 0.8 | 0.03 | 0.7 | 0.08 | 0.14 | 0.14 | ||
| 13 February 2016 | 18.4 | Inlet | 61 | 1.5 | 0.06 | 1.3 | 0.09 | 0.18 | 0.18 |
| Outlet | 29 | 1.1 | 0.06 | 1 | 0.08 | 0.13 | 0.13 | ||
| 1–2 March 2017 | 18.0 | Inlet | 66 | 1.1 | 0.08 | 1 | 0.03 | 0.08 | 0.08 |
| Outlet 3 | 13 | 0.9 | 0.04 | 0.8 | 0.02 | 0.06 | 0.06 | ||
| 18 May 2017 | 13.8 | Inlet | 19 | 0.7 | 0.01 2 | 0.6 | 0.33 | 0.01 | 0.01 |
| Outlet | 5 2 | 0.6 | 0.01 2 | 0.6 | 0.01 | 0.01 2 | 0.01 2 |
1 The limit of reporting (LOR) for these values only was increased to 0.5 mg/L due to sample matrix interference. 2 Values below LOR are given as LOR. 3 The auto-sampler recorded less than eight subsamples for this event. However, the sampled water volume indicated that at least eight were drawn. Thus, the event was considered to be qualifying.
Table 3.
Calculated pollution CREs, ERs, and paired t-test results.
| TSS | TN | TP | NH3-N | NO3-N | NOx-N | ||
|---|---|---|---|---|---|---|---|
| CRE ± std. dev. [%] | 58 ± 29 | 7 ± 48 | 33 ± 33 | 45 ± 140 | 50 ± 33 1 | 49 ± 33 1 | |
| ER [%] | 81 | 17 | 52 | 8 | 47 | 47 | |
| p-value (Two-tailed) | assumption of normal distribution | 0.0312 2 | 0.311 | 0.0296 2 | 0.8094 | 0.0331 2 | 0.0341 |
| assumption of lognormal distribution | 0.0001 2 | 0.183 | 0.0072 | 0.8012 | 0.0403 2 | 0.0411 | |
1 removal efficiency for the 07/12/2016 was removed because it could be identified as clear outlier of ~1300%. 2 significant for p = 0.05.
Table 4.
Results for Particle Size Distribution.
| Mass Diameter | Inflow Particle Size (µm) | Outflow Particle Size (µm) |
|---|---|---|
| D10 | 6.07 | 6.08 |
| D50 | 23.8 | 21.4 |
| D90 | 96.2 | 95.5 |
© 2017 by the authors. Licensee MDPI, Basel, Switzerland. This article is an open access article distributed under the terms and conditions of the Creative Commons Attribution (CC BY) license (http://creativecommons.org/licenses/by/4.0/).
Share and Cite
MDPI and ACS Style
Walker, C.; Tondera, K.; Lucke, T. Stormwater Treatment Evaluation of a Constructed Floating Wetland after Two Years Operation in an Urban Catchment. Sustainability 2017, 9, 1687. https://doi.org/10.3390/su9101687
AMA Style
Walker C, Tondera K, Lucke T. Stormwater Treatment Evaluation of a Constructed Floating Wetland after Two Years Operation in an Urban Catchment. Sustainability. 2017; 9(10):1687. https://doi.org/10.3390/su9101687
Chicago/Turabian StyleWalker, Christopher, Katharina Tondera, and Terry Lucke. 2017. "Stormwater Treatment Evaluation of a Constructed Floating Wetland after Two Years Operation in an Urban Catchment" Sustainability 9, no. 10: 1687. https://doi.org/10.3390/su9101687
Note that from the first issue of 2016, this journal uses article numbers instead of page numbers. See further details here.