Article

Infiltration and Soil Loss Changes during the Growing Season under Ploughing and Conservation Tillage

1
Research Centre for Astronomy and Earth Sciences Hungarian Academy of Sciences, Geographical Institute, 1112 Budapest, Hungary
2
Syngenta Crop Protection AG, 40002 Basel, Switzerland
*
Author to whom correspondence should be addressed.
Sustainability 2017, 9(10), 1726; https://doi.org/10.3390/su9101726
Submission received: 7 September 2017 / Revised: 20 September 2017 / Accepted: 20 September 2017 / Published: 26 September 2017
(This article belongs to the Special Issue Soil Science in Conservation Agricultural Systems)

Abstract

:
Decreased water retention and increased runoff and soil loss are of special importance concerning soil degradation of hilly crop fields. In this study, plots under ploughing (conventional) tillage (PT) and conservation tillage (CT; 15 years) were compared. Rainfall simulation on 6 m2 plots was applied to determine infiltration and soil loss during the growing season. Results were compared with those measured from 1200 m2 plots exposed to natural rainfalls in 2016. Infiltration was always higher under CT than PT, whereas the highest infiltration was measured under the cover crop condition. Infiltration under seedbed and stubble resulted in uncertainties, which suggests that natural pore formation can be more effective at improving soil drainage potential than can temporary improvements created by soil tillage operations. Soil erodibility was higher under PT for each soil status; however, the seedbed condition triggered the highest values. For CT, soil loss volume was only a function of runoff volume at both scales. Contrarily, on PT plots, some extreme precipitation events triggered extremely high soil loss owing to linear erosion, which meant no direct connection existed between the scales. Improved soil conditions due to conservation practice are more important for decreasing soil loss than the better surface conditions.

1. Introduction

Soil water retention capacity determines most of the physical, chemical, and biological properties of soil and is responsible for soil fertility. In many parts of the world, mainly in semiarid areas, available water content limits crop production. In such places, it is essential to store as much precipitation in the soil as is possible, for crop production that is more secure [1,2]. Infiltration, one of the most important soil properties, is responsible for water entering the soil; however, it is not easy to measure and predict, as it is highly variable both spatially and temporally [3]. Some major driving forces, such as soil surface crusting due to the high kinetic energy of falling raindrops [4,5]; soil sealing on the surface or at deeper levels (e.g., plough pan [6]); and rill and gully formation, which decreases water contact to the soil surface, decrease infiltration [7], whereas other forces, such as increasing plant growth, surface roughness, and surface coverage [8], increase the volume of infiltration. Ploughing tillage (PT; conventional cultivation system based on annual moldboard ploughing tillage) plays an ambivalent role. Some researchers emphasize that it increases the infiltration volume right after ploughing [9], while others highlight how ploughing tillage destroys the soil’s structure [10] and compact the soil [11]. Therefore, new or revised practices in order to maximize water moisture during the growing season have been developed and tested worldwide. Most focus on tillage mitigation and surface cover increase using dead (mulch) or living (cover crops) biomass and are called “conservation agriculture” [12,13]. In the last two decades, the application of cover crops came into the spotlight [14,15]. Although there are many advantages of cover crops, such as physical protection of the surface, organic carbon source as green manure, and soil structure improvement, there are some disadvantages as well (potential source of plant diseases and concurrent soil moisture and nitrogen loss) [16].
Soil has a higher infiltration capacity in dry conditions. As moisture content increases, the infiltration value decreases, until it reaches its theoretical minimum, which is dependent on the soil texture and structure. In reality, this minimum value is not a constant but rather a function of rainfall intensity [17]. Higher rainfall intensity triggers a higher final infiltration rate, as described by Rose [18].
i = i S   [ 1 e x p ( p i S ) ]
where i is the infiltration rate (mm h−1), p is the irrigation rate (mm h−1), and is is the soil permeability (mm h−1).
Moreover, precipitation that is unable to infiltrate creates runoff and triggers soil erosion and flash flooding. The on-site costs due to soil erosion is estimated at $165–410 year−1 ha−1 in the EU states [19]. Higher runoff volume does not necessarily mean higher soil loss. Theoretically, a compacted, smooth, crusted soil surface, which is the reason for higher runoff volume, could protect against soil detachment via runoff [20]. Accordingly, defense against soil erosion should be second only to water retention as the aim of cultivation.
As most physical properties of the soil are highly variable during the year, it is crucial to take these changes into account in order to create and apply the best management practice [21]. To do so, one has to gather measured infiltration and soil erodibility values from in situ plot-scale crop fields. As runoff plots measuring the effects of natural precipitation are not suitable for investigation over a wide spectrum of intensity under certain soil conditions, rainfall simulation was applied [22]. This method is highly effective, reproducible, and suitable for the purposes of this study [23,24,25].
The aims of this study were to (i) quantify instantaneous infiltration values as a function of precipitation intensity; (ii) compare these functions under various soil conditions, such as under cover crop, seedbed, stubble, and tillage systems (conventional and conservation); and (iii) compare soil loss results.

2. Materials and Methods
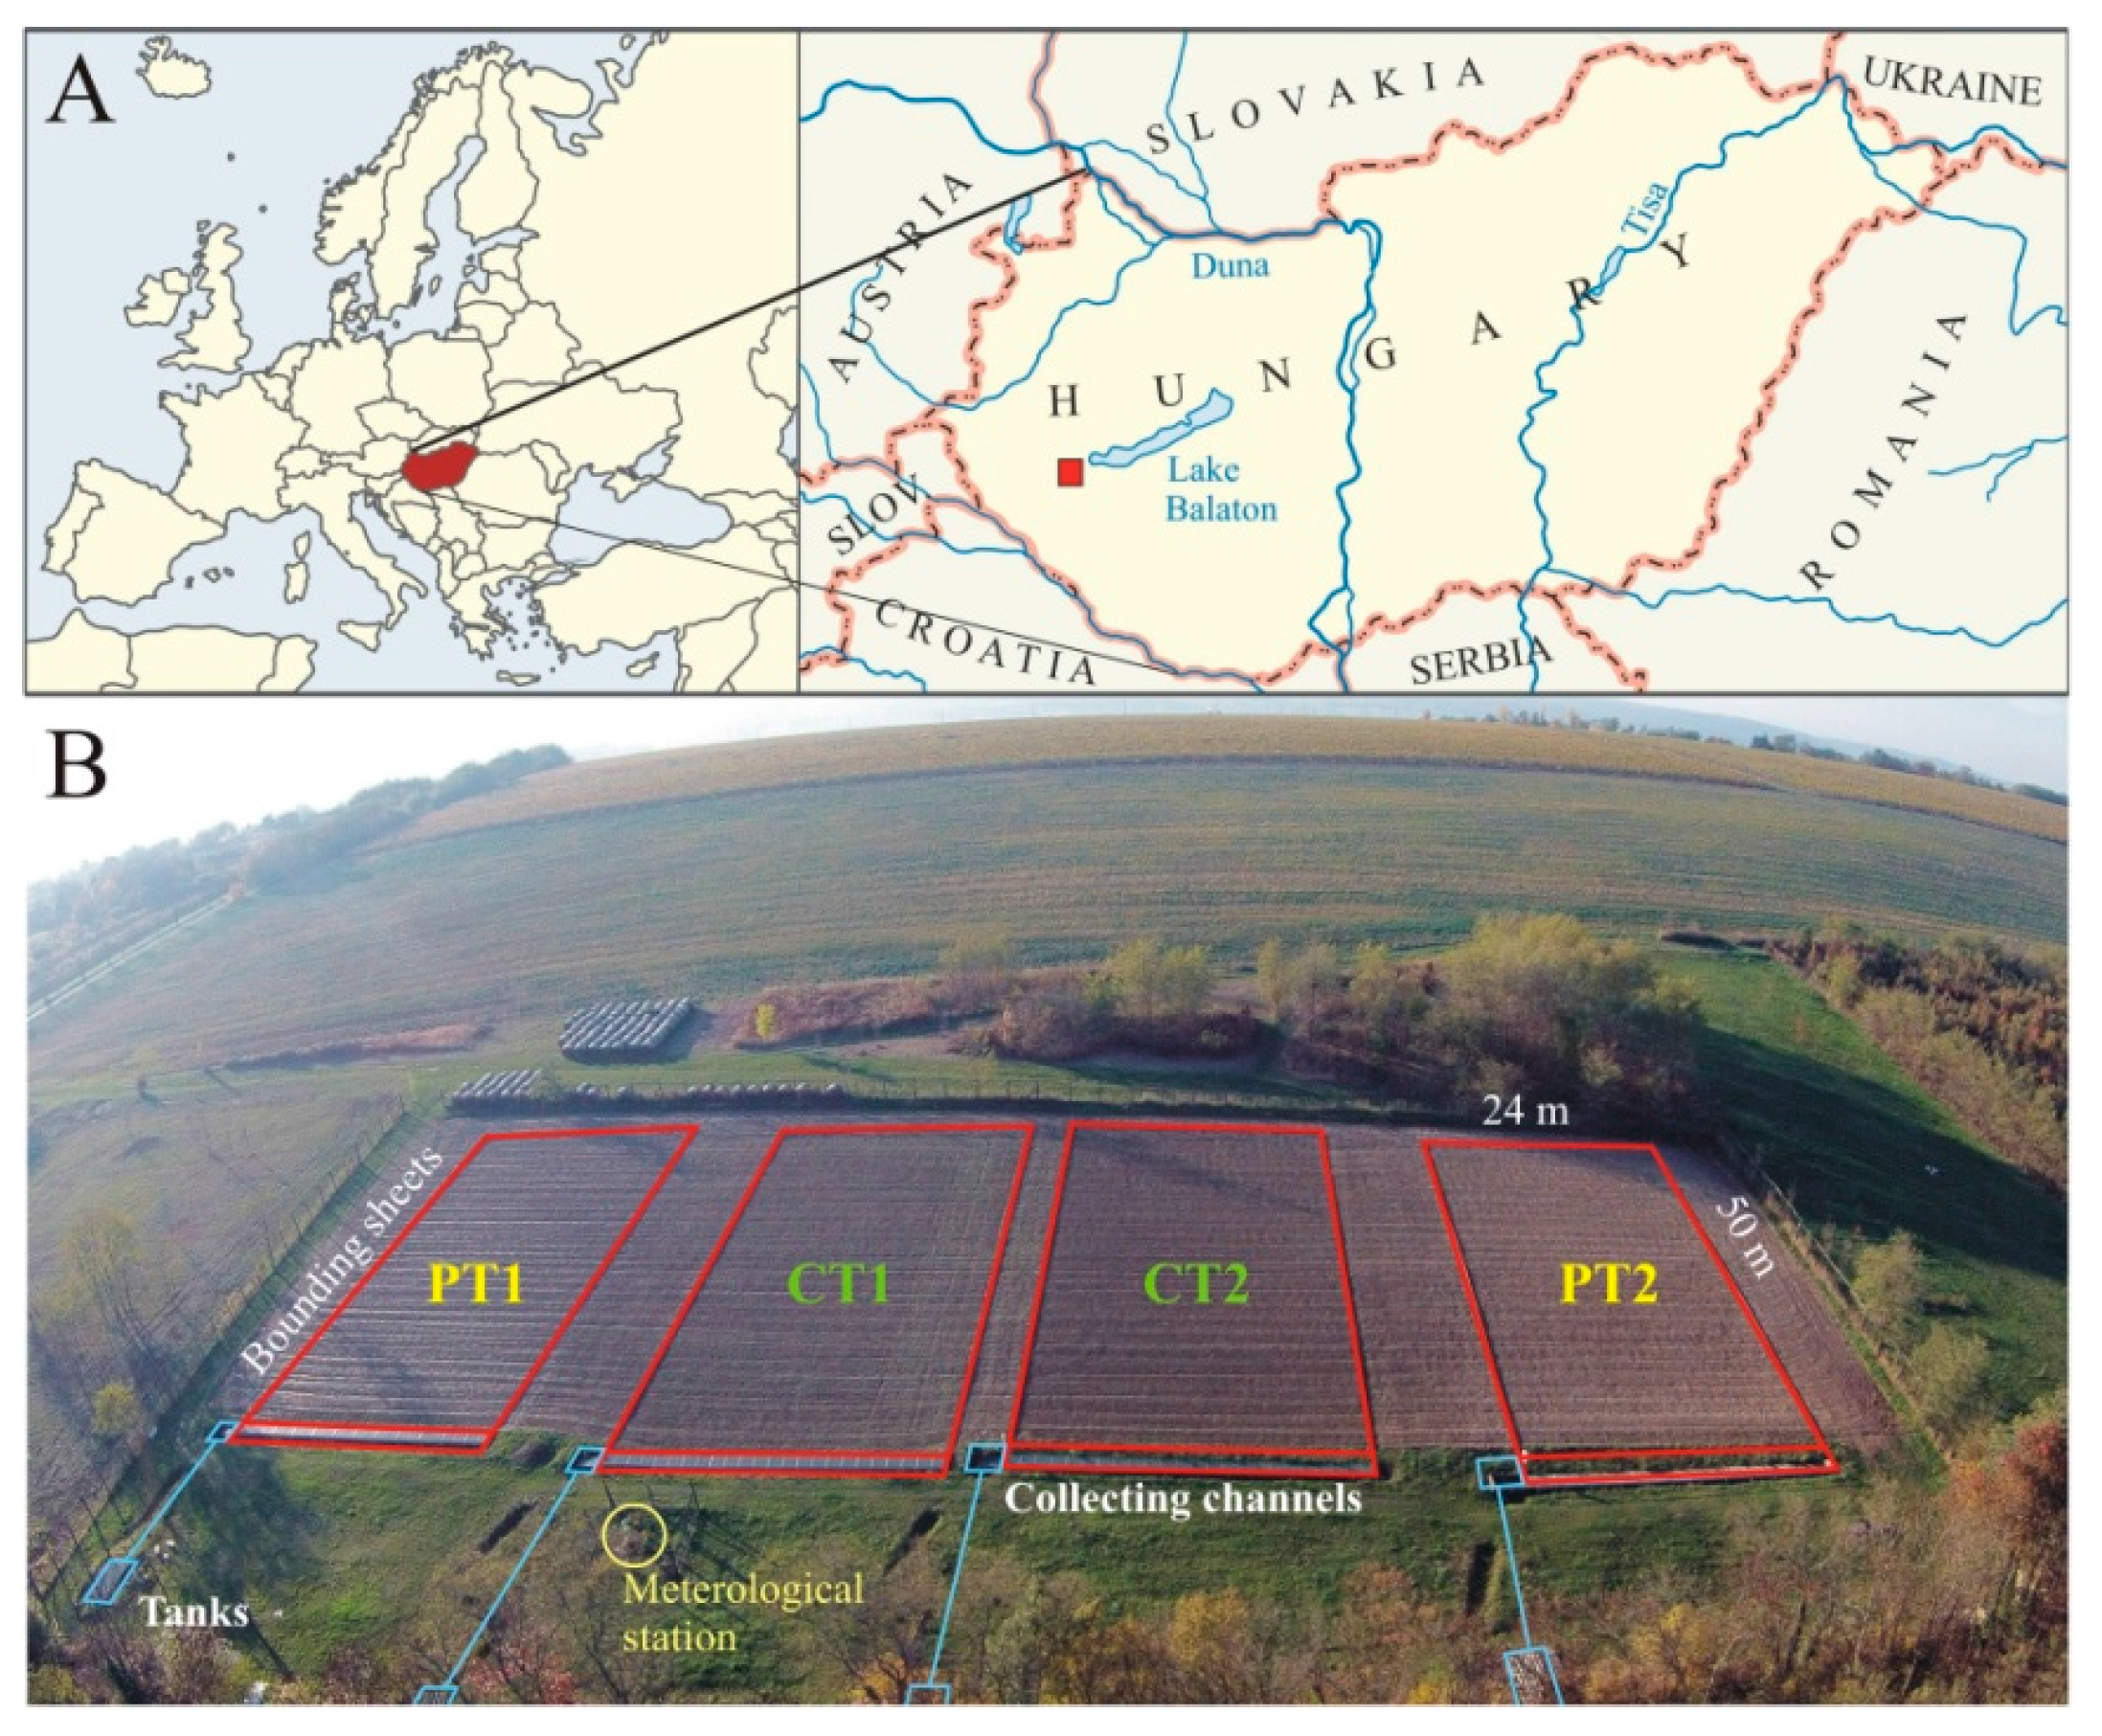
2.1. Study Site

Measurements were carried out at the Szentgyörgyvár soil erosion experimental site in Hungary (46°44′54.1″N; 17°08′48.4″E) (Figure 1). PT and conservation tillage (CT) (with no inversion, using a reduced number of tillage operations and leaving minimum 30% crop residues on the soil surface) were compared on four 24 × 50 m plots, two per tillage type. Since 2004, runoff and soil loss of the plots have been collected continuously until now [26]. The recent tillage techniques used on the plots are listed in Table 1. The plots’ soil is Luvisol on sandy loess, with a particle size distribution of 4% clay (<0.002 mm), 60% silt (0.002–0.02), and 36% sand [27]. The mean annual temperature is 11 °C, and precipitation is 628 mm. The slope steepness is 9–10% [28,29].

2.2. Rainfall Simulation and Cultivation

A Shower Power 02 in situ rainfall simulator, designed by the Hungarian Geographical Institute, was used for infiltration measurement [30]. The size of the irrigated plot was 3 m × 4 m = 12 m2. To exclude border effects, only the inner 2 m × 3 m area was investigated. For drop formation, 80,100 VeeJet nozzles were used [31]. Two nozzles were placed 2 m apart from each other. The nozzles were exactly in the same plane with each other and the alternating axis. This overlap of the two nozzles ensured homogeneous drop distribution 3 m under the nozzles. The nozzles were elevated above 3 m height, so the biggest drops could reach their final velocity before hitting the ground. The drop spectrum at 0.41 bars of pressure is corresponded well with that of natural rainstorms [32]. Intensity varied 30–130 mm h−1 based on the axis alternation frequency, therefore drop spectrum was the same for each precipitation. Intensities were calibrated for certain frequencies using laboratory measurements on rain volume. One alternation theoretically equaled 0.07 mm precipitation.
Rainfall simulation was carried out three times in 2016. The first occurred when a green cover crop was present in April; the second occurred a month later (May), after the green cover crop had been destroyed and the soil was disturbed to create a seedbed for planting maize using different soil cultivation methods; and, finally, the third occurred in October just after harvesting.
Runoff and erosion data were generated for CT and PT. Each investigation included five runs at various constant intensities (30, 40, 60, 90, or 120 mm h−1), with 9% slope steepness (which is widespread for crop fields in Hungary). Natural precipitation events with 30–40 mm h−1 intensities are casual, higher values are rare in the studied area. The investigated plot was fenced by metal sheets dug into the soil in order to inhibit surface runoff and run-on flow. Right after the set-up process, a 40 mm h−1 rainfall was simulated, yet runoff measurement was not performed. The aim of this first artificial precipitation event was to fill the soil to field capacity in order to ensure standard circumstances for the measurements.
After this, the first pretreatment, measurements were carried out in an increasing order of precipitation intensity. For each measurement, the total amount of runoff was collected and measured. Partial runoff and soil losses were measured in separate units, with special emphasis on time.

2.3. Calculation

During each measurement changes in infiltration within the precipitation event were recorded. Based on runoff dynamics, the apparent infiltration intensity was calculated (Figure 2).
For each measurement, linear functions were fitted to the last six–ten measured runoff volume data points against time. In this last period, runoff intensity became constant; accordingly, this last section of the data points showed a linear linkage. Estimation of the apparent infiltration intensity was based on the steepness of this linear function (mm s−1). These values are listed as apparent infiltration in Table 1.
The infiltration rate for each event was fitted to Equation (1). Hence, the value of is needs to be determined by fitting Equation (1) to the irrigation and infiltration data. This was done manually by adjusting the value of is until the normalized root mean squared error (NRMSE) was minimized, given by the equation:
NRMSE = ( 1 N   O a v )   j = 1 N ( P j O j ) 2
where Pj and Oj are the jth predicted and observed values, respectively, of N values, and Oav is the mean of the observed values. From this fit, because evapotranspiration is negligible on the time scale of these experiments, it follows that the runoff rate (q) is simply:
q = p i .
The amount of eroded sediment, C (kg m−1), for each event was fitted to the equation, as given by the Pan-European Soil Erosion Risk Assessment (PESERA) model [33]:
C = k   V 2   S 1.5
where k is the soil erodibility, V is the volume of runoff per unit width (L m−1), and S is the local slope gradient (dimensionless). Moreover, soil erodibility K factor values were also calculated according to the USLE model [34] for the entire year of the field scale, because this model is still widely used [35,36,37]. The USLE K factor was created for annual temporal resolution; therefore, for single simulated rainfalls, the modified USLE (MUSLE) [38] was applied.
For comparisons, boxplots and one-way ANOVA were applied using IBM SPSS software.

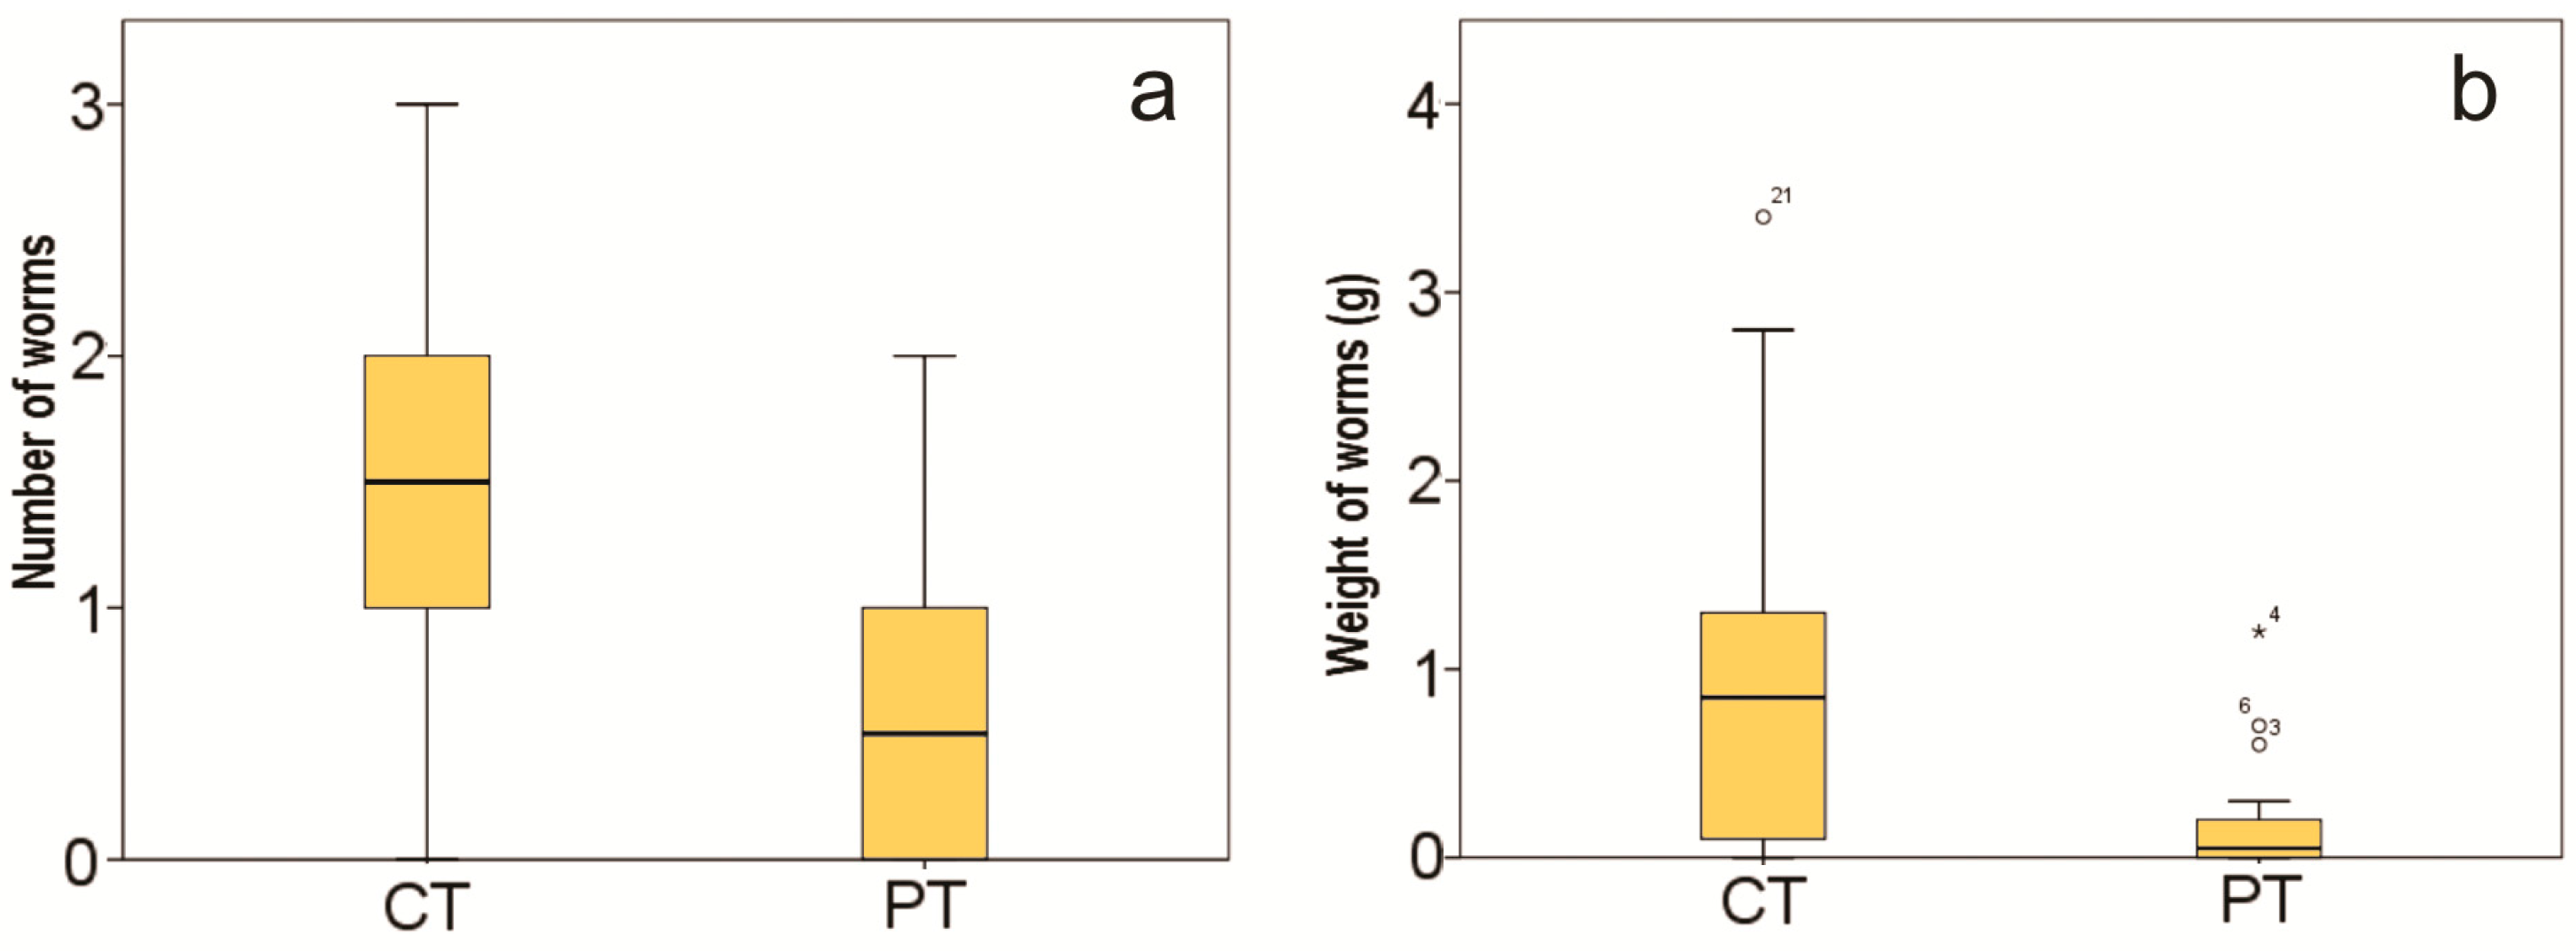
2.4. Earthworm Investigation

In order to estimate natural aggregation and porosity formation effects earthworms were surveyed at the end of October by taking samples 10 cm in diameter and 10 cm in depth at nine points per plot with a soil auger. The number and total weight of earthworms per soil core were recorded by applying the method of Harper Adams University College [39].

3. Results and Discussion

All 15 artificial rainfalls triggered runoff and soil loss from the investigated plots. The main measured and calculated rainfall and soil properties are presented in Table 2.

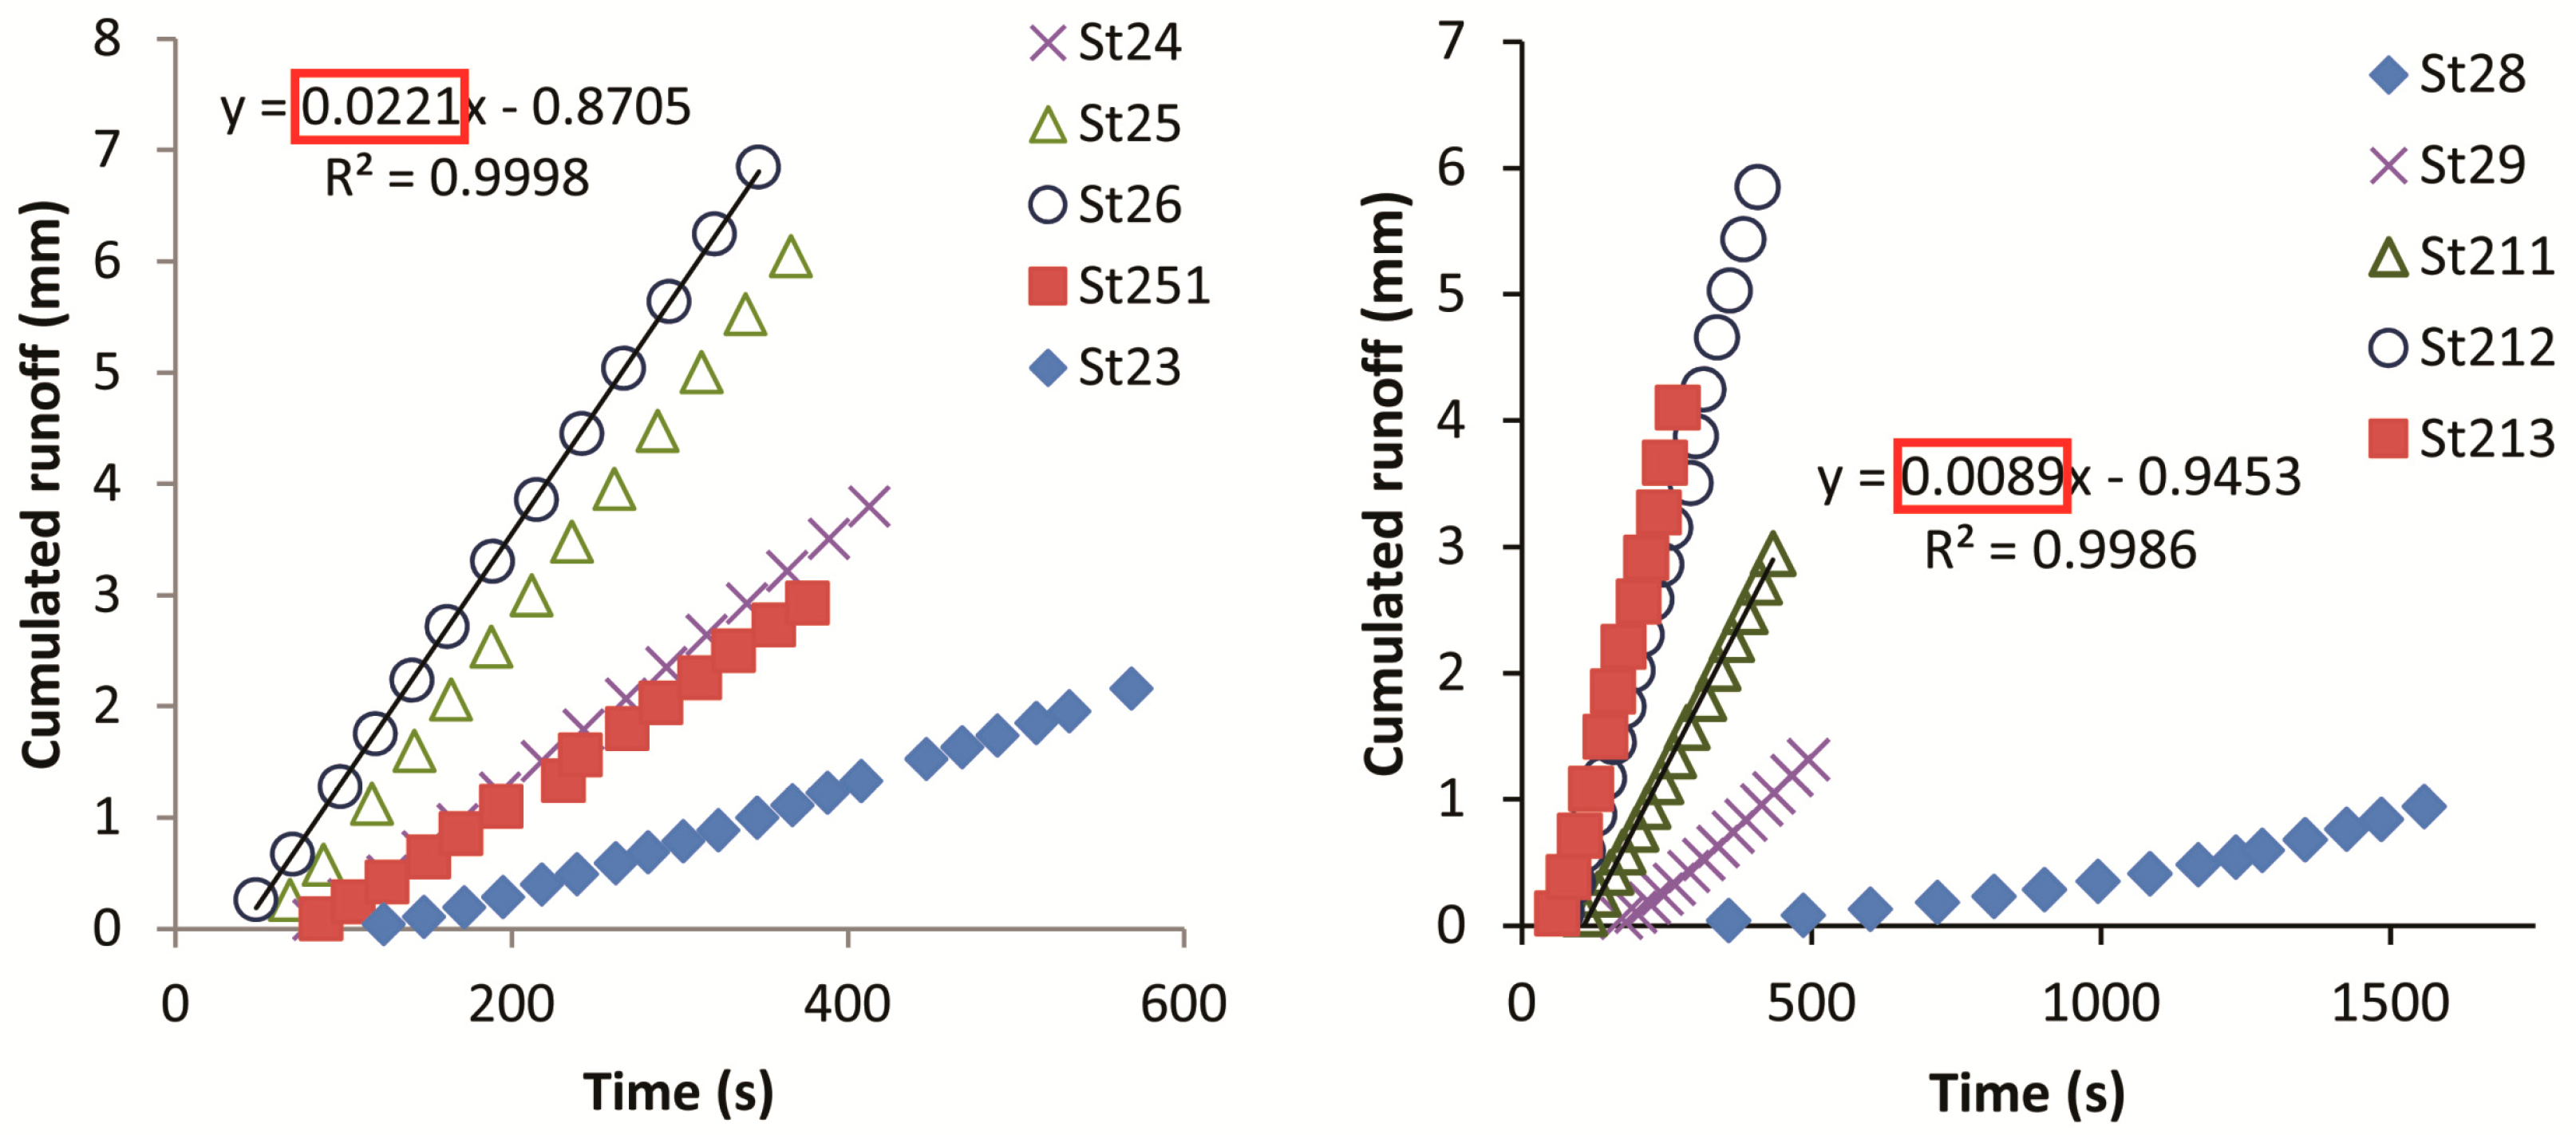
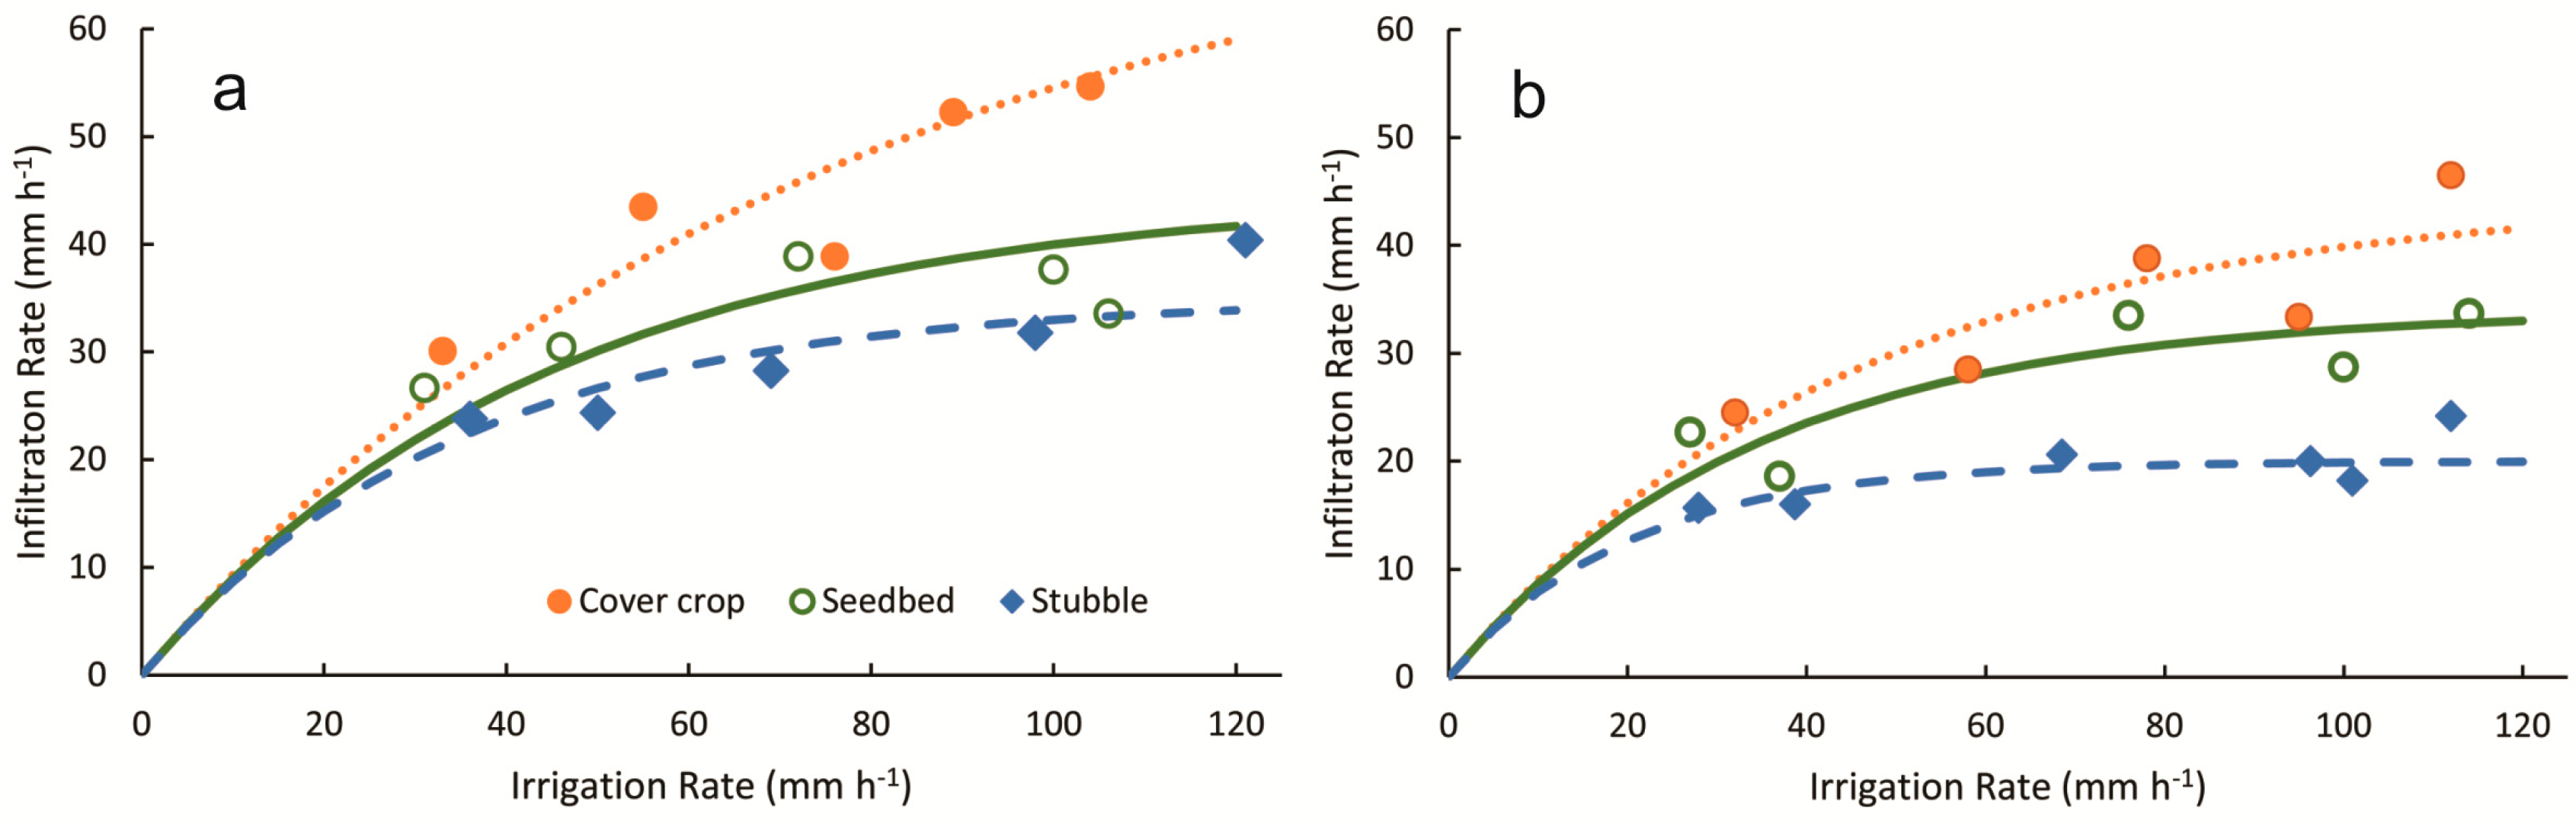
3.1. Hydrological Results for the Small Plots

Based on the calculated final apparent infiltration values, an infiltration function was determined for both tillage systems and each soil status of the growing season (Figure 3).
In April, under crop cover, both soils had the highest annual infiltration capacity; however, infiltration was higher under CT. Both the highest infiltration and the highest increase in infiltration owing to precipitation intensity increase were found on the CT plot under the cover crop condition.
Under the seedbed condition in May, both functions indicated a slightly lower infiltration intensity, although one of the main purposes of cultivation is to increase infiltration. This is in accordance with the results of many studies [40,41,42], though infiltration and saturated and unsaturated hydraulic conductivity values measured on undisturbed soil samples showed high variability because of spatial heterogeneity of the soil [21]. On the other hand, rainfall simulation was carried out after 2 weeks of tillage, Freese et al. [43] reported results of significant infiltration rate decrease for this period in regard to three tillage systems.
Infiltration was still higher under CT; however, irrigation intensity dependence on apparent infiltration intensity decreased (curve steepness on Figure 3). This means the infiltration rate reduction compared to the cover crop status was higher as the precipitation intensity increased. Accordingly, the advantage of cover crops in increasing infiltration should be emphasized for the heaviest rainstorms. According to climate projections, considerable change in the distribution of precipitation is expected in the Carpathian Basin (wider surrounding of this study). This means less-frequent but higher-intensity precipitation events, with increased precipitation during winter [44,45]. Therefore, it is necessary to sow the cover crop as soon after harvest as is possible because this period is frequently endangered by extreme precipitation events.
In October, under stubble, infiltration was still higher under CT, although it decreased in both tillage systems, compared to the initial values. The function fitted on the PT data was less steep, which means a very limited increase in infiltration response owing to precipitation intensity increase. Over 40 mm h−1 the effect of precipitation intensity was practically negligible. Moreover, the stubble infiltration function under CT was very similar to that of PT under the seedbed condition (Figure 3, Table 2). Accordingly, at the end of the growing season, settled and crusted surface soil can obtain and retain as much water as the recently tilled seedbed under PT. Therefore, in the present case, infiltration was not limited by the surface conditions but by the conditions in deeper layers. Accordingly, soil porosity formed by natural processes can be more effective in drainage than that formed by tillage induced, temporary, vulnerable processes. The same conclusion was made based on the earthworm survey. A significant difference in both the number and weight of earthworms was revealed following the October rainfall simulation, in favor of CT. This resulted in 2.5 times more and 5.3 times larger earthworms, on average (p < 0.01) (Figure 4). The role of soil fauna is essential in establishing the optimal structure and porosity of the soil. CT does not damage these layer-specific organisms, and a macropore system is established, which is capable of absorbing rainwater quickly [46,47,48].
In the lower precipitation intensity range, all three soil conditions reacted more or less the same to precipitation intensity increase. This is the case up to 10 mm h−1 regarding CT, whereas under PT, this value is 18 mm h−1. This suggests that independently from annual variation of single cultivation runs or temporary soil hydraulic conditions, PT has a general long-term effect on infiltration increase, and the earthworms and other soil fauna have a key role in this effect. The calculated soil permeability values also demonstrate these trends (Table 3). CT had higher infiltration values throughout the year, even though most studies have emphasized that infiltration to CT soils increases over the long run, compared to PT [31,49].
Interestingly, right after seedbed preparation, CT retained 30% water surplus, although the preparation technically was the same. Therefore, plant residuals left on the field, even in a partly buried status, can trigger water retention. Plant residues protect the soil surface, keep the macropores open, and provide natural nutrition for the macrofauna. Earthworms' life conditions are better under CT, owing to the increased amount of organic matter, more favorable moisture conditions, and reduced disturbance (Figure 4). The highest difference between the two tillage systems was found under the stubble condition. In Central Europe, this period is the most vulnerable from soil erosion aspects, as this is the season of the heaviest extreme thunderstorms while the soil is mostly uncovered [50]. An infiltration potential increase of 75% under these circumstances can lead to significant benefits regarding both water retention and soil loss mitigation.

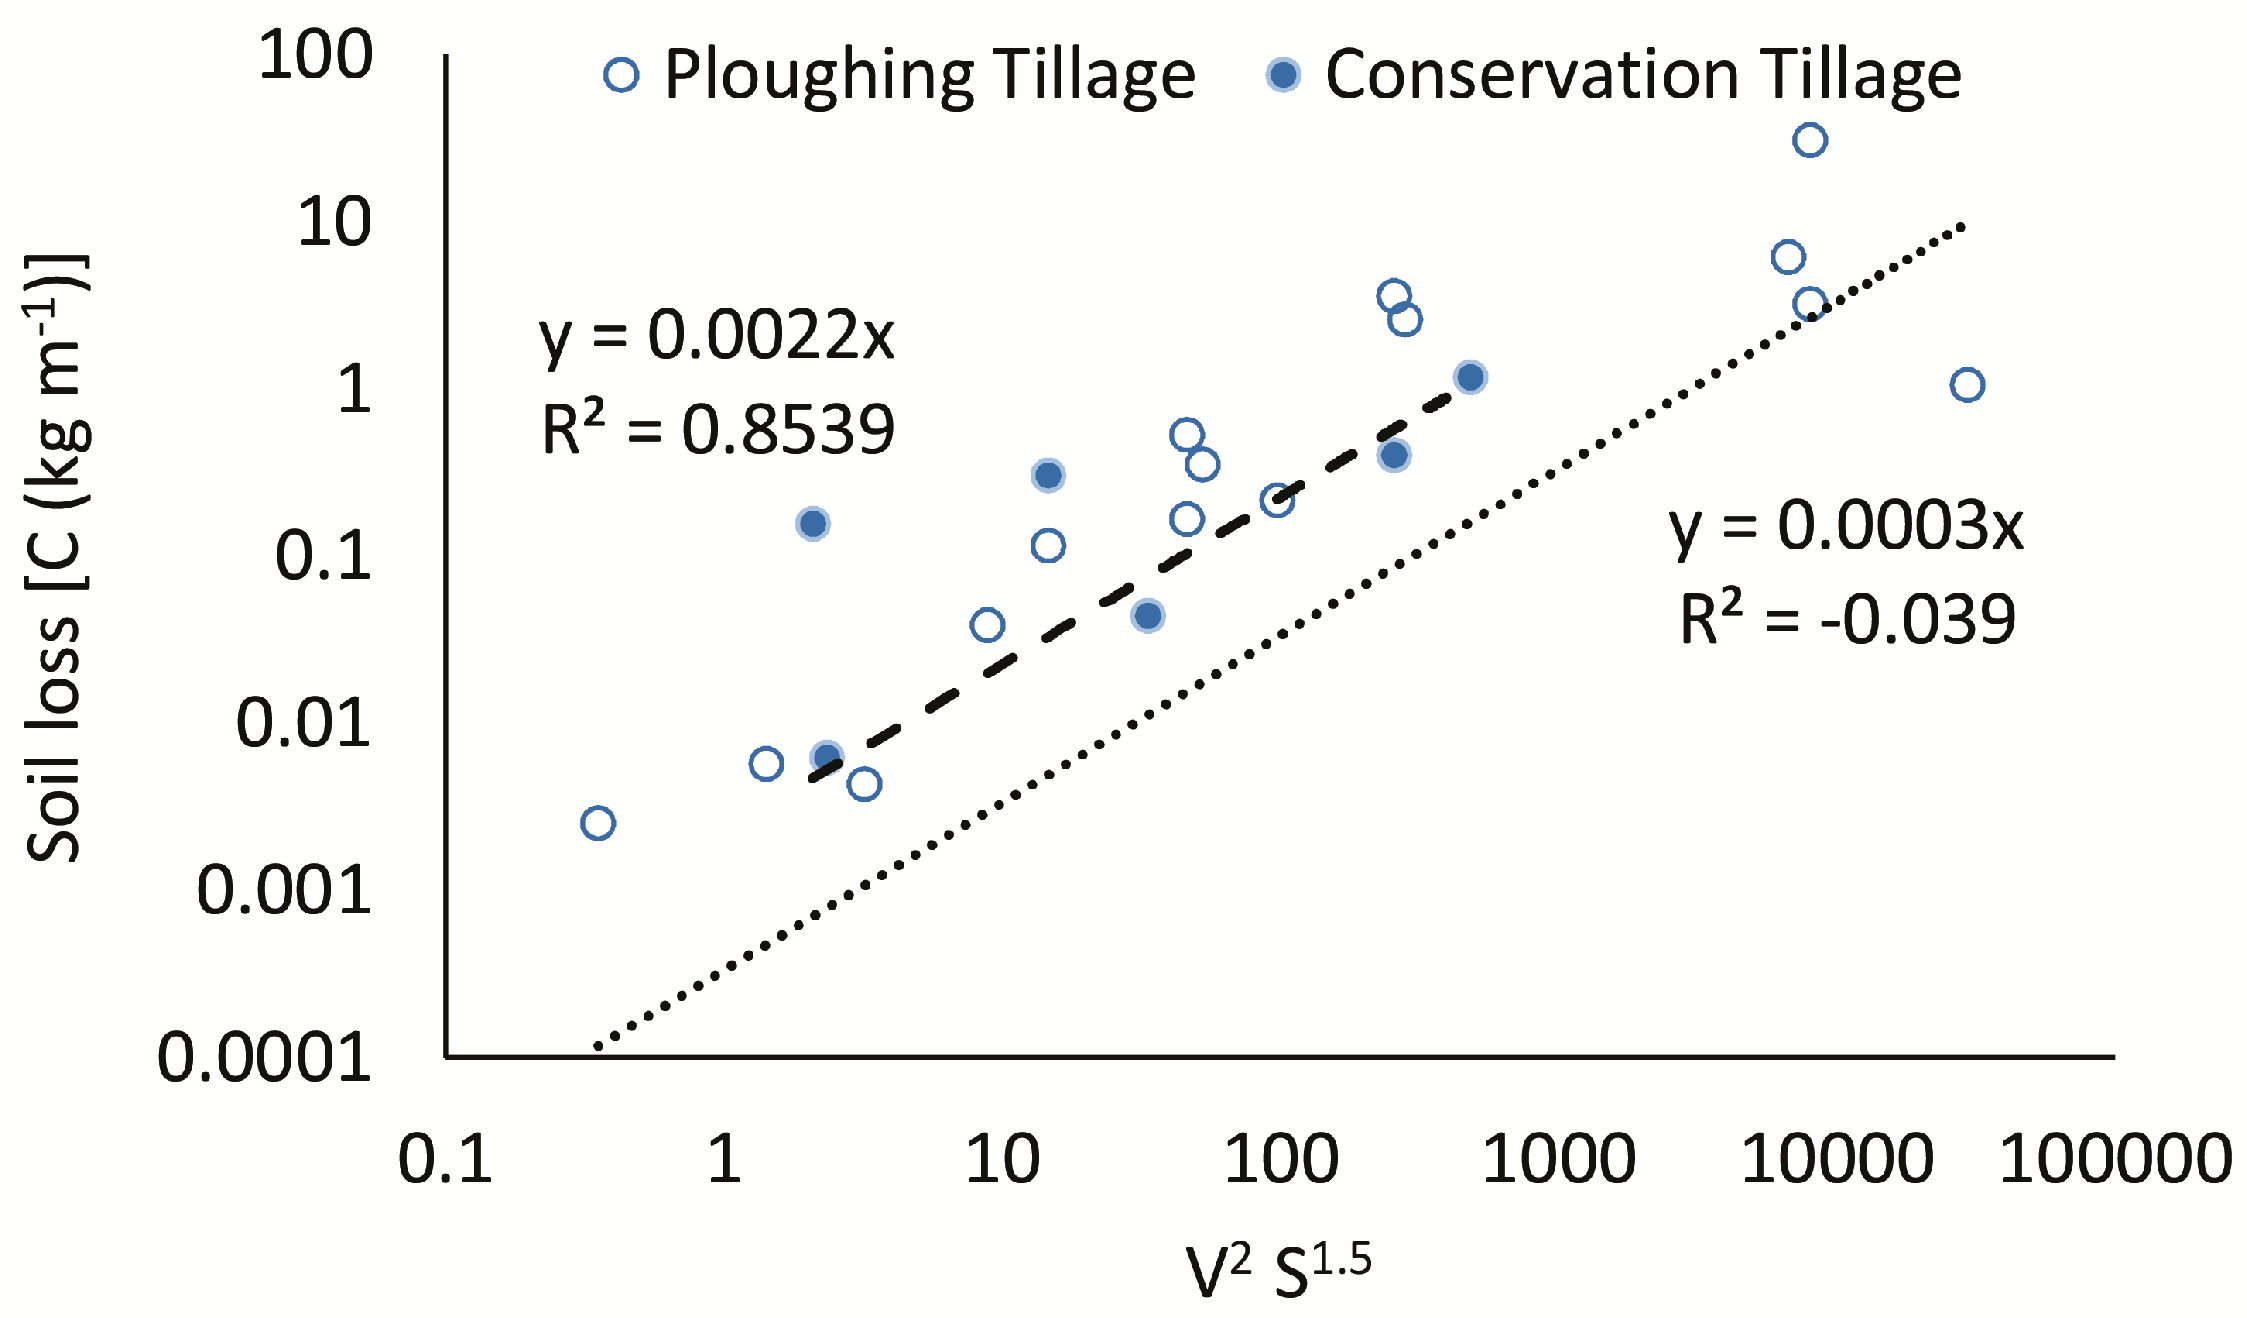
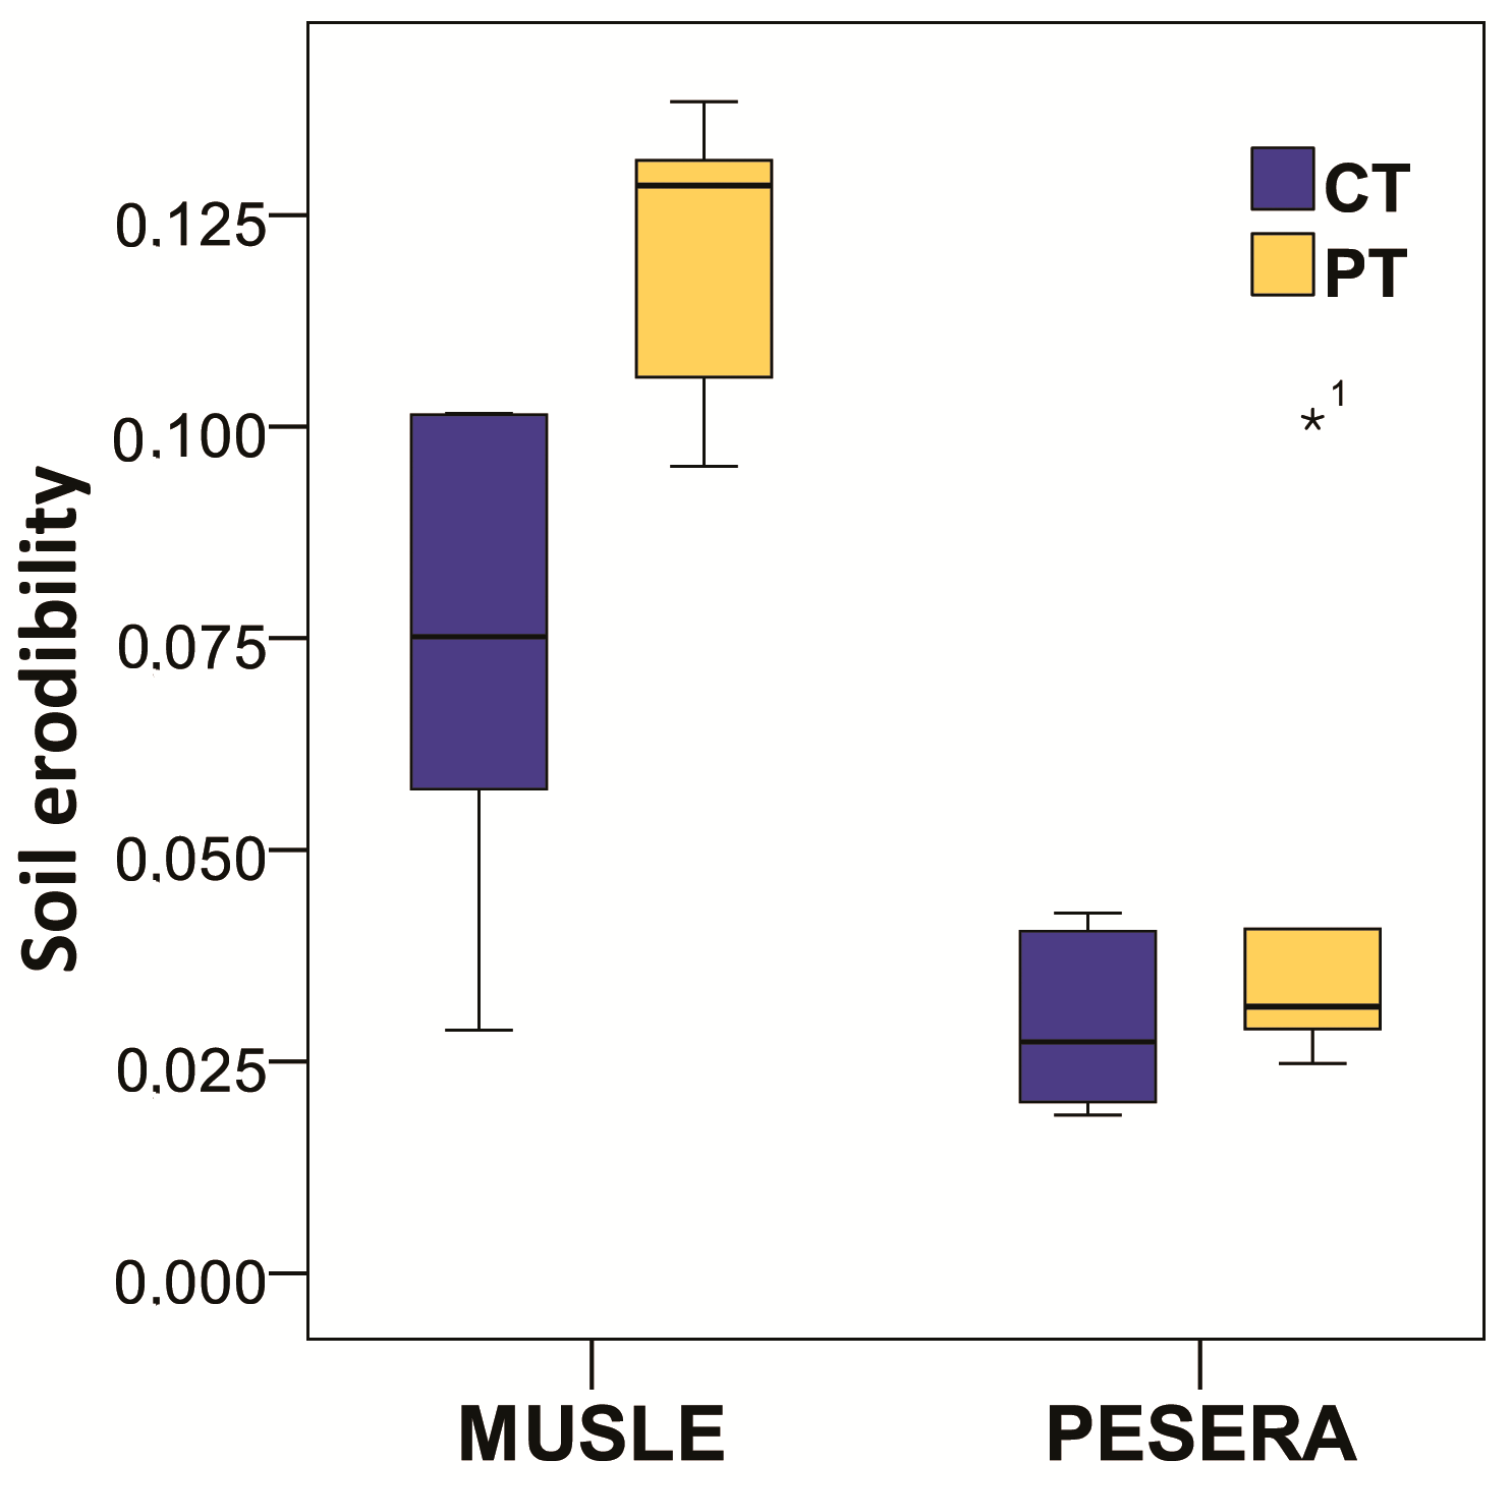
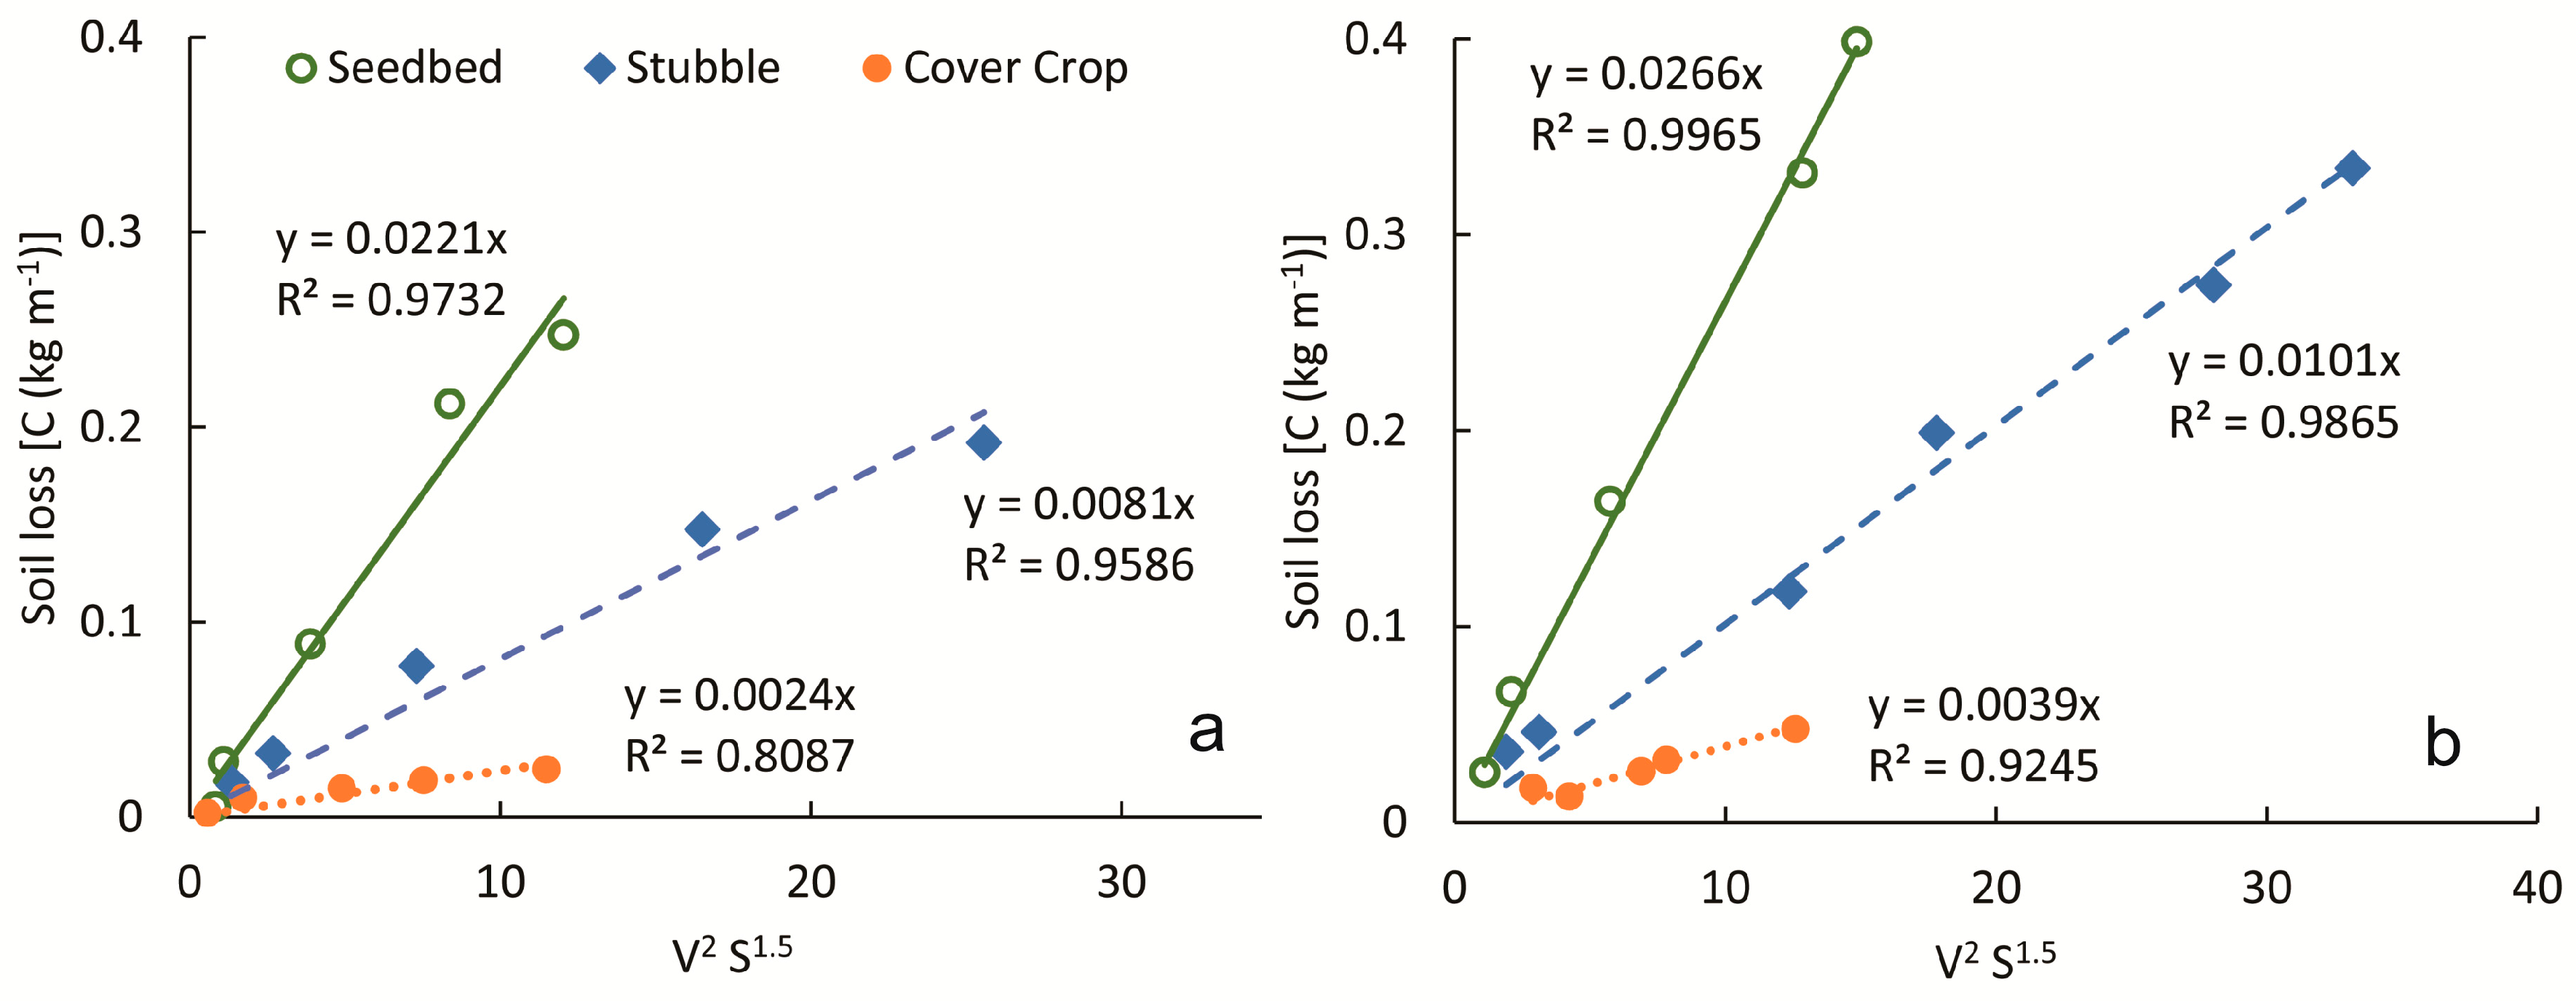
3.2. Soil Loss and Erodibility Results for the Small Plots

In general, soil was found to be resistant against erosion. The highest soil loss value measured, due to the most extreme precipitation event, even under the seedbed condition, did not exceed the value of tolerable soil loss [51]. The single soil loss results owing to the simulated rainfalls are listed in Table 1. The highest difference was measured under the seedbed soil condition, regardless of the tillage system. This is likely the result of high heterogeneity of soil porosity [52] and an increased value of surface roughness [53]. The most endangered soil status was the seedbed condition, soil covered by crops had the highest resistance against soil erosion, and the stubble condition fell between the two.
Theoretically, soil erodibility is a certain value that refers to a soil layer independent of its status, coverage, or porosity. Therefore, predicting soil erodibility is a function of only the chemical and physical properties of the soil layer. The USLE method instructs one to measure erodibility under the seedbed condition [34]. The PESERA model (Equation (4)) does not take into account soil status; therefore, in this case, the seedbed condition was also selected to be the standard. Thus, the soil erodibility (K factor) was determined for each single precipitation event using both the MUSLE and PESERA methods (Figure 5).
However, although both methods calculate soil erodibility, they are not the same in terms of interpretation. Therefore, the values are comparable within methods but not between models. The PESERA method indicated no significant difference between PT and CT erodibility, whereas the soil layer under PT had significantly higher erodibility (p < 0.05) based on the MUSLE method. Both methods calculate soil erodibility based on runoff volume; however, the MUSLE method considers runoff intensity, whereas the PESERA method operates only with slope steepness. Therefore, in the present case, the MUSLE method is more suitable for indicating changes in erodibility due to variation in properties of the same soil. Accordingly, differences, for instance, in aggregate stability can hardly affect erodibility predictions [54].
Fitting a function onto erodibility factor of Equation (4), all treatments have different theoretical erodibility results (Figure 6). It is true again that long-term CT decreased the theoretical soil erodibility throughout the year independent of the actual soil status; however, the lowest difference was found under the cover crop condition. This was expected, as crop cover protects the soil surface and therefore mitigates the role of the current physical soil properties in erosion control. On the other hand, the difference highlights the filtering effect of plant residuals left on the surface via CT, as was also reported by Alliaume et al. [14]. The highest difference was found under the seedbed condition, which likely from the changes in the physical soil properties after cultivation.

3.3. Field-Scale Results

At the field-scale, nine natural precipitation events occurred, which triggered soil loss from at least one plot (Table 4). In general, CT plots had lower runoff and soil loss values compared to those of PT plots.
At the field scale, CT also had the higher infiltration average; however, the current runoff rate strongly depends on precipitation properties, soil status, and coverage. In general, CT had a one order of magnitude lower runoff rate than PT did during the growing season.
The PESERA k values were also predicted based on the field-scale results (Figure 7). For CT, the predicted k value was smaller than the smallest value at the plot scale (cover crop) and had a fairly good fit, because each precipitation event occurred under the same soil and canopy cover circumstances, i.e., high maize canopy coverage (Table 2). This suggests that, under high canopy coverage and CT circumstances, net soil loss is a function of runoff volume and—at least within the investigated scales—independent from spatial scales. On the other hand, under PT conditions, some runoff events triggered extremely high soil loss; therefore, the function did not fit (Figure 7). This accords with the statements of Stroosnijder [22], who reported the scaling issue to be one of the biggest difficulties of erosion measurements. The reason is presumably the contribution of rill and gully erosion—as it was observed on PT plots—which can multiply soil loss and greatly increase the sediment concentration in runoff [55]. Accordingly, no adequate k value was predictable for this period at field scale under PT.
Both the USLE and MUSLE methods consider the crop and cover management factor (C) and conservation practice factor (P) for calculations [34,38]. C and P are determined in a more generalized way—measuring soil losses from plots with various managements and conservation practice—for much coarser spatial resolution; therefore, no adequate values are available for making erodibility (K) predictions in the present case. On the other hand, if formerly calculated (plot scale) MUSLE K values are taken into the USLE model, C and P can be calculated. Therefore, C was calculated for the PT plots at 0.39, which is in line with database values [56]. Using this C value for CT plots, P was found to be 0.07, which means 7% soil loss mitigation due to the CT techniques applied. This reduction is in accordance with the results of Vogel et al. [57], who found CT the most effective erosion control tool compared to grassed waterways or contoured buffer strips under maize. Moreover, Panagos et al. [58] could only estimate the effect of stone walls, grassed waterways, and contour tillage on the P factor at the continental scale, because the effect of CT is still unpredictable. Accordingly, the main conservation effect manifests as improvement of soil properties (differences in K) and the role of conservation practice is secondary.

4. Conclusions

The determination and application of apparent soil infiltration as a function of precipitation intensity seems to be a very useful tool for in situ hydrological modelling. Instead of a single value, such as saturated hydraulic conductivity, it is able to describe process reaction due to changes in the current environmental conditions. It is particularly suitable for making comparisons among tillage systems. Although CT was constructed originally for water retention purposes in arid and semi-arid environments, it has considerable benefits in sub-humid climates as well, both in terms of infiltration improvement and soil erosion mitigation. Theoretically, seedbed preparation is for increased water infiltration and improved porosity conditions, however no benefits of seedbed preparation were found under either tillage system. Contrarily, cover crop application was found to be effective against runoff and soil erosion, even in the second half of the growing season. Conservation practice is very valuable particularly by improving physical soil conditions and so decreasing soil loss. The role of better surface conditions is less important from the aspect of soil erosion. To extrapolate the results to various soil types and slope steepness, additional measurements among spatial scales are needed.

Acknowledgments

Support of the Hungarian Scientific Research Fund-PD112729 (A. Tóth) and the Bolyai János Research Scholarship of the Hungarian Academy of Sciences (for A. Tóth and G. Jakab) is gratefully acknowledged. The authors are also grateful to the three reviewers.

Author Contributions

G.J., B.M., and J.D. conceived and designed the experiments; G.J., B.M., J.A.S., A.T., Z.S., and D.Z. performed the experiments; G.J., B.M., J.D., and J.A.S. analyzed the data; Á.K. contributed materials; G.J., B.M., and J.D. wrote the paper.

Conflicts of Interest

The authors declare no conflict of interest.

References

  1. Rodrigo-Comino, J.; Wirtz, S.; Brevik, E.C.; Ruiz-Sinoga, J.D.; Ries, J.B. Assessment of agri-spillways as a soil erosion protection measure in Mediterranean sloping vineyards. J. Mt. Sci. 2017, 14, 1009–1022. [Google Scholar] [CrossRef]
  2. Kassam, A.; Friedrich, T.; Shaxson, F.; Pretty, J. The spread of conservation agriculture: Justification, sustainability, and uptake. Int. J. Agric. Sustain. 2009, 7, 292–320. [Google Scholar] [CrossRef]
  3. Villatoro-Sánchez, M.; Le Bissonnais, Y.; Moussa, R.; Rapidel, B. Temporal dynamics of runoff and soil loss on a plot scale under a coffee plantation on steep soil (Ultisol), Costa Rica. J. Hydrol. 2015, 523, 409–426. [Google Scholar] [CrossRef]
  4. Jakab, G.; Németh, T.; Csepinszky, B.; Madarász, B.; Szalai, Z.; Kertész, Á. The influence of short term soil sealing and crusting on hydrology and erosion at Balaton Uplands, Hungary. Carpathian J. Earth Environ. Sci. 2013, 8, 147–155. [Google Scholar]
  5. Wang, J.; Watts, D.B.; Meng, Q.; Zhang, Q.; Way, T.R. Influence of Surface Crusting on Infiltration of a Loess Plateau Soil. Soil Sci. Soc. Am. J. 2016, 80, 683–692. [Google Scholar] [CrossRef]
  6. Sang, X.; Wang, D.; Lin, X. Effects of tillage practices on water consumption characteristics and grain yield of winter wheat under different soil moisture conditions. Soil Tillage Res. 2016, 163, 185–194. [Google Scholar] [CrossRef]
  7. Mallari, K.J.B.; Arguelles, A.C.C.; Kim, H.; Aksoy, H.; Kavvas, M.L.; Yoon, J. Comparative analysis of two infiltration models for application in a physically based overland flow model. Environ. Earth Sci. 2015, 74, 1579–1587. [Google Scholar] [CrossRef]
  8. Gulick, S.H.; Grimes, D.W.; Goldhamer, D.A.; Munk, D.S. Cover-Crop-Enhanced Water Infiltration of a Slowly Permeable Fine Sandy Loam. Soil Sci. Soc. Am. J. 1994, 58, 1539–1546. [Google Scholar] [CrossRef]
  9. Mohammadshirazi, F.; Brown, V.K.; Heitman, J.L.; McLaughlin, R.A. Effects of tillage and compost amendment on infiltration in compacted soils. J. Soil Water Conserv. 2016, 71, 443–449. [Google Scholar] [CrossRef]
  10. Ward, P.R.; Roper, M.M.; Jongepier, R.; Micin, S.F. Impact of crop residue retention and tillage on water infiltration into a water-repellent soil. Biologia 2015, 70, 1480–1484. [Google Scholar] [CrossRef]
  11. Bogunovic, I.; Bilandzija, D.; Andabaka, Z.; Stupic, D.; Comino, J.R.; Cacic, M.; Brezinscak, L.; Maletic, E.; Pereira, P. Soil compaction under different management practices in a Croatian vineyard. Arab. J. Geosci. 2017, 10, 340. [Google Scholar] [CrossRef]
  12. Food and Agriculture Organization (FAO). Conservation Agriculture: Case Studies in Latin America and Africa; Food and Agriculture Organization (FAO): Rome, Italy, 2001. [Google Scholar]
  13. Kassam, A.; Basch, G.; Friedrich, T.; Gonzalez, E.; Trivino, P.; Mkomwa, S. Mobilizing greater crop and land potentials sustainably. Hung. Geogr. Bull. 2017, 66, 3–11. [Google Scholar] [CrossRef]
  14. Alliaume, F.; Rossing, W.A.H.; Tittonell, P.; Jorge, G.; Dogliotti, S. Reduced tillage and cover crops improve water capture and reduce erosion of fine textured soils in raised bed tomato systems. Agric. Ecosyst. Environ. 2014, 183, 127–137. [Google Scholar] [CrossRef]
  15. Gomez, J.A. Sustainability using cover crops in Mediterranean tree crops, olives and vines-Challenges and current knowledge. Hung. Geogr. Bull. 2017, 66, 13–28. [Google Scholar] [CrossRef]
  16. Kramberger, B.; Gselman, A.; Kristl, J.; Lešnik, M.; Šuštar, V.; Muršec, M.; Podvršnik, M. Winter cover crop: The effects of grass–clover mixture proportion and biomass management on maize and the apparent residual N in the soil. Eur. J. Agron. 2014, 55, 63–71. [Google Scholar] [CrossRef]
  17. Khan, M.N.; Gong, Y.; Hu, T.; Lal, R.; Zheng, J.; Justine, M.F.; Azhar, M.; Che, M.; Zhang, H. Effect of Slope, Rainfall Intensity and Mulch on Erosion and Infiltration under Simulated Rain on Purple Soil of South-Western Sichuan Province, China. Water 2016, 8, 528. [Google Scholar] [CrossRef]
  18. Rose, C. An Introduction to the Environmental Physics of Soil, Water and Watersheds; Cambridge University Press: Cambridge, UK, 2004; p. 443. [Google Scholar]
  19. Kuhlman, T.; Reinhard, S.; Gaaff, A. Estimating the costs and benefits of soil conservation in Europe. Land Use Policy 2010, 27, 22–32. [Google Scholar] [CrossRef]
  20. Szabó, J.; Jakab, G.; Szabó, B. Spatial and temporal heterogeneity of runoff and soil loss dynamics under simulated rainfall. Hung. Geogr. Bull. 2015, 64, 25–34. [Google Scholar] [CrossRef]
  21. Jirků, V.; Kodešová, R.; Nikodem, A.; Mühlhanselová, M.; Žigová, A. Temporal variability of structure and hydraulic properties of topsoil of three soil types. Geoderma 2013, 204–205, 43–58. [Google Scholar] [CrossRef]
  22. Stroosnijder, L. Measurement of erosion: Is it possible? Catena 2005, 63, 162–173. [Google Scholar] [CrossRef]
  23. Martínez-Murillo, J.F.; Nadal-Romero, E.; Regüés, D.; Cerdà, A.; Poesen, J. Soil erosion and hydrology of the western Mediterranean badlands throughout rainfall simulation experiments: A review. Catena 2013, 106, 101–112. [Google Scholar] [CrossRef]
  24. Rodrigo Comino, J.; Iserloh, T.; Lassu, T.; Cerdà, A.; Keestra, S.D.; Prosdocimi, M.; Brings, C.; Marzen, M.; Ramos, M.C.; Senciales, J.M.; et al. Quantitative comparison of initial soil erosion processes and runoff generation in Spanish and German vineyards. Sci. Total Environ. 2016, 565, 1165–1174. [Google Scholar] [CrossRef] [PubMed]
  25. Martínez-Hernández, C.; Rodrigo-Comino, J.; Romero-Díaz, A. Impact of lithology and soil properties on abandoned dryland terraces during the early stages of soil erosion by water in south-east Spain. Hydrol. Process. 2017, 31, 3095–3109. [Google Scholar] [CrossRef]
  26. Madarász, B.; Bádonyi, K.; Csepinszky, B.; Mika, J.; Kertész, Á. Conservation tillage for rational water management and soil conservation. Hung. Geogr. Bull. 2011, 60, 117–133. [Google Scholar]
  27. Centeri, C.; Jakab, G.; Szabó, S.; Farsang, A.; Barta, K.; Szalai, Z.; Bíró, Z. Comparison of particle-size analyzing laboratory methods. Environ. Eng. Manag. J. 2015, 14, 1125–1135. [Google Scholar]
  28. Kertész, Á.; Bádonyi, K.; Madarász, B.; Csepinszky, B. Environmental aspects of conventional and conservation tillage. In No-Till Farming Systems; Goddart, T., Zoebish, M., Gan, Y., Ellis, W., Watson, A., Sombatpanit, S., Eds.; Special Publication; World Association of Soiland Water Conservation: Bangkok, Thailand, 2007; pp. 313–329. [Google Scholar]
  29. Kertész, Á.; Madarász, B.; Csepinszky, B.; Benke, S.Z. The role of conservation agriculture in landscape protection. Hung. Geogr. Bull. 2010, 59, 167–180. [Google Scholar]
  30. Jakab, G.; Madarász, B.; Szabó, J.; Tóth, A.; Zachary, D.; Szalai, Z.; Dyson, J. Changes to infiltration and soil loss rates during the growing season under conventional and conservation tillage. Geophys. Res. Abstr. 2017, 19. [Google Scholar] [CrossRef]
  31. Zhang, G.S.; Chan, K.Y.; Oates, A.; Heenan, D.P.; Huang, G.B. Relationship between soil structure and runoff/soil loss after 24 years of conservation tillage. Soil Tillage Res. 2007, 92, 122–128. [Google Scholar] [CrossRef]
  32. Loch, R.J.; Robotham, B.G.; Zeller, L.; Masterman, N.; Orange, D.N.; Bridge, B.J.; Sheridan, G.; Bourke, J.J. A multi-purpose rainfall simulator for field infiltration and erosion studies. Aust. J. Soil Res. 2001, 39, 599–610. [Google Scholar] [CrossRef]
  33. Kirkby, M.J.; Irvine, B.J.; Jones, R.J.A.; Govers, G.; The Pesera Team. The PESERA coarse scale erosion model for Europe. I.—Model rationale and implementation. Eur. J. Soil Sci. 2008, 59, 1293–1306. [Google Scholar] [CrossRef] [Green Version]
  34. Wischmeier, W.H.; Smith, D.D. Predicting Rainfall Erosion Losses: A Guide to Conservation Planning; USDA Agricultural Handbook 537; US Government Printing Office: Washington, DC, USA, 1978.
  35. Wang, B.; Zheng, F.; Römkens, M.J.M. Comparison of soil erodibility estimate models. Acta Agric. Scand. Sect. B Soil Plant Sci. 2013, 63, 69–79. [Google Scholar] [CrossRef]
  36. Shabani, F.; Kumar, L.; Esmaeili, A. Improvement to the prediction of the USLE K factor. Geomorphology 2014, 204, 229–234. [Google Scholar] [CrossRef]
  37. Ostovari, Y.; Ghorbani-Dashtaki, S.; Bahrami, H.A.; Naderi, M.; Dematte, J.A.M.; Kerry, R. Modification of the USLE K factor for soil erodibility assessment on calcareous soils in Iran. Geomorphology 2016, 273, 385–395. [Google Scholar] [CrossRef]
  38. Williams, J.R. Sediment routing for agricultural watersheds. Water Resour. Bull. 1975, 11, 965–974. [Google Scholar] [CrossRef]
  39. Harper Adams University College. Earthworm Soil Core Standard Operating Procedure; Crop and Environment Research Centre: Newport, UK, 2003; p. 4. [Google Scholar]
  40. Blanco-Canqui, H.; Wienhold, B.J.; Jin, V.L.; Schmer, M.R.; Kibet, L.C. Long-term tillage impact on soil hydraulic properties. Soil Tillage Res. 2017, 170, 38–42. [Google Scholar] [CrossRef]
  41. Lipiec, J.; Kuś, J.; Słowińska-Jurkiewicz, A.; Nosalewicz, A. Soil porosity and water infiltration as influenced by tillage methods. Soil Tillage Res. 2006, 89, 210–220. [Google Scholar] [CrossRef]
  42. Strudley, M.W.; Green, T.R.; Ascough, J.C. Tillage effects on soil hydraulic properties in space and time: State of the science. Soil Tillage Res. 2008, 99, 4–48. [Google Scholar] [CrossRef]
  43. Freese, R.C.; Cassel, D.K.; Denton, H.P. Infiltration in a piedmont soil under three tillage systems. J. Soil Water Conserv. 1993, 48, 214–218. [Google Scholar]
  44. Kis, A.; Pongrácz, R.; Bartholy, J. Projected Trends of precipitation for Hungary: The effects of Bias correction. Légkör 2014, 59, 117–120. [Google Scholar]
  45. Bartholy, J.; Pongrácz, R.; Kis, A. Projected changes of extreme precipitation using multi-model approach. Q. J. Hung. Meteorol. Serv. 2015, 119, 129–142. [Google Scholar]
  46. Zicsi, A. Die Auswirkung von Bodenbearbeitungsverfahren auf Zustand und Besatzdichte von Einheimischen Regenwürmern; Graff, B., Satchell, G., Eds.; Progress in Soil Biology; Friedrich Vieweg: Braunschweig, Germany, 1967; pp. 290–298. [Google Scholar]
  47. Emmerling, C. Response of earthworm communities to different types of soil tillage. Appl. Soil Ecol. 2001, 17, 91–96. [Google Scholar] [CrossRef]
  48. Birkás, M.; Jolánkai, M.; Gyuricza, C.; Percze, A. Tillage effects on compaction, earthworms and other soil quality indicators in Hungary. Soil Tillage Res. 2004, 78, 185–196. [Google Scholar] [CrossRef]
  49. Thierfelder, C.; Wall, P.C. Effects of conservation agriculture techniques on infiltration and soil water content in Zambia and Zimbabwe. Soil Tillage Res. 2009, 105, 217–227. [Google Scholar] [CrossRef]
  50. Mueller, E.N.; Pfister, A. Increasing occurrence of high-intensity rainstorm events relevant for the generation of soil erosion in a temperate lowland region in Central Europe. J. Hydrol. 2011, 411, 266–278. [Google Scholar] [CrossRef]
  51. Duan, X.; Shi, X.; Li, Y.; Li, R.; Fen, D. A new method to calculate soil loss tolerance for sustainable soil productivity in farmland. Agron. Sustain. Dev. 2017, 37. [Google Scholar] [CrossRef]
  52. Vaezi, A.R.; Ahmadi, M.; Cerdà, A. Contribution of raindrop impact to the change of soil physical properties and water erosion under semi-arid rainfalls. Sci. Total Environ. 2017, 583, 382–392. [Google Scholar] [CrossRef] [PubMed]
  53. Vermang, J.; Norton, L.D.; Huang, C.; Cornelis, W.M.; da Silva, A.M.; Gabriels, D. Characterization of Soil Surface Roughness Effects on Runoff and Soil Erosion Rates under Simulated Rainfall. Soil Sci. Soc. Am. J. 2015, 79, 903–916. [Google Scholar] [CrossRef]
  54. Auerswald, K.; Fiener, P.; Martin, W.; Elhaus, D. Use and misuse of the K factor equation in soil erosion modeling: An alternative equation for determining USLE nomograph soil erodibility values. Catena 2014, 118, 220–225. [Google Scholar] [CrossRef]
  55. Porto, P.; Walling, D.E.; Capra, A. Using 137Cs and 210Pbex measurements and conventional surveys to investigate the relative contributions of interrill/rill and gully erosion to soil loss from a small cultivated catchment in Sicily. Soil Tillage Res. 2014, 135, 18–27. [Google Scholar] [CrossRef]
  56. Guo, Q.; Liu, B.; Xie, Y.; Liu, Y.; Yin, S. Estimation of USLE crop and management factor values for crop rotation systems in China. J. Integr. Agric. 2015, 14, 1877–1888. [Google Scholar] [CrossRef]
  57. Vogel, E.; Deumlich, D.; Kaupenjohann, M. Bioenergy maize and soil erosion—Risk assessment and erosion control concepts. Geoderma 2016, 261, 80–92. [Google Scholar] [CrossRef]
  58. Panagos, P.; Borrelli, P.; Meusburger, K.; van der Zanden, E.H.; Poesen, J.; Alewell, C. Modelling the effect of support practices (-factor) on the reduction of soil erosion by water at European scale. Environ. Sci. Policy 2015, 51, 23–34. [Google Scholar] [CrossRef] [Green Version]
Figure 1. Location of the study area (solid red square) (A), aerial photo of the Szentgyörgyvár soil erosion experimental site, with the four plots outlined in red (B). CT: conservation tillage, PT: ploughing tillage.
Sustainability 09 01726 g001
Figure 2. Fitted function on measured runoff values with apparent infiltration intensity (measurements for the seedbed condition under ploughing tillage (a) and conservation tillage (b); Measurement codes refer to the properties in Table 1). The calculated apparent infiltration values are highlighted. (y = cumulated runoff; x = irrigation time; R2 = coefficient of determination).
Sustainability 09 01726 g002
Figure 3. Final apparent infiltration rate changes as a function of irrigation intensity fitted using Equation (2); (a) conservation tillage; (b) ploughing tillage. (Legend is for both subfigures).
Sustainability 09 01726 g003
Figure 4. Effect of tillage on earthworm number (a) and weight (b) at Szentgyörgyvár in October 2016 (CT: conservation tillage, PT: ploughing tillage) for n = 18, Differences between the tillage systems are significant at the p < 0.01 level.
Sustainability 09 01726 g004
Figure 5. Soil erodibility values of the seedbed condition soils determined by rainfall simulation, calculated according to the Pan-European Soil Erosion Risk Assessment [33] and Modified Universal Soil Loss Equation [38] methods; CT: conservation tillage, PT: ploughing tillage.
Sustainability 09 01726 g005
Figure 6. Rainfall simulation soil loss data as a function of runoff volume (V) and slope steepness (S). Based on Equation (4), the steepness of the fitted function represents soil erodibility (k). (a) conservation tillage and (b) ploughing tillage. (y = soil loss; x = V2 S1.5; R2 = coefficient of determination).
Sustainability 09 01726 g006
Figure 7. Field-scale soil loss data owing to natural rainfalls as a function of runoff volume (V) and slope steepness (S). Based on Equation (4), the steepness of the fitted function represents soil erodibility (k). Scales are logarithmic. (y = soil loss; x = V2 S1.5; R2 = coefficient of determination).
Sustainability 09 01726 g007
Table 1. Cultivation activities used at the studied experimental sites.
Ploughing TillageConservation Tillage
In 2015 After Sunflower Harvest
Stubble choppingStubble chopping
Discing and rollingDiscing and rolling
Medium deep subsoilingMedium deep subsoiling
Ploughing-
Leveling-
Sowing (cover crop *)Sowing (cover crop *)
In 2016
Weed control and choppingWeed control and chopping
Seedbed preparationSeedbed preparation
Sowing (maize **)Sowing (maize **)
Stubble choppingStubble chopping
DiscingDiscing
* Sinapis alba, Fagopyrum esculentum, Raphanus sativus, Trifolium incarnatum, Phacelia tanacetifolia; ** NK Furio.
Table 2. Main parameters of the artificial rainfalls and corresponding infiltration and soil loss values created on the 6 m2 plots, with 9% slope steepness. The shaded rows were under conventional tillage, whereas the unshaded rows were under conservation tillage. MUSLE = Modified soil loss equation [38]; K = soil erodibility factor.
Rain AmountRain intensityRunoffFinal Runoff IntensityApparent InfiltrationSoil LossMUSLE K
(mm)(mm h−1)(mm)(mm h−1)(mm h−1)(t ha−1)
Cover crop14.7322.67.5624.440.060.040
10.6783.739.2438.760.090.019
8.2583.429.5228.480.040.012
11.1956.661.5633.440.160.020
9.71125.565.5246.480.110.014
17.5332.32.8830.120.010.009
12.7551.911.5243.480.030.021
13.5894.236.7252.280.060.013
9.2763.337.0838.920.050.012
14.51045.749.3254.680.080.012
Seedbed13.4270.94.3222.680.090.138
5.9372.418.3618.640.220.095
8.7764.342.4833.520.550.106
10.21006.471.2828.721.110.129
11.11147.580.2833.721.330.131
13.4311.04.3226.680.020.029
6.3461.515.4830.520.090.057
8.7723.433.1238.880.300.075
11.31006.662.2837.720.820.102
8.61064.372.3633.640.710.101
Stubble6.4282.612.2415.70.120.113
6.1392.922.6816.040.150.070
10.2686.0347.8820.570.390.062
10.8967.876.3219.980.660.053
13.110110.382.818.20.910.059
6.9361.612.2423.760.060.066
6.5502.725.5624.440.110.075
9.3695.040.6828.320.260.086
12.3987.866.2431.760.490.040
15.41219.580.6440.360.640.036
Table 3. Soil permeability (mm h−1) by tillage practice and soil status and their ratio. Calculated based on Equation (1). CT: conservation tillage, PT: ploughing tillage.
Time of YearSoil ConditionsCTPTRate
AprilCover crop73441.62
MaySeedbed45351.29
OctoberStubble35201.75
Table 4. Precipitation, runoff, and soil loss properties measured on 1200 m2 field plots at the Szentgyörgyvár experimental site during 2016. I30 is the highest 30 min rainfall intensity during the precipitation; CT: conservation tillage; PT: ploughing tillage; cc = concentration.
Date(Day.Month.)4.3.6. 6.16. 6.20.6.14.7.18.7.6.8.16.8.27.10.Sum.
Precipi-Tationamountmm17.238.810.09.458.69.835.020.036.4
I30mm h−12.428.28.84.422.29.612.212.86.2
durationh14.06.75.57.811.10.78.92.77.83
Runoff (mm)CTplot1 1.570.142 0.5670.003 2.282
plot2 2.160.375 0.150 2.685
PTplot10.0588.021.5710.29216.7960.1170.3750.292 27.521
plot2 8.771.6420.9678.7670.6670.7130.6670.17522.368
Soil loss (t ha−1)CTplot1 0.080.031 0.009 0.120
plot2 0.230.061 0.001 0.292
PTplot10.0011.230.7200.0080.2080.0010.0230.008 2.199
plot2 6.080.5120.0430.6370.1060.0690.0330.0017.481
Sediment cc. (g L−1)CTplot1 5.121.9 1.6
plot2 10.716.3 0.7
PTplot11.715.446.02.81.20.96.22.8
plot2 69.631.34.57.316.09.75.00.6

