Adoption of Falsified Medical Products in a Low-Income Country: Empirical Evidence for Suriname

1
Econometric Institute, Erasmus School of Economics, 3062PA Rotterdam, The Netherlands
2
Department of Economics, Anton de Kom University, Leysweg 86, P.O. Box 9212, Paramaribo, Suriname
*
Author to whom correspondence should be addressed.
Sustainability 2017, 9(10), 1732; https://doi.org/10.3390/su9101732
Submission received: 10 August 2017
/
Revised: 13 September 2017
/
Accepted: 19 September 2017
/
Published: 26 September 2017
(This article belongs to the Special Issue Risk Measures with Applications in Finance and Economics)
Abstract
:Based on detailed shipping figures for Suriname’s main harbour in Paramaribo, we estimate the total shipments (in kilograms) of original and falsified medical products for 1996–2008 across five product categories. Using various time series techniques and diffusion models, we document that total cumulative shipments of falsified products make about 40% of total shipments. We observe that there are apparently two distinct sets of consumers for original and for falsified products. Subsequently, we survey more than 300 citizens of Suriname from various demographics and ask questions about their potential adoption of falsified medicines. We find that income, age, and family size have no correlation, while the way people are insured does. Hence, the two sets of consumers can roughly be identified and clear-cut policy suggestions are presented. “The World Health Organization (WHO) estimates that up to 1% of medicines available in the developed world is likely to be counterfeited. This figure rises to 10% globally, although in some developing countries they estimate one third of medicines are counterfeit” (Various internet sites consulted January 2010 and the best estimate we have).
1. Introduction
The diffusion of pharmaceutical products has received some attention in the recent literature; see for example [1]. It has been documented that the diffusion patterns show various similarities with the diffusion patterns of durable consumer goods, see for example [2]. As pharmaceutical products may experience the impact of regulatory regimes, diffusion patterns may change direction and slope due to these regimes, see for example [3]. In all studies available, there is a strong focus on the diffusion patterns in western countries, usually driven by data availability, although [2] also include data for various low-income countries. A common assumption across all studies is that the focus is on the producer of the pharmaceutical products, usually the US or European companies.
In this paper we also address the diffusion patterns of pharmaceutical products, where we relegate the focus on the actual shipments of such products in a low-income country. This change of focus then naturally has to include the fact that in low-income countries often many pharmaceutical products are potentially falsified products. The exact available amount of these falsified drugs is unknown, and therefore we will first provide a method to estimate the fraction of falsified products within a single low-income country.
Exact data on falsified drugs are usually not available, and certainly not in a low-income country. One way to estimate the size of the falsified market is to try to disentangle the falsified diffusion from the total diffusion, as is proposed in [4] for software products. An alternative would be to estimate it directly from the shipments data, if these are available, see for example [5].
The focus in the present paper is the diffusion of original and falsified medical products in the South American country Suriname. Based on detailed data on shipments of products in five distinct categories, we estimate the diffusion of original and falsified products for the sample from 1996 to 2008. With these data, we can analyze the correlations between the two diffusion patterns. Also, we examine the lead and lag structure across original and falsified products. Finally, we estimate the total cumulative shipments using the familiar Bass model, and we compare the total levels for each of the categories. So, we provide estimates of the total amount that in the end will have found its way to consumers, here in Suriname. Note that we are not interested in the actual figures, but merely in the fraction of falsified products in the total amount.
One key main finding in this paper is that falsified drugs and other medical products eventually make up around 40% of the total shipments in this particular country of Suriname. Note that this fraction exceeds the estimates of the WHO. A second finding is that the two diffusion processes are correlated contemporaneously, reacting similarly to the same outside shocks, but that there is no significant lead or lag relationship. This suggests that the original and falsified products each address a distinct segment of the market. This finding has led us to survey many individuals in Suriname and to ask a range of questions. We aimed to find the distinctive features of the two groups of consumers, and it seems that the key distinctive feature concerns insurance. Basically, poor insurance means that people are more likely to opt for fake medication.
The outline of the paper is as follows. First, in Section 2 we describe the first part of the data collection which entails the creation of the two series for original and for falsified products. In Section 3 we analyze these data using basic time series techniques and familiar diffusion models. Section 4 continues with a discussion of the outcomes of a survey amongst more than 300 citizens of Suriname. Section 5 concludes with a discussion of the main findings and their implications.
2. Data Collection on Adoption over Time
We have collected data for the South American country of Suriname. It is a small and open economy, with a single large (maritime) harbour in the capital city of Paramaribo. The country has many natural resources. It used to be a colony of the Netherlands, before it became independent in 1975. Economic growth slowed down since the beginning of the 1980s, but since 2000 there has been steady growth in GDP and an increase in welfare. The country is sparsely populated, with most of the citizens living in the coastal area. Although average welfare is on the rise, the income inequalities in Suriname are quite large. The country boasts a non-negligible group of multi-millionaires, but on the other hand it is estimated that more than 60% of the population is below international poverty levels.
Sales records for medical products simply do not exist. Hence, we will have to estimate the diffusion patterns of these products using alternative methods. We consulted the General Bureau of Statistics (GBS) in Suriname and we were able to collect annual data on the imports of products in five categories for the period 1996 to and including 2008. The product categories are: Pharmaceutical items; Medicine, for sale small scale; Medicine, not for sale small scale; Wound-covering materials; and Blood items. These imports are measured in kilograms and in total value (in US dollars). We decided to take the weights as the measurement unit to avoid correction for inflation in the exporting countries. Crucial for our purposes is that we have information on the countries of origin of the shipments. In Appendix A, we give the countries of origin, and we indicate from which countries which products in the five categories originate. Clearly, Suriname imports from a long list of countries, and there is also variation across the categories.
To estimate the shipments of original products and falsified products, we use the software piracy index, which can be obtained from www.nationmaster.com. This website presents a list of countries and gives an estimate of the fraction of products (here: computer software) that are most likely falsified. In Appendix B we provide a list of relevant countries for our product categories and the corresponding percentages. Like this list, we shall take it as likely that 23% of the pharmaceutical products that are imported from Japan amount to falsified products, and that as much as 82% of these products originating from China are falsified. Of course, we shall never be certain whether these percentages also hold for our product categories, nor if this figure changes over time or amounts to a biased estimate, and hence the subsequent data should not be considered as exact amounts, but merely as estimates. At the same time, and for our purposes, the absolute numbers do not matter, as only their time series properties do. In order to allow the reader to verify the computations about which we report in the next section, we present our data in Appendix C. Graphical details and other aspects of these series will be discussed in the next section.
3. Analysis of Shipments Data
This section deals with the statistical analysis of the two diffusion series. We analyze the levels of the shipments, as in Appendix C, and the cumulated shipments. The latter are used to estimate the eventual total size of the market. The first pairs of series are analyzed to see if there are leading or lagging diffusion processes amongst the two series. We discuss the methodology, first for cumulative shipments and then for shipments themselves, and we discuss the results in each of the five categories.
3.1. Methodology for Cumulative Shipments
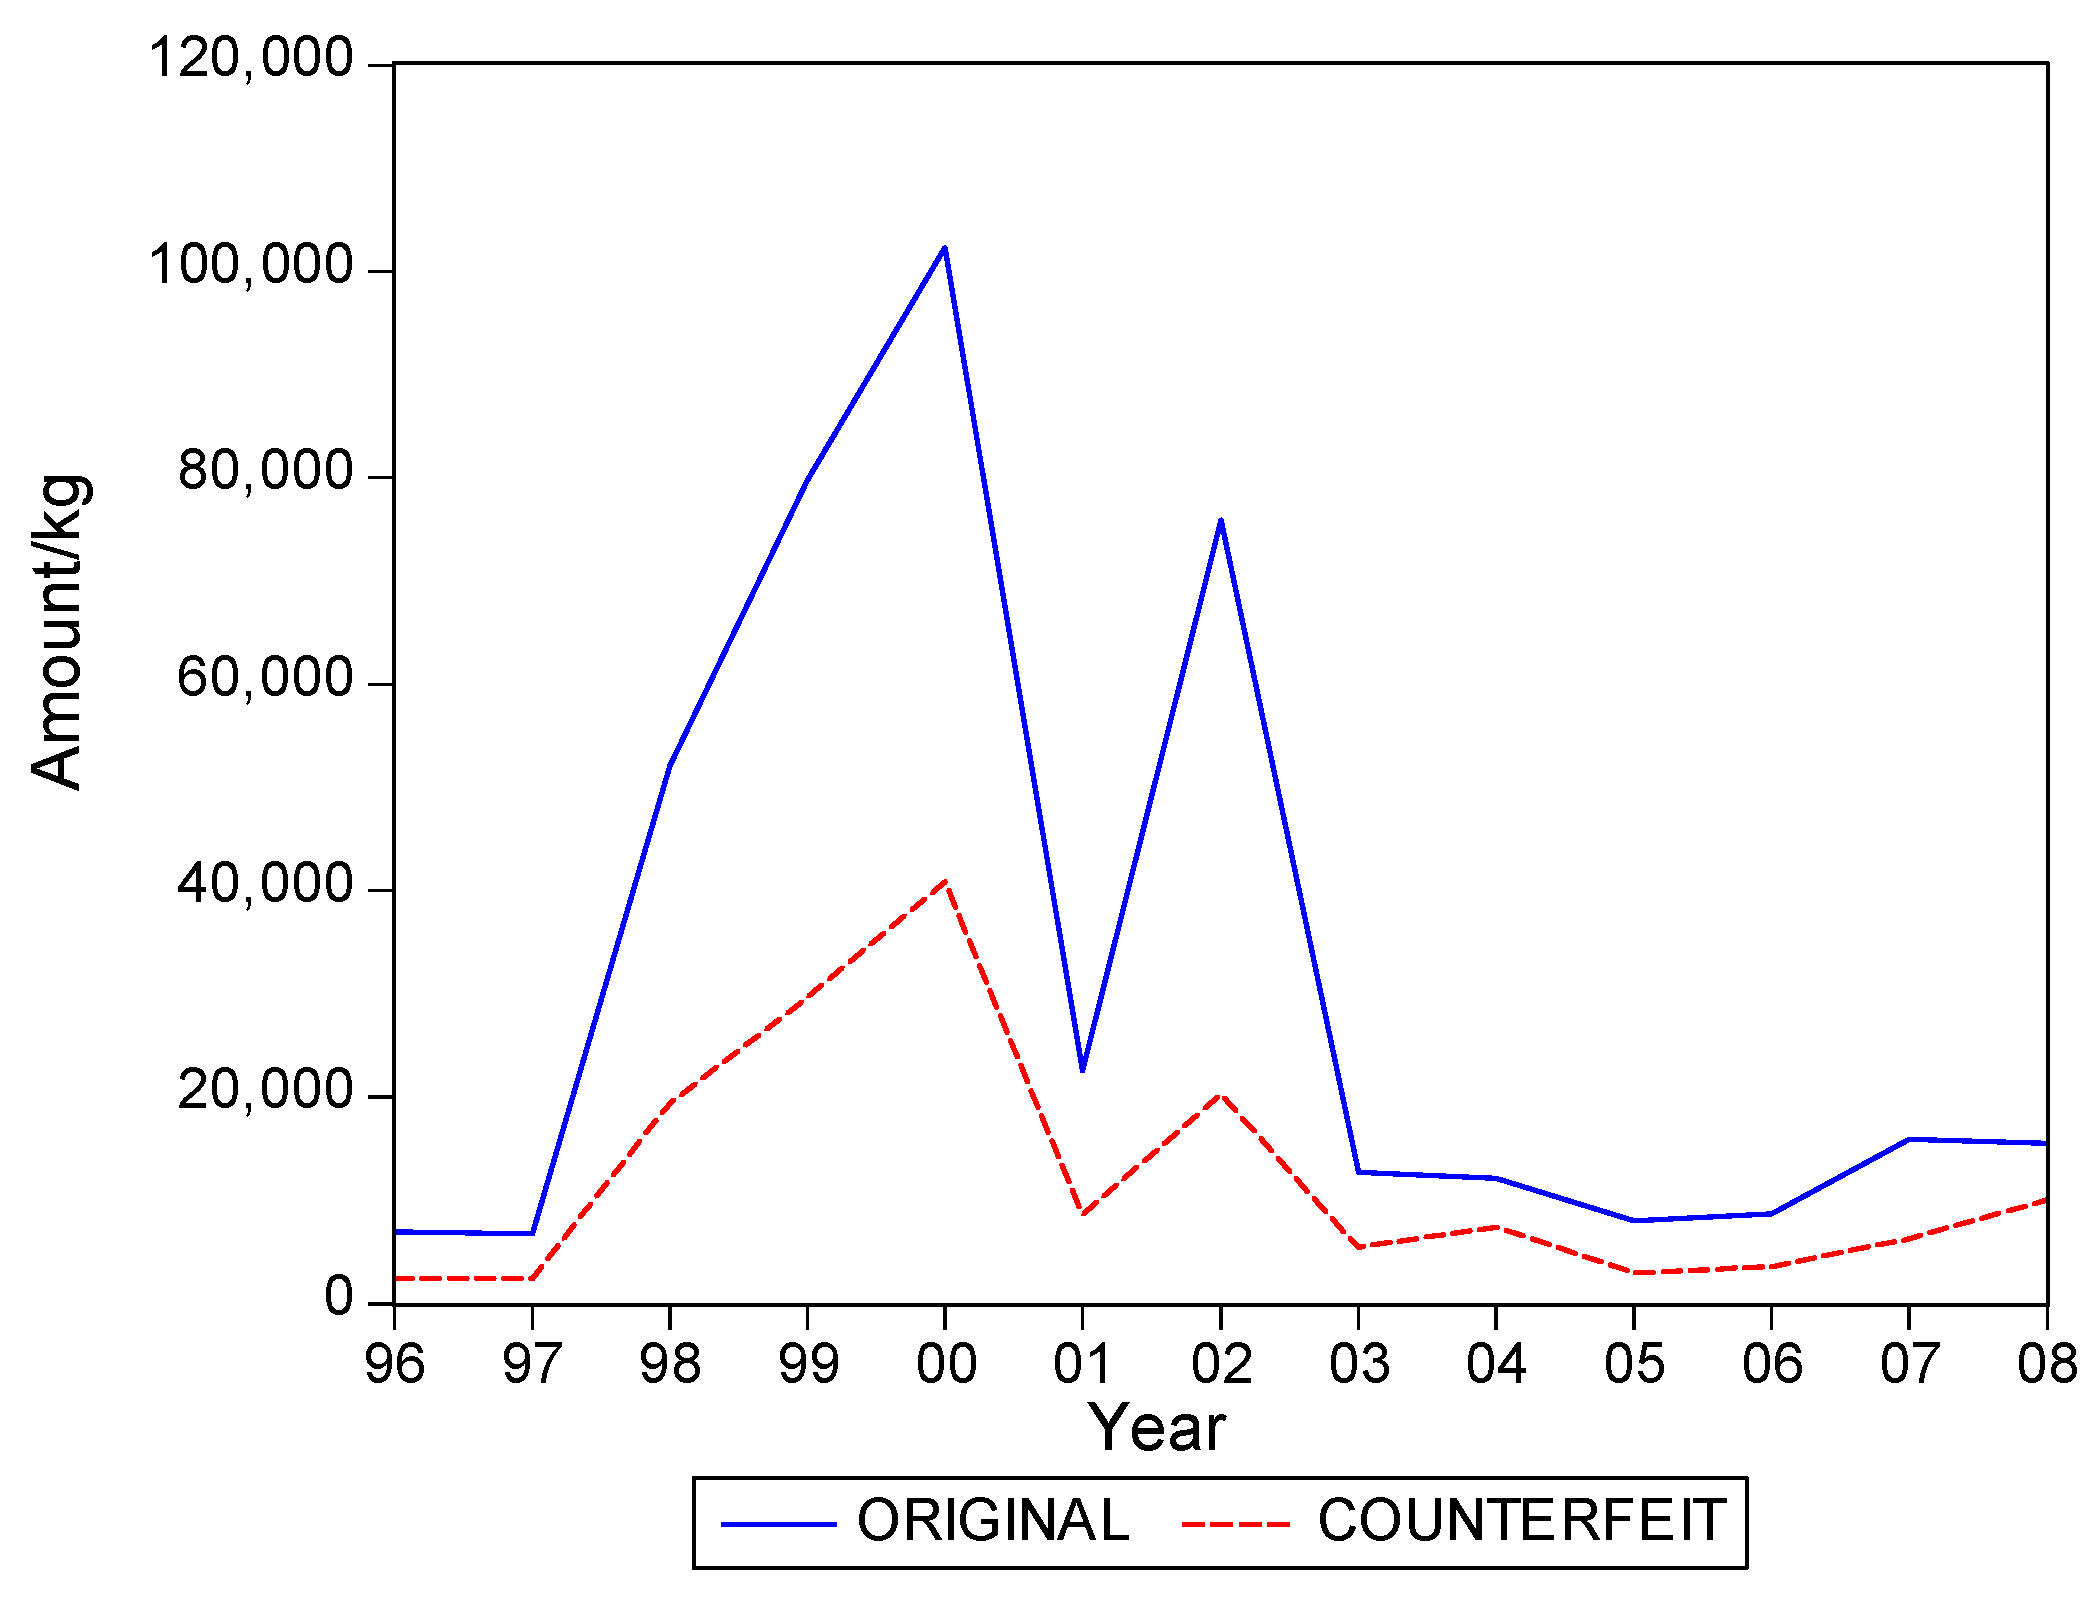
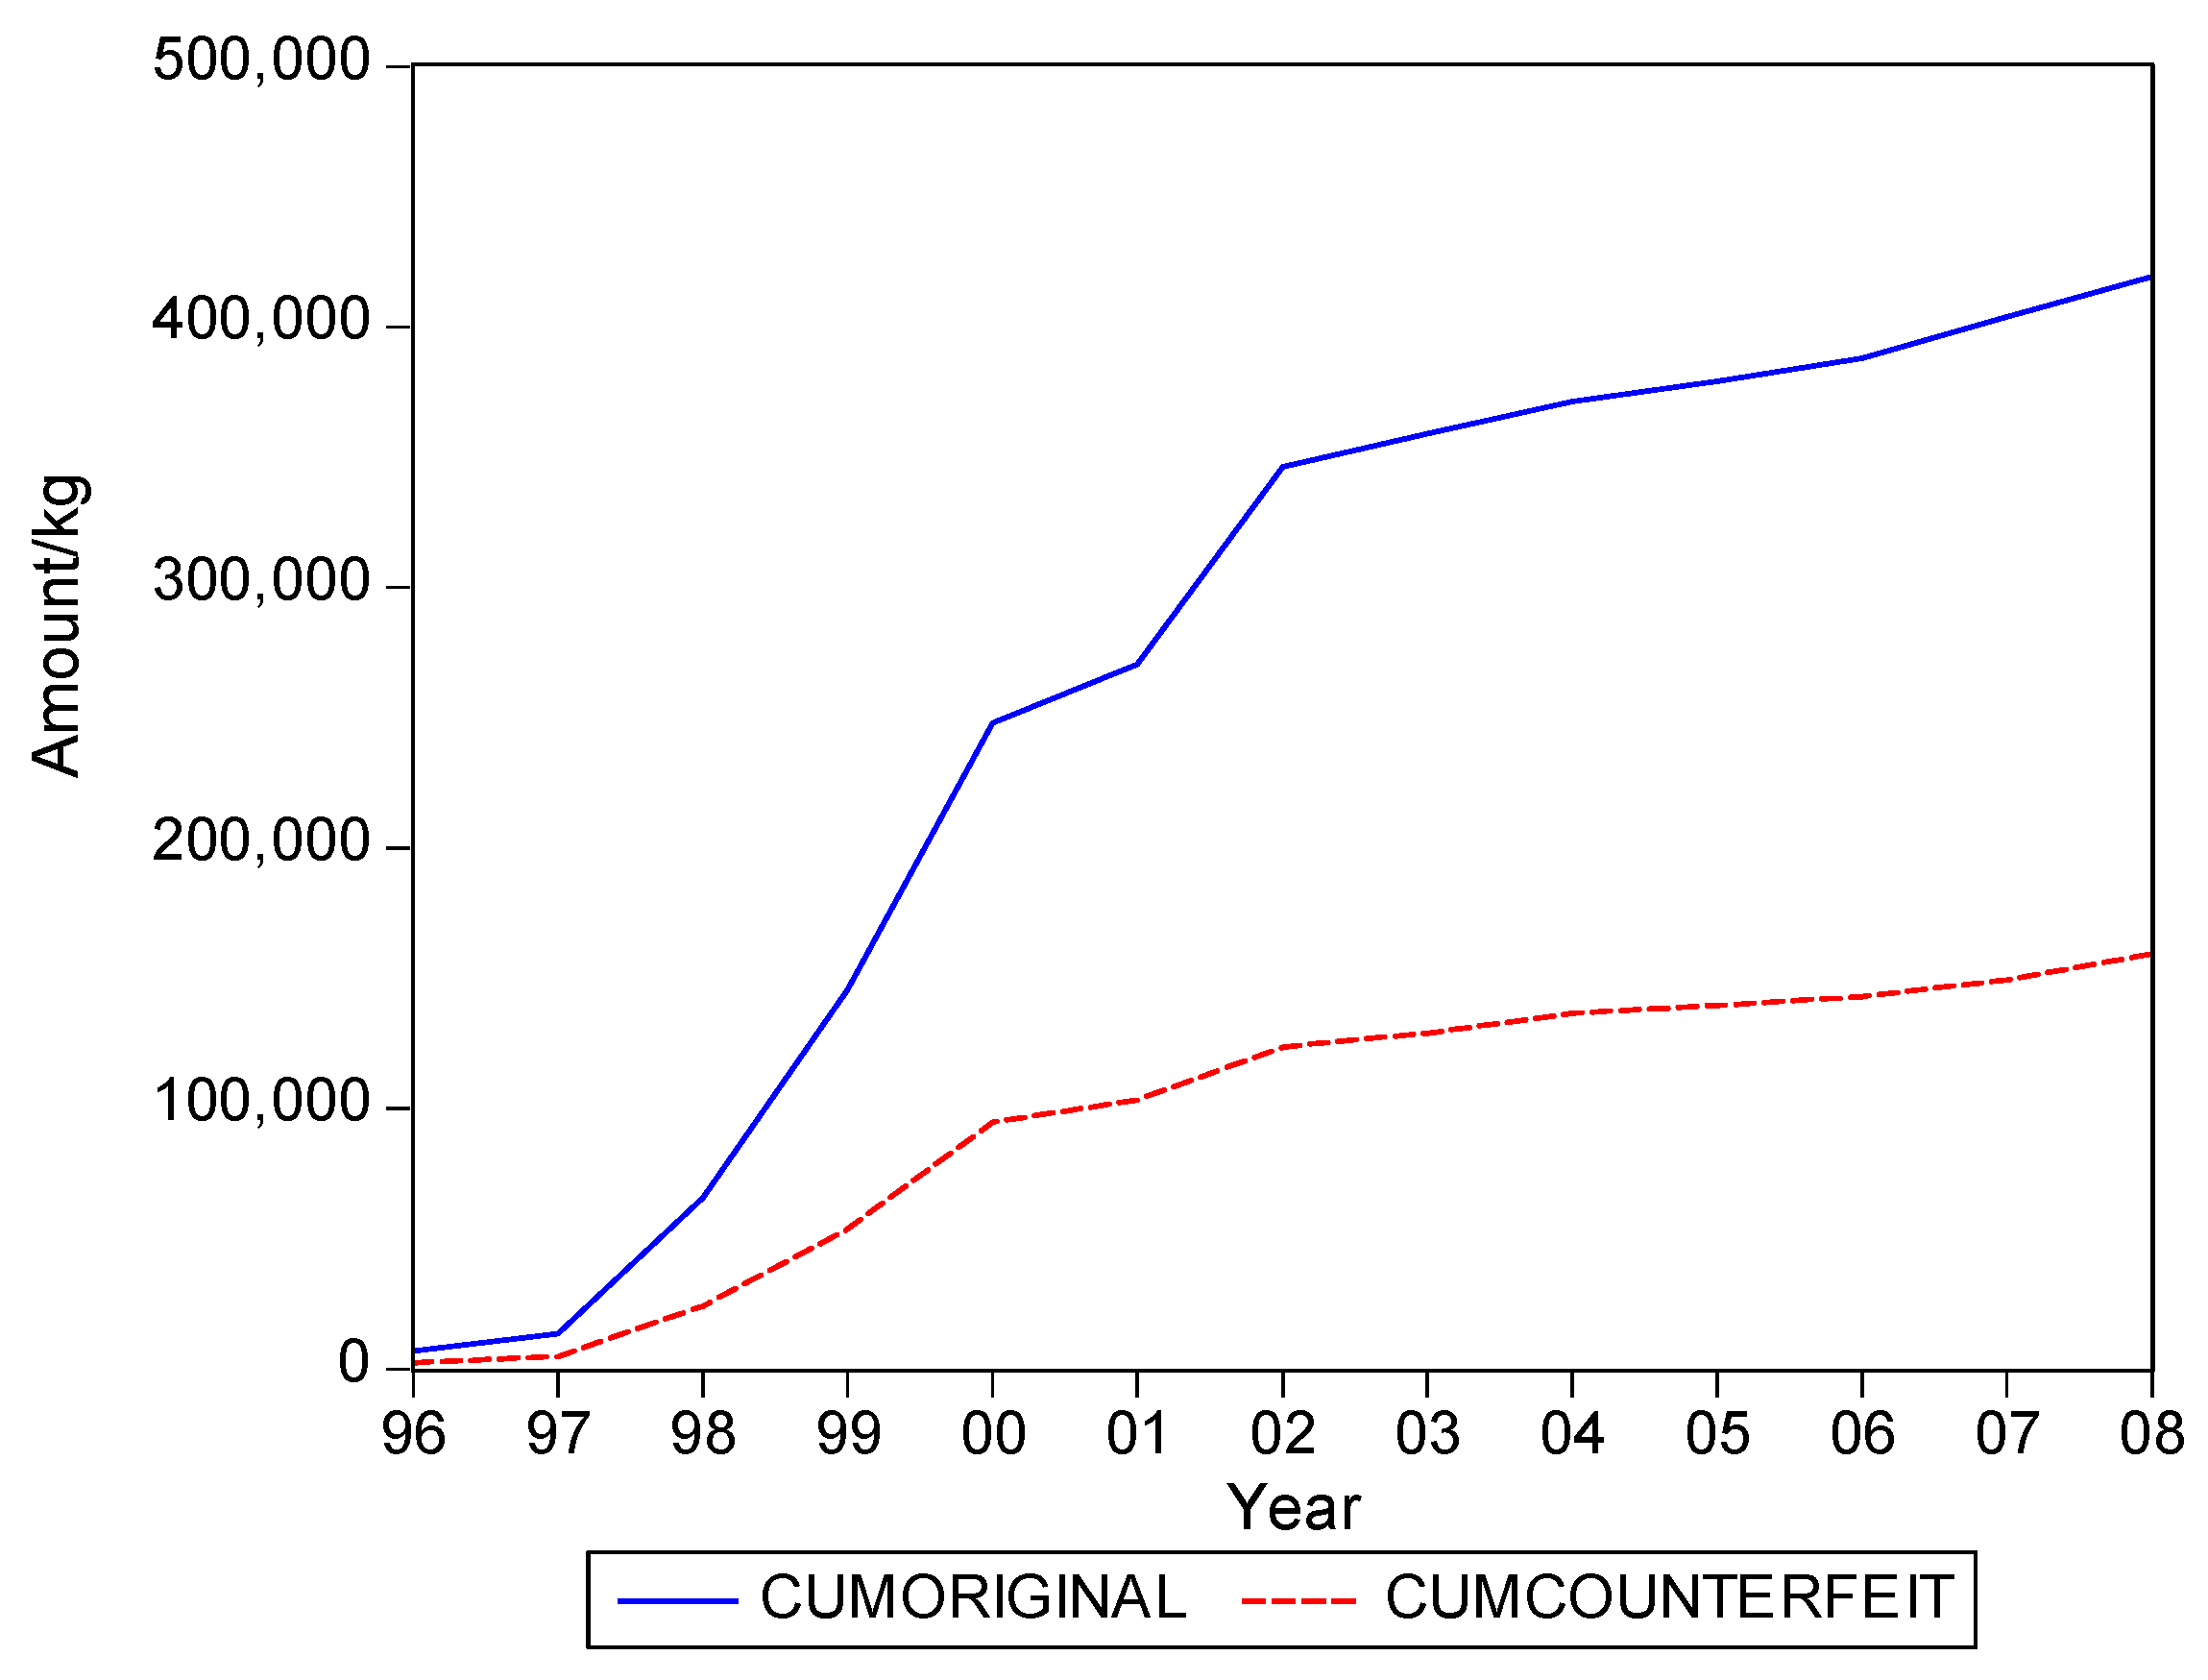
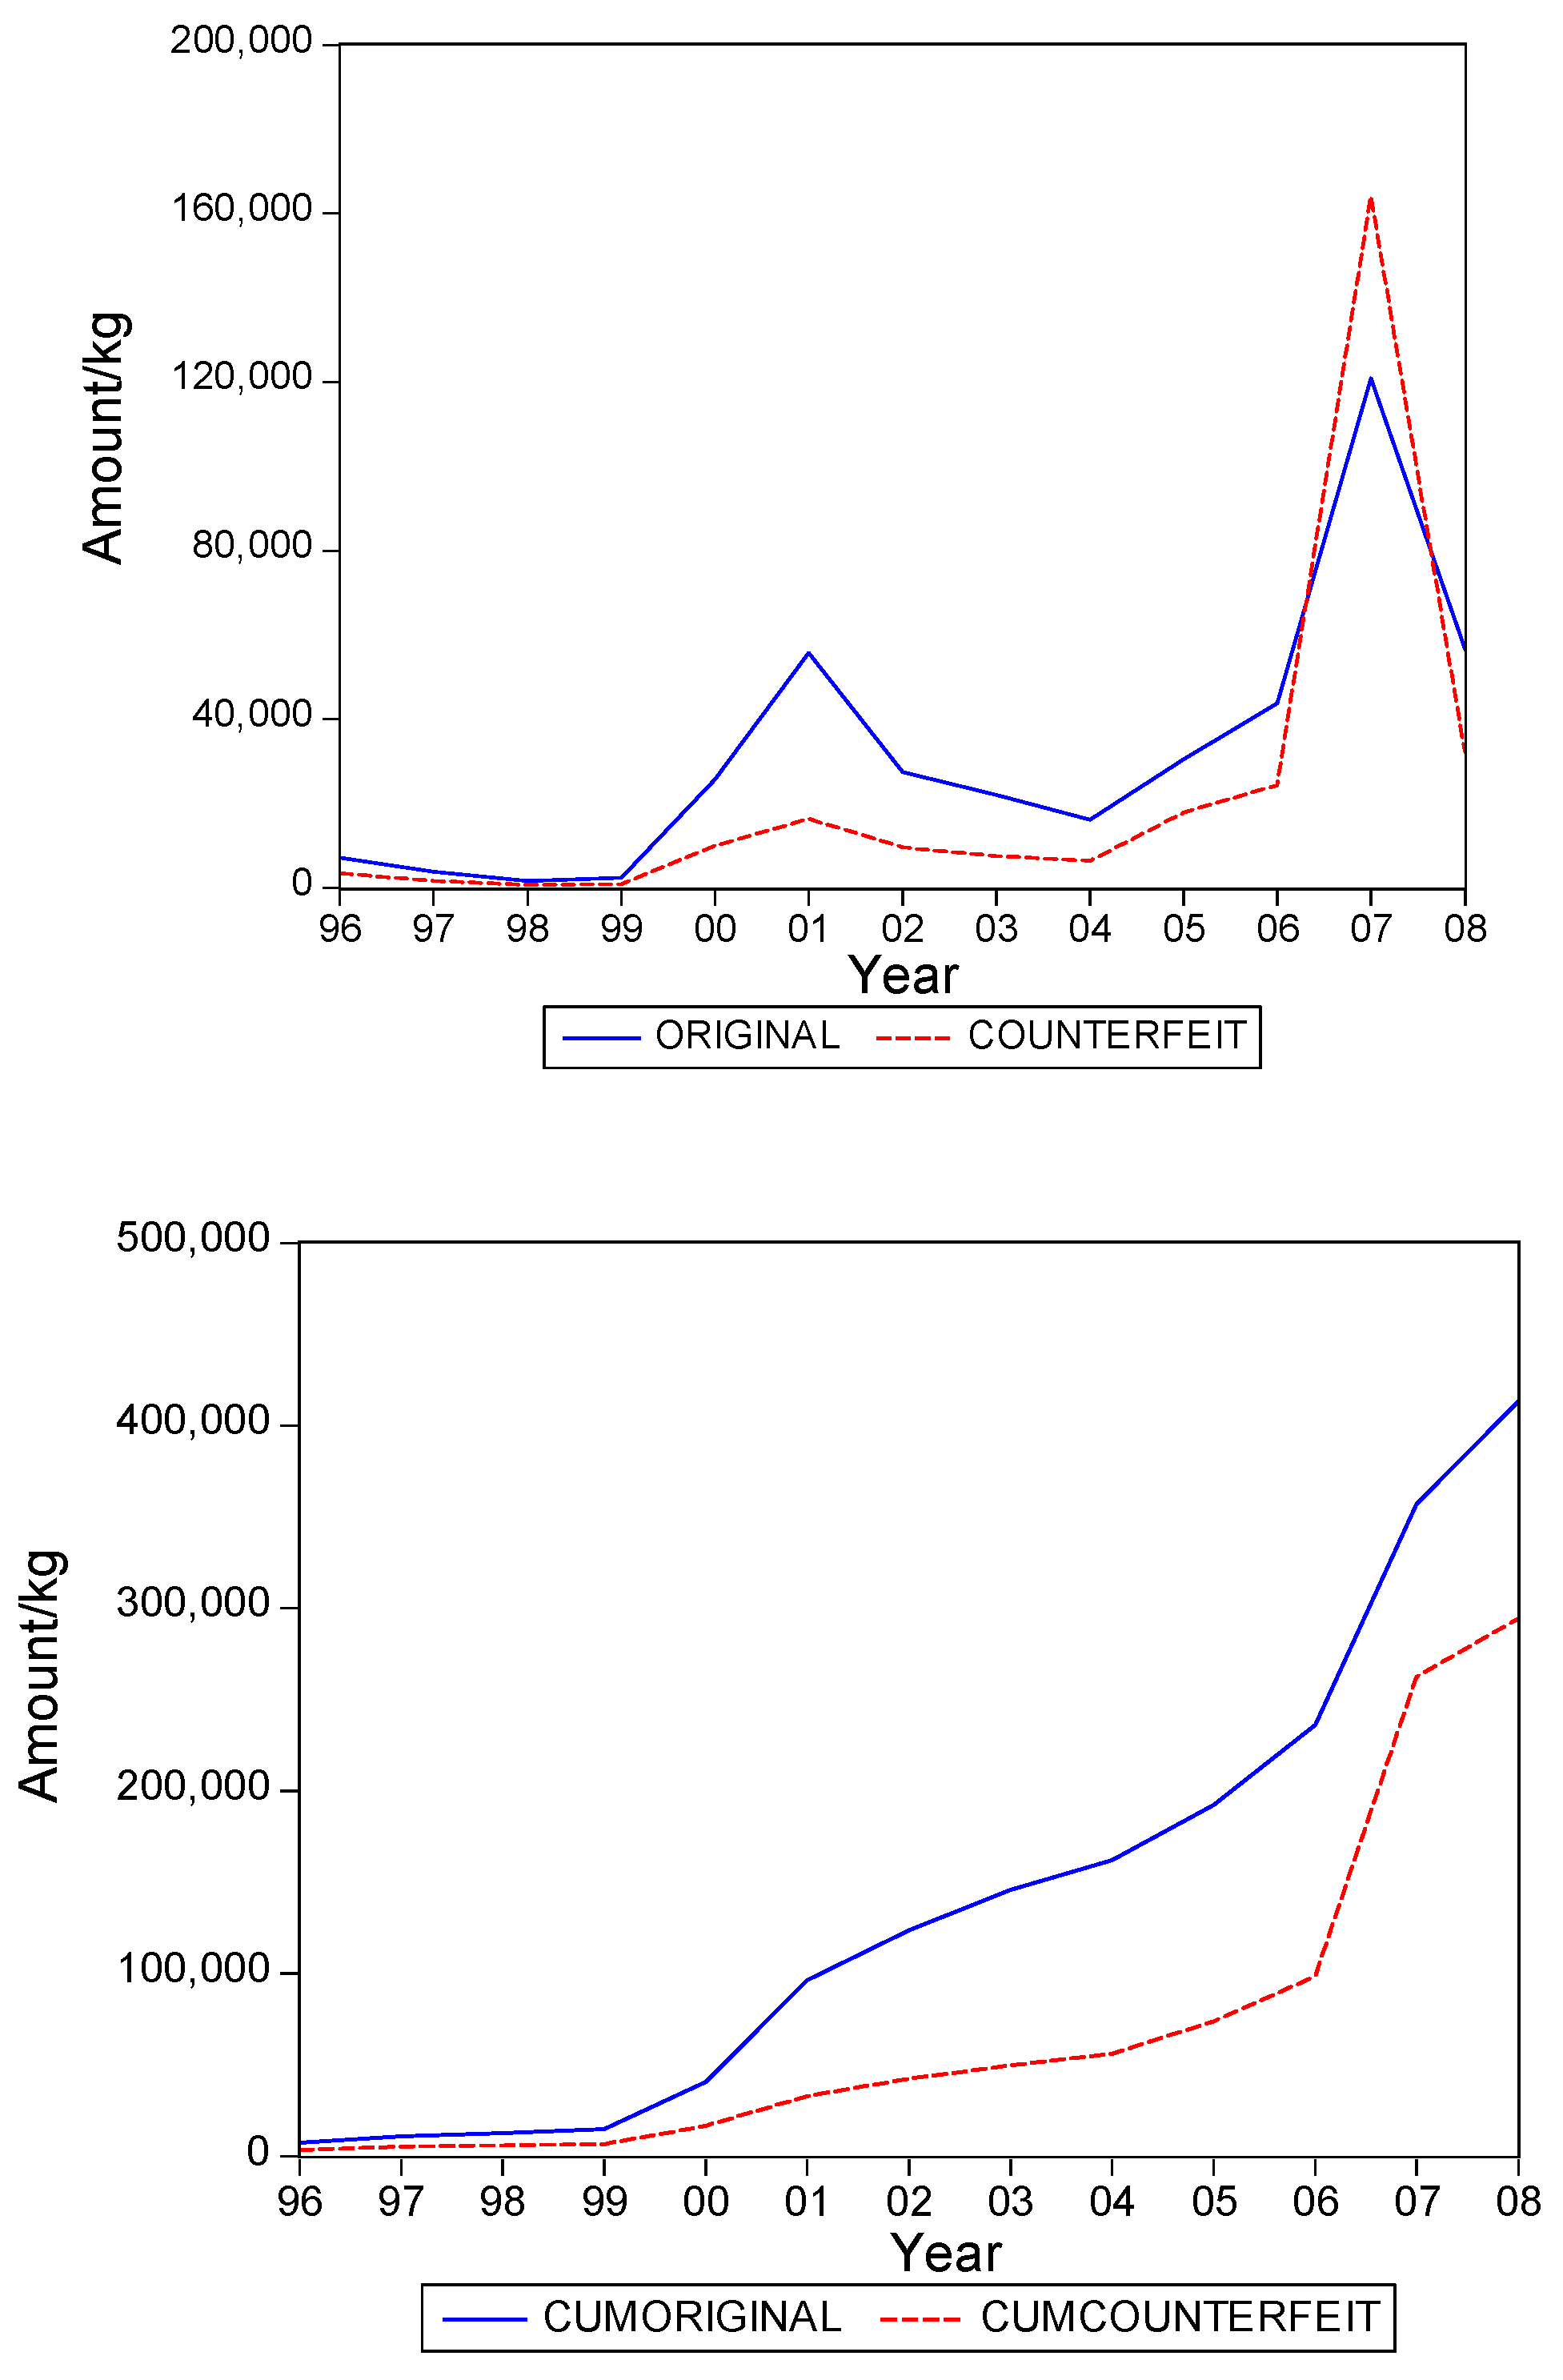
We denote the level of the original products shipments as and the level of the shipments of falsified product as where . We also compute the cumulative shipments, and label these as and . Graphs of the series for the five categories appear in Figure 1, Figure 2, Figure 3, Figure 4 and Figure 5. The second panel of each of these figures suggests that the cumulative shipments obey a product life cycle that can also be observed in the diffusion of durable products. Hence, the first part of our methodology involves considering diffusion models to estimate the inflection points and the total levels of these cumulative series.
For the and variables, we consider the familiar Bass [6] model, which in our notation can be written in regression format as
and
for original and falsified products, respectively. The parameters and characterize the shape of the diffusion pattern, and determine the location of the inflection point which can be calculated as
The parameters in the Bass model may be difficult to estimate in case the data does not yet include the inflection point. If this happens, we replace the Bass model by the symmetric logistic curve, given by
and
for original and falsified products, respectively. Here the parameter characterizes the shape of the curve, and again corresponds with the timing of the inflection point. Due to the imposed symmetric nature of the logistic curve, one can still reasonably adequately estimate the location of the inflection point, even when it is not included in the sample. The estimation routine is Nonlinear Least Squares. In both cases, that is the Bass model and the logistic curve, our interest lies in the parameters , which is the ultimate level of total shipments, and , which is the location of the inflection point.
In Table 1 we present the present the estimates of the total level. We also compute the fraction of over . As said, this latter fraction is most relevant for our purposes. Table 1 suggests that it can range from about 0.3 to 0.5, with an average close to 0.4. In words, about 40% of the eventual total shipments in medical products in Suriname could concern falsified products. It is interesting to see that the variation of the estimate of the fraction across the five product categories is quite small.
Table 2 gives the estimates of the inflection points. For two of the five categories, the years with these points coincide. For Medicine, not for sale small scale, the inflection point of falsified products occurred earlier, suggesting that the total level for this series is attained earlier than for the original products. For two categories the falsified series peak later, with Blood Items meaning that in the next few years after 2008 still a substantial amount of falsified products will be imported in Suriname, at least, if the current situations persists.
3.2. Methodology for Shipments
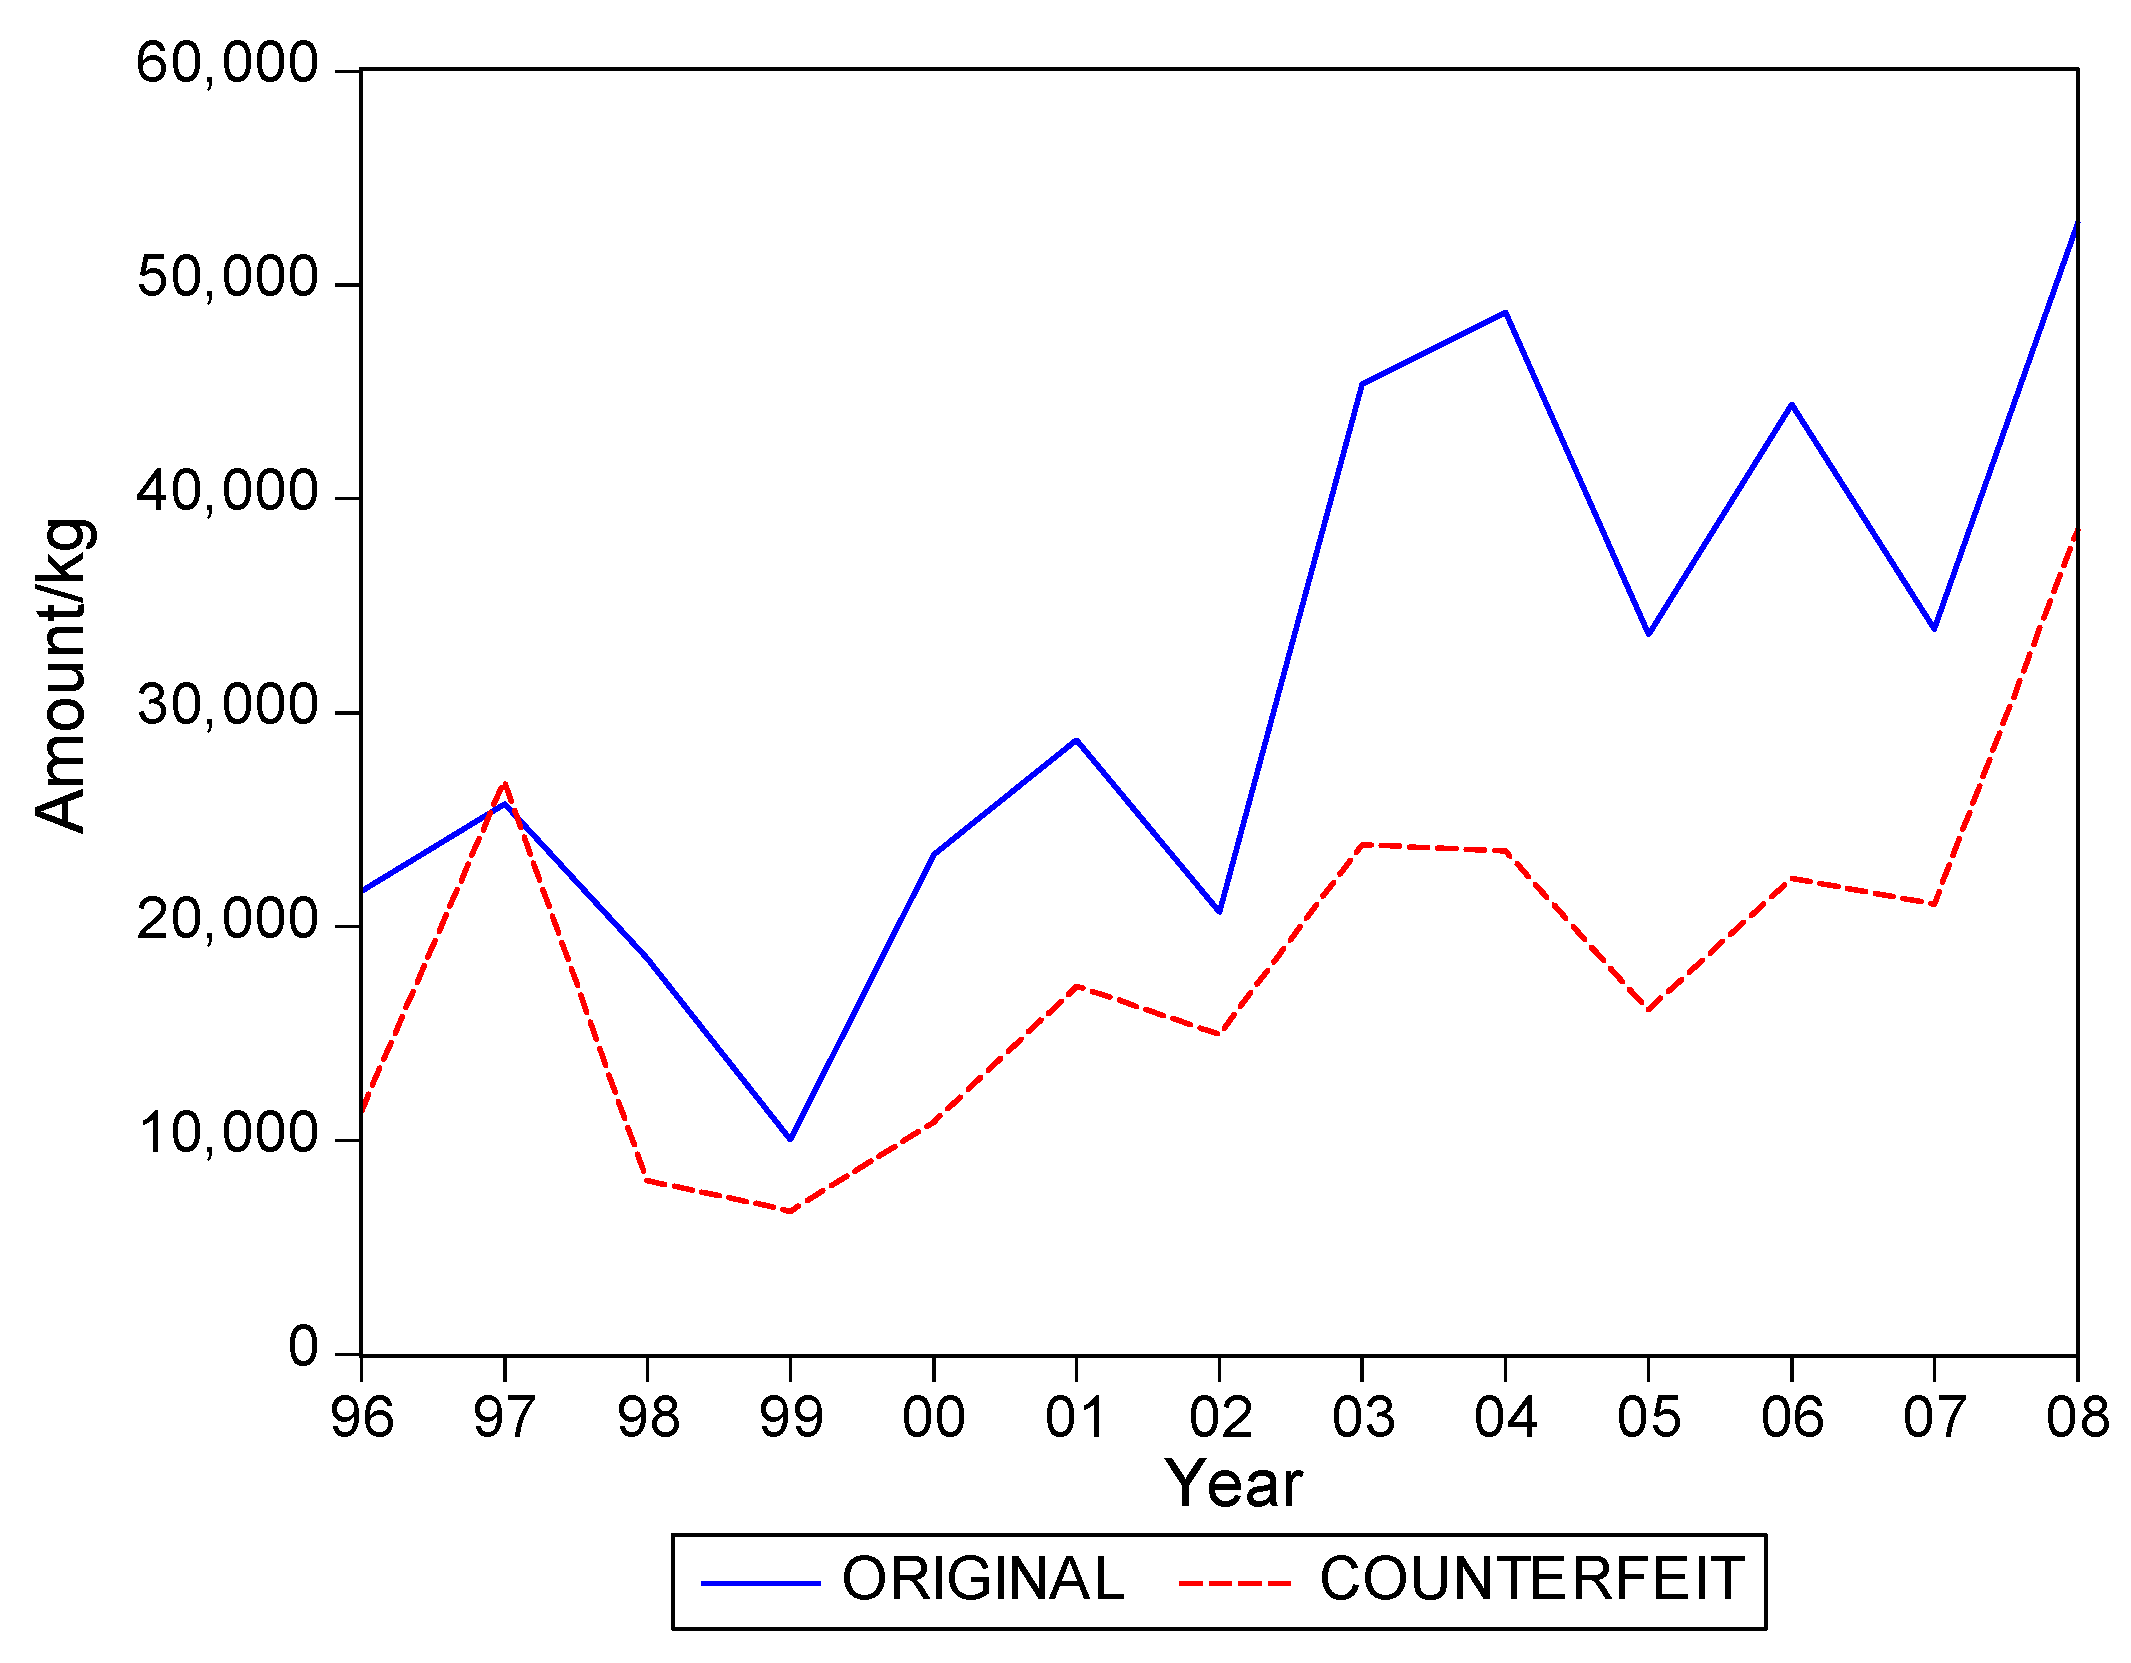
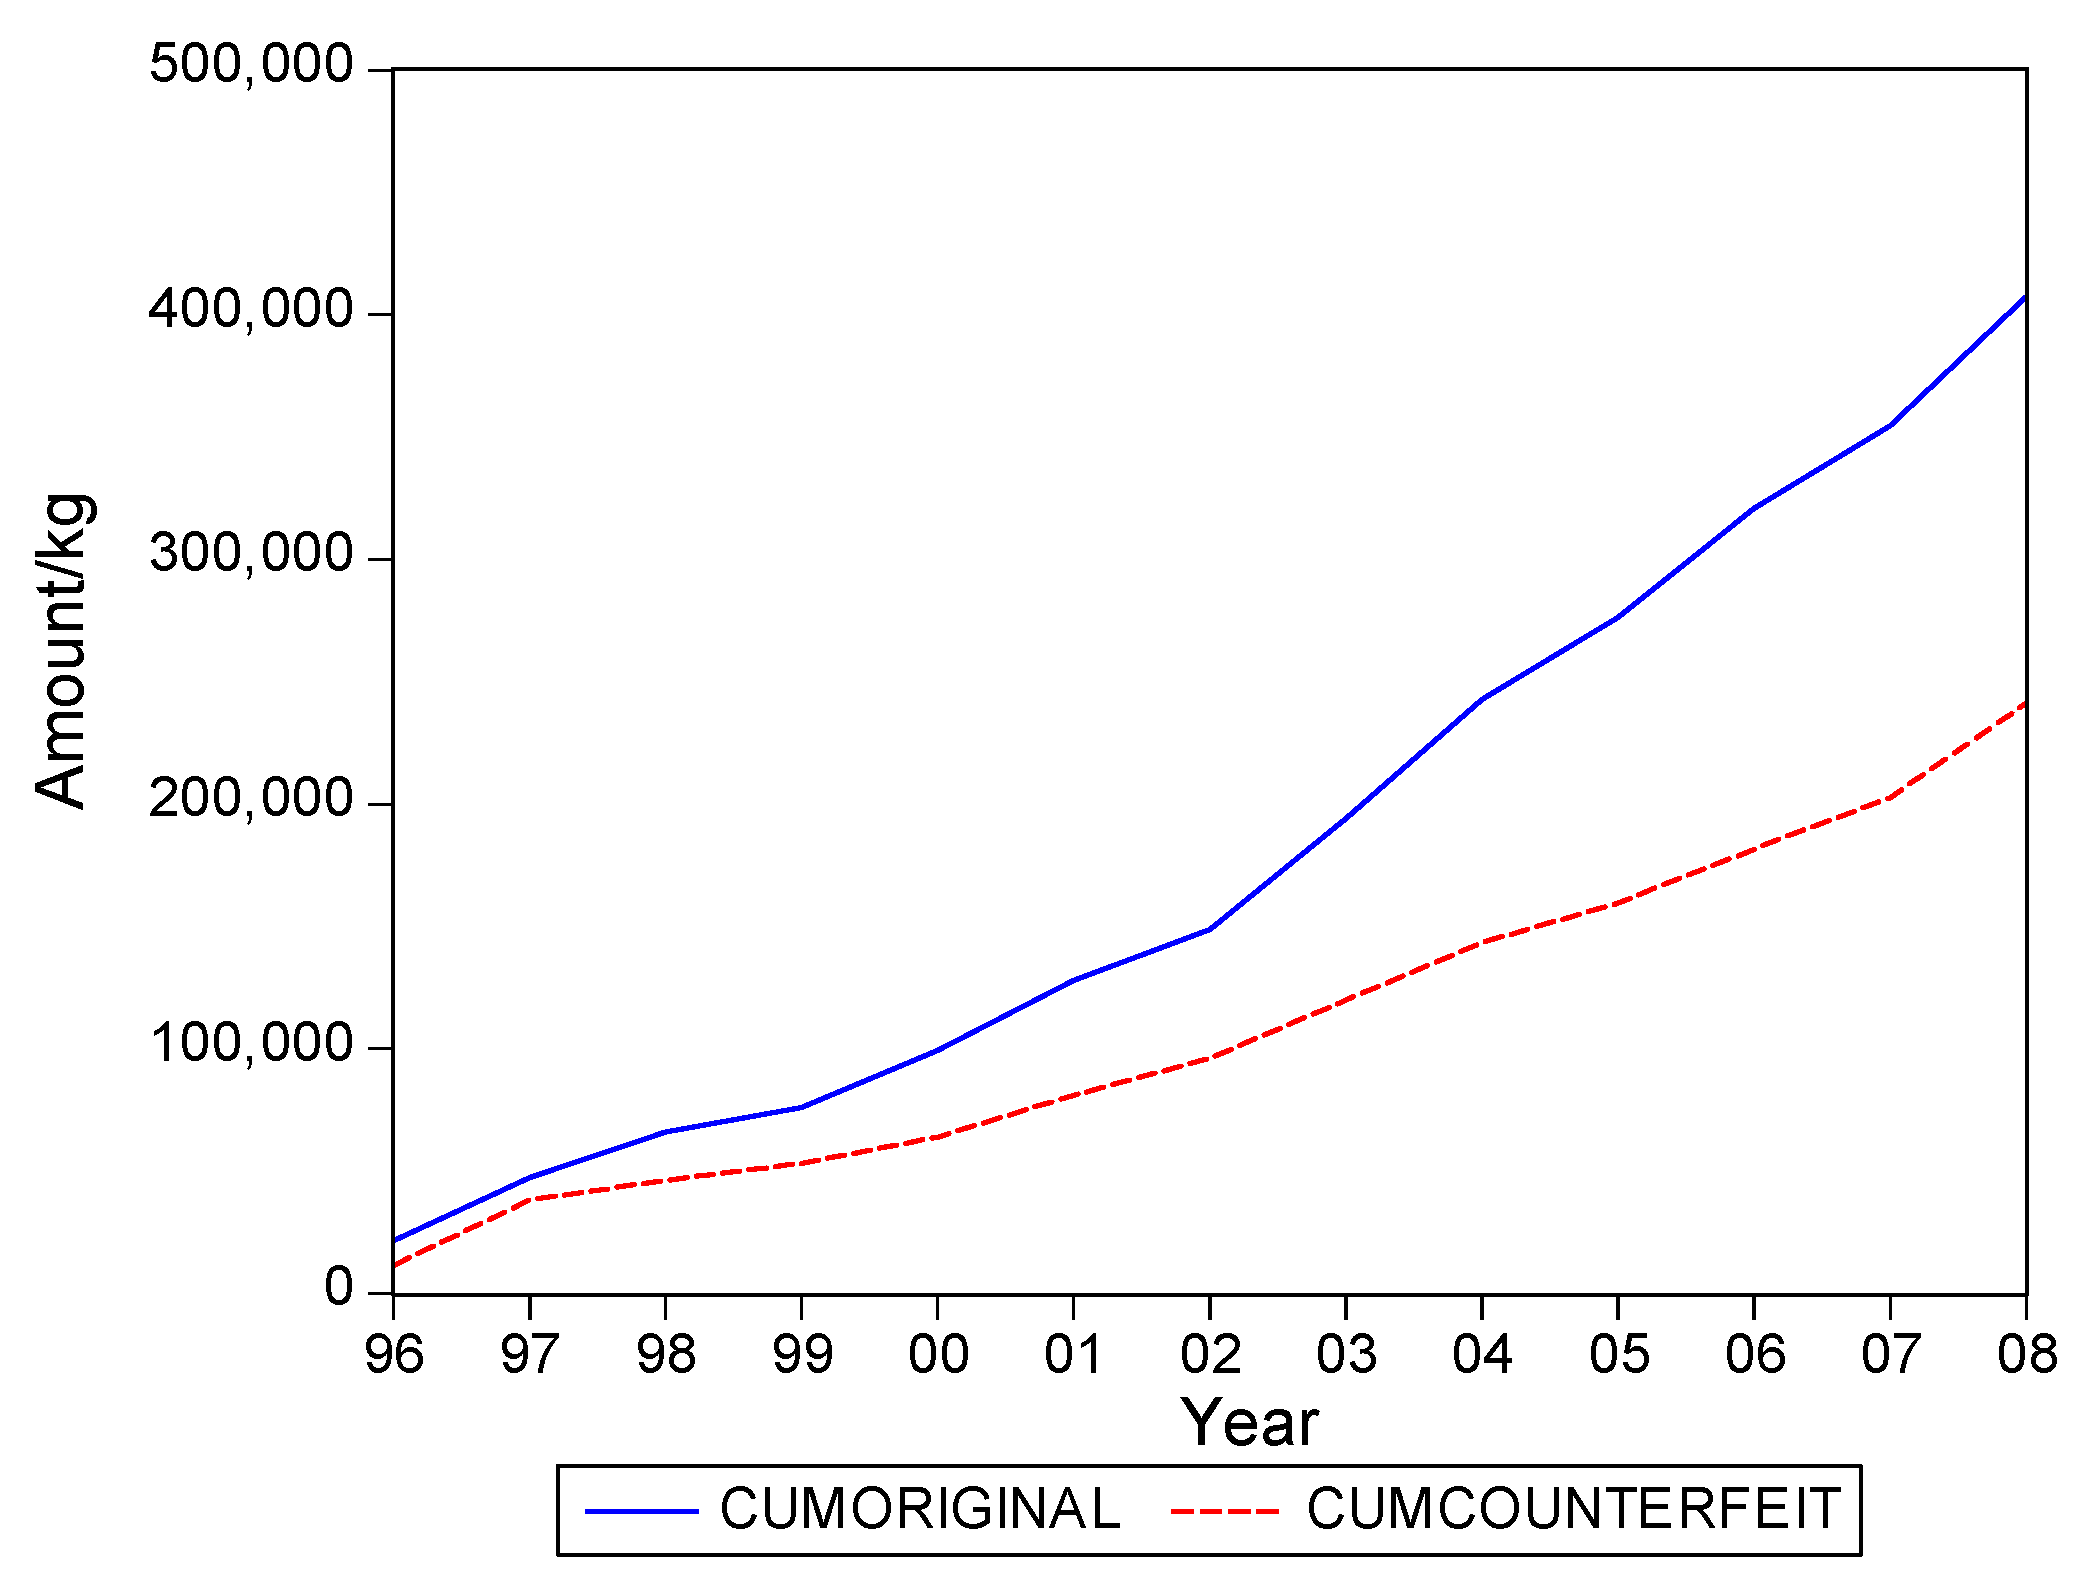
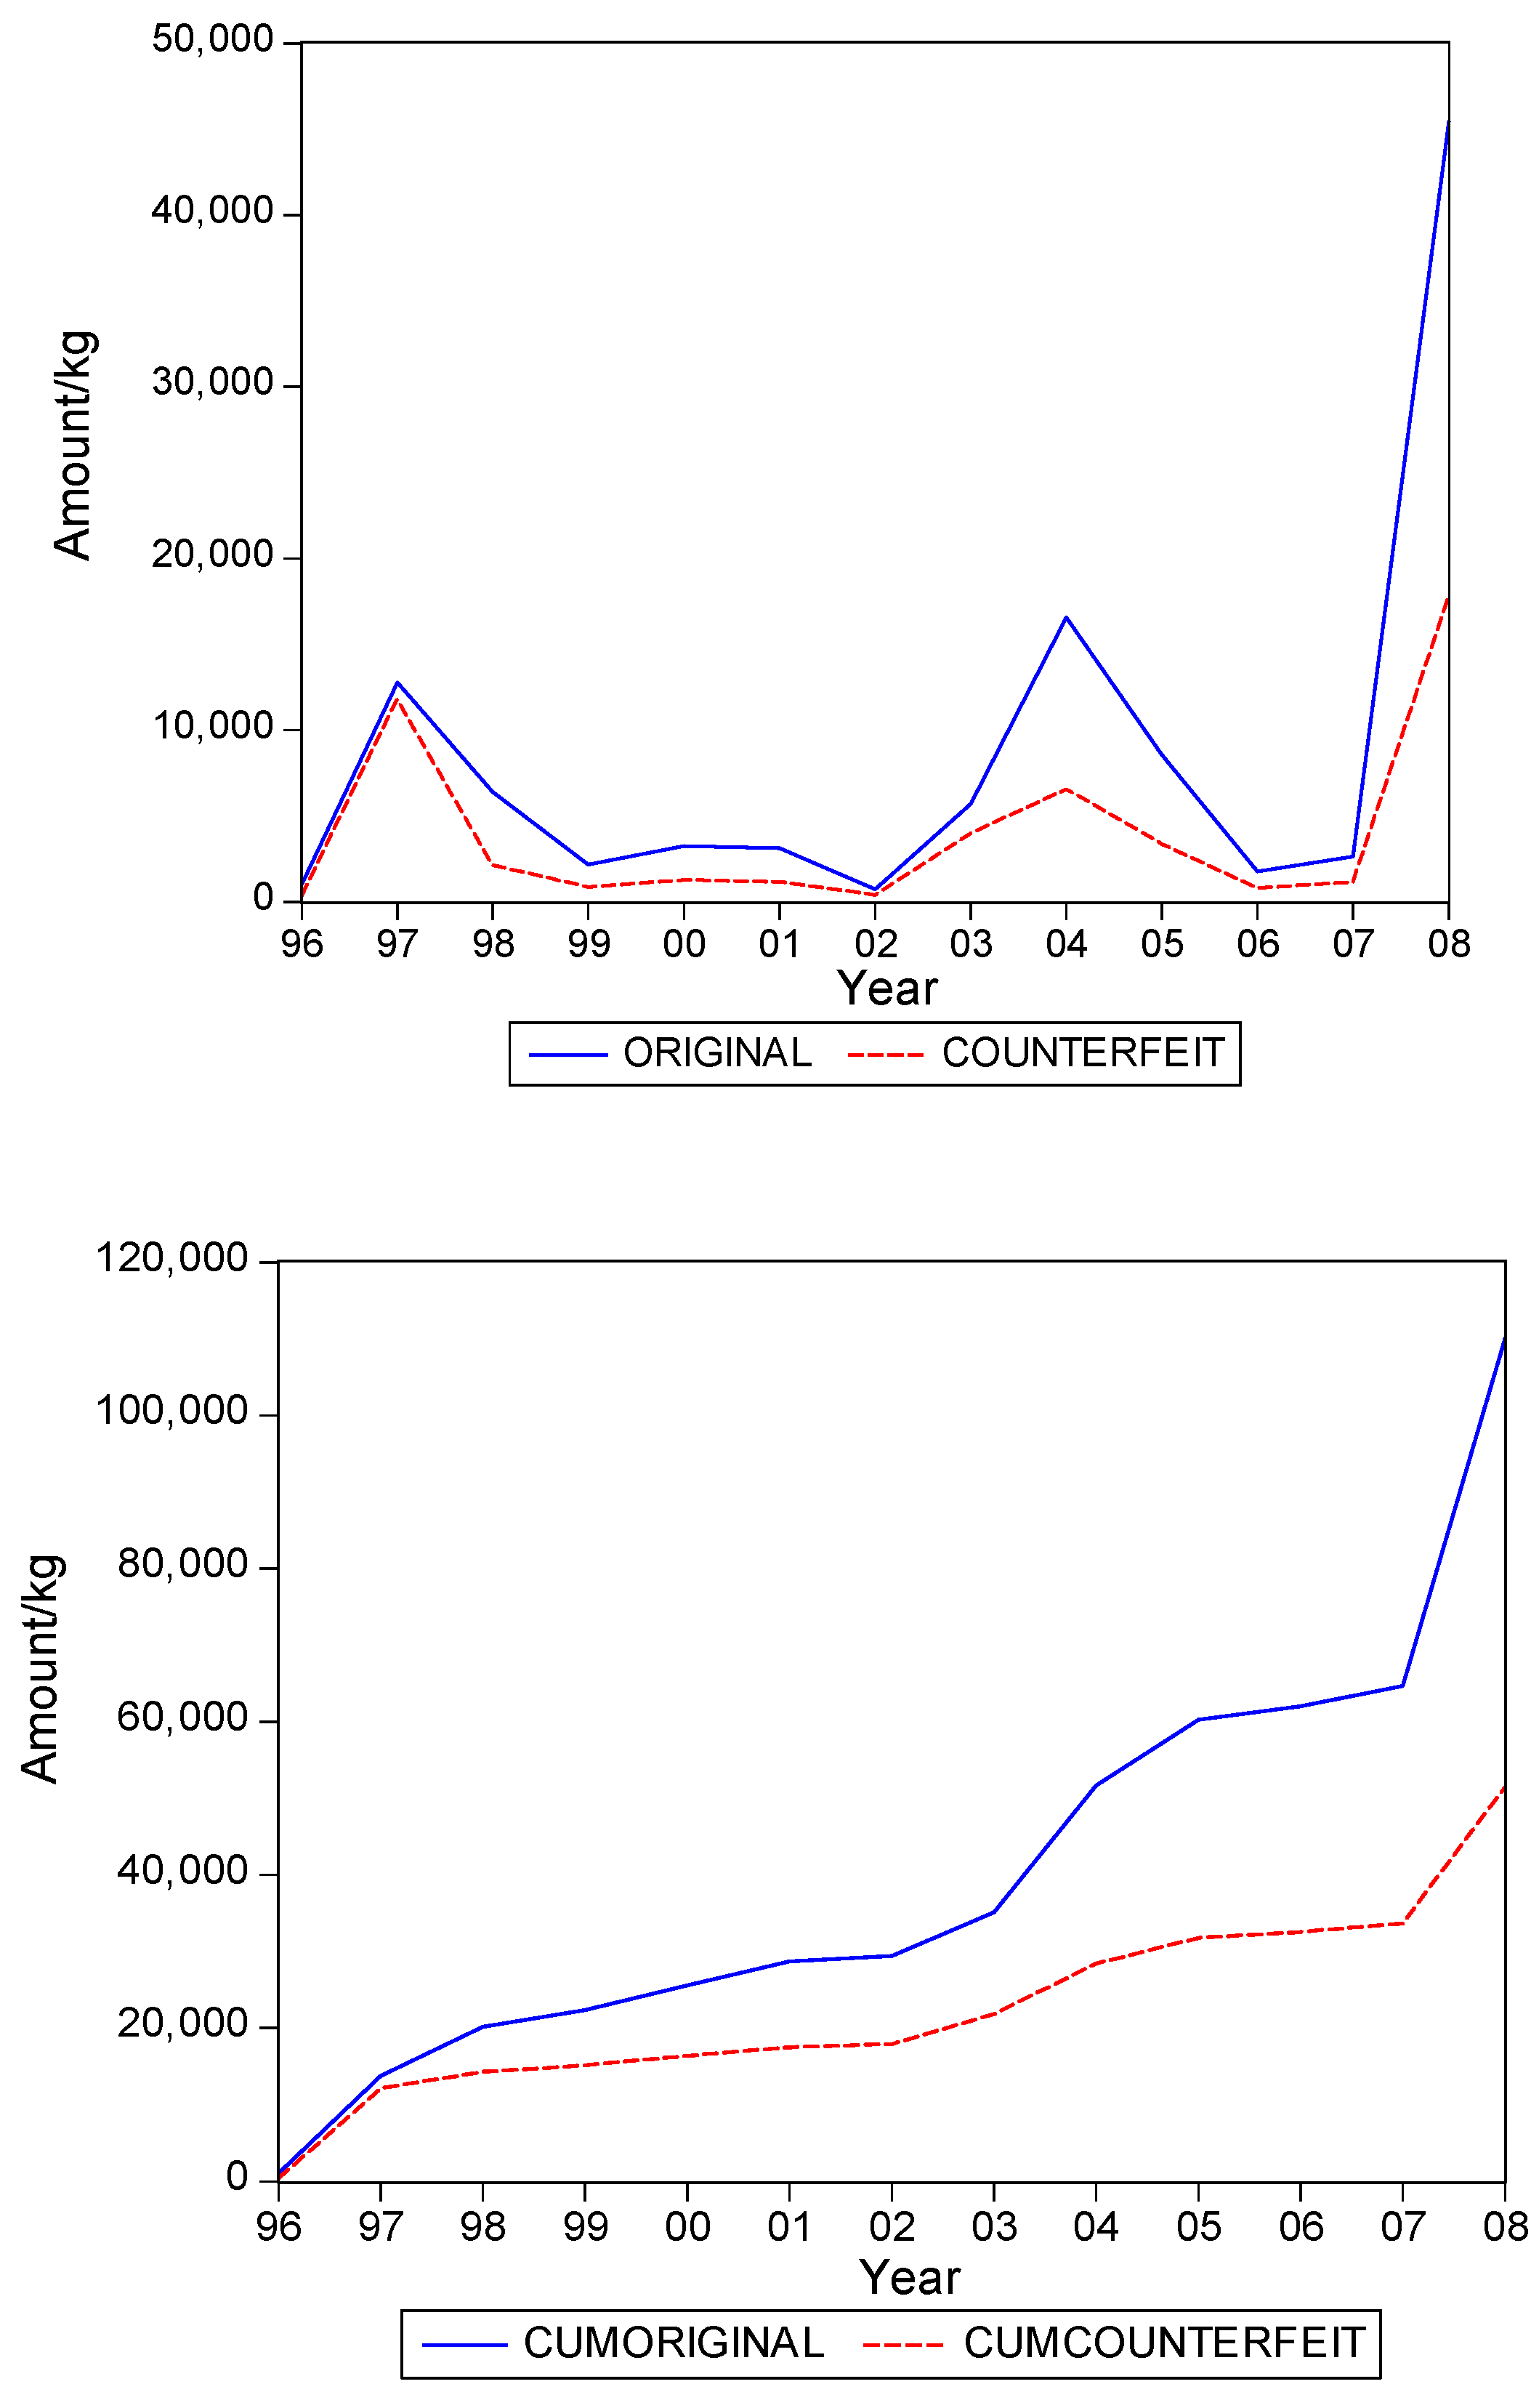
The graphs in Figure 1, Figure 2, Figure 3, Figure 4 and Figure 5 seem to suggest that shipments of original and of falsified products show similar diffusion patterns. It is of interest to see if one of the two series is leading (or lagging).
To examine leads and lags relations, we estimate a vector autoregression of order 1 (VAR(1)), which consists of the following two equations
and
Note that a genuine VAR(1) model would not include current and , but here it allows for a partial correction for current effects. The test of interest concerns the joint significance of in (6) and of in (7).
In Table 3 we present the p values of the F tests. Except for the category Medicine, not for sale small scale, we find that these parameters are not significantly different from zero. For the exceptional category, we learn that lagged shipments of originals leads current shipments of originals. So, in sum, there is no leading or lagging variable across originals and falsified products.
Table 4 gives the contemporaneous correlation between the two series, and it is quite evident that this correlation is high.
Hence, we find that original and falsified medical products follow similar diffusion patterns, and that no series is leading or lagging the other series. When it is assumed that all individuals in Suriname are equally likely to need medical products, our findings suggest that the shipments apparently address two distinct segments of consumers. There is a demand for original products and there is a demand for falsified products, with the relative demand for originals in the end being 1.5 times as large as demand for falsified products, as the fraction of falsified products in the total shipments is 40%.
4. Health Care in Suriname
We now proceed with an in-depth analysis of who the two distinct segments of consumers might be, that is, which characteristics qualify these two groups?
For that purpose we set out a survey amongst Surinamese individuals in Suriname. Suriname is a country with a low-income economy, which has a population of approximately 534,000 inhabitants (GBS 2013). It is estimated that more than 60% of the Surinamese population is below international poverty levels, while there also is a non-negligible group of multi-millionaires in this country. Although average welfare has been reported to be on the rise, the income inequalities in Suriname are quite large.
As is the case in countries all over the world, in Suriname the main responsibility concerning public health lies in the hands of the Surinamese government. Its Ministry of Health (MOH) is the government agency in Suriname which is responsible for ensuring the quality of health care and the formulation of pharmaceutical policy, including monitoring its quality. There is a National Medicines Policy 2004–2008 (NMP), which depicts the policy of the MOH with respect to the supply of medicines in Suriname. Important aspects of the NMP include ensuring the availability and accessibility of the selected essential medicines for the entire population, strengthening regulation bodies, and establishing a national quality control laboratory [7]. With regard to the quality control of medicines, the MOH reported that it has arranged and monitored the efficacy and safety of the drugs regulation in Suriname in accordance with the WHO recommendations [8], [9].
In order to safeguard quality control, the MOH has regulation bodies (Registration Authority, Pharmaceutical Inspection) in place and it is reported that the MOH works closely with other regulatory and enforcement institutions such as the Inspection of Customs and Excise, the departments of the Ministry of Trade and Industry and the Police Corps of Suriname [9]. In addition, the MOH has partnerships with the professional association of Pharmacists in order to determine the Surinamese Pharmacy Standard as a guide for self-regulation and other matters relating to the profession and service. MOH also partners with other countries in their region, with which it exchanges information about the quality of imported medicines as well as with producers to detect any wrongdoing [9].
In summary, the [9] reports that the quality of drugs which enter Suriname through official channels (particularly pharmacies) and which are distributed in this country can be deemed as good, due to the fact that: (1) all of these drugs are recorded in the register of packaged drugs; (2) all of these drugs are subjected to a quality control; and (3) in the entire distribution and sales channels these drugs are under the supervision of qualified pharmacists.
In spite of the abovementioned claims on the part of the MOH, one of the leading newspapers in Suriname reported in 2011 that no less than 85% of total sales in the legal circuit in the country concerned fake (SFFC) medicines (newspaper De Ware Tijd 17 September 2011, p. 1). This figure was adopted from an investigation on the prevalence of fake (SFFC) medicines in Suriname, which was reported to have been done by a private investigation agency on behalf of Pfizer (one of the largest pharmaceutical companies in the world). Despite the press release issued in their defence suggesting that the claim was incorrect and that there was no such evidence, the [9] to date has seemed to fail to present solid documentation to underpin their arguments.
An investigation regarding the strengthening of the pharmaceutical quality assurance and legislation (from 2008 to 2010), which was commissioned by the MOH and which was done by Health Research For Action (HERA), shed light on some key concerns [8]. These concerns are that, although quality is central in the formulated NMP and even though this policy was prepared in accordance with the WHO recommendations on how to develop and implement a national drug policy and which was approved by the Government of Suriname in 2005, the applicable laws and regulations in the field of medicinal products are still obsolete. The current legislation appears incomplete and relies on the Medicines Act dating from 1896.
Also, while the MOH is able to guaranty the quality of the drugs that are formally admitted and legally imported, the quality of all other drugs outside these official processes cannot be guaranteed. It was also reported that there is little control on processes in the informal market. There is also a lack of routine sampling on the market, and the only quality control laboratory in Suriname is that of the Drug Supply Company Suriname (DSCS) (“Bureau Geneesmiddelen Voorziening Suriname”). This laboratory occasionally performs tests at the request of the Pharmaceutical Inspection, even though the DSCS laboratory has limited capacity and seemed to have performed without (adequate) professional guidance for years. Furthermore, DSCS itself is one of the largest importers of drugs in Suriname and therefore may not be seen as an independent institute. So, although the MOH attached importance to establishing a national quality control laboratory in Suriname (as stated in the NMP), to date there is no independent quality control laboratory for drugs in the country.
In addition, [8] shows that even though the MOH has several partnerships, there is insufficient professional consultation between the authorities concerning registration, inspection, pharmacovigilance (drug safety), the MOH and Council for the Essential Medicines Program (“Raad voor het Essentieel Geneesmiddelenprogramma”), and as a result the regulatory system cannot guarantee the quality of all drugs on the market. There is also no structural exchange of information between countries with stringent medicine regulatory systems in order to optimize the system. Also, the database of registered medicines is not accessible online, it is also inadequately automated, it is only accessible for professionals, and the applications that the professionals submit are only processed by hand.
Hence, taking all the above together, it seems that the Surinamese government apparently has a long way to go before they will be able to ensure that the quality of drugs on the Surinamese market meets the requirements set by the WHO (that is, in the formal system, and also reducing the size of the informal system).
With regard to the availability of medicines in Suriname, it is the case that some medicines are only available in pharmacies on a doctor’s prescription, while other medications can be purchased without such a doctor’s prescription, in either a pharmacy, a drugstore or sometimes even in shops and supermarkets. Concerning the medicines that are available to the Surinamese people, it is their health insurance company (or insurer, which could be the government again) that determines which medicines (the variety, the amounts, the brands and therefore the quality of medicines) pharmacies can provide to the clients on doctor’s prescription. Although health insurance companies have to comply with the NMP, each health insurance company (insurer) has its own medicines register containing those medicines of which the cost are reimbursed by them, provided that these medicines are prescribed by a doctor. Bear in mind that HERA reports that there is an inadequately functioning (quality) control mechanism for pharmaceutical products. Below we will see that insurance is apparently a key factor.
Regarding the coverage of medical costs of the people in Suriname, the Pan American Health Organization (2010, p. 6) reported that the medical costs of approximately 34% of the Surinamese population are covered by private health insurance, company plans, or paid out-of-pocket. The State Health Insurance Fund (SHI) (“Stichting Staatsziekenfonds”) covers the medical costs of 26% of the Surinamese population. The majority of individuals who are insured by this health insurance company are employees of the Surinamese government, who are obliged to purchase their health insurance from this health insurer. The Ministry of Social Affairs and Housing (MSAH) covers the medical costs of 31% of the Surinamese population, who are coined as the under-privileged. The medical costs of the remaining 8% of the Surinamese population are covered by the Foundation Medical Mission Primary Health Care Suriname (FMM) (“Stichting Medische Zending Primary Health Care Suriname”), which is a private, non-profit, primary health care organization which focuses on communities in the interior part of the country and which is subsidized by the MOH for a great part.
5. Collecting Survey Data
In order to select the sample from the population of Surinamese people from the age of 18 and living in Paramaribo, we employed a multistage cluster sampling technique. GBS drew 30 clusters in Paramaribo (the capital city of Suriname) from which 20 households were selected. Each cluster had a pointer address providing the interviewers the first household where a respondent should be interviewed. The 19 remaining households in every cluster were selected by using a specific method. This method entails that the total of prospective 600 respondents from the 30 clusters (each with 20 households) were selected using the ‘birthday rule’.
Data collection lasted about six weeks in February and March 2013 and the survey response rate was 52%, which amounts to 311 respondents. Most of the 298 prospective respondents who did not cooperate either refused to participate, of whom, interestingly enough, the majority of these respondents were people living in elite neighbourhoods, or they were not available for an interview even after repeated visits by the interviewers. It might be that the survey response is influenced by the fact that there have been several survey studies on other topics prior to this study, particularly in Paramaribo. Consequently, various prospective respondents had the impression that they were approached to partake in a study in which they had already participated. The majority of these respondents did not even give the interviewers the opportunity for further explanation.
6. Results from the Survey
When we asked 311 individuals how often they have, consciously, purchased falsified medicines, we had 283 valid cases with 71% who said “never”, and hence 29% said “not never”. 13% of the respondents answered with “Rarely”, 10% with sometimes, 4% with “often” and 6 individuals (2%) said “very often”. Of the 311 respondents who participated in this survey, 58% were females and 42% were males.
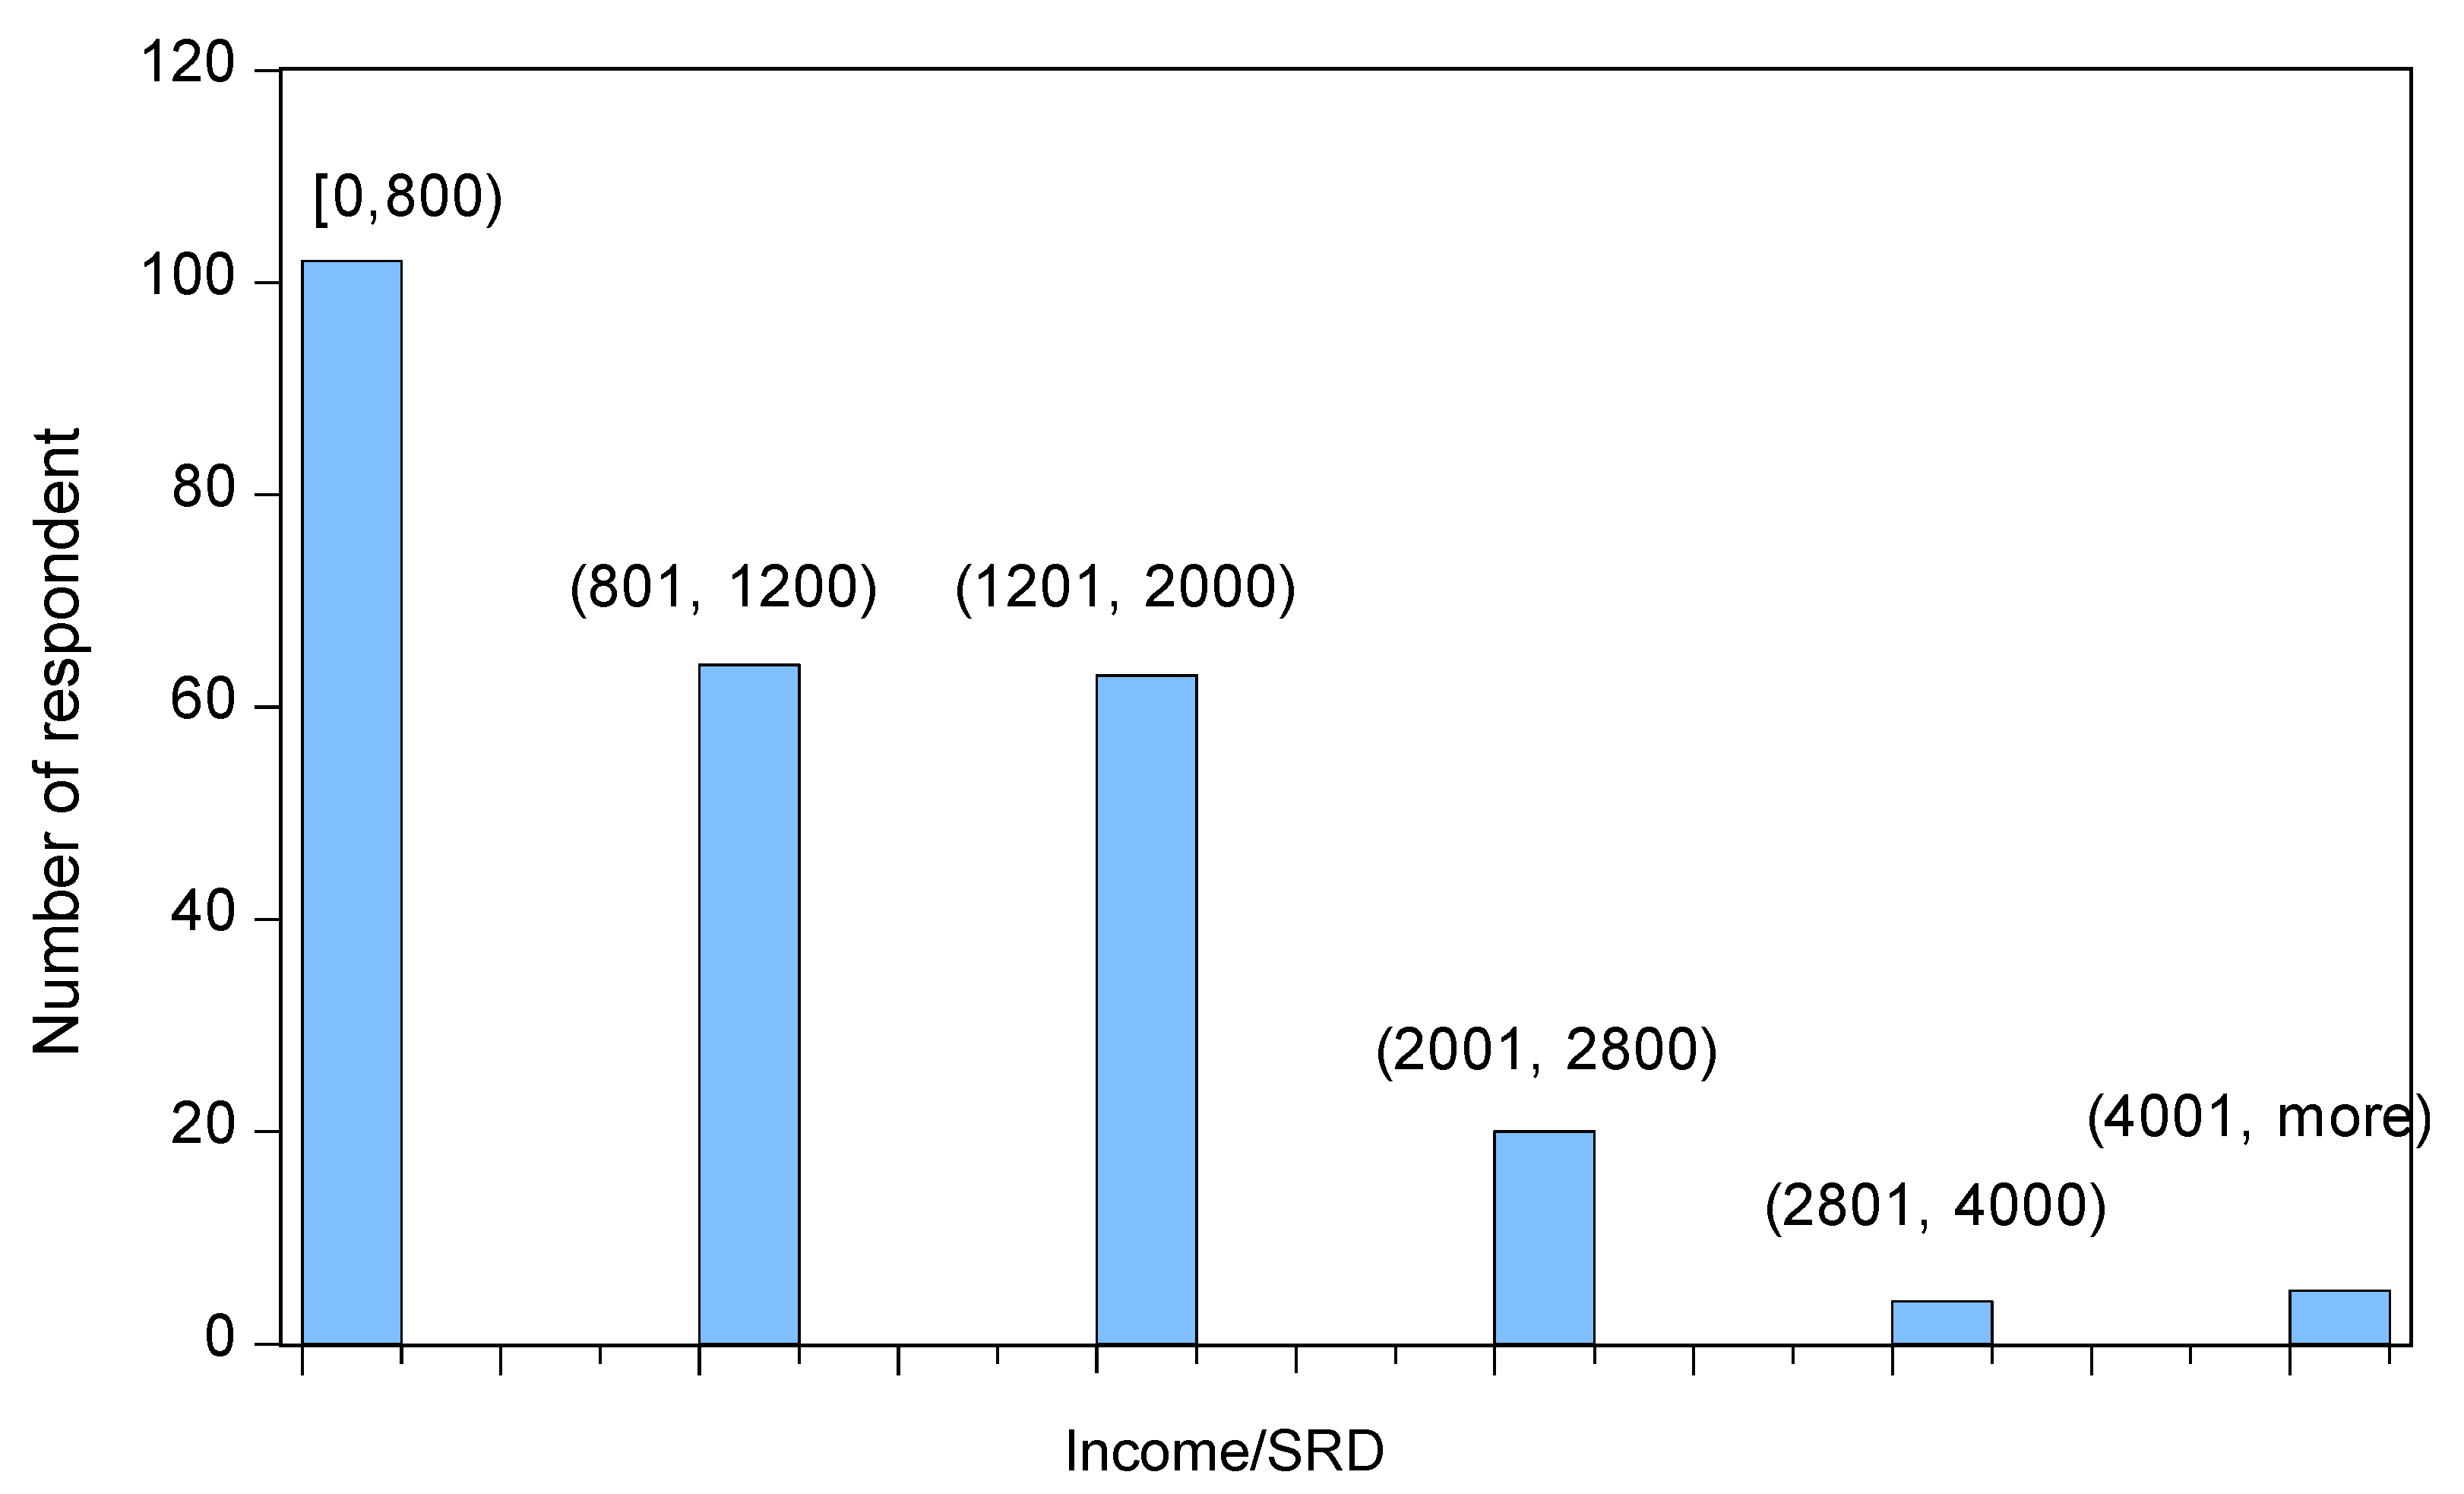
40% of all respondents had a monthly income with a maximum of Surinamese Dollar SRD800 (approximately Euro183 or USD 246). The monthly income for the 2 subsequent categories (between SRD800 and SRD1200 and between SRD1201 and SRD2000) was about 25% for each category. Only 11% of all respondents had a monthly income of at least SRD 2001 (approximately Euro616 or USD470). A histogram is provided in Figure 6.
Even though, in general, not more than 40% of the respondents had a monthly income of SRD800 or less, among those who are subsidized by the government this number was 64%. Irrespective of whether the costs of their health insurance were co-paid or fully paid by the employer (a distinction which is further ignored), 69% of all the participating respondents had some kind of health insurance. Among the remaining 31% of the respondents, only 8% were fully uninsured and paid their medical bills themselves (out-of-pocket). The other 23% of this group of respondents was either subsidized by the government through MSAH or through FMM.
Among those respondents who paid for their health insurance (the insured who either paid their health insurance themselves or whose employer co-paid or fully paid the health insurance, a distinction which is also further ignored in this investigation), 77% of them were insured by the SHIF, 22% were insured by a private health insurance company, and just 1% of all insured respondents were insured by both SHIF and a private health insurance company.
In our following analyses the respondents with a SHIF health insurance as well as one by a private insurance company are categorized under those who are insured by a private insurance company, as this group accounts for only 1% of all respondents. This is because these insurance plans are often perceived as being more favorable than those of SHIF, which is because private insurance companies often offer more elaborate insurance packages.
With regard to the respondents who are insured, only 36% indicated to have always had all the costs for medications reimbursed. In this category, those who are only insured by a private health insurance company (not the SHIF) represent the majority (62%). Just 27% of the respondents who were only insured by SHIF indicated to have always had all the costs for medications reimbursed.
Irrespective of how the medical expenses of the respondents are covered, about 80% of them indicated they have never suspected in the past that medication they obtained from a pharmacy, thus through the official channel (on doctor’s prescription), could have been an SFFC medication. Only 26% of the respondents who suspected to have obtained SFFC medication via the official channel did not use these (supposed SFFC) medications. Almost one third of all respondents (27%) used these supposed SFFC medications often or more frequently after obtaining them.
When we evaluate the correlations across the answers to the question of whether one consciously purchased falsified medicines (with answers Never, Rarely, Occasionally, Often and Very often) with various demographics in Table 5, we see that the only significant correlation appears for the way people are insured. Hence, none of the variables of gender, income, age, or size of household associates with the conscious use of falsified products.
When we zoom in on the insurance variable in Table 6, which portrays the results to the question on the frequency of the consumers’ use of falsified medicine, we see that the answer “Never” is given more often than expected by individuals who: (D) have a health insurance at a private company; (E) have insurance via relatives (for example parents); and (F) who state that their employer takes care of their insurance. At the same time, the answers “Rarely” and “Occasionally” are given more than expected by people who answer: (A) “I have no health insurance”; and (B) “the Ministry pays for my insurance due to my lack of income”.
These results clearly indicate that the way people are insured marks a dichotomy. Poor insurance associates with more conscious purchases and use of falsified medication.
7. Discussion of Results and Implications
In addition to the available global estimates of the WHO, we provided detailed estimates of shipments of original and falsified medical products in the South American country of Suriname. The precise numbers of these estimates are not particularly relevant, as we are interested in the relative numbers and the current and dynamic correlations across the two series. When we analyze the diffusion patterns, we see that total shipments (to be observed many years from now) will cover about 40% falsified products. Moreover, we see that current correlation is high, and that there are no relevant leads or lags. Hence, the two types of shipments seem to address two distinct clusters of consumers. And, indeed, when we collect survey data for Surinamese individuals we see that these clusters seem to associate with the way the individuals are insured. Properly insured people have a smaller tendency to purchase consciously falsified medicine. Here we foresee an important role for the government.
For Suriname we emphasize that the battle against falsified pharmaceutical products is one that asks much effort on the part of the Surinamese government, in particular in relation to insurance. As a member of the WHO, this country needs to make greater effort to adopt the WHO schemes and to make more use of the information, instructions, and opportunities presented by this organization’s global coalition of stakeholders, that is, the International Medical Products Anti-Counterfeiting Taskforce (IMPACT). The Surinamese government needs to tighten the relevant legislation and regulations so that substantial fines and even more appropriate prison sentences can be declared against those persons and organizations who engage in the import and sale of falsified pharmaceuticals. Given our results, we also recommend that the control with regard to the market of medical products, not only in the official distribution channel, is increased and regulations with respect thereto is tightened. Most certainly, control in the official distribution channel for medical products must be intensified.
At the same time, the Surinamese government needs to raise the awareness of the citizens. As it is assumed that the majority of the citizens have no background information on the pharmaceutical products they use, let alone on how to detect falsified versions among the original pharmaceuticals (in those cases where possible), the government must take the leading role in empowering the citizens by adequately informing them about how to determine the originality of pharmaceuticals. The Surinamese government must also inform the inhabitants about the fatal consequences of falsified versions of pharmaceutical products, and thus the great health risks these products may inflict on those who use them. The tightening of the government’s policy in the battle against falsified pharmaceuticals is very likely to result in a significant reduction of the trade in these products in Suriname, and hence reduce the risk of exposure to the dangers of these products. As mentioned earlier, not only legislation and regulation policy needs to be tightened, but also the policy regarding control and the effective implementation thereof, needs to be taken into account.
Additional to the Surinamese government, there are at least three stakeholders that can also play a role in this battle. The first stakeholder is customs. Since it is suspected that large portions of falsified pharmaceuticals are smuggled into the country, this stakeholder will need to improve its control concerning the import of these products. Stricter control, combined with tight legislation and regulation will enable the custom officials to increasingly contribute to reducing the import of and the trade in falsified pharmaceuticals.
The second stakeholder, MOH, and more particular the Pharmaceutical Inspection, the control mechanism of the Surinamese government with regard to the pharmaceutical products, is responsible for inspecting and controlling the pharmaceutical market. This department is supported by the Office for Pharmaceutical Supply in Suriname. The latter focuses on the quality controls of locally produced and imported drugs. The Pharmaceutical Inspection, small in size, may lack the capability to optimally inspect and control the pharmaceutical business in Suriname. We suggest that the government increases its support to these organizations.
The final stakeholder is the consumer. As the consumer (thus the individuals, but also hospitals and similar institutions) ultimately determine the extent to which the sale of products increase or decrease, this stakeholder also needs to participate in reducing the trade in falsified pharmaceuticals in Suriname. Of course, before consumers are able to consciously choose to purchase and use original pharmaceutical products, first and foremost they will need to be adequately informed about the disadvantages of falsified pharmaceuticals. Furthermore, they will need to be informed about how to detect the falsified pharmaceuticals from the original versions, in those instances where this is possible.
Author Contributions
Lede collected the data upon location in Suriname and composed the survey and collected the responses. Franses analyzed the data. Franses and Lede wrote the paper.
Conflicts of Interest
The authors declare no conflict of interest.
Appendix A. Import from Countries

Table A1.
Imports from countries.
| Countries | Product Category | ||||
|---|---|---|---|---|---|
| A | B | C | D | E | |
| Antigua | x | x | |||
| Dutch Antilles | x | x | x | x | |
| Aruba | x | ||||
| Australia | x | x | |||
| Austria | x | x | |||
| Bahamas | x | ||||
| Barbados | x | x | x | ||
| Belgium | x | x | x | x | x |
| Brazil | x | x | x | x | |
| Canada | x | x | x | x | x |
| China | x | x | x | x | x |
| Colombia | x | x | x | ||
| Costa Rica | x | x | |||
| Cyprus | x | x | |||
| Denmark | x | x | x | ||
| Egypt | x | ||||
| El Salvador | x | ||||
| United Emirates | x | ||||
| French Guyana | x | x | x | x | |
| France | x | x | x | x | x |
| Germany | x | x | x | x | |
| Greece | x | ||||
| Guatemala | x | x | |||
| Guyana | x | x | x | ||
| Hungary | x | ||||
| India | x | x | x | ||
| Indonesia | x | x | x | ||
| Israel | x | ||||
| Ireland | x | x | |||
| Italy | x | ||||
| Jamaica | x | x | |||
| Japan | x | x | x | ||
| South Korea | x | x | x | x | x |
| St Lucia | x | ||||
| Mexico | x | x | |||
| Namibia | x | ||||
| Netherlands | x | x | x | x | x |
| New Zealand | x | x | |||
| Niger | x | ||||
| Norway | x | ||||
| Panama | x | x | x | x | |
| Portugal | x | x | |||
| Puerto Rico | x | x | x | x | |
| Russia | x | ||||
| San Marino | x | ||||
| South Africa | x | ||||
| Spain | x | ||||
| Sweden | x | x | |||
| Switzerland | x | x | x | x | |
| Taiwan | x | x | |||
| Thailand | x | x | x | x | |
| Trinidad and Tobago | x | x | x | x | |
| United Kingdom | x | x | x | x | |
| United States | x | x | x | x | x |
| Venezuela | x | ||||
(A) Pharmaceutical items; (B) Medicine, for sale small scale; (C) Medicine, not for sale small scale; (D) Wound covering materials and (E) Blood items.
Appendix B. Percentage of Products that Is Falsified (Based on the Software Piracy Rate, www.nationmaster.com, Consulted December 2009)
Table A2.
Countries and fraction of falsified products.
| Antigua | 50 | Dutch Antilles | 50 |
| Aruba | 50 | Australia | 28 |
| Austria | 25 | Bahamas | 50 |
| Barbados | 50 | Belgium | 25 |
| Brazil | 59 | Canada | 33 |
| China | 82 | Colombia | 58 |
| Costa Rica | 61 | Cyprus | 50 |
| Denmark | 25 | Egypt | 60 |
| El Salvador | 81 | United Emirates | 35 |
| French Guyana | 42 | France | 42 |
| Germany | 27 | Greece | 58 |
| Guatemala | 80 | Guyana | 50 |
| Hungary | 42 | India | 69 |
| Indonesia | 84 | Israel | 32 |
| Ireland | 34 | Italy | 49 |
| Jamaica | 50 | Japan | 23 |
| South Korea | 43 | St Lucia | 50 |
| Mexico | 61 | Namibia | 50 |
| Netherlands | 28 | New Zealand | 22 |
| Niger | 50 | Norway | 29 |
| Panama | 74 | Portugal | 43 |
| Puerto Rico | 44 | Russia | 73 |
| San Marino | 50 | South Africa | 34 |
| Spain | 43 | Sweden | 25 |
| Switzerland | 25 | Taiwan | 40 |
| Thailand | 78 | Trinidad and Tobago | 50 |
| United Kingdom | 26 | United States | 20 |
| Venezuela | 87 |
Note: When a country does not appear on the list, we use the score 50.
Appendix C. The Data
Table A3.
Shipments of original and falsified products: Pharmaceutical items, general (in kilograms).
Table A3.
Shipments of original and falsified products: Pharmaceutical items, general (in kilograms).
| Year | Original | Falsified |
|---|---|---|
| 1996 | 6984.570 | 2437.430 |
| 1997 | 6726.670 | 2404.330 |
| 1998 | 52,109.53 | 19,346.47 |
| 1999 | 79,784.10 | 29,644.90 |
| 2000 | 102,338.1 | 40,856.93 |
| 2001 | 22,542.07 | 8584.930 |
| 2002 | 75,868.91 | 20,278.09 |
| 2003 | 12,747.33 | 5462.670 |
| 2004 | 12,117.31 | 7397.690 |
| 2005 | 8025.620 | 2938.380 |
| 2006 | 8639.090 | 3554.910 |
| 2007 | 15,909.47 | 6238.530 |
| 2008 | 15,565.72 | 10,033.28 |
Table A4.
Shipments of original and falsified products: Medicine, for sale small scale (in kilograms).
Table A4.
Shipments of original and falsified products: Medicine, for sale small scale (in kilograms).
| Year | Original | Falsified |
|---|---|---|
| 1996 | 7140.120 | 3402.880 |
| 1997 | 3721.980 | 1606.020 |
| 1998 | 1631.590 | 673.4100 |
| 1999 | 2360.470 | 818.5300 |
| 2000 | 25,662.14 | 9946.860 |
| 2001 | 55,775.76 | 16,261.24 |
| 2002 | 27,512.91 | 9549.090 |
| 2003 | 22,004.05 | 7445.950 |
| 2004 | 16,083.69 | 6314.310 |
| 2005 | 30,502.89 | 17,907.11 |
| 2006 | 43,727.94 | 24,332.06 |
| 2007 | 120,884.8 | 164,090.2 |
| 2008 | 56,326.23 | 32,061.77 |
Table A5.
Shipments of original and falsified products: Medicine, not for sale small scale (in kilograms).
Table A5.
Shipments of original and falsified products: Medicine, not for sale small scale (in kilograms).
| Year | Original | Falsified |
|---|---|---|
| 1996 | 82,410.42 | 34,027.58 |
| 1997 | 126,437.3 | 53,107.74 |
| 1998 | 87,937.55 | 42,676.45 |
| 1999 | 66,519.33 | 45,686.67 |
| 2000 | 129,504.3 | 70,367.69 |
| 2001 | 91,668.09 | 48,919.91 |
| 2002 | 88,133.77 | 42,033.23 |
| 2003 | 237,083.1 | 105,841.9 |
| 2004 | 176,400.2 | 101,030.8 |
| 2005 | 413,139.4 | 479,416.6 |
| 2006 | 284,124.9 | 200,984.2 |
| 2007 | 278,071.7 | 127,044.3 |
| 2008 | 302,822.2 | 141,556.8 |
Table A6.
Shipments of original and falsified products: Wound covering materials (in kilograms).
| Year | Original | Falsified |
|---|---|---|
| 1996 | 21,680.89 | 11,375.11 |
| 1997 | 25,731.19 | 26,771.81 |
| 1998 | 18,485.60 | 8128.400 |
| 1999 | 10,025.28 | 6677.720 |
| 2000 | 23,374.10 | 10,868.90 |
| 2001 | 28,716.47 | 17,209.53 |
| 2002 | 20,663.89 | 14,954.11 |
| 2003 | 45,351.56 | 23,804.44 |
| 2004 | 48,713.34 | 23,512.66 |
| 2005 | 33,667.00 | 16,122.00 |
| 2006 | 44,422.59 | 22,254.41 |
| 2007 | 33,909.00 | 21,029.00 |
| 2008 | 52,893.00 | 38,540.00 |
Table A7.
Shipments of original and falsified products: Blood items (in kilograms).
| Year | Original | Falsified |
|---|---|---|
| 1996 | 1007.850 | 364.1500 |
| 1997 | 12,778.71 | 11,796.29 |
| 1998 | 6391.800 | 2106.200 |
| 1999 | 2160.360 | 838.6400 |
| 2000 | 3251.140 | 1259.860 |
| 2001 | 3112.780 | 1131.220 |
| 2002 | 731.4600 | 370.5400 |
| 2003 | 5704.680 | 3990.320 |
| 2004 | 16,571.03 | 6558.970 |
| 2005 | 8564.730 | 3352.270 |
| 2006 | 1759.190 | 777.8100 |
| 2007 | 2634.270 | 1126.730 |
| 2008 | 45,435.90 | 17,764.10 |
References
- Staake, T.; Thiesse, F.; Fleisch, E. The emergence of counterfeit trade: A literature review. Eur. J. Mark. 2009, 43, 320–349. [Google Scholar] [CrossRef]
- Desiraju, R.; Nair, H.; Chintagunta, P. Diffusion of new pharmaceutical drugs in developing and developed nations. Int. J. Res. Mark. 2004, 21, 341–357. [Google Scholar] [CrossRef]
- Stremersch, S.; Lemmens, A. Sales growth of new pharmaceuticals across the globe: The role of regulatory regimes. Mark. Sci. 2009, 28, 690–708. [Google Scholar]
- Givon, M.; Mahajan, V.; Muller, E. Software piracy: Estimation of lost sales and the impact of software diffusion. J. Mark. 1995, 59, 29–37. [Google Scholar] [CrossRef]
- Franses, P.H.; Lede, M. Diffusion of Original and Counterfeit Products in a Developing Country; Econometric Institute Report 2010-08; Erasmus School of Economics: Rotterdam, The Netherlands, 2010. [Google Scholar]
- Bass, F.M. A new product growth model for consumer durables. Manag. Sci. 1969, 15, 215–227. [Google Scholar] [CrossRef]
- Ministry of Health. Fake Medicine Briefing Ministry of Health (Dutch: Nepmedicijnen brieving Ministerie van Volksgezondheid); Media Release: Paramaribo, Suriname, 2011.
- Health Research for Action (HERA). Strengthening of Pharmaceutical Quality Assurance and Legislation; Final Report, Part I—Main Report; Ministry of Health: Paramaribo, Suriname, 2010.
- Ministry of Health. National Medicines Policy Suriname 2005–2008 (Dutch: Het Nationaal Geneesmiddelenbeleid 2005–2008); Council for the National Vital Medicines Program, Government Publishing Service: Paramaribo, Suriname, 2005.
Figure 1.
Shipments and cumulative shipments of original and falsified products: Pharmaceutical items.
Figure 1.
Shipments and cumulative shipments of original and falsified products: Pharmaceutical items.


Figure 2.
Shipments and cumulative shipments of original and falsified products: Medicine, for sale small scale. Vertical axis is the amount and horizontal axis is the year.
Figure 2.
Shipments and cumulative shipments of original and falsified products: Medicine, for sale small scale. Vertical axis is the amount and horizontal axis is the year.

Figure 3.
Shipments and cumulative shipments of original and falsified products: Medicine, not for sale small scale. Vertical axis is the amount and horizontal axis is the year.
Figure 3.
Shipments and cumulative shipments of original and falsified products: Medicine, not for sale small scale. Vertical axis is the amount and horizontal axis is the year.

Figure 4.
Shipments and cumulative shipments of original and falsified products: Wound covering materials. Vertical axis is the amount and horizontal axis is the year.
Figure 4.
Shipments and cumulative shipments of original and falsified products: Wound covering materials. Vertical axis is the amount and horizontal axis is the year.


Figure 5.
Shipments and cumulative shipments of original and falsified products: Blood items. Vertical axis is the amount and horizontal axis is the year.
Figure 5.
Shipments and cumulative shipments of original and falsified products: Blood items. Vertical axis is the amount and horizontal axis is the year.

Figure 6.
Income distribution of respondents, amounts in SRD.

Table 1.
Fraction of falsified shipments over total shipments, based on estimates of the eventual total level.
Table 1.
Fraction of falsified shipments over total shipments, based on estimates of the eventual total level.
| Variable | Estimated Total Level | |||
|---|---|---|---|---|
| Original | Falsified | Fraction | ||
| (A) | Pharmaceutical items | 396,066 | 148,209 | 0.272 |
| (B) | Medicine, for sale small scale | 1,283,915 | 1,262,614 | 0.496 |
| (C) | Medicine, not for sale small scale | 4,463,491 | 2,128,846 | 0.323 |
| (D) | Wound-covering materials | 582,769 | 386,618 | 0.399 |
| (E) | Blood items | 372,778 | 267,351 | 0.418 |
| Average | 0.382 | |||
Note: The Bass model is used for (A), while the logistic model is used for (B), (C), (D) and (E).
Table 2.
Estimated inflection points for original and falsified shipments.
| Variable | Estimated Inflection Point | ||
|---|---|---|---|
| Original | Falsified | ||
| (A) | Pharmaceutical items | 1999 | 1999 |
| (B) | Medicine, for sale small scale | 2010 | 2010 |
| (C) | Medicine, not for sale small scale | 2008 | 2006 |
| (D) | Wound-covering materials | 2005 | 2006 |
| (E) | Blood items | 2013 | 2018 |
Note: The Bass model is used for (A), while the logistic model is used for (B), (C), (D) and (E).
Table 3.
p-values of the F test for the joint relevance of one-year lagged shipments of original products and one-year lagged shipments of falsified products (Each equation contains an intercept and current sales of the other variable).
Table 3.
p-values of the F test for the joint relevance of one-year lagged shipments of original products and one-year lagged shipments of falsified products (Each equation contains an intercept and current sales of the other variable).
| Variable | Dependent Variable | |
|---|---|---|
| Original | Falsified | |
| Pharmaceutical items | 0.933 | 0.806 |
| Medicine, for sale small scale | 0.119 | 0.382 |
| Medicine, not for sale small scale | 0.038 | 0.325 |
| Wound covering materials | 0.389 | 0.840 |
| Blood items | 0.653 | 0.529 |
Table 4.
Correlation between shipments of original products and of falsified products.
| Variable | |
|---|---|
| Pharmaceutical items | 0.973 |
| Medicine, for sale small scale | 0.914 |
| Medicine, not for sale small scale | 0.871 |
| Wound covering materials | 0.835 |
| Blood items | 0.932 |
| Average | 0.905 |
Table 5.
Pearson Chi-square p-values of correlation between “conscious purchases of falsified medicines and demographics.
Table 5.
Pearson Chi-square p-values of correlation between “conscious purchases of falsified medicines and demographics.
| The way health insurance is organized | 0.001 |
| Which health insurer? | 0.731 |
| Gender | 0.636 |
| Age | 0.334 |
| Personal monthly income | 0.214 |
| Household monthly income | 0.555 |
| Number of adults in household | 0.327 |
| Number of children in household | 0.369 |
| Total number of household members | 0.136 |
Table 6.
Type of insurance against frequency of use of falsified medicine.
| Answer to Question: | |||||
|---|---|---|---|---|---|
| Never | Rarely | Occasionally | Often | Very Often | Insurance |
| A | 18 | 6 + | 0 | 2 | 0 |
| B | 34 | 11 + | 14 + | 1 | 1 |
| C | 1 | 0 | 2 | 0 | 0 |
| D | 31 + | 3 | 1 | 3 + | 0 |
| E | 28 + | 3 | 3 | 1 | 0 |
| F | 80 + | 13 | 7 | 4 | 4 + |
| G | 1 | 0 | 1 | 0 | 0 |
| H | 2 | 0 | 0 | 0 | 1 + |
+ Fraction more than expected; A: I have no health insurance; B: The Ministry pays for my insurance due to my lack of income; C: FMM pays for my insurance; D: I have a health insurance at a private company; E: I have insurance via relatives (for example parents); F: My employer takes care of my insurance; G: I am insured via my employer and via someone else; H: I am insured via my employer and at a private company.
© 2017 by the authors. Licensee MDPI, Basel, Switzerland. This article is an open access article distributed under the terms and conditions of the Creative Commons Attribution (CC BY) license (http://creativecommons.org/licenses/by/4.0/).
Share and Cite
MDPI and ACS Style
Franses, P.H.; Lede, M. Adoption of Falsified Medical Products in a Low-Income Country: Empirical Evidence for Suriname. Sustainability 2017, 9, 1732. https://doi.org/10.3390/su9101732
AMA Style
Franses PH, Lede M. Adoption of Falsified Medical Products in a Low-Income Country: Empirical Evidence for Suriname. Sustainability. 2017; 9(10):1732. https://doi.org/10.3390/su9101732
Chicago/Turabian StyleFranses, Philip Hans, and Madesta Lede. 2017. "Adoption of Falsified Medical Products in a Low-Income Country: Empirical Evidence for Suriname" Sustainability 9, no. 10: 1732. https://doi.org/10.3390/su9101732
Note that from the first issue of 2016, this journal uses article numbers instead of page numbers. See further details here.