Article

Evaluation of Integrated Air Pollution and Climate Change Policies: Case Study in the Thermal Power Sector in Chongqing City, China

1
Graduate School of Life and Environmental Sciences, University of Tsukuba, 1-1-1 Tennodai, Tsukuba, Ibaraki 305-8572, Japan
2
National Institute for Environmental Studies, Center for Global Environmental Research, 16-2 Onogawa, Tsukuba, Ibaraki 305-8506, Japan
*
Author to whom correspondence should be addressed.
Sustainability 2017, 9(10), 1741; https://doi.org/10.3390/su9101741
Submission received: 22 August 2017 / Revised: 24 September 2017 / Accepted: 24 September 2017 / Published: 27 September 2017

Abstract

:
The cost of environmental degradation has already had a dramatic impact on the Chinese economy. In order to curb these trends, the government of China has introduced stricter regulations. With this in mind, it is important to quantify the potential co-benefits of introducing air pollution and climate change mitigation policies. This study proposes relevant scenarios ranging from the current trends (baseline) to the introduction of different policies in the thermal power sector, including different carbon tax rates, technology innovation promotion, and technology cost reduction methods. We aim to comparatively evaluate the impact of the proposed policies within the thermal sector and within the entire socio-economic system. To this end, we used a dynamic input–output (I-O) model, into which high-efficiency technologies were incorporated as new thermal power industries in order to estimate policy impact during the time period 2010–2025. The results of this study demonstrated that the introduction of one or more of the following policies: carbon taxes, subsidies, technology innovation, and technology cost reduction, has no notable impact on the environment or the economy without the implementation of environment regulations. In contrast, the strong support of a government subsidy coupled with strict environmental regulations will promote technological innovation, for example through the natural gas combined cycle (NGCC) and the integrated coal gasification combined cycle (IGCC). Our study also showed that the reduction of air pollution and greenhouse gas emissions as well as energy consumption would curb economic development to a certain extent. Taking this into consideration, innovation must also be promoted in other economic sectors. This research provides a strong reference for policy-makers to identify effective polices under different types of environmental regulations.

1. Introduction

China has been implementing stronger and integrated measures in an effort to reduce its Greenhouse gas (GHG) emissions since it became the largest CO2 emitter in the world in 2007 [1]. Additionally, air pollution has become a major problem in many cities across the country. Cities are now facing serious environmental threats, including acidification, bioaccumulation of toxic metals, and contamination of water streams [2,3]. One of the main challenges that China faces with regard to reducing its GHG and air pollution emissions is that it relies heavily on coal to meet energy demands. Coal usage accounts for 69% of the total energy consumption [4]. Electricity generation, being primarily coal-based, is the main contributor to GHG emissions, accounting for 44% of the total CO2 emissions [5]. Coal-fired power generation has also been associated with air pollution and a negative impact on health [3]. Thus, the main contributor of both types of emissions is the electric power sector.
In collaboration with the USA, China has announced its most significant international commitments regarding climate change efforts, in which it has committed to peak its CO2 emissions and coal consumption by 2030 and 2020, respectively. China has also committed to decrease its CO2 emissions per unit of GDP by 40–45% by 2020, as compared to data collected for 2005. Additionally, the government has introduced specific measures with regard to GHGs and air pollution, which has resulted in some progress thus far. With respect to GHG emission reductions, the target goal set by the government was a reduction in energy intensity by 20% in the 11th Five Year Plan (FYP), which will be achieved by shutting down small and inefficient coal power plants [6]. A reduction of carbon intensity by 17% between 2010 and 2015 was the target set by the government outlined in the 12th FYP [7]. Similarly, specific targets have also been set by the government aimed at reducing environmental pollution. With regard to SO2 emissions, the target goal set by the government in the 11th FYP was a reduction in SO2 emissions by 10%, as compared to 2005 [8]. The government expected to achieve these targets through the introduction of flue gas desulfurization devices and shutting down of small coal power plants. In the 12th FYP, the government set specific reduction targets for ambient concentrations of SO2, PM10, and NOx, of 10%, 10% and 8%, respectively, by 2015 as compared to the levels measured in 2010 [9]. While many of these targets have been met, there are still difficult challenges ahead. For example, in the 11th FYP the energy intensity target was nearly achieved, reaching 19.1% [10]. However, primary energy production grew by 31% and CO2 emissions increased by 34% [11]. In the case of air pollutants, while reduction targets have been achieved, the current level of pollution is still higher than in other developed nations [12].
Effective environmental policies can drive technology innovation, which in turn play a key role in achieving specific targets [13,14]. In an effort to improve energy efficiency and reduce air pollution, the link between policies and innovation in energy-intensive sectors has been the focus of a few published studies. Most of these studies are based on bottom-up models. Balash et al. [15] analyzed the impact of the potential command and control and market regulations on future electricity mix and generation, as well as CO2 and air pollution emission levels in the USA by using the market allocation (MARKAL) model. The results of the study illustrate that different regions have their own environmental regulation policy preference. The impact of CO2 emission targets and carbon tax on technology selection and demand in the power sector in Bangladesh was analyzed by Mondal et al. using the MARKAL model [16]. The results of this study suggest that the application of such measures will favor the adoption of cleaner fossil fuels and renewables in the near future [16]. In the case of China, there is extensive research that has focused on the impact of technology innovation on energy resource consumption and air emissions of the industrial sectors. For example, Zhang et al. [17] analyzed the potential co-benefits of energy efficiency and emission mitigation in the iron and steel industries in China. Through the use of greenhouse gas and air pollution interactions and synergies model (GAINS) [17], the study found that the introduction of end-of-pipe control options and the implementation of best available energy efficiency measures can help reduce GHG emissions and air pollutants. Cai et al. [18] forecasted fuel consumption and associated it with CO2 mitigation in China’s thermal electricity sector from 2000 to 2030 using the “long-range energy alternative planning system” (LEAP) model. The results of this study indicated that if structural adjustments and technical mitigation measures in China’s electricity sector are not implemented, energy consumption and CO2 emissions in this sector will rise rapidly [18]. Zhang et al. [19] estimated the potential amount of CO2 emissions and air pollutants from the electricity sector in China in 2030 based on government regulations and external costs associated with emissions from coal power plants using the LEAP model. This study indicated that the application of such measures will promote advanced coal technologies and help reduce emissions [19]. Yu et al. [20] designed a technology-based bottom-up model in order to estimate the performance of China’s coal-fired electricity industry on energy resource consumption and environmental emissions and found that technology innovation is the determining factor in decreasing resource use and environmental impacts from electricity production. The majority of published studies have only considered the impact of specific measures on individual sectors but neglected to analyze the interactions of different industrial sectors in the entire economy. Additionally, these studies were conducted at the national level and utilized a bottom-up approach.
Other studies have focused on the co-benefits of GHG emission and air pollution mitigation policies. Tang et al. [21] evaluated the potential co-benefits of CO2 mitigation policies on dust, NOx and SOx emissions in China’s cement industry. The results of the study suggest that co-benefits could be achieved when the CO2 reduction target is set between 2.3% and 5.5% [21]. Li et al. [22] used historical data to analyze the aggregate effect of actual air pollution regulation on CO2 mitigation in the manufacturing industry in China. Their findings showed that SO2 regulations would reduce the price of carbon permits. Zheng et al. [23] conducted an analysis of the air pollution reduction and climate change mitigation in the industry sector of the Yangtze River using the GAINS-China model. The results of this study showed that SO2 emissions would be under control by 2030 but NOx emission would continue growing, while PM2.5 showed different trends for the three study regions. Liu et al. [24] quantitatively evaluated and compared two categories of emission reduction instruments, carbon tax, and the mandatory application of end-of-pipe emission control measures, in China’s iron and steel sectors for CO2, SO2, and NOx using two soft-linked models. The results indicated that carbon tax can bring co-benefit for multi-pollutants to a certain level because the emission reduction rates are affected by the tax rates. However, their comparison was inconsistent because the technology was introduced in the iron and steel sector using the technology-based model but the carbon tax was applied in all of the sectors using the top-down Computable General Equilibrium Model (CGE) model. Zhou et al. [25] developed an integrated top-down model which incorporated new technology as a new industry and a carbon tax in the thermal power sector. This paper builds on the study by Zhou et al. [25] by incorporating different levels of a carbon tax rate and a technology reduction cost in the thermal power sector alone.
The purpose of this paper is to explore how carbon taxes, subsidies, and technology innovation promotion, both in isolation and combination, will impact the electricity mix, energy, environment, and economy under government environmental regulations. To address this question, we used a regional-dynamic input–output (I-O) model with detailed classified technologies in the thermal power sector to perform a policy comparative analysis.
The main advantage of the dynamic I-O model is that the data requirement is less than CGE [26]. Additional data requirement of CGE increases the uncertainty of simulation result, especially for research at a regional level. The I-O model can help us track the consequence of external shock better than CGE because the substitution relationship within different commodity and production factors leads to complicated response of the CGE model system to external shocks.
Additionally, GHG emission by energy sectors has basically technical aspects, namely, energy efficiency in terms of GHG emissions and air pollutants. Economically, the model developed in this paper allows us to simulate and analyze the substitution among alternative technologies available currently and in near future. In contrary to traditional I-O and CGE models, in our simulation model, several constraints on resources (e.g., a GHG upper limit, air pollutant upper limit, etc.) are built and it is possible for substitution to happen in the market if alternative technology exists and/or the economic situation changes.
In this study, our dynamic regional I-O model combined the advantages of top-down and bottom-up models. The model incorporated detailed high efficient technologies and highlighted the potential and prosperous new industries in electricity sector in the near future, which is the advantage of bottom-up model. This method could eliminate possible inconsistencies by coupling top-down and bottom-up models via a simulation that clarifies both technology selection and assessment of such prosperous technology in the near future in terms of index of GRP, which clarifies the significance of new technology for stakeholders in monetary terms.
The wide gaps among regions in terms of technology development and environmental regulations contribute to the significance of the studies at the regional level. Thus, we chose the municipality Chongqing as a case study because it has been identified as a strategically important city, acting as a gateway for the development of Western China. Chongqing is the only central municipality (the other three are Beijing, Shanghai, and Tianjin), and it is also the most populated Chinese municipality. It is also a major economic, financial, and manufacturing center as well as a transport hub in southwestern China. Rapid economic development, coupled with the use of traditional, inefficient, thermal power generation will have an environmental as well as a socio-economic impact on the city. This makes identifying the optimal policy measures at the economic–environmental–technological level for Chongqing an urgent and important matter.
The rest of the paper is organized as follows: climate change and pollution mitigation challenges are introduced in Section 2. The methodology is described in Section 3. The results and discussion are presented in Section 4. Finally, the conclusions drawn and the policy implications are highlighted in Section 5.

2. Climate Change and Pollution Mitigation Challenges

China has made significant improvements in addressing climate change and air pollution, however, the country still has a significant amount of work left to do. Currently, adaptation measures are still dispersed in terms of the institutional setting, organization, and management. For example, strong support for innovations in the energy sector has been proven to contribute to CO2 emission and air pollutant reductions [27,28,29]. This means that policies must be an integral part of the adaptation measures being made in order to capitalize on the co-benefits. While this approach could be more effective, many administrative and management barriers currently exist regarding the implementation of such policies in China [30].
Attaching a price to carbon emissions has been suggested as a way of reducing GHG and air pollutant emissions while simultaneously promoting innovation. The underlying principle is that by putting a price on carbon emissions, this will provide an economic incentive to find alternatives to reduce such emissions. The two main climate policies are carbon taxes and emission trading schemes (ETS). In regards to ETS, the government sets a cap on emissions and issues permits that allow organizations to achieve the target by trading these permits. In order to encourage participation, the government provides allowances to pollute or the opportunity to sell them to other firms. In regards to carbon tax, a cost is imposed on CO2 emissions. The main advantage of ETS is that setting a cap can actually result in the reduction of CO2 emissions. The challenges of ETS include determining the baseline amount, the reduction targets, and the allocation of permits. This suggests that the preparation and implementation process could be complicated and lengthy. It is also difficult to forecast the ideal price needed in order to achieve the reduction levels defined by the cap. The main advantages of a carbon tax include a much easier implementation process and the resulting increase in government revenue. The main disadvantage is that the level of reduction is determined by the resulting market forces because no cap is set, which could affect productivity and economic growth. In our current study, we chose the approach that was the most practical for our analysis. Considering that a carbon tax can directly raise revenue for the government, we selected this mechanism.

3. Materials and Methods

A novel dynamic I-O model, developed by Zhou et al. with respect to thermal electricity sectors [25], was used in this study in order to evaluate the proposed policy. Our hypothesis was that when fossil fuel is utilized under mandatory air pollution reduction, the introduction of advanced fossil fuel energy technology and its resulting reductions in cost resulting from the implementation of a carbon tax and a subsidy could be beneficial in terms of economic growth, energy efficiency, and the reduction of GHG emissions and air pollutants. In this study, the model was applied in order to evaluate these polices in isolation, as well as in combination. This section explains how the proposed policy and the associated key assumptions were incorporated into our model.

3.1. Dynamic I-O Model

3.1.1. Economic Indicator GRP

The objective function of this model is to maximize the sum of the discounted GDP (see Formula (1)) from 2010 to 2025, subject to all of the constraints. This can be formulated as follows:
M a x   t = 1 11 ( 1 1 + ρ ) t 1 G R P ( t )   ( ρ = 0.05 )
G R P ( t ) = i = 1 4   V i X i ( t )
where GRP(t) is the gross regional product in terms of t (en: endogenous variable); Xi(t) is the production of each industry i in terms of t (en); and ρ is the social discount rate. Vi is the value-added rate of industry i (ex: exogenous). The objective function is subject to the following constraints. Subscript i represents the industries shown in Table A1.
While social discount rate plays a decisive role in the analysis of climate policy, this topic is still under dispute [31,32]. Depending on the discount rate, human mitigation activates could be affected in the long or short term. In our study, we used static discount rate of 5% to emphasize that the social cost resulting from climate changes becomes huge compared to the economic benefits in the near future. The value of 5% is within the range of values adopted in previous studies: Cline et al. used a value of 1.95% [33] and Nordhaus et al. used a value of 5.5% [32].

3.1.2. Energy Consumption

The energy consumption in this model is defined by the seven primary types of energy used in Chongqing (coal, coke, gasoline, kerosene, diesel, oil, and natural gas) and the secondary energy electricity. All of the energy units are converted to tons of coal equivalents (TCE).
The total energy consumption E D ( t ) is divided into industry consumption EDi(t) and household consumption ( E D c ( t ) ) (see Formula (3)). E D i ( t ) is a vector of the demand of the seven energy types in the industry i and E X i is a vector of the energy consumption intensity in industry i (see Formula (4)). Similarly, E D c ( t ) is the household energy demand and E X c is a scalar of the energy consumption intensity (see Formula (5)). The energy consumption intensities E X i and E X c are calculated based on the energy consumption and the industry production in 2010, respectively [34]. X i ˜ ( t ) is a diagonalized matrix using the production vector Xi(t); and X c ( t ) is a vector of household consumption.
E D ( t ) = 1 4 E D i ( t ) + E D c ( t )
E D i ( t ) = E X i · X i ˜ ( t )  
E D c ( t ) = E X c · X c ( t )

3.1.3. Model Dynamics

The model is dynamically driven by the capital stock and the annual capital through industry investment (see Formula (6)):
K i ( t + 1 ) = ( l δ i ) K i ˜ ( t ) + Δ K i ( t )
K i ( t + 1 ) is the capital stock in year t + 1 in industry i (i = 1, 2, 3, e); δ i is the capital depreciation coefficient; and Δ K i ( t ) is the capital formation provided by industry i. l is a row vector for summation.

3.1.4. Air Pollution and GHG Emissions

The GHG and air pollutants emissions ( W g a s ( t ) ) in this model are defined as the total amount of emission-related energy consumption by industry and household.
W g a s ( t ) = 1 4 E D i T ( t ) · E E n g i g a s + E D c T · E E n g c g a s   ( g a s = G H G ,   S O 2 ,   N O x ,   P M 10 , P M 2.5 )
where W g a s ( t ) is a vector of five elements denoted by the amount of emission of four kinds of air pollutants and GHGs, as shown in Formula (7). E E n g i g a s and E E n g c g a s are gas emission coefficient matrices of industry and households, cited from the Greenhouse Gas Inventories of the IPCC [35], that correspond to the seven types of energy consumed in the ith industry and household.

3.1.5. Regional Government Environmental Regulation Constraints

The central and local Chinese governments implement development plans every five years in order to improve the quality of the environment in China. Based on the plan provided by the central government and the environmental situation of Chongqing, the Chongqing government plans to reduce its air pollution emissions by 10% every five years. In this study we used the regulations set by the government and analyzed their impact using integrated evaluation models. We incorporated this regulation into our model by providing a constraint on the amount of emissions in 2015, 2020, and 2025, and keeping the amount of emissions in other years unconstrained, which could be helpful in the optimization of energy utilization and the maximization of economic development.
In addition, the constraints set on SO2 and NOx emissions will indirectly curb PM10, PM2.5, and GHG emissions. This assumption is based on the identified strong synergies between air quality and climate relevant measures that would allow for improvements in the cost-efficiency of air pollution policies [36].

3.1.6. Technology Innovation and Its Cost Reduction

In our study, the concept of innovation refers to the adoption of advanced technology. For rapidly developing economies like in China, the technologies needed for compliance already exist when the quality of environment is deteriorating or when the decision to regulate it is made. The premise is that the environmental regulations will influence the rate and the direction of adoption of innovation. The challenge is how such regulations can bend the direction of innovation towards more environmentally friendly ones and how such intervention can be done in a manner that generates the least cost to society. In our study, we assume that technology innovation is driven by imposing government-regulated targets regarding air pollution (SO2 and NOx), and maximizing economic growth (GRP). The reduction of air pollution is achieved by improvements in energy utilization efficiency in the thermal electricity sector. Additionally, advanced technologies have a higher efficiency as compared to traditional technologies, because they consumes less coal or natural gas to generate one unit of electricity. The total electricity supply S(t) is divided into hydropower Sh and seven sub-sectors according to the types of fossil-fuel technologies (see Formula (8)). These include the conventional technology type subcritical (SUB) technology Ssub(t), which is less energy-efficient (resulting in a higher level of pollutants, and accounts for more than 70% of the coal power generation in China [37]), and advanced technologies (see Table A1) such as Supercritical (SC) Technology Power Supply (Ssc(t), en), Ultra-Supercritical Technology (USC) Power Supply Susc(t), Integrated coal Gasification Combined Cycle (IGCC) Power Supply Sc(t), IGCC and Carbon Capture and Storage (IGCC-CCS) Power Supply Scs(t), Natural Gas Combined Cycle (NGCC) Power Supply Sn(t), and NGCC-CCS Power Supply Sns(t) (see Formula (9)). Electricity demand D(t) is determined by each of the industrial economic activities Di(t) and government and household activities Dc(t) (see Formula (10)). To maintain the electricity flow balance, the annual electricity supply is equal to electricity demand.
S ( t ) = D ( t )
D ( t ) = i = 1 4 D i ( t ) + D c ( t )
S ( t ) = S h + S s u b ( t ) + S s c ( t ) + S u s c ( t ) + S c ( t ) + S c s ( t ) + S n ( t ) + S n s ( t )
In our model, the assumption was made that each electricity technology represented one industry. Advanced technologies (or new industries) were incorporated into this study through the addition of six industries into columns in the original I-O table. The structure of each new column was calculated based on the structure of the conventional electricity technology industry and their relationship is shown in Table A2 [38]. These technology options are provided by the International Energy Agency (IEA) technology roadmap [39]. The technologies are endogenously adopted as substitutes for the low-efficiency technology. Many factors affect this substitution, such as government regulation level, carbon tax/subsidy level, and technology features (cost, energy efficiency, and emission efficiency). The comprehensive model ensures that the optimum combination of power generation technologies is used based on the regional economic, energy, and environmental conditions.
Additionally, the published I-O tables do not provide detailed information about disaggregating the electricity sectors. The core of disaggregating the electricity sector is as follows: we assume all the disaggregated electricity sectors are in one sector in the I-O table, producing electricity and always keeping consistent with the original I-O table calibration. Within the electricity sector, there are several electricity technology options with which disaggregated electricity sectors diversified. Therefore, the fundamental work of the disaggregating electricity sector is to reset the share of input from all the sectors into disaggregated electricity sectors by keeping the consistency of the aggregated electricity sector with the original I-O data. The principle of the reset is based on the characteristics of the technologies (technology data). In our study, the technology data are obtained from IEA technology roadmap [39]. However, we must accept the reality that economic data of technologies are still unknown because they have not yet been sold in the market. Our paper primarily focuses on fossil energy technological efficiency with respect to conversion into electricity, namely, a greater production of electricity while emitting lower amounts of GHGs and air pollutants. The efficiency is mainly determined by the chemical and physical formula and will keep stable in the future market. We assume that economic aspect of the new technologies predicted and forecasted by IEA [38,39] are reliable enough for the simulation by allowing admissible level of estimation error. In addition, numerous similar disaggregating works using dynamic I-O models in different sectors have been published [40,41,42,43,44,45,46,47,48,49,50].

3.1.7. Carbon Taxes and Subsidies

Carbon taxes and subsidies were the two proposed economic policies used in this study. A carbon tax is imposed on the GHG emissions due to fossil fuel consumption in the electricity sector. The revenue of the carbon tax T i c ( t ) was used as part of the subsidy, which is paid by the government in order to promote highly efficient thermal technology.
In Formula (11), the left side is the gross sales by the industry in the market and the right side represents the total cost of each industry, including intermediate input (from the first item to the third one), industrial value added (from the fourth item to the sixth one) and the carbon tax (the seventh item).
P i ( t ) X i ˜ ( t ) + r s u b X i ˜ ( t )       P 1 ( t ) A 1 i X i ˜ ( t ) + P e ( t ) A e i X i ˜ ( t ) + P 3 ( t ) A 3 i X i ˜ ( t ) + P 4 ( t ) A 4 i X i ˜ ( t )       + Y i h ( t ) + δ i X i ˜ ( t ) + τ i X i ˜ ( t ) + T i c ( t )
S u b s i d y ( t ) = r s u b ( S s c ( t ) + S u s c ( t ) + S c ( t ) + S c s ( t ) + S n ( t ) + S n s ( t ) )
T i c ( t ) = r c ( t ) W i c o 2 ( t )
where P i ( t ) is the endogenous price rate vector of the sectors in industry i (i = 1, e, 3 and 4); S u b s i d y ( t ) is the subsidy from government for the promotion of technology innovation (see Formula (12)); and r s u b is the endogenous subsidy rate for all of the advanced technology. Y i h ( t ) is the endogenous vector of the household income of each sector in industry i; δ i is the exogenous vector of depreciation rate of each sector in industry i; T i c ( t ) in Formula (13) is the carbon tax based on the relative amount of carbon emission from a given sector; W i c o 2 ( t ) is the amount of GHG emission from industry i; and r c ( t ) is the endogenous carbon tax rate. In this study, r c ( t ) has two alternative upper boundaries: 70 CNY/ton and 110 CNY/ton; τ i is the exogenous indirect tax rate vector of each sector in industry i.

3.2. Data Setting

In this study, we used official social-economic data, the I-O table, energy data, and air pollution and GHG emission data from the Chongqing Statistical Yearbook—2010 [34]. These data are well consistent with each other, which improves the robustness of data for model specification and calibration for validation. Additionally, the total GHGs, air pollutant emission amounts, GRP and industrial production calculated based on the I-O model of the base year are almost equal to official data from the Chongqing City Government.
The socio-economic data of the target area are set as follows: “2010 input–output extended table of Chongqing” of the Chongqing Statistical Yearbook-2010 [34] was used to calculate the input coefficients between economic entities, indirect tax rate, income rate, capital depreciation rate, and the value added rate. This table also includes household and government consumption, investment, net exports, and sectoral production, which are used to validate the robustness of model parameters. The income, savings, and expenditure of household and government in Chongqing Statistical Yearbook—2010 were used to calculate the expenditure rate and saving rate.
The energy and environment data were also set. First, industry and household energy consumption in Chongqing Statistical Yearbook—2010 and sectoral production in I-O table of Chongqing in 2010 were used to calculate all types of energy consumption intensity of all the economic entities. Second, air pollution and the GHG emission coefficient of each type of energy in IPCC [35] and energy consumption amount of each economic entity were used to calculate air pollution and GHG emission amount.

3.3. Scenario Design

The scenarios were constructed in order to compare the impact of the different combination of policy options; a total of 12 scenarios were proposed and are shown in Table 1.
The scenario design was based on four main policy combinations. Firstly, there are mandatory environmental targets for the reduction of SO2 and NOx emissions (10% every five years or our assumed 5% for the same period of time). Secondly, there was the promotion of advanced technological innovation and technology cost reduction (10%); here the cost reduction means that the intermediate input into the advanced technology industry decreased by 10%. The items in value added increased by 10%, respectively. Thirdly, different levels of carbon tax (carbon tax of 70 CNY/ton or 110 CNY/ton) were used. Finally, subsidies from the government for advanced technology innovation were used. The potential tax rates are based on the Chinese pilot city carbon pricing survey [51]. The promotion of advanced technology innovation means that the government provides strong support, through subsidies, for the adoption and eventual development of new technological innovations. Advanced technologies are endogenously adopted as substitutes for low-efficiency technologies.
The proposed scenarios include the Baseline (Base) and the R1_Base scenario, which was designed to meet the government regulated target under the technology level set in the baseline. Base was also used as the reference for quantifying the impact of a proposed policy in the 11 other scenarios. R0_T1(2)_C1(2)S were used in order to evaluate the impact of technology innovation or carbon tax or subsidy. R1_T1(2)_C1(2)S were used in order to quantify the impact of the combination of all of the proposed policies. We also compared the effect of each policy individually.

4. Results and Discussion

Based on the results of the simulation, the integrated assessment system can estimate the impact of the proposed policy options in different scenarios. Simultaneously, we will be able to identify the contributions of different combinations of policies through the analysis of the results regarding improvements in economic development, environmental preservation, and energy savings, which are important indicators affected by the implication of such policies.

4.1. Impact Analysis of Proposed Policies on Economy and Environment

Table 2 shows total changes from the baseline scenario driven by proposed policies from 2010 to 2025 in terms of GRP, GHGs, and air pollutants. Technology cost reduction, carbon tax, or subsidies alone only have a minor impact on the economy (less than 0.2%) and environment (less than 0.1% in all mentioned air emissions) for both the regulations included (see Group 0, 2 and 3) and excluded scenarios (see Group 1). A carbon tax rate of 70 CNY/ton or 110 CNY/ton or a technology cost reduction also only has a minor impact on the economy (less than 0.1%) and environment (less than 0.1% in all mentioned air emissions).
Without any regulation (see Group 1), the combination of the proposed policies has a minor impact on the economy (0.26–0.37%), environmental GHG emissions (0.10–0.13%) and air pollution (SO2: 0.28–0.30%; NOx: −0.40–−0.36%; PM10: 0.42–0.46%; PM2.5: 0.25–0.28%). In contrast to this, the addition of environmental regulations (see Group 2 and 3), or the combination of the proposed policies has a larger positive (around 20%) impact on the economy when compared with the R1_Base (see Group 0). Environmental regulations of 10% (5%) significantly curb total economic development by −42.5 to −22.54% (−15.83 to −15.79%).
In our current study, the results indicate that the introduction of policy options that combine a carbon tax and a subsidy system along with government regulations will result in positive socio-economic and environmental implications. This study demonstrates that the introduction of a carbon tax alone has no obvious impact on the promotion of technological innovation, economic growth, and energy conservation. Evaluation of the results for the different scenarios indicates that a government subsidy, partially funded by carbon tax revenues, for technological innovation in the power sector will help reduce both air pollution and GHG emissions, to a certain extent. In this regard, we must also promote innovation in other economic sectors. Another important finding is that strict government regulations may reduce CO2 air pollutant emissions; however, they will also slow economic growth. The potential economic benefit of reducing air pollution and GHG emissions in terms of an improved quality of life and environmental conservation may offset lower GRP growth [52].
Based on the above findings, we focused on the Baseline scenario and scenarios including regulation coupled with a lower cost policy that included a 70 CNY/ton carbon tax and a technology cost with a 10% reduction (Base, R1_Base, R1_T2_C1S and R2_T2_C1S) to perform a more detailed analysis. R1_Base (see Group 0) and R1_T2_C1S (see Group 2) ranked the highest and lowest in terms of cost ( = Δ GRP / Δ GHG ), respectively, among the scenarios that included the government environmental regulation of a 10% SO2 and NOx reduction every five years. R2_T2_C1S (See Group 3) is the lower cost scenario under the 5% proposed environmental regulation.

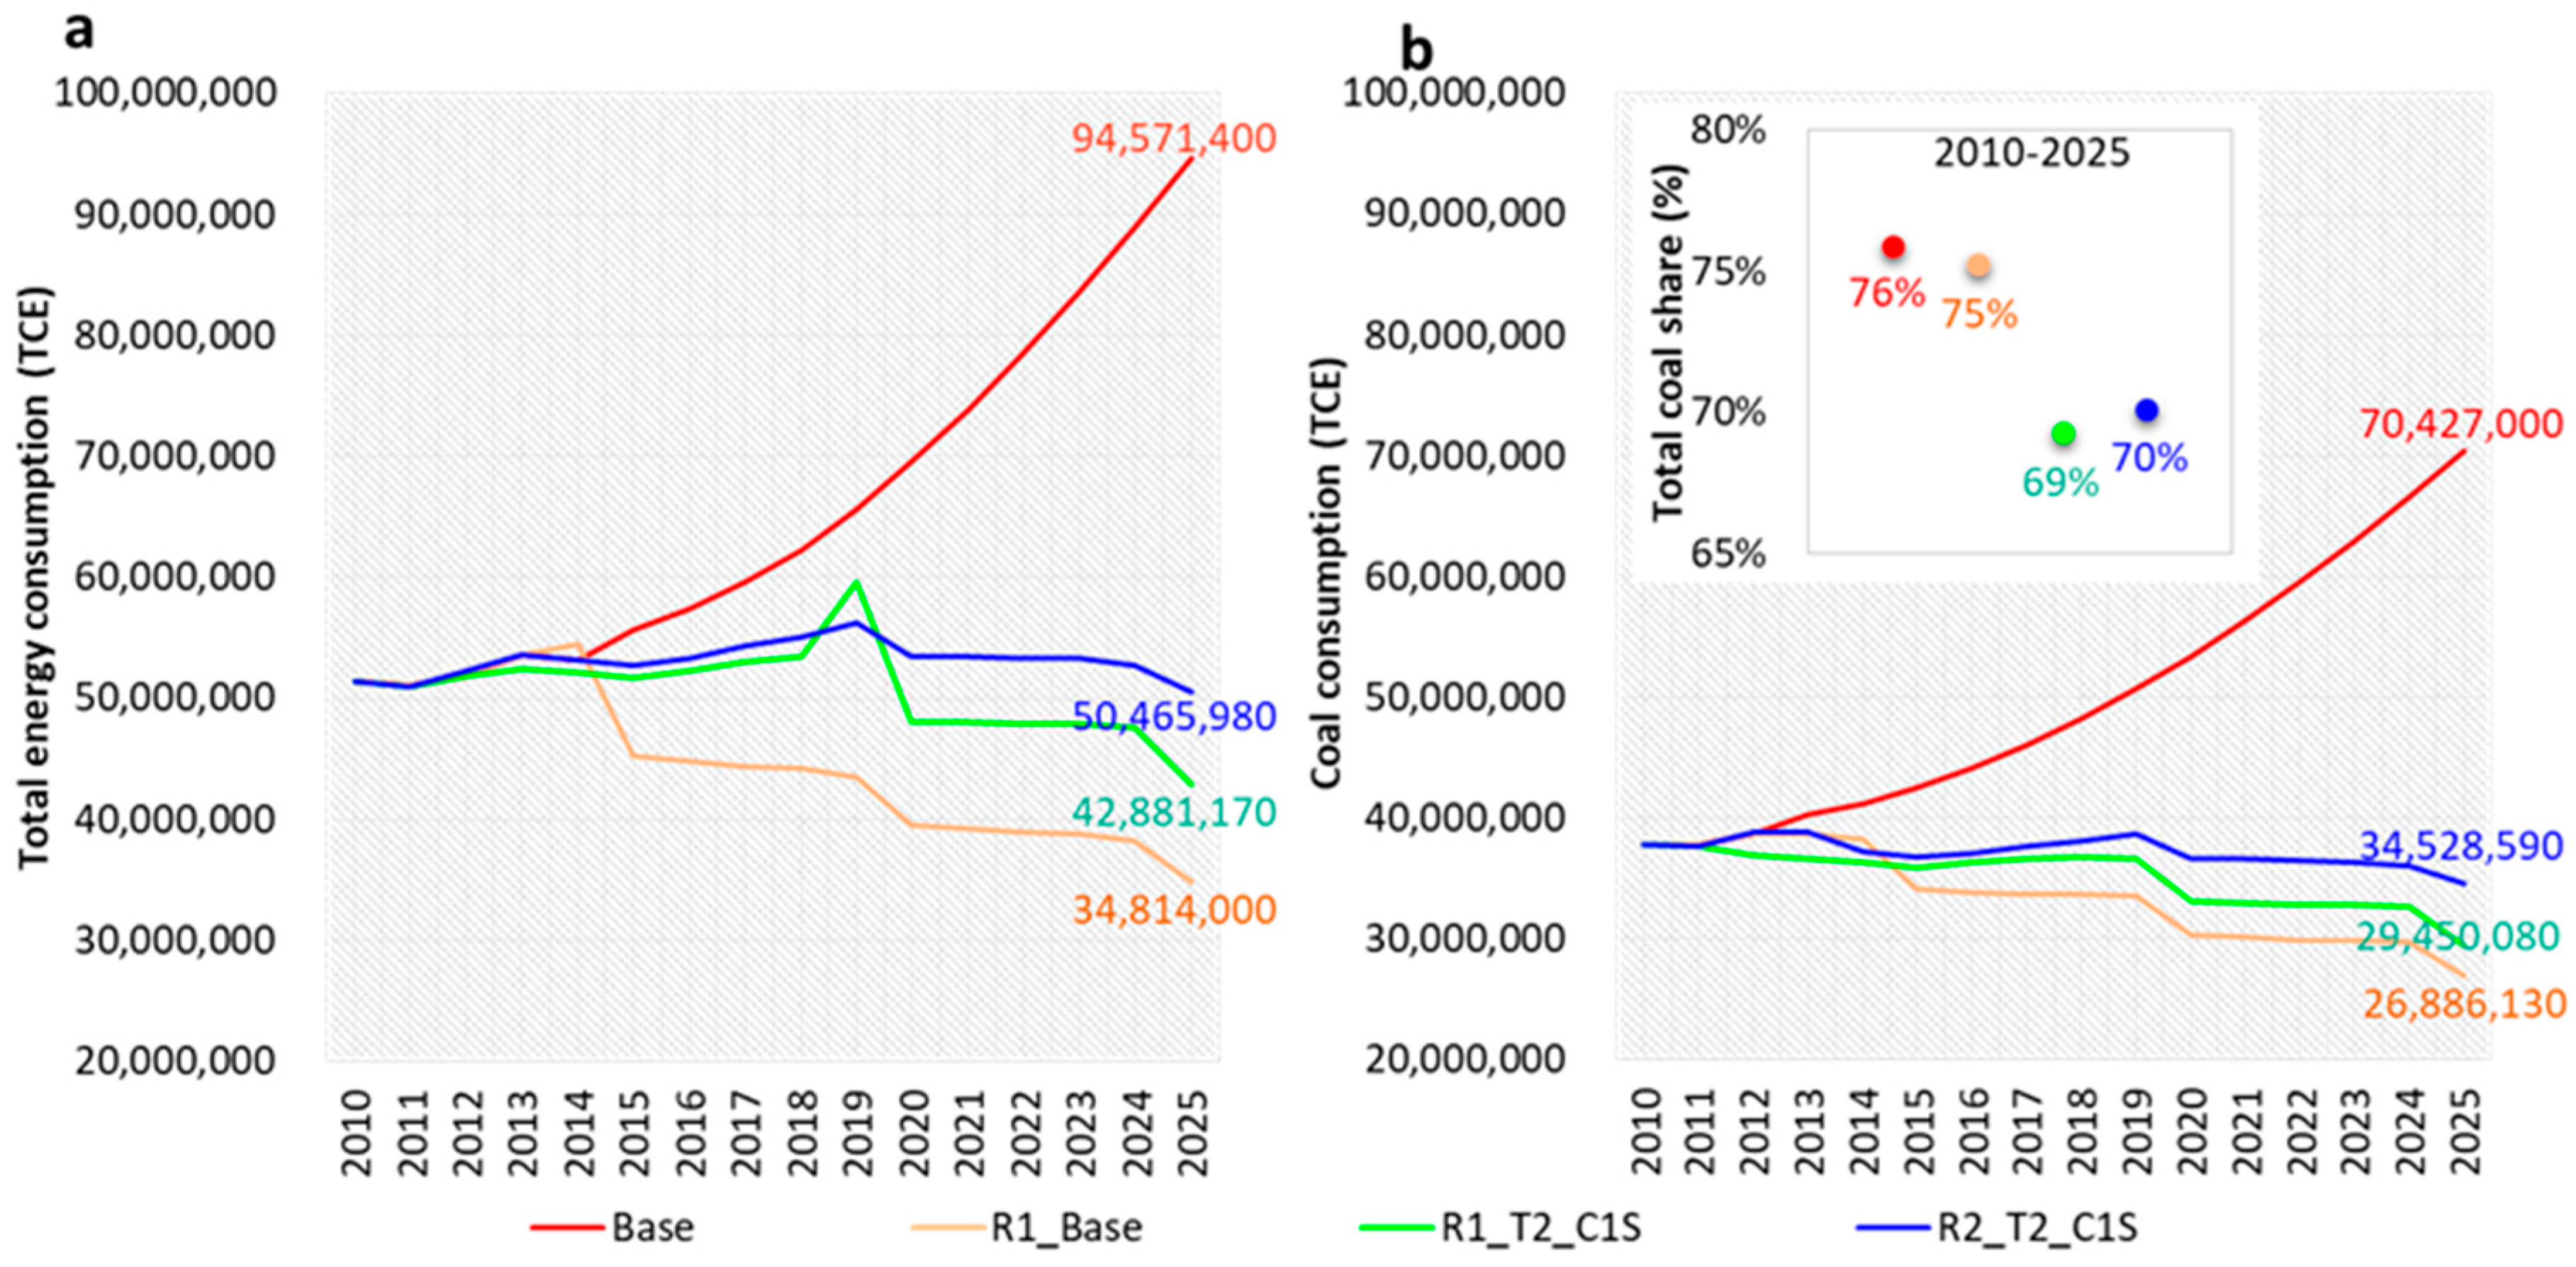
4.2. Impact on Energy Consumption

The total energy consumption and the coal consumption in Chongqing city are shown in Figure 1. The total energy and coal consumption grew rapidly in the Baseline scenario but decreased in the scenarios in which regulation was included. A huge gap in total energy (coal) between the Baseline and the other three scenarios, R1_Base, R1_T2_C1S and R2_T2_C1S, was widened by 59,800,000 (40,900,000) TCE, 51,700,000 (35,900,000) TCE and 44,100,000 (43,500,000) TCE, respectively. This result indicated that the introduction of strict government regulation without any technology innovation led to a greatly reduced consumption of energy. Technology innovation promoted by a carbon tax and a subsidy mitigated the reduction in energy consumption drastically in R1_T2_C1S. Additionally, less strict regulation also mitigated the reduction of energy consumption in R2_T2_C1S. Coal consumption was shown to have similar trends as energy consumption (Figure 1b). The data in Figure 1b also show that, under the proposed scenarios, coal consumption will peak around the year 2020. This is a notable result because it aligns with the country’s development strategy plan [53]. The results also demonstrate that the introduction of regulations coupled with strong support for innovation and a carbon tax will lessen the dependence on coal and incentivize the adoption of cleaner fuel. This will help decrease the dependence on coal as a primary energy source. This is a significant outcome because Chongqing could be locked in a coal-fired power generation structure if no measure is taken; in other words, it will be very difficult to change the coal-based energy supply and its associated environmental impacts in the near future.

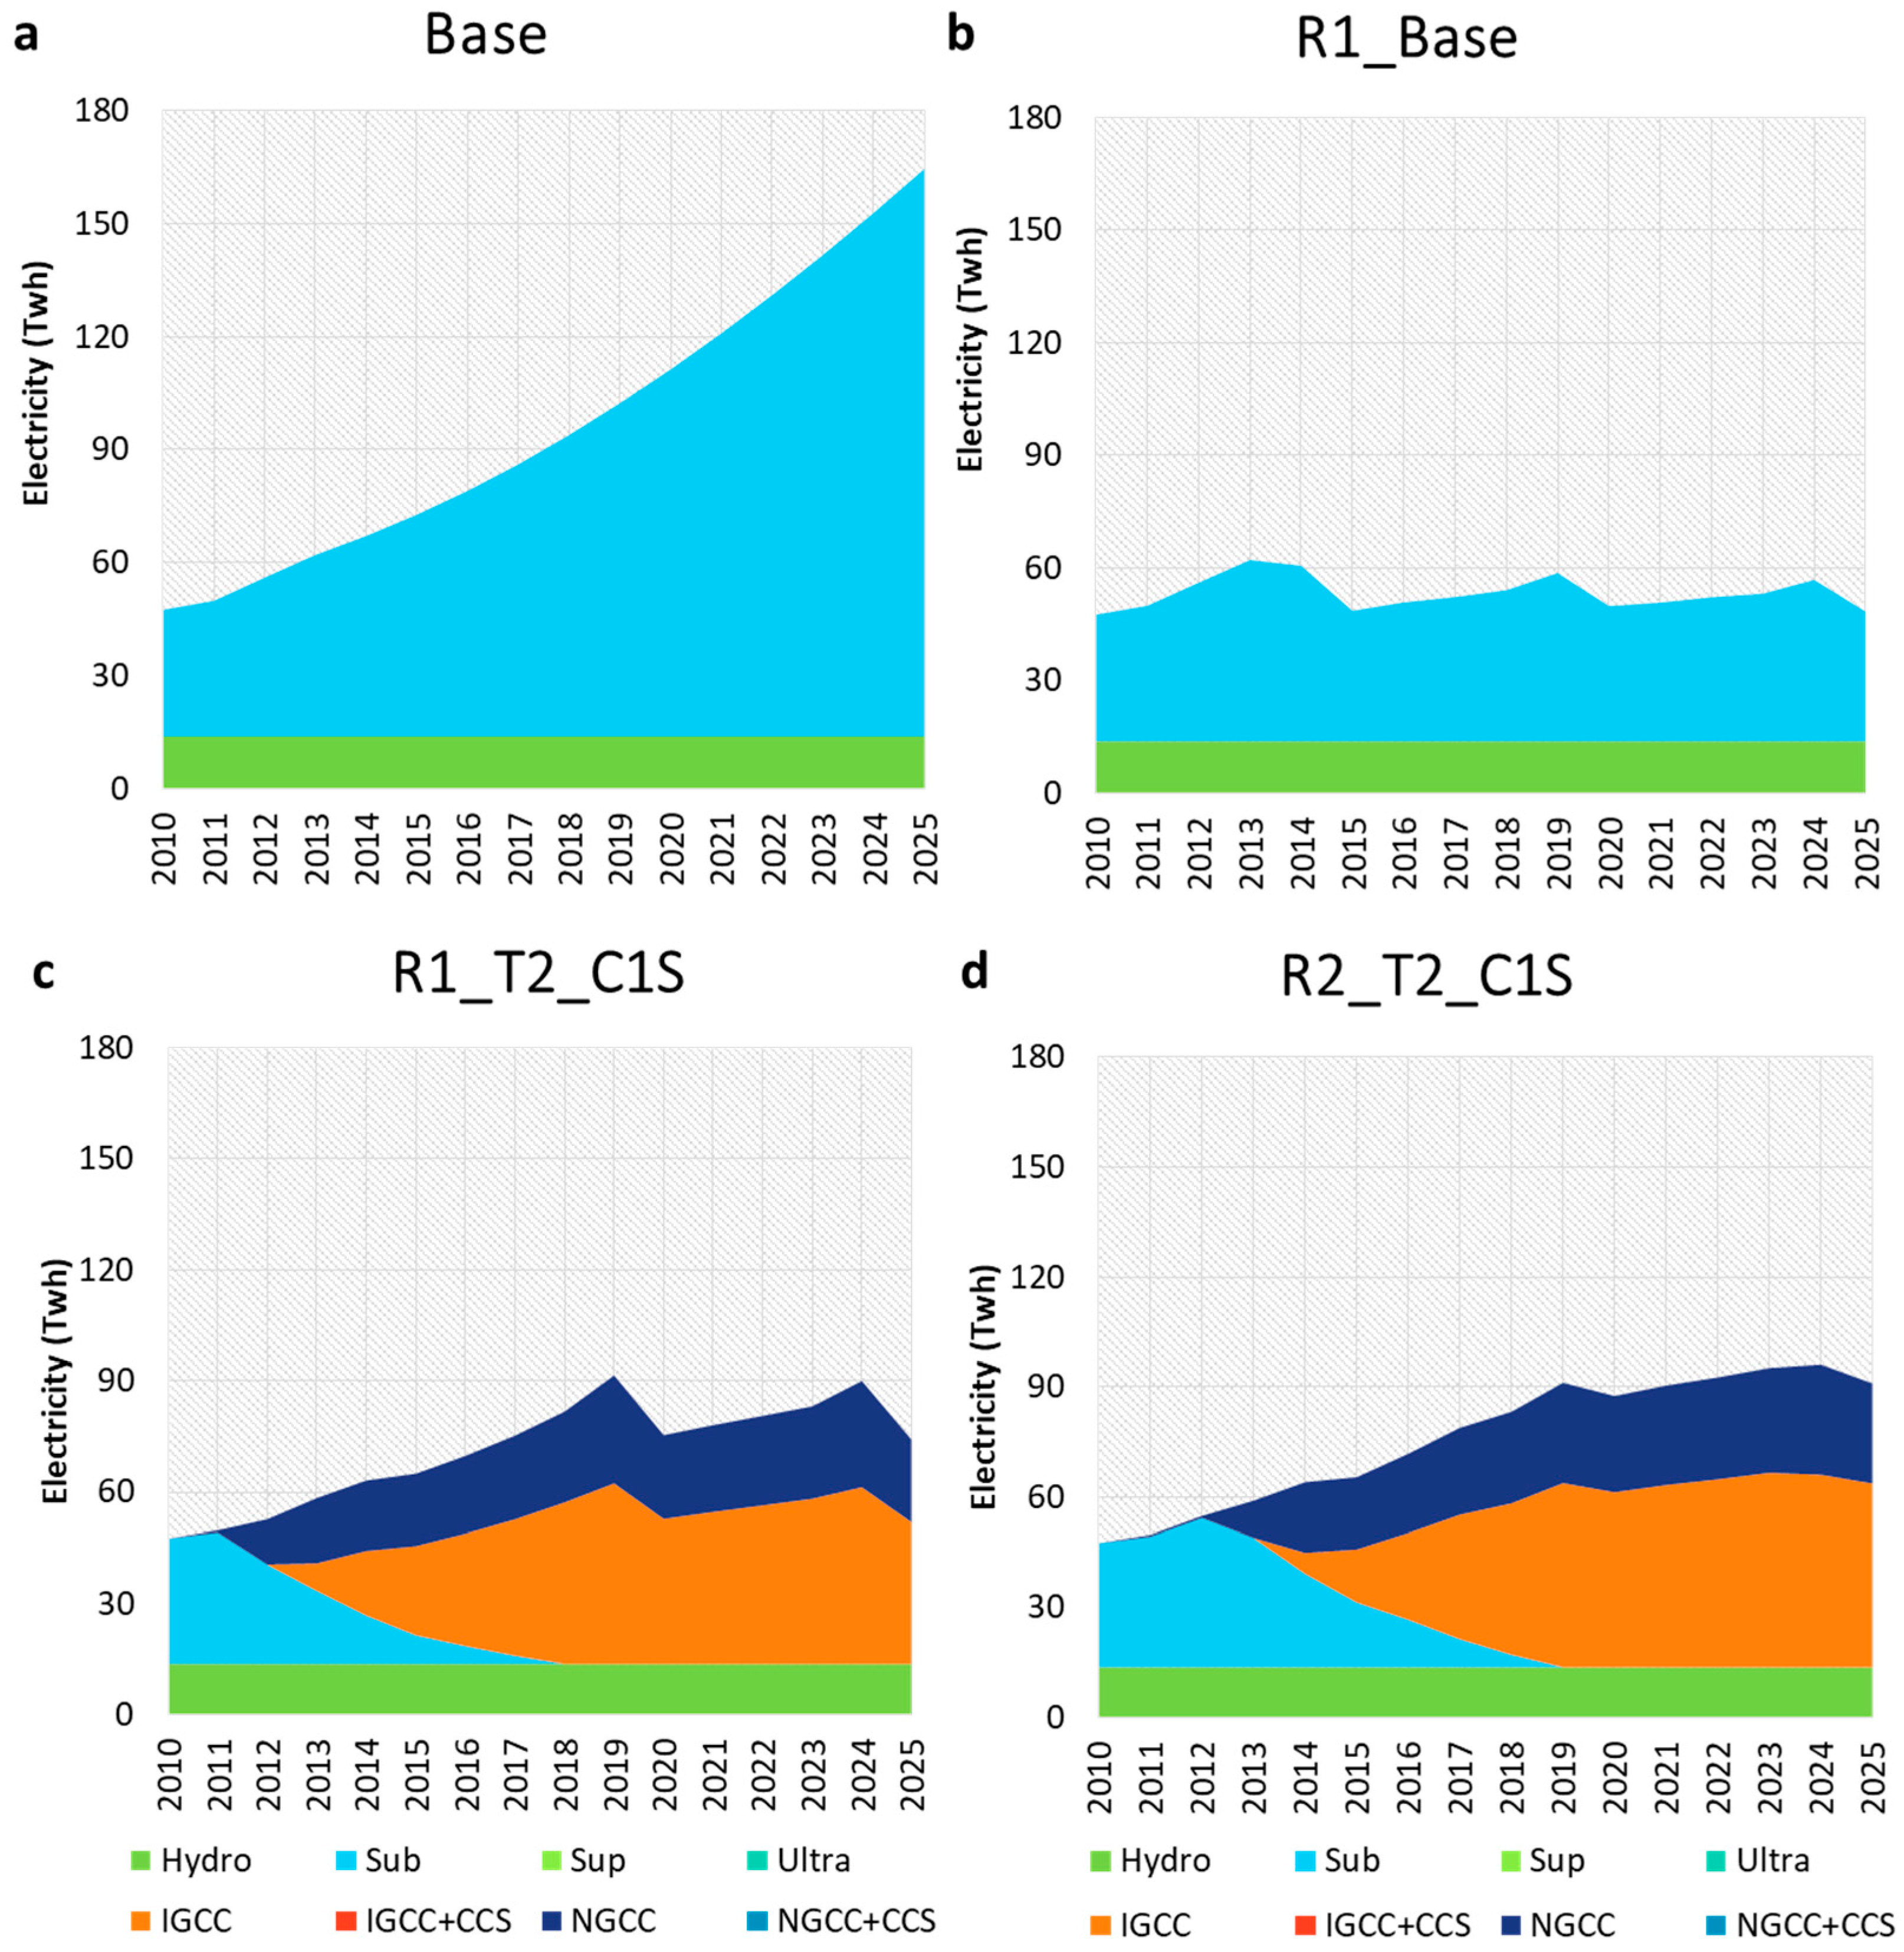
4.3. Impact on Technology Innovation in the Thermal Power Sector

Which and when each form of technology was adopted under different levels of government environmental regulations is shown in Figure 2. In the Baseline scenario, no proposed policy was incorporated and subcritical coal power generation dominated the electric power grid by 151 TWh in 2025 (Figure 2a). The addition of environmental regulations dramatically curbed the energy consumption as well as the coal power generation (Figure 2b–d). The coal power generation was reduced to 34 TWh, 60 TWh and 77 TWh in 2025, respectively. There were peak points shown in 2014, 2019, and 2024, which were the years before the air pollution reduction target year.
The results showed that the introduction of environmental regulations with a carbon tax, and a subsidy associated for technology innovation can help diversify the portfolio of power technology sources. Notably, the proposed regulations could help leapfrog coal-based power technologies from subcritical to IGCC. At the same time, the adoption of NGCC technology can greatly contribute to the mitigation of air pollution and help China diversify its power source structure, rescuing China from an unsustainable “lock in coal power” [54] and help the country move towards multi-resource power. NGCC technology will be popular in the coming years because of its clean energy source: natural gas and shale gas. The predicted popularity of the technology is included in China’s Five Year Development Plan. Therefore, we must promote a gradual adoption of innovation first, followed by stricter regulations (Figure 2c,d). This approach simultaneously induces environmental protection and economic growth. The mechanism would work as follows: in each industry, the policy makers can first introduce a relatively flexible pollution emission target as an incentive for existing industries to modernize their technology, and encourage new industries to adopt the newer alternatives. Then, economic development and an increasing demand for electricity will allow policy makers to introduce stricter regulations.
The simulation result is based on the characteristics of the industry structure of Chongqing from the 2010 I-O table, which is also available for other regions and countries. Therefore, the optimal technology selection method can be validated externally. This type of approach should be applied to other industrial sectors as well. In other words, highly efficient technology innovation and customer consumption behaviors are promoted in the future for all of the economic entities. The results give policy-makers a scientific assessment of the role of different technologies in the energy sector, in cooperation with development of the industry, at a macroeconomic level.

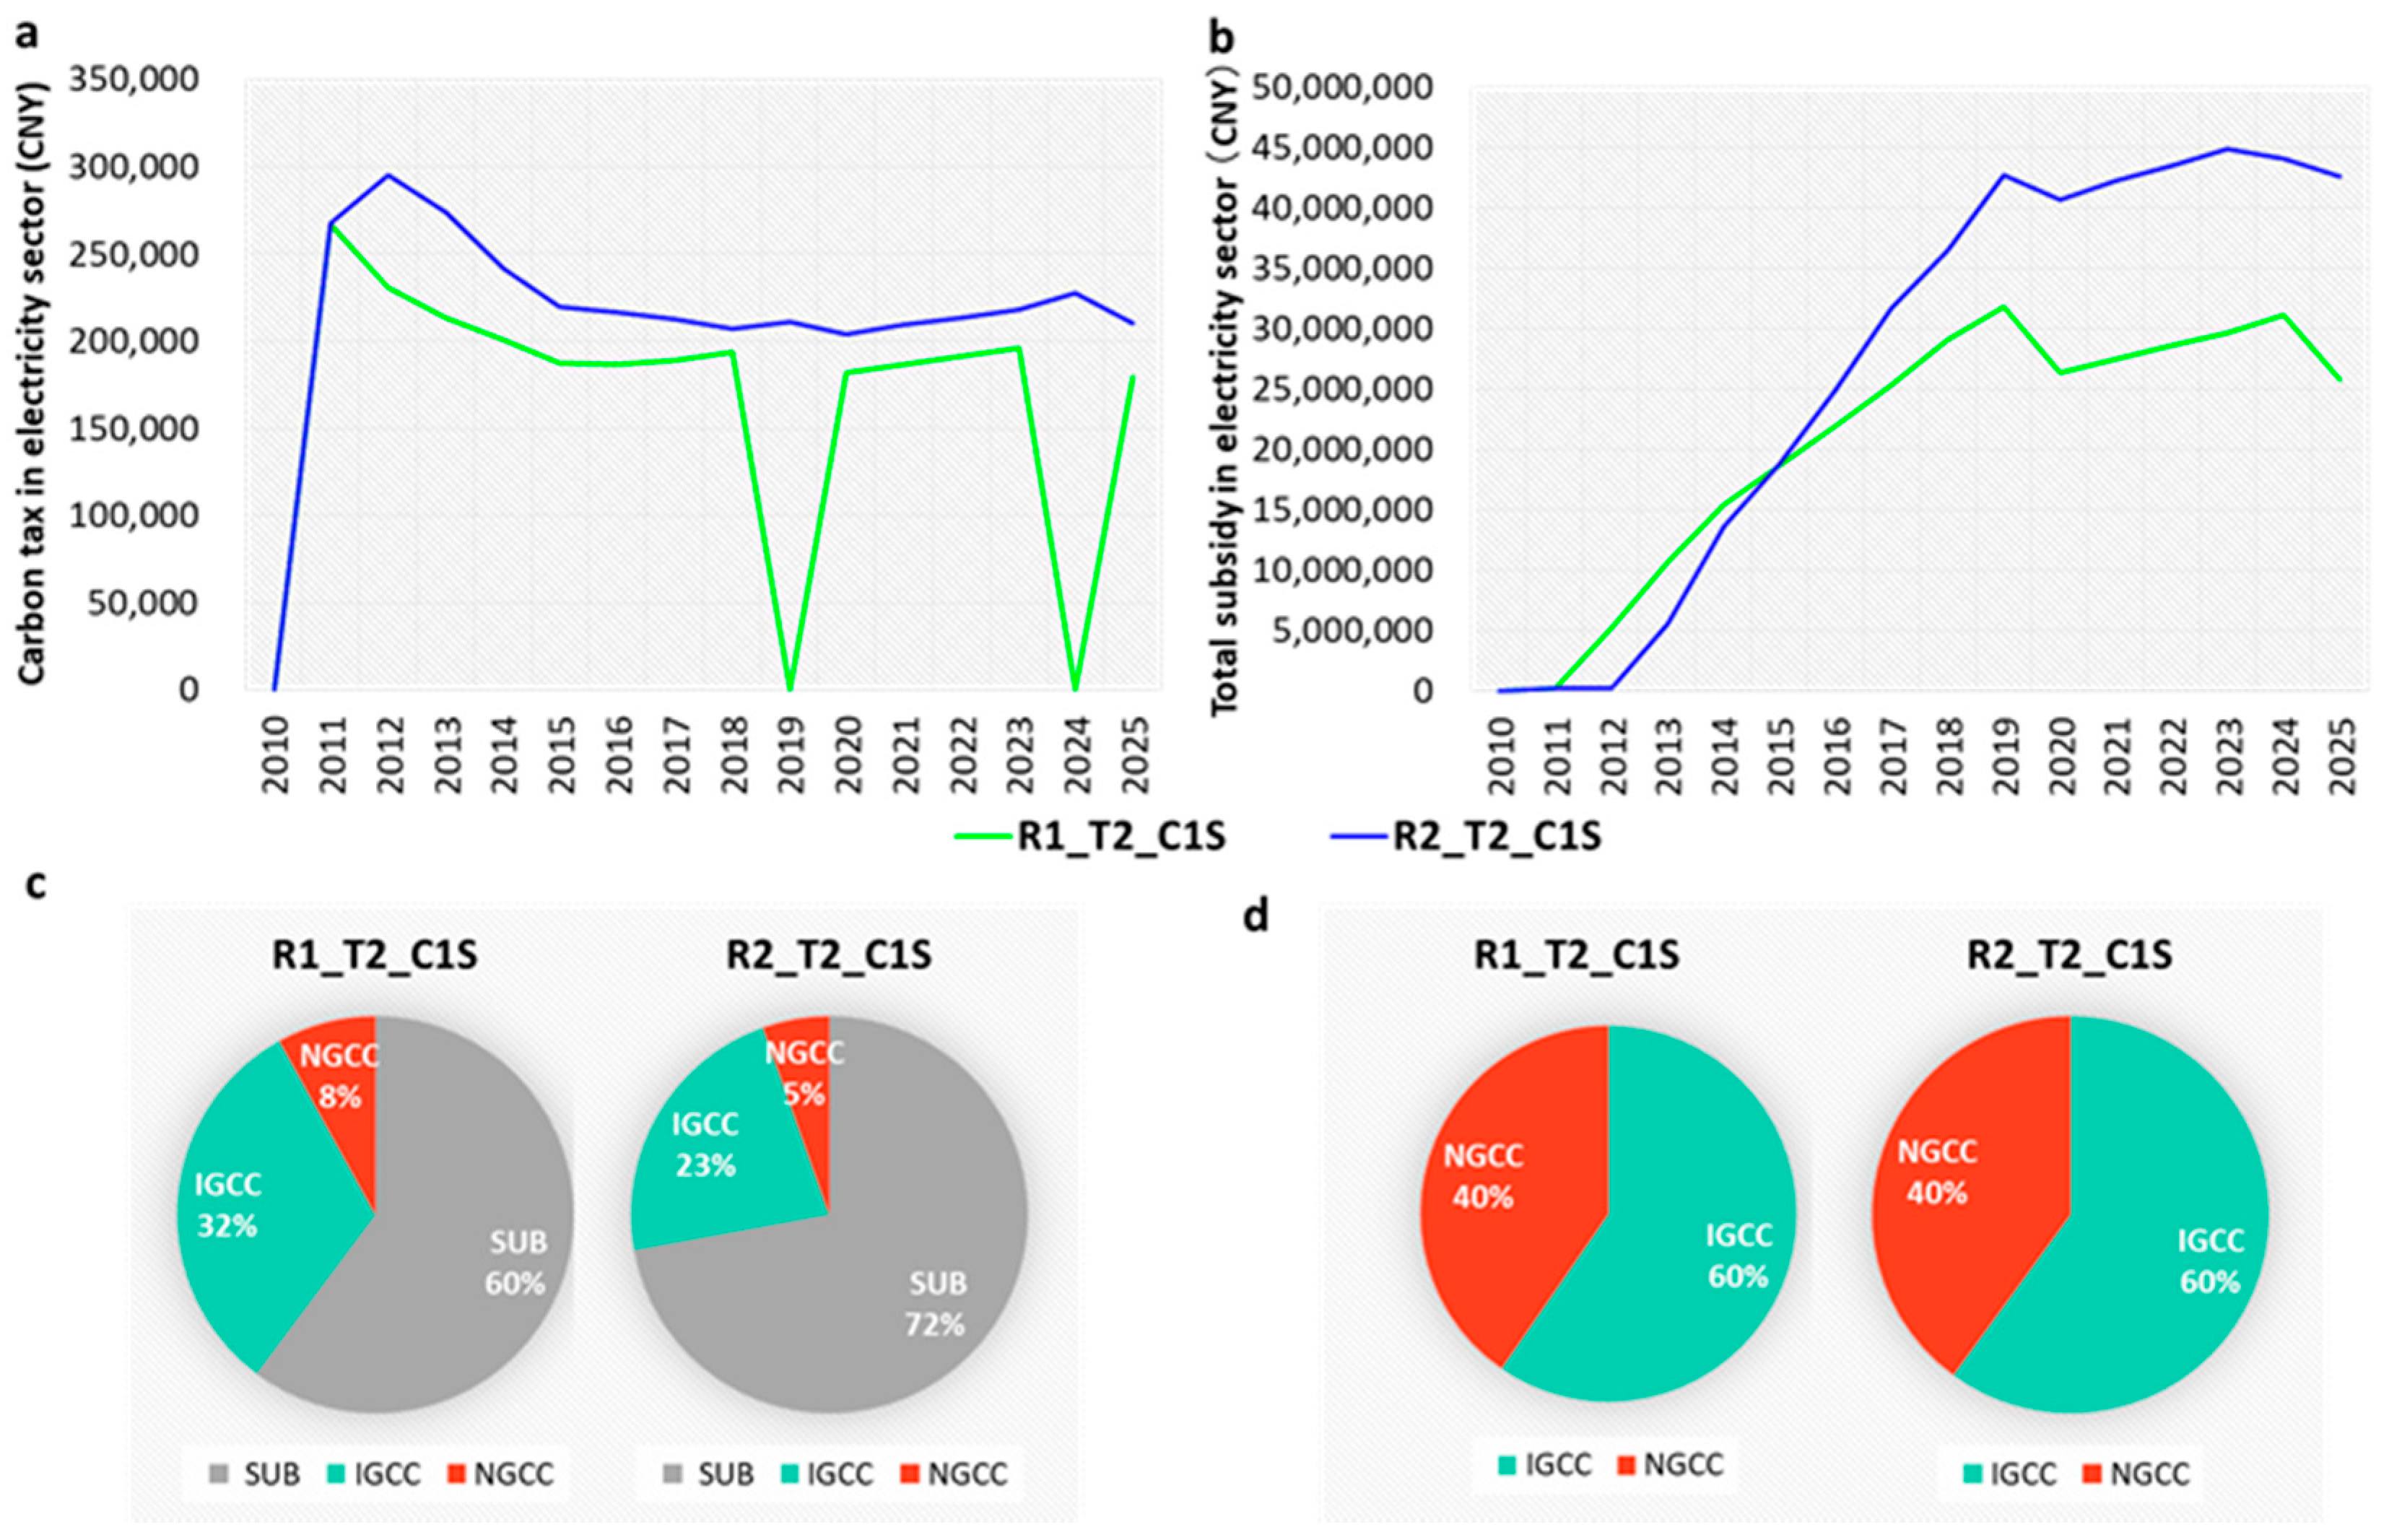
4.4. Optimal Carbon Taxes and Subsidies for Technology Innovation

According to our results, the scenarios which include environmental regulations coupled with technology innovation, a subsidy, and carbon tax schemes seem to be the most viable options in terms of GRP growth and emission reductions (Table 1). In order to identify the detailed contribution to the promotion of technology innovation, we analyzed the policy that included a carbon tax and a subsidy in two technology innovation scenarios. Figure 3a shows the carbon tax revenue in two scenarios, Figure 3b shows the subsidy for technology innovation. The carbon tax (subsidy) was 210,508 (42,600,000) CNY and 179,682 (25,800,000) CNY in R2_T2_C1S and R1_T2_C1S, respectively. There was a huge gap between a carbon tax and a subsidy in the timeframe used. In this study, we assumed that the carbon tax revenue is used to partially subsidize technology innovation in the energy sector. Comparing the total carbon tax revenue with the total subsidy from the government in the two scenarios in Figure 3a,b, it can be observed that carbon tax revenue plays a very small role in the government subsidy support for technology innovation. We assume that the reason for this is due to the fact that the carbon tax is only applied in the electricity sector. If the carbon tax is applied to the entire economy, the resulting revenue would be much greater and would be capable of supporting technology innovation in a few specific sectors. In this regard, carbon tax may incentivize the industry to adopt clean technology for further development and increases in government revenue would be used as a subsidy for more efficient and cleaner technology (Figure 3a,b). Specifically, the carbon tax revenue is determined by the carbon tax price and the amount of GHG emissions. Subcritical technology power supply, abbreviated to SUB (IGCC) took a share of the optimal total carbon tax revenue at 60% (32%) and 72% (23%) in scenarios R1_T2_C1S and R2_T2_C1S, respectively (Figure 3c).
Two extreme points were also observed in the years 2019 and 2024 (Figure 3a). These points represented the response of the carbon tax to the strict environmental regulation target in 2020 and 2025 coupled with the objection of the maximization of the GRP. The detailed explanation is that in order to maximize the GRP, the amount of emissions will be maximized and the subsidy will also be as large as possible before the final target year, especially in the years 2019 and 2024. The carbon tax is negative for the GRP, which is why the carbon tax will become 0 in 2019 and 2024. In other words, a carbon tax will not be implemented in 2019 and 2024. In the model, we assumed that carbon tax is endogenous with an upper boundary of 70 CNY/ton or 110 CNY/ton. Therefore, it could be 0 in order to achieve the target for both the reduction of air pollution and maximizing the GRP.
The IGCC and NGCC were promoted as priorities through strong governmental support and a small part of carbon tax revenue (Figure 2c,d and Figure 3b,d). The subsidy distribution share in IGCC (NGCC) was 60% (40%) in both scenarios. This distribution was decided by the interaction of all the activities of a sector and the trade-off between the economy and the environment. Furthermore, we found that in terms of GHGs, the reduction costs of IGCC (NGCC) were 2800 (1800) and 1600 (1100) CNY/ton based on the calculation of the total investment cost divided by the total reduction amount due to the substitution of SUB by IGCC or NGCC in the research period. The functions of a carbon tax and a subsidy for new technology are different; as a result, subsidies should be financed by the general budget as well as from revenue generated from a carbon tax.

5. Conclusions

In this study, a dynamic integrated top-down I-O model was used to comparatively evaluate the impact of the proposed policies on the thermal sector and within the whole socio-economic system. The introduction of government regulation without strong support for technology innovation could negatively affect economic growth in a significant manner. Carbon tax revenue in the thermal sector was shown to have a limited contribution to the promotion of technology innovation as compared to with a subsidy. The introduction of the proposed integrated policies could positively affect the adoption of electric power technologies, which will be beneficial in terms of reducing GHG emissions and air pollution. It will also help achieve both emission reduction targets and promote healthy economic growth through the potential shift from low efficient and highly pollutant sub critical power generation to the cleaner IGCC and NGCC technologies. The cost of IGCC carbon reduction is higher than that of NGCC, although both of their GHG reduction costs are quite high. The proposed scenarios will decrease China’s dependence on coal and incentivize the adoption of cleaner natural gas. This is a very important finding because it will help the transition from coal use to the use of cleaner sources and peak coal consumption by the year 2020. Our results also suggest that the introduction and adoption of CCS options are still premature because they are relatively expensive technologies. Our study demonstrated that the proposed policies could provide a powerful incentive to achieve emission reduction of CO2 and air pollutants and promote the diversification of the power supply. Since the environmental benefit of innovation in the power sector alone could limit the study, other economic sectors must be included. The policy-makers can first introduce a relatively flexible pollution emission target as an incentive for existing industries to modernize their technology, and encourage new industries to adopt the newer alternatives. Then, economic development and an increasing demand for electricity will allow policy-makers to introduce stricter regulations.

Acknowledgments

This research was supported by the Research Assistant fund from University of Tsukuba.

Author Contributions

Qian Zhou conceived and designed the experiments, collected the data, processed data, did simulation, analyzed the data and wrote the paper; Helmut Yabar and Yoshiro Higano checked the data and provided advice on the manuscript. All four authors read and approved the final manuscript.

Conflicts of Interest

The authors declare no conflict of interest.

Appendix A

Table A1. Classification of industrial sectors in the comprehensive model.
iIndustrySector
1Usual Goods and ServicesAgriculture, Forestry, Animal Husbandry and Fishery
Transport and Postal Services
Waste Treatment
Other Industries
eConventional Energy IndustriesHydropower and Subcritical (SUB) Technology Power Supply
Production and Supply of Gas
2Energy-Intensive IndustriesMining and Washing of Coal
Manufacture of Raw Chemical Materials and Products
Manufacture of Non-Metallic Mineral Products
Smelting and Pressing of Ferrous Metals
3Advanced Technology Options (High-Efficiency, Low-Emission Coal–Natural Gas-Fired Power Generation)Natural Gas Combined Cycle (NGCC)
NGCC and Carbon Capture and Storage (NGCC-CCS)
IGCC-CCS Technology Power Supply
Integrated Coal Gasification Combined Cycle (IGCC)
Ultra-Supercritical (USC) Technology Power Supply
Supercritical (SC) Technology Power Supply
Table A2. Parameters for fossil fuel-based electric power generation technologies [38].
Capital Costs ($2010 per kW)O & M Costs ($2010 per kW)Efficiency (Gross, LHV)
201020202035201020202035201020202035
Steam Coal-SUB60060060021212137%37%37%
Steam Coal-SUP70070070028282842%42%42%
Steam Coal-USC80080080032323246%48%50%
IGCC1100110090050504147%49%51%
IGCC-CCS18001800160081817238%40%44%
NGCC55055055018181857%59%61%
NGCC-CCS10001000100033333349%51%54%
Note: O & M: operation and maintenance; SUB: subcritical; SC: supercritical; USC: ultra-supercritical; IGCC: integrated gasification combined cycle; NGCC: natural gas combined cycle; USC-CCS: ultra-supercritical with CCS; IGCC-CCS: integrated gasification combined cycle with CCS; NGCC-CCS: natural gas combined cycle with CCS; LHV: lower heating value.

References

  1. United Nations Statistics Division. Environmental Indicators: Greenhouse Gas Emissions, 2010. Available online: http://unstats.un.org/unsd/environment/air_co2_emissions.htm (accessed on 15 July 2017).
  2. Environmental Health & Engineering. Emissions of Hazardous Air Pollutants from Coal-Fired Power Plants; EH & E Report 17505; Environmental Health & Engineering: Needham, MA, USA, 2011. [Google Scholar]
  3. Liu, X.; Wen, Z. Best available techniques and pollution control: A case study on China’s thermal power industry. J. Clean. Prod. 2012, 23, 113–121. [Google Scholar] [CrossRef]
  4. US Energy Information Administration. China Analysis Briefs; USEIA: Washington, DC, USA, 2014. Available online: http://www.eia.gov/countries/analysisbriefs/China/china.pdf (accessed on 10 January 2017).
  5. Organization for Economic Co-Operation and Development; International Energy Agency. World Energy Outlook 2012; OECD: Paris, France; IEA: Paris, France, 2012. [Google Scholar]
  6. Organization for Economic Co-operation and Development. OECD Environmental Performance Reviews: China; OECD: Paris, France, 2007. [Google Scholar]
  7. Leggett, J.A. China’s Greenhouse Gas Emissions and Mitigation Policies; Report for Congress; Congressional Research Service: Washington, DC, USA, 2011. [Google Scholar]
  8. Lu, Z.; Zhang, Q.; Streets, D.G. Sulfur dioxide and primary carbonaceous aerosol emissions in China and India, 1996–2010. Atmos. Chem. Phys. 2011, 11, 9839–9864. [Google Scholar] [CrossRef] [Green Version]
  9. Zhao, B.; Wang, S.; Wang, J.; Fu, J.; Liu, T.; Xu, J.; Fu, X.; Hao, J. Impact of national NOx and SO2 control Policies on particulate matter pollution in China. Atmos. Environ. 2013, 77, 453–463. [Google Scholar] [CrossRef]
  10. Khanna, N.; Fridley, D.; Zhou, N.; Ke, J. Implications of Maximizing China’s Technical Potential for Residential End-Use Energy Efficiency: A 2030 Outlook from the Bottom-Up; China Energy Group, Environmental Energy Technologies Division, Lawrence Berkeley National Laboratory: Berkeley, CA, USA, 2013. [Google Scholar]
  11. US Energy Information Administration. International Energy Statistics; USEIA: Washington, DC, USA, 2015. Available online: http://www.eia.gov/cfapps/ipdbproject/IEDIndex3.cfm (accessed on 15 July 2017).
  12. Wang, S.; Hao, J. Air quality management in China: Issues, challenges, and options. J. Environ. Sci. 2012, 24, 2–13. [Google Scholar] [CrossRef]
  13. Popp, D. International innovation and diffusion of air pollution control technologies: The effects of NOX and SO2 regulation in the US, Japan, and Germany. J. Environ. Econ. Manag. 2006, 51, 46–71. [Google Scholar] [CrossRef]
  14. Yabar, H.; Uwasu, M.; Hara, K. Tracking environmental innovations and policy regulations in Japan: Case studies on dioxin emissions and electric home appliances recycling. J. Clean. Prod. 2013, 44, 152–158. [Google Scholar] [CrossRef] [Green Version]
  15. Balash, P.; Nichols, C.; Victor, N. Multi-regional evaluation of the US electricity sector under technology and policy uncertainties: Findings from MARKAL EPA9rUS modeling. Socio-Econ. Plan. Sci. 2013, 47, 89–119. [Google Scholar] [CrossRef]
  16. Mondal, M.A.H.; Mathur, J.; Denich, M. Impacts of CO2 emission constraints on technology selection and energy resources for power generation in Bangladesh. Energy Policy 2011, 39, 2043–2050. [Google Scholar] [CrossRef]
  17. Zhang, S.; Worrel, E.; Crijns-Graus, W.; Wagner, F.; Cofala, J. Co-benefits of energy efficiency improvement and air pollution abatement in the Chinese iron and steel industry. Energy 2014, 78, 333–345. [Google Scholar] [CrossRef]
  18. Cai, W.; Wang, C.; Wang, K.; Zhang, Y.; Chen, J. Scenario analysis on CO2 emissions reduction potential in China’s electricity sector. Energy Policy 2007, 35, 6445–6456. [Google Scholar] [CrossRef]
  19. Zhang, Q.; Tian, W.; Wei, Y.; Chen, Y. External costs from electricity generation of China up to 2030 in energy and abatement scenarios. Energy Policy 2007, 35, 4295–4304. [Google Scholar] [CrossRef]
  20. Yu, F.; Chen, J.; Sun, F.; Zeng, S.; Wang, C. Trend of technology innovation in China’s coal-fired electricity industry under resource and environmental constraints. Energy Policy 2011, 39, 1586–1599. [Google Scholar] [CrossRef]
  21. Tan, Q.; Wen, Z.; Chen, J. Goal and technology path of CO2 mitigation in China’s cement industry: From the perspective of co-benefit. J. Clean. Prod. 2016, 114, 299–313. [Google Scholar] [CrossRef]
  22. Li, X.; Qiao, Y.; Shi, L. The aggregate effect of air pollution regulation on CO2 mitigation in China’s manufacturing industry: An econometric analysis. J. Clean. Prod. 2017, 142, 976–984. [Google Scholar] [CrossRef]
  23. Zheng, J.; Jiang, P.; Qiao, W.; Zhu, Y.; Kennedy, E. Analysis of air pollution reduction and climate change mitigation in the industry sector of Yangtze River Delta in China. J. Clean. Prod. 2016, 114, 314–322. [Google Scholar] [CrossRef]
  24. Liu, Z.; Mao, X.; Tu, J.; Jaccard, M. A comparative assessment of economic-incentive and command-and-control instruments for air pollution and CO2 control in China’s iron and steel sector. J. Environ. Manag. 2014, 144, 135–142. [Google Scholar] [CrossRef] [PubMed]
  25. Zhou, Q.; Yabar, H.; Mizunoya, T.; Higano, Y. Exploring the potential of introducing technology innovation and regulations in the energy sector in China: A regional dynamic evaluation model. J. Clean. Prod. 2016, 112, 1537–1548. [Google Scholar] [CrossRef]
  26. Cansino, J.M.; Cardenete, M.A.; González-Limón, J.M.; Román, R. The economic influence of photovoltaic technology on electricity generation: A CGE (computable general equilibrium) approach for the Andalusian case. Energy 2014, 73, 70–79. [Google Scholar] [CrossRef]
  27. Nielsen, C.P.; Ho, M.S. Clearer Skies over China: Reconciling Air Pollution, Climate, and Economic Goals; MIT Press: Cambridge, MA, USA, 2013. [Google Scholar]
  28. Jiang, P.; Chen, Y.; Geng, Y.; Dong, W.; Xue, B.; Xu, B.; Li, W. Analysis of the co-benefits of climate change mitigation and air pollution reduction in China. J. Clean. Prod. 2013, 58, 130–137. [Google Scholar] [CrossRef]
  29. Nam, K.M.; Waugh, C.J.; Paltsev, S.; Reilly, J.M.; Karplus, V.J. Synergy between pollution and carbon emissions control: Comparing China and the United States. Energy Econ. 2014, 46, 186–201. [Google Scholar] [CrossRef]
  30. China Council for International Cooperation on Environment and Development. Sustainable Use of Coal and Pollution Control Policy in China; CCICED Policy Research Report; China Council for International Cooperation on Environment and Development: Beijing, China, 2009. [Google Scholar]
  31. Arrow, K.J.; Cline, W.R.; Maler, K.G.; Munasinghe, M.; Squitieri, R.; Stiglitz, J.E. Intertemporal Equity, Discounting, and Economic Efficiency. In Climate Change 1995: Economic and Social Dimensions—Contribution of Working Group III to the Second Assessment Report of the Intergovernmental Panel on Climate Change; Bruce, J.P., Lee, H., Haites, E.F., Eds.; Cambridge University Press: Cambridge, MA, USA, 1996; pp. 125–144. [Google Scholar]
  32. Nordhaus, W.D. A Review of the Stern Review on the Economics of Climate Change. J. Econ. Lit. 2007, 45, 686–702. [Google Scholar] [CrossRef]
  33. Cline, W.R. The Economics of Global Warming; Institute for International Economics: Washington, DC, USA, 1992. [Google Scholar]
  34. Bureau of Statistics of Chongqing. Chongqing Statistical Yearbook; Bureau of Statistics of Chongqing: Chongqing, Chana; Chinese Statistical Publishing House: Beijing, China, 2011.
  35. Intergovernmental Panel on Climate Change (IPCC). 2006 IPCC Guidelines for National Greenhouse Gas Inventories; Institute for Global Environmental Strategies: Hayama, Japan, 2006. [Google Scholar]
  36. Liu, F.; Klimont, Z.; Zhang, Q.; Cofala, J.; Zhao, L.; Huo, H.; Nguyen, B.; Schöpp, W.; Sander, R.; Zheng, B.; et al. Integrating mitigation of air pollutants and greenhouse gases in Chinese cities: Development of GAINS-City model for Beijing. J. Clean. Prod. 2013, 58, 25–33. [Google Scholar] [CrossRef]
  37. Platts. UDI World Electric Power Plants Data Base, 2012. Available online: http://www.powerdat.platts.com/IM.Platts.Content/downloads/udi/wepp/weppreg.pdf (accessed on 27 September 2017).
  38. IEA. World Energy Outlook; International Energy Agency: Paris, France, 2011; Available online: http://www.worldenergyoutlook.org/media/weowebsite/energymodel/WEO_2011_PG_Assumptions_450_Scenario.xls (accessed on 15 July 2017).
  39. International Energy Agency. Technology Roadmap: High-Efficiency, Low-Emissions Coal-Fired Power Generation; International Energy Agency: Paris, France, 2012. [Google Scholar]
  40. Higano, Y.; Mizunoya, T.; Kobayashi, S.; Taguchi, K.; Sakurai, K. A study on synthetic regional environmental policies for utilising biomass resources. Int. J. Environ. Technol. Manag. 2009, 11, 102–117. [Google Scholar] [CrossRef]
  41. Li, Y.; Zou, S.; Xu, F.; Yabar, H.; Higano, Y. The impact of introducing recycling taxes on China’s environmental policy: Case study on E-waste recycling. J. Sustain. Dev. 2012, 5, 83–98. [Google Scholar] [CrossRef]
  42. Lu, K.; Nozaki, N.; Mizunoya, T.; Yabar, H.; Higano, Y. Analysis of the Environmental and Socio-economic Benefits of Introducing Cleaner Vehicles in China: Policy Implications. J. Sustain. Dev. 2015, 8, 297–309. [Google Scholar] [CrossRef]
  43. Shen, Z.; Mizunoya, T.; Higano, Y. Agriculture and sustainable development: Policies analysis of the Taihu Economic Circle in China. Int. J. Foresight Innov. Policy 2012, 8, 210–235. [Google Scholar] [CrossRef]
  44. Song, J.; Yang, W.; Higano, Y.; Wang, X. Introducing renewable energy and industrial restructuring to reduce GHG emission: Application of a dynamic simulation model. Energy Convers. Manag. 2015, 96, 625–636. [Google Scholar] [CrossRef]
  45. Wang, S.; Xu, F.; Xiang, N.; Mizunoya, T.; Yabar, H.; Higano, Y.; Zhang, R. A simulation analysis of the introduction of an environmental tax to develop biomass power technology in China. J. Sustain. Dev. 2012, 6, 19–31. [Google Scholar] [CrossRef]
  46. Xiang, N.; Xu, F.; Sha, J. Simulation analysis of China’s energy and industrial structure adjustment potential to achieve a low-carbon economy by 2020. Sustainability 2013, 5, 5081–5099. [Google Scholar] [CrossRef]
  47. Xu, F.; Xiang, N.; Yan, J.; Chen, L.; Nijkamp, P.; Higano, Y. Dynamic simulation of China’s carbon emission reduction potential by 2020. Lett. Spat. Resour. Sci. 2015, 8, 15–27. [Google Scholar] [CrossRef]
  48. Yang, W.; Song, J.; Higano, Y.; Tang, J. An Integrated Simulation Model for Dynamically Exploring the Optimal Solution to Mitigating Water Scarcity and Pollution. Sustainability 2015, 7, 1774–1797. [Google Scholar] [CrossRef]
  49. Zhang, G.F.; Sha, J.H.; Wang, T.Y.; Yan, J.J.; Higano, Y. Comprehensive Evaluation of Socio-Economic and Environmental Impacts Using Membrane Bioreactors for Sewage Treatment in Beijing. J. Pure Appl. Microbiol. 2013, 7, 553–564. [Google Scholar]
  50. Zou, Y.; Wang, S.; Mizunoya, T.; Yabar, H.; Higano, Y. Research on environmental tax with emphasis on developing renewable energy in Beijing, China. J. Sustain. Dev. 2014, 7, 78–88. [Google Scholar] [CrossRef]
  51. Jotzo, F.; De Boer, D.; Kater, H. China Carbon Pricing Survey 2013; No. 1305; Centre for Climate, Economics & Policy, Crawford School of Public Policy, The Australian National University: Canberra, Australia, 2013. [Google Scholar]
  52. Zhou, Q.; Yabar, H.; Mizunoya, T.; Higano, Y.; Yang, W. Comprehensive Analysis of the Environmental Benefits of Introducing Technology Innovation in the Energy Sector: Case Study in Chongqing City, China. J. Sustain. Dev. 2013, 6, 71–83. [Google Scholar] [CrossRef]
  53. CCOALNEWS. Experts Predict Coal Consumption Peak: In 2020, 4.7 Billion Tons. 2014. Available online: http://www.ccoalnews.com/101773/101786/238350.html (accessed on 13 July 2015). (In Chinese).
  54. Morioka, T.; Saito, O.; Yabar, H. The pathway to a sustainable industrial society—Initiative of the Research Institute for Sustainability Science (RISS) at Osaka University. Sustain. Sci. 2006, 1, 65–82. [Google Scholar] [CrossRef]
Figure 1. Energy consumption changes in four selected scenarios. (a) Total energy consumption by the unified seven fuel sources in the study area; (b) Coal consumption trends in four scenarios and total energy consumption in coal share from 2010 to 2025. TCE: tons of coal equivalents.
Sustainability 09 01741 g001
Figure 2. Technologies adoption and their production in four scenarios. (a) Baseline scenario without proposed policy; (b) 10% government air pollutant emission reduction target included scenario; (c) 10% government air pollutant emission reduction target, 10% technology cost reduction, 70 CNY/ton tax and subsidy included scenario; (d) 5% government air pollutant emission reduction target, 10% technology cost reduction, 70 CNY/ton tax and subsidy included scenario.
Sustainability 09 01741 g002
Figure 3. Optimal carbon tax and subsidy. (a) optimal carbon tax in the electricity sector for two regulation-incorporated scenarios; (b) subsidy for high efficient electricity; (c) share of total carbon tax revenue levied on the thermoelectric sectors from 2010 to 2025; (d) total subsidy distribution share. IGCC: integrated coal gasification combined cycle; NGCC: natural gas combined cycle; SUB: subcritical technology power supply.
Sustainability 09 01741 g003
Table 1. Proposed policy and assumption in each scenario.
ScenariosGovernment RegulationTechnology InnovationCarbon Tax and Subsidy
BaseNoNono
R1_BaseYesNono
R1_T1_C1SYes (10%)Yes70 CNY/ton tax
R1_T1_C2SYes (10%)Yes110 CNY/ton tax
R1_T2_C1SYes (10%)Cost reduction of 10% 70 CNY/ton tax
R1_T2_C2SYes (10%)Cost reduction of 10%110 CNY/ton tax
R2_T2_C1SYes (5%)Cost reduction of 10%70 CNY/ton tax
R2_T2_C2SYes (5%)Cost reduction of 10%110 CNY/ton tax
R0_T1_C1SNoYes70 CNY/ton tax
R0_T1_C2SNoYes110 CNY/ton tax
R0_T2_C1SNoCost reduction of 10%70 CNY/ton tax
R0_T2_C2SNoCost 10% reduction110 CNY/ton tax
Note: R denotes regulation; T represents technology, and CS is carbon tax and subsidy. Base: baseline situation without any proposed policy; R0: no government regulation; R1: government regulation with 10% reduction of SOx and NOx for each five-year period; R2: government regulation with 5% reduction of SOx and NOx for each five-year period; T1: technology innovation; T2: technology innovation association with 10% technology cost reduction; C1S: maximum carbon tax rate 70 CNY/ton and subsidy; and C2S: maximum carbon tax rate 110 CNY/ton and subsidy.
Table 2. Total economic and environmental change compared with the baseline during the research period (2010–2025).
GRPGHGSO2NOxPM10PM2.5
Group 0R1_Base−42.50%−32.86%−35.84%−41.29%−33.44%−34.97%
Group 1R0_T1_C1S0.26%0.10%0.28%−0.40%0.42%0.25%
R0_T1_C2S0.37%0.13%0.30%−0.36%0.46%0.28%
R0_T2_C1S0.26%0.10%0.28%−0.40%0.42%0.25%
R0_T2_C2S0.37%0.13%0.30%−0.36%0.46%0.28%
Group 2R1_T1_C1S−22.64%−30.76%−37.88%−41.13%−30.68%−34.74%
R1_T1_C2S−22.54%−30.76%−37.88%−41.14%−30.66%−34.73%
R1_T2_C1S−22.56%−30.74%−37.87%−41.12%−30.66%−34.73%
R1_T2_C2S−22.61%−30.77%−37.89%−41.15%−30.68%−34.75%
Group 3R2_T2_C1S−15.79%−26.62%−33.64%−36.42%−26.17%−30.41%
R2_T2_C2S−15.83%−26.61%−33.63%−36.42%−26.15%−30.40%
Note: Group 0 is the baseline associated with strict environmental regulation. Group 1–3 is varied by regulation. R0: no government regulation; R1: 10% reduction of SOx and NOx in each five-year period; R2: government regulation 5% reduction of SOx and NOx in each five-year period; T1: technology innovation; T2: technology innovation association with 10% technology cost reduction; C1S: maximum carbon tax rate 70 CNY/ton and subsidy; and C2S: maximum carbon tax rate 110 CNY/ton and subsidy.

