Article

Built Environment, Travel Attitudes and Travel Behaviour: Quasi-Longitudinal Analysis of Links in the Case of Greeks Relocating from US to Greece †

by
Dimitris Milakis
1,*,
Dimitrios Efthymiou
2 and
Constantinos Antoniou
2
1
Department of Transport and Planning, Faculty of Civil Engineering and Geosciences, Delft University of Technology, 2628 CN Delft, The Netherlands
2
Chair of Transportation Systems Engineering, Faculty of Civil, Geo and Environmental Engineering, Technical University of Munich, D-80333 Munich, Germany
*
Author to whom correspondence should be addressed.
An earlier version of this paper was presented at the Transportation Research Board 2015 Annual Meeting.
Sustainability 2017, 9(10), 1774; https://doi.org/10.3390/su9101774
Submission received: 19 July 2017 / Revised: 4 September 2017 / Accepted: 24 September 2017 / Published: 30 September 2017
(This article belongs to the Section Sustainable Urban and Rural Development)

Abstract

:
In this study, the possible causal links between the built environment, travel attitudes and travel behaviour of people that have moved between totally different urban and transportation contexts were investigated. A quasi-longitudinal design was developed to collect data about the perceived neighbourhood characteristics, neighbourhood preferences, travel attitudes and changes in car, walking and bicycle usage of 51 Greeks who relocated from the US to Greece. Variable reduction techniques were applied prior to developing our models because of the small sample size. The results of this study offer support for a causal relationship between the built environment and travel behaviour identified in the existing literature. For instance, longer travel time to city center was associated with higher car use, higher density neighbourhoods and increased accessibility to local amenities were associated with increased bike use and better access to a district shopping center was associated with more walking after relocation. Our results also showed that in contexts like Greece, where transport infrastructures are not adequately developed, lack of safe bike conditions and easy access to public transportation are important determinants of bicycle use and walking. Thus, according to our results, promoting sustainable mobility in contexts like Greece would require not only enhancing accessibility through relocation of activities, but also by improving infrastructures for public transport, bicycle and walking.

1. Introduction

Reducing road transport externalities such as greenhouse gases emissions, air pollution at local and regional level, energy consumption and creating social inclusive, healthy cities remain at the center of the debate for more sustainable urban futures [1]. Planning for compact, transit-oriented, bicycle and pedestrian-friendly urban forms is considered as an effective way to shorten travel distances and increase use of alternative modes of transport [2]. However, although numerous studies have shown that urban form characteristics can affect travel behaviour (see [3] for a detailed review of these studies), self-selection, namely the causality in this relationship remains unresolved [4,5,6]. Hence, the effectiveness of the respective planning policies in promoting sustainable mobility could be lower than expected, albeit arguments that attitude induced self-selection cannot influence neither the causal mechanism, nor empirical estimates of the built environment and travel behaviour relationship exist as well (see [7] and the subsequent very interesting discussion: [8,9]).
Thus far, several approaches have been applied to address self-selection with mixed results. According to Cao et al. [5] longitudinal or quasi-longitudinal designs can improve causality inferences, controlling for attitudes and any other variables that do not change over time. However, quasi-longitudinal studies have restricted their focus on residential relocation within the same region (see e.g., [10,11,12]). Hence, the extent of movers’ exposure to different built environments is possibly quite limited and consequently the ‘treatment’ dose may be quite low. This in turn may lead to an underestimation of the built environment effects on travel behaviour in comparison to self-selection effects.
The objective of this research is to investigate the possible causal relationships between the built environment, travel behaviour and travel attitudes of people that have moved between totally different urban and transportation contexts. To this end, a questionnaire survey was conducted among people who had relocated from the US to Greece within the last eight years before the survey, having also lived for more than a year in the US. The results of the survey were analyzed through a combination of non-parametric tests, factor analysis and linear regression modeling. The rest of the paper is structured as follows: the literature review is presented after the introduction (Section 2), and a description of data collection and modeling methodologies follows (Section 3). Finally, results of the analysis (Section 4) and conclusions (Section 5) are subsequently presented.

2. Literature Review

Several approaches have been used to address the attitude-induced self-selection bias in the relationship between the built environment and travel behaviour [4,5]. Here, we focus on longitudinal research designs. Longitudinal designs that control for attitudes have been suggested as a powerful approach to explore causal relationships between the built environment and travel behaviour for two main reasons: first, they account for the confounding influence of self-selection and second they fulfill the time-precedence criterion for causal inference.
In the US context, Krizek [10] focused on households who relocated within Central Puget Sound region. He explored the effects of neighbourhood accessibility changes on travel behaviour after controlling for socio-demographic characteristics, regional accessibility and workplace accessibility. Approximately 20% of the households in his sample relocated close to their initial location (less than 2.5 miles). He employed linear regression models and found that households moving to neighbourhoods with higher accessibility tend to reduce vehicle use in terms of vehicle-kilometers traveled (VKT). Handy et al. [11,13] focused on recent movers in eight neighbourhoods in Northern California. The selected neighbourhoods varied systematically according to the neighbourhood type, size of the metropolitan area and region of state. Both studies employed a quasi-longitudinal design, asking the movers to respond about potential changes in driving, walking and cycling behaviour and about their perceived characteristics of their current and previous neighbourhood. Results from ordered probit models showed that change in accessibility was the most influential factor for driving and walking after controlling for attitudes and socio-demographic characteristics. Built environment variables were also significant in the model for cycling, but the pro-bike/walk attitudinal factor was the most influential factor in this model. Moreover, Cao et al. [14] using the same dataset showed that built environment characteristics like perceived outdoor spaciousness (e.g., large yards and off-street parking) influence auto-ownership after accounting for attitudes.
In the European context, Aditjandra et al. [12] employed a quasi-longitudinal research design, similar to Handy et al. [10], to examine the relationships between the built environment, neighbourhood preferences, travel attitudes and travel behaviour in the UK. Their sample comprised 219 movers who had relocated to ten neighbourhoods at Tyne and Wear metropolitan area in the North East of England within eight years before the survey. Their structural equation model (SEM) showed that neighbourhood characteristics (safety factors and shopping accessibility) do affect driving behaviour after controlling for self-selection. They also concluded that the size of the neighbourhood characteristics effect on driving behaviour is consistent with the respective effect identified by Cao et al. [14] in the US context. Schneiner and Holz-Rau [15] focused their research on 791 movers who had relocated to ten study areas in the Cologne region within 14 years before the survey. The study areas represented five neighbourhood types ranging from central high-density to typical suburban neighbourhoods. The change of built environment type (from suburban to urban/inner city and vice versa) was captured by an ordinal variable. The SEMs showed that built environment changes were associated with significant changes in travel mode use. Specifically a residential move to a more suburban environment was found to induce more car trips and less public transport use, bicycle use and walking. Klinger and Lanzendorf [16] explored the impacts of urban form (i.e., neighbourhood type and activity spaces), residential preferences and the perception of urban mobility cultures (reflecting transport supply, travel-related attitudes and urban-level transport policy) on changes in car, rail transit and bicycle use of 1450 long-distance movers who had relocated up to five year before the study between the regions of Bremen, Hamburg and the Ruhr area. Their multiple regression analyses showed that local spatial characteristics along with socio-demographics have significant impacts on levels of car use, while metropolitan-scale features expressed by the urban mobility cultures factor mainly influenced levels of cycling. Preferences towards residential choice were found to be associated more with changes in car and rail transit use and much less with changes in cycling. Meurs and Haaijer [17] explored whether changes in spatial and personal characteristics for movers in the Netherlands were associated with travel behaviour changes in terms of number of car, bicycle, walking, public transport and total trips. They used data for 189 movers from the Dutch Time Use Study at two time points: 1990 and 1999. The regression analyses results showed that spatial characteristics do influence travel behaviour (e.g., moving to a pedestrian-priority neighbourhood was associated with less car trips). Changes in employment or car ownership were found to have major impacts on the number of car trips as well.
In the Australian context, Giles-Corti et al. [18] surveyed 1420 persons before and after relocation (12 months later) to their newly built homes in the city of Perth, Australia. They explored the impacts of objective and perceived neighbourhood characteristics, on changes of both transport and recreational-related walking controlling for intrapersonal (e.g., attitudes towards trying to walk locally), interpersonal (e.g., frequency of social support from family and friends) and reasons for residential location choice (e.g., ease of cycling, walking). These researchers run generalised linear mixed models and found that increased access and diversity of local transport (e.g., post offices, bus stops, delicatessens and supermarkets) and recreational (e.g., beaches, parks, sports fields) destinations had a positive impact on walking levels. This study found no evidence of impacts on walking levels from self-section towards residential choice.
Finally, several studies employed panel data to explore relationships between built environment and travel behaviour, controlling for self-selection. Kamruzzaman et al. [19] measured changes of socio-demographics, urban form, travel attitudes, living preferences and transport-related walking time of 3708 individuals in Brisbane Australia between 2009 and 2011. According to the results of their linear regression model, changes in urban form (increased density, better street connectivity and access to train) were associated with increased walking levels. Travel attitudes and perceptions (e.g., increased perception of car safety), but not living preferences, were also found to exert significant influence on walking behaviour. Van de Coevering et al. [20] developed a cross-lagged panel structural equation model based on a two-wave longitudinal dataset (2005 and 2012) involving 1322 respondents from three municipalities in the Netherlands (Amersfoort, Veenendaal and Zeewolde) to explore relationships between the built environment, travel-related attitudes and travel behaviour. They found that only one of the accessibility metrics employed in this study (i.e., distance to railway stations) exerted strong and significant negative influence on car use. No evidence of attitude-induced residential self-selection in residential location choices was identified. Yet, built environment appeared to influence travel-related attitudes. Moreover, these researchers concluded that built environment differences in the sample should be quite large before travel behaviour effects can be detected.
Our literature review showed that most frequently, longitudinal designs are applied in the context of residential moves, where travel and built environment data are collected before and after the move. Attitudinal data are typically cross sectional (measured after the move) assuming stability of residential and travel preferences over time. Thus far, most longitudinal studies have focused on residential relocation within the same region limiting the extent of movers’ exposure to different built environments. Consequently the ‘treatment’ dose that the movers receive may be quite low, thus limiting the size of ‘treatment’ effects. Built environment was consistently found to influence changes in travel behaviour across all studies in different continents after accounting for attitude-induced self-selection. In some studies, travel related self-selection towards residential choice was not identified as significant variable for travel behaviour changes.

3. Case Study Setup and Methodology

3.1. Data Collection

In order to collect the -required for the analysis- data, an electronic questionnaire was designed in Google Forms and disseminated on-line. The questionnaire was structured based on the works of Handy et al. [11] and Aditjandra et al. [12], but was adapted to the needs of this research. The purpose of developing a questionnaire based on the one used in Handy et al. [11] and Aditjandra et al. [12] was dual. Using a successful, already applied questionnaire reduces the risks of question misformulation, which leads respondents to misunderstanding and contaminate the data, but also allows for comparison of the results with other studies.
Handy et al. [11] employed a quasi-longitudinal design, to ask people that had relocated in eight neighbourhoods in Northern California within the previous year of the survey to rate a set of twenty-seven variables about characteristics of their current and previous neighbourhoods (i.e., accessibility, physical activity options, safety, socializing, outdoor spaciousness and attractiveness). Moreover, they asked them to rate statements that describe their travel attitudes, and preferences for neighbourhood characteristics. Both factors were assumed to remain constant before and after relocation. Changes in travel behaviour were captured employing a 5-point scale (from ‘a lot less now’ to ‘a lot more now’). Similarly, Aditjandra et al. [12] asked people that had relocated in ten neighbourhoods in North East of England within eight years before the survey to rate how true twenty-seven statements about their neighbourhood are, and how important they perceive twenty-eight statements about their travel attitudes.
Our questionnaire survey is structured in four parts. The first part comprised 7–point ordinal items about changes in car use, bicycle use and walking before and after the move between the US and Greece (from ‘a lot less now’ to ‘a lot more now’) and additional items about travel mode availability (both in the US and Greece) and relocation year. Only people who had relocated to Greece within eight years before the survey were invited to fill in the questionnaire. In the second part of the questionnaire, we asked people to rate on a seven-point scale how true (from 1: not at all true to 7: entirely true) 24 statements are about accessibility and neighbourhood characteristics in their US and Greek neighbourhoods. We also asked them how significant each of those characteristics is with respect to the choice of their current residence. These items were grouped into the following six categories: (1) car accessibility, (2) accessibility of alternative means of transport, (3) accessibility of shops/facilities, (4) safety, (5) neighbourhood physical characteristics, and (6) socializing. In the third part (twenty items) the respondents were asked to respond on a 7-point Likert scale (from 1: strongly disagree to 7: strongly agree) about their travel attitudes (e.g., I like driving, I prefer to take public transport than drive whenever possible). The last part included nine items about socio-demographic characteristics of the respondents before and after relocation. Due to the large number of questions in our survey, we decided to use some of them in reverse order. According to Weijeters and Baumgartner [21] reverse order questions help to correct the acquiescence and agreement biases, but also disrupt non-substantive response behaviour.
The questionnaire was disseminated through various channels, such as e-mail lists and social media of Greek universities, Greek alumni clubs of US universities, Greek professional organizations and popular websites covering transportation news. The questionnaire was completed by 51 respondents. Table 1 shows the summary statistics of the respondents. A comparison with the target population (Greeks who lived in the US and returned back to Greece) is virtually impossible, due to the difficulty in gathering socio-demographic information about it, while a comparison with the real population of Greece would be misleading. However, Table 1 shows that the majority of the respondents are between 36 and 45 years old, slightly more males, slightly more singles, highly educated, primarily of income higher than 25,000 euros per year and employed full-time. The respondents did not receive any incentives or rewards for their participation in this study and completing the survey.

3.2. Methodology

Our methodology consisted of three sequential steps. First, we explored the differences between US and Greek accessibility and built environment contexts, aiming to verify that the ‘treatment’ that the respondents received during their relocation from the US to Greece was indeed significant. Therefore, statistical testing and graph-theoretic analysis were applied for the comparison of distributions of responses about perceived accessibility and perceived neighbourhood characteristics in the US and Greece. The Mann-Whitney-Wilcoxon test was used for this purpose. This non-parametric test examines the null hypothesis that two samples come from the same population (that the true location shift between the means is equal to 0) [22]. The Mann-Whitney-Wilcoxon test is preferable than the t-test when comparing non-normally distributed groups of observations.
Second, we analysed neighbourhood preferences and travel attitudes of the respondents aiming to identify latent constructs, since many of the questionnaire items are likely to measure similar dimensions of those two factors. Factor analysis was performed using the Likert-scale responses [23] on both neighbourhood preferences and travel attitudes group of items. This method is used to reduce the number of variables in a dataset, by identifying common patterns between them and revealing latent factors. Factor analysis is based on the Spearman statistic test, which is a non-parametric test used for hierarchical cluster analysis [24,25]. Variable clustering is used to assess collinearity and redundancy of the variables, in order to separate them into clusters and treat them as single variables, thus reducing their number. Determining the optimal number of clusters is a key consideration in factor analyses and a topic that has received a lot of attention in the literature, with a large number of criteria proposed (see for example [26,27]). Criteria for determining the optimal number of clusters thus include retaining factors that explain at least 10% of the variance, factors with eigenvalue greater than one, or performing parallel analysis. One complication is that in most applications these criteria lead to different “optimal” numbers of clusters, thus requiring the experience and judgment of the researcher, in order to actually make a decision.
Finally, in the third step we modeled travel behaviour changes using perceived accessibility and built environment, neighbourhood preferences and travel attitudes as explanatory variables. Three linear regression models were developed to model changes in car, walking and bicycle use before and after relocation from US to Greece. Due to the large number of available explanatory variables and the small sample size, variable reduction techniques were applied. We first, computed the difference (distance) between the ratings of the US and Greek contexts. Then, we used the Spearman statistic to measure which variables are statistically correlated with each other. Only one of the variables that belong in the same branch of the resulting tree diagram of correlated variables was used in the models. Latent variables of neighbourhood preferences and travel attitudes, identified in the second step of our methodology, and socio-demographic characteristics were also introduced in our models to explain travel behaviour changes. The analysis presented in this paper was performed in R [28].

4. Results

4.1. Differences between US and Greek Accessibility and Built Environment Contexts

Overall, the results demonstrated that accessibility and built environment contexts, in which participants of this survey have lived in the US and Greece, differ significantly. Seventeen out of 24 accessibility and built environment variables showed a significant difference (p < 0.1) (see Table 2).
Specifically, the majority of the respondents relocated in areas away from the city center in Greece, but with lower parking availability both in their neighbourhood and at usual destinations outside their neighbourhood (see Figure 1a,b). Moreover, accessibility for the alternative means of transport perceived to be significantly lower in the Greek compared to the US context, both in terms of walkability and of the level of development of cycle facilities in the respondents’ neighbourhood (see Figure 1c,d). Perceived accessibility to neighbourhood’s amenities was quite high in both countries although slightly lower in the Greek compared to the US context (see Figure 1e). Also, respondents stated that Greek relocation areas did not have so many parks and open spaces as the neighbourhoods in the US that they used to live (see Figure 1f). Additionally, respondents stated that the conditions for cycling and walking in Greece are not as safe as they were in the US (see Figure 2a,b), which may also be connected with their statement that the residential green space and architectural environment, including street furniture, were better in the US than in their neighbourhood in Greece (see Figure 2c,d).
Overall, the results of the Wilcoxon tests indicate that the neighbourhoods, where respondents relocated in Greece, have: (1) more difficult access to central arteries, (2) lower parking availability at usual destinations outside the neighbourhood, (3) higher levels of congestion in major urban arteries, (4) longer travel time to the city center and (5) higher cost of car use. On the other hand, the US neighbourhoods, where respondents used to live before moving back to Greece, outperform their Greek counterparts in: (1) pavement facilities, (2) cycle facilities within the neighbourhood and towards adjacent areas, (3) parks and open spaces, (4) low levels of traffic on neighbourhood streets, (5) safe walking, (6) biking and (7) driving conditions, (8) adequate residential green space and (9) nice architectural design, civic buildings and/or street furniture (see Table 2).

4.2. Latent Neighbourhood Preferences and Travel Attitudes

Aiming to reduce the number of variables and reveal the latent neighbourhood preferences and travel attitudes of the respondents, factor analysis was performed [29]. The varimax rotation was selected because it results in loadings closer to the extremes (1 and 0). The number of factors was selected based on the percent of the variance that was explained by each factor, i.e., only factors explaining at least 10% of the variance were retained (a criterion often used in similar analyses, see e.g., [30,31]). The variables with loadings less than 0.6 were eliminated (see Table 3). The resulting factors are presented below:
  • Preferences for neighbourhood characteristics
    a. Infrastructure provision
    b. Accessibility
    c. Public transport provision
    d. Low-car environment
  • Travel attitudes
    a. Walking preference
    b. Car preference
    c. Travel altitude to trip convenience.
Infrastructure provision is composed by factors such as the availability of parks and open spaces, low traffic on the neighbourhood, safe driving conditions, low crime rate within neighbourhood, adequate residential green space and nice architectural building and street design. Accessibility to destinations like shopping centers and neighbourhood amenities, form the accessibility factor. Characteristics related with the provision and easy access to public transport services form the third factor, public transport provision. Finally, the low availability of on- and off-street parking in -and outside- the neighbourhood, high levels of congestion in major urban arteries and safe walking and biking conditions, are correlated, indicating a preference towards a low-car environment.
The respondents consider infrastructure provision and low-car environment as the most important factors in choosing their residential location at it explains 24.0% and 20.7% of the variance respectively. Public transport provision and accessibility are also important factors explaining 11.6% and 10.6% of the variance respectively. Collectively, these four factors explain 66.9% of the total variance, a very positive outcome.
We were also able to distinguish three factors with respect to travel attitudes of the respondents (see Table 4). The first one indicates a preference towards walking. Statements describing the joy of walking and preference over car scored particularly high in this factor. The second factor describes a preference towards car, while, finally, the third factor captures travel altitude to trip convenience, with the statement describing a liking for minimum distances shows the highest scores in this factor. These three factors explain 39.3% of the variance in the data.

4.3. Travel Behaviour Changes

In order to model the change in driving, walking and bicycle usage before and after relocation to Greece, three linear regression models were developed. The explanatory variables of the models comprised the variables identified using the Spearman statistic (see Figure 3), the latent variables of neighbourhood preferences and travel attitudes identified through factor analysis (see Table 3 and Table 4) as well as the socio-demographic characteristics of the respondents.
All three models have relatively good fit (R squared varied between 0.72 and 0.80). 59% of the respondents stated that they now drive more than in the US, while 43% of the respondents answered that they now bike and walk less. Some variables that result in low t-test (less than 95% confidence level) were maintained into the model, as in this case low t-test values do not necessarily imply low significance, but could be the result of low data availability [32].
The results show that changes in accessibility (either in the form of travel time to city center and congestion levels or in terms of better/worse walking and cycling infrastructures) influence to a large extent changes in driving (see Table 5). However, car availability, income and a change in the number of children also appeared to explain to a large extent changes in driving after relocation from US to Greece. According to our results, the longer the travel time to city center from the neighbourhoods, where respondents relocated in Greece, the more these respondents tended to use their car (β = 0.313, t = 2.630). Also, the lower the congestion level in urban arteries the more people used their car after relocation (β = −0.284, t = −1.700). Moreover, worse walking and cycling facilities in the Greek context were associated with higher levels of car use (β = −0.130, t = −1.378 and β = −0.287, t = −2.445 respectively). Higher cost of public transport in Greece appeared to be associated with higher level of car use (β = 0.340, t = 1.784). With respect to socio-demographic characteristics, people owning a car, having higher income and more children after relocating to Greece tended to use their car more (β = 1.668, t = 2.417, β = 1.203, t = 2.291 and β = 1.711, t = 2.568 respectively).
Concerning the change in bicycle usage from US to Greece, results show that the single most important factor is perceived safety of cycling in each place (see Table 6). The higher the perception of safety about cycling conditions in Greece, the higher the levels of bicycle use of the respondents after relocating in this country (β = 0.653, t = 7.343). Moreover, people relocating in a higher density neighbourhood in Greece with increased accessibility to local amenities (e.g., groceries, bakeries, community/leisure center) tended to bike more (β = -0.173, t = −1.817 and β = 0.150, t = 1.525 respectively). A nice architectural and social environment involving lots of interaction among neighbors in Greece was also positively associated with bike use (β = 0.121, t = 1.269 and β = 0.156, t = 1.413 respectively). On the other hand, lower cost of public transport, low levels of car traffic and good pavement quality in the Greek neighbourhood were negatively associated with bike use, indicating that people might prefer other modes after relocating in neighbourhoods with such characteristics (β = 0.181, t = 1.532 and β = −0.181, t = −1.990 and β = −0.149, t = −2.051 respectively). People buying a car and having one or more children in Greece tended to use bike less (β = −0.596, t = −1.506 and β = −1.485, t = −3.615 respectively).
The results of the model about changes in walking before and after relocation to Greece (see Table 7) show that both access to shopping facilities and public transport services play a significant role. Specifically, the higher the accessibility to a district shopping center and to any public transport networks (from local buses to regional trains) the more the respondents used to walk after their relocation to Greece (β = 0.295, t = 2.406 and β = 0.116, t = 1.491 respectively). Good cycle facilities within the neighbourhood (probably reflecting good conditions for walking as well) in Greece were associated with higher levels of walking (β = 0.202, t = 2.085). Moreover, settling in a neighbourhood with people of similar income in Greece appeared to be strongly associated with higher levels of walking, possibly reflecting increased social interaction within the neighbourhood (β = 0.808, t = 5.050). On the other hand, difficult access to central arteries (possibly reflecting a more remote location of the neighbourhood) in Greece was associated with lower levels of walking (β = −0.456, t = −3.725). Finally, people on lower income with more children tended to walk more in Greece (β = −0.919, t = −1.992 and β = 1.159, t = 2.048). Having a bike in Greece was also positively associated with higher levels of walking activity (β = 4.227, t = 5.091). Travel attitudes and neighbourhood preferences were not significant determinants of changes neither in walking nor in biking and driving levels after relocation.

5. Conclusions

This study explored the possible causal relationships between the built environment, travel attitudes and travel behaviour of people that have relocated between urban and transportation contexts that differ significantly. An electronic questionnaire was designed (based on [11,
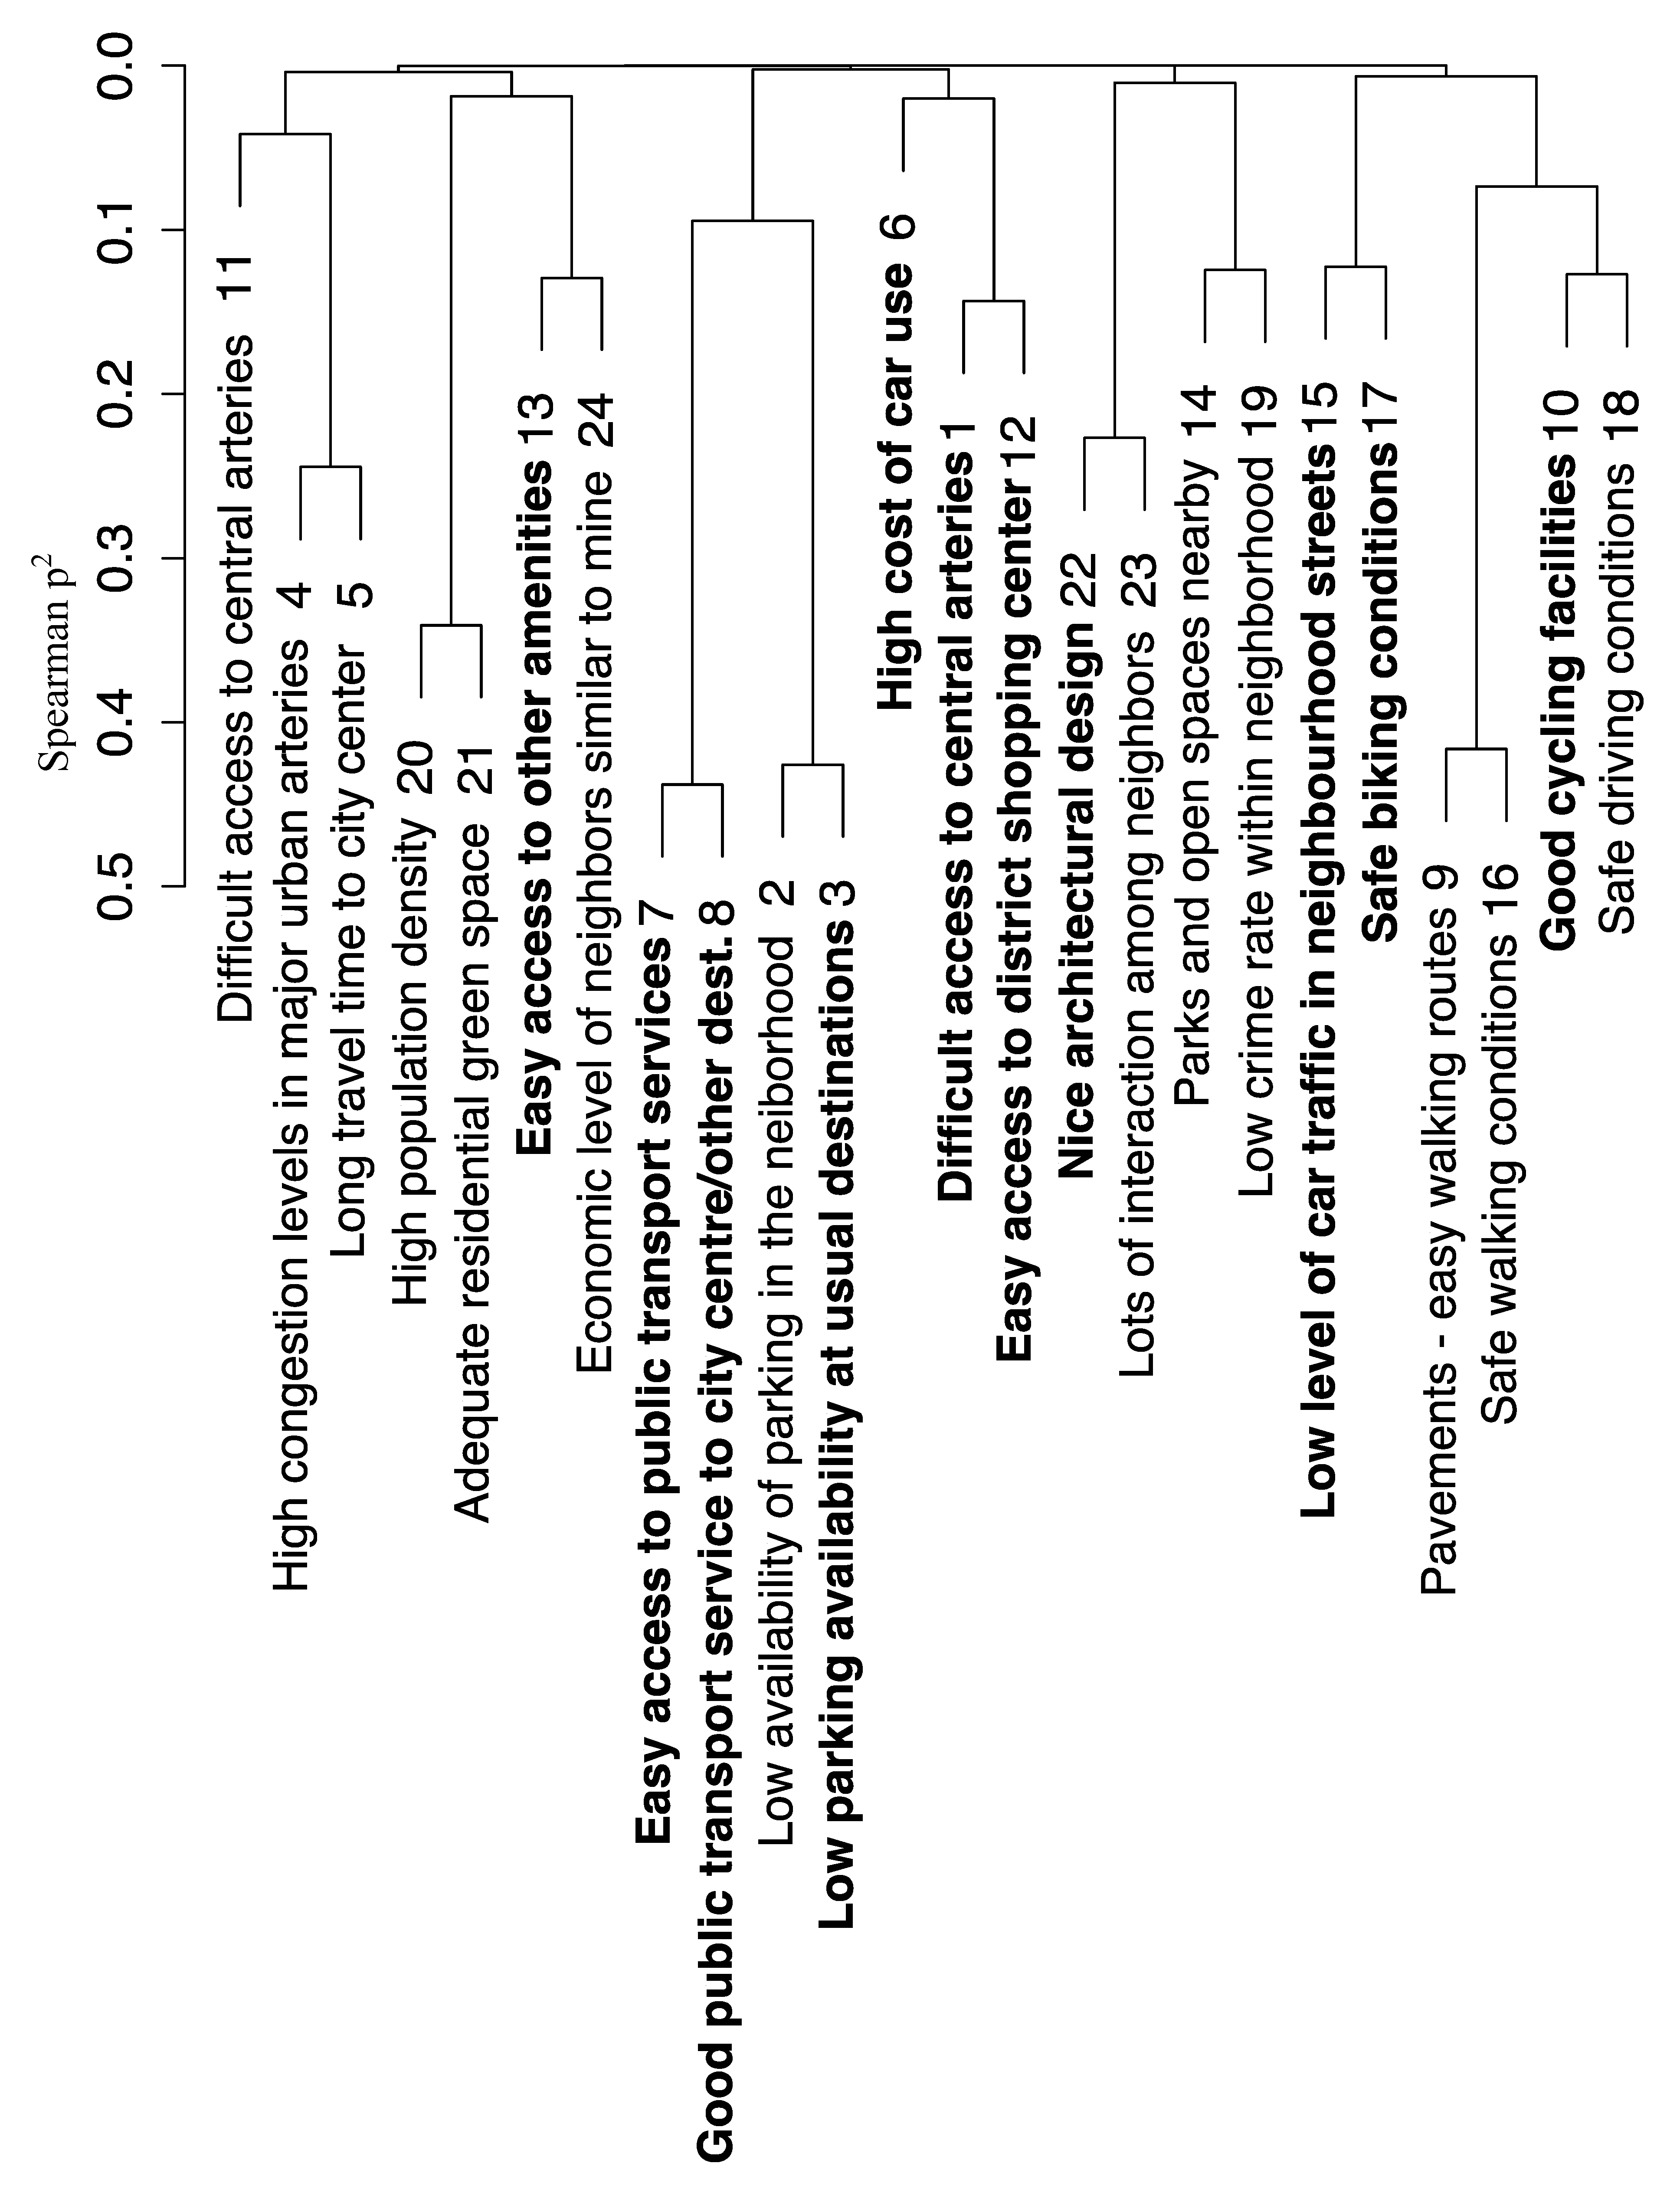
12]) and disseminated on-line to people that currently reside in Greece, but have lived for more than a year in the US during the last eight years before the survey. A sample of 51 responses was collected, and the data were qualitatively and quantitatively analysed using a three-step methodology. Variable reduction techniques were applied prior developing our models because of the small sample size.
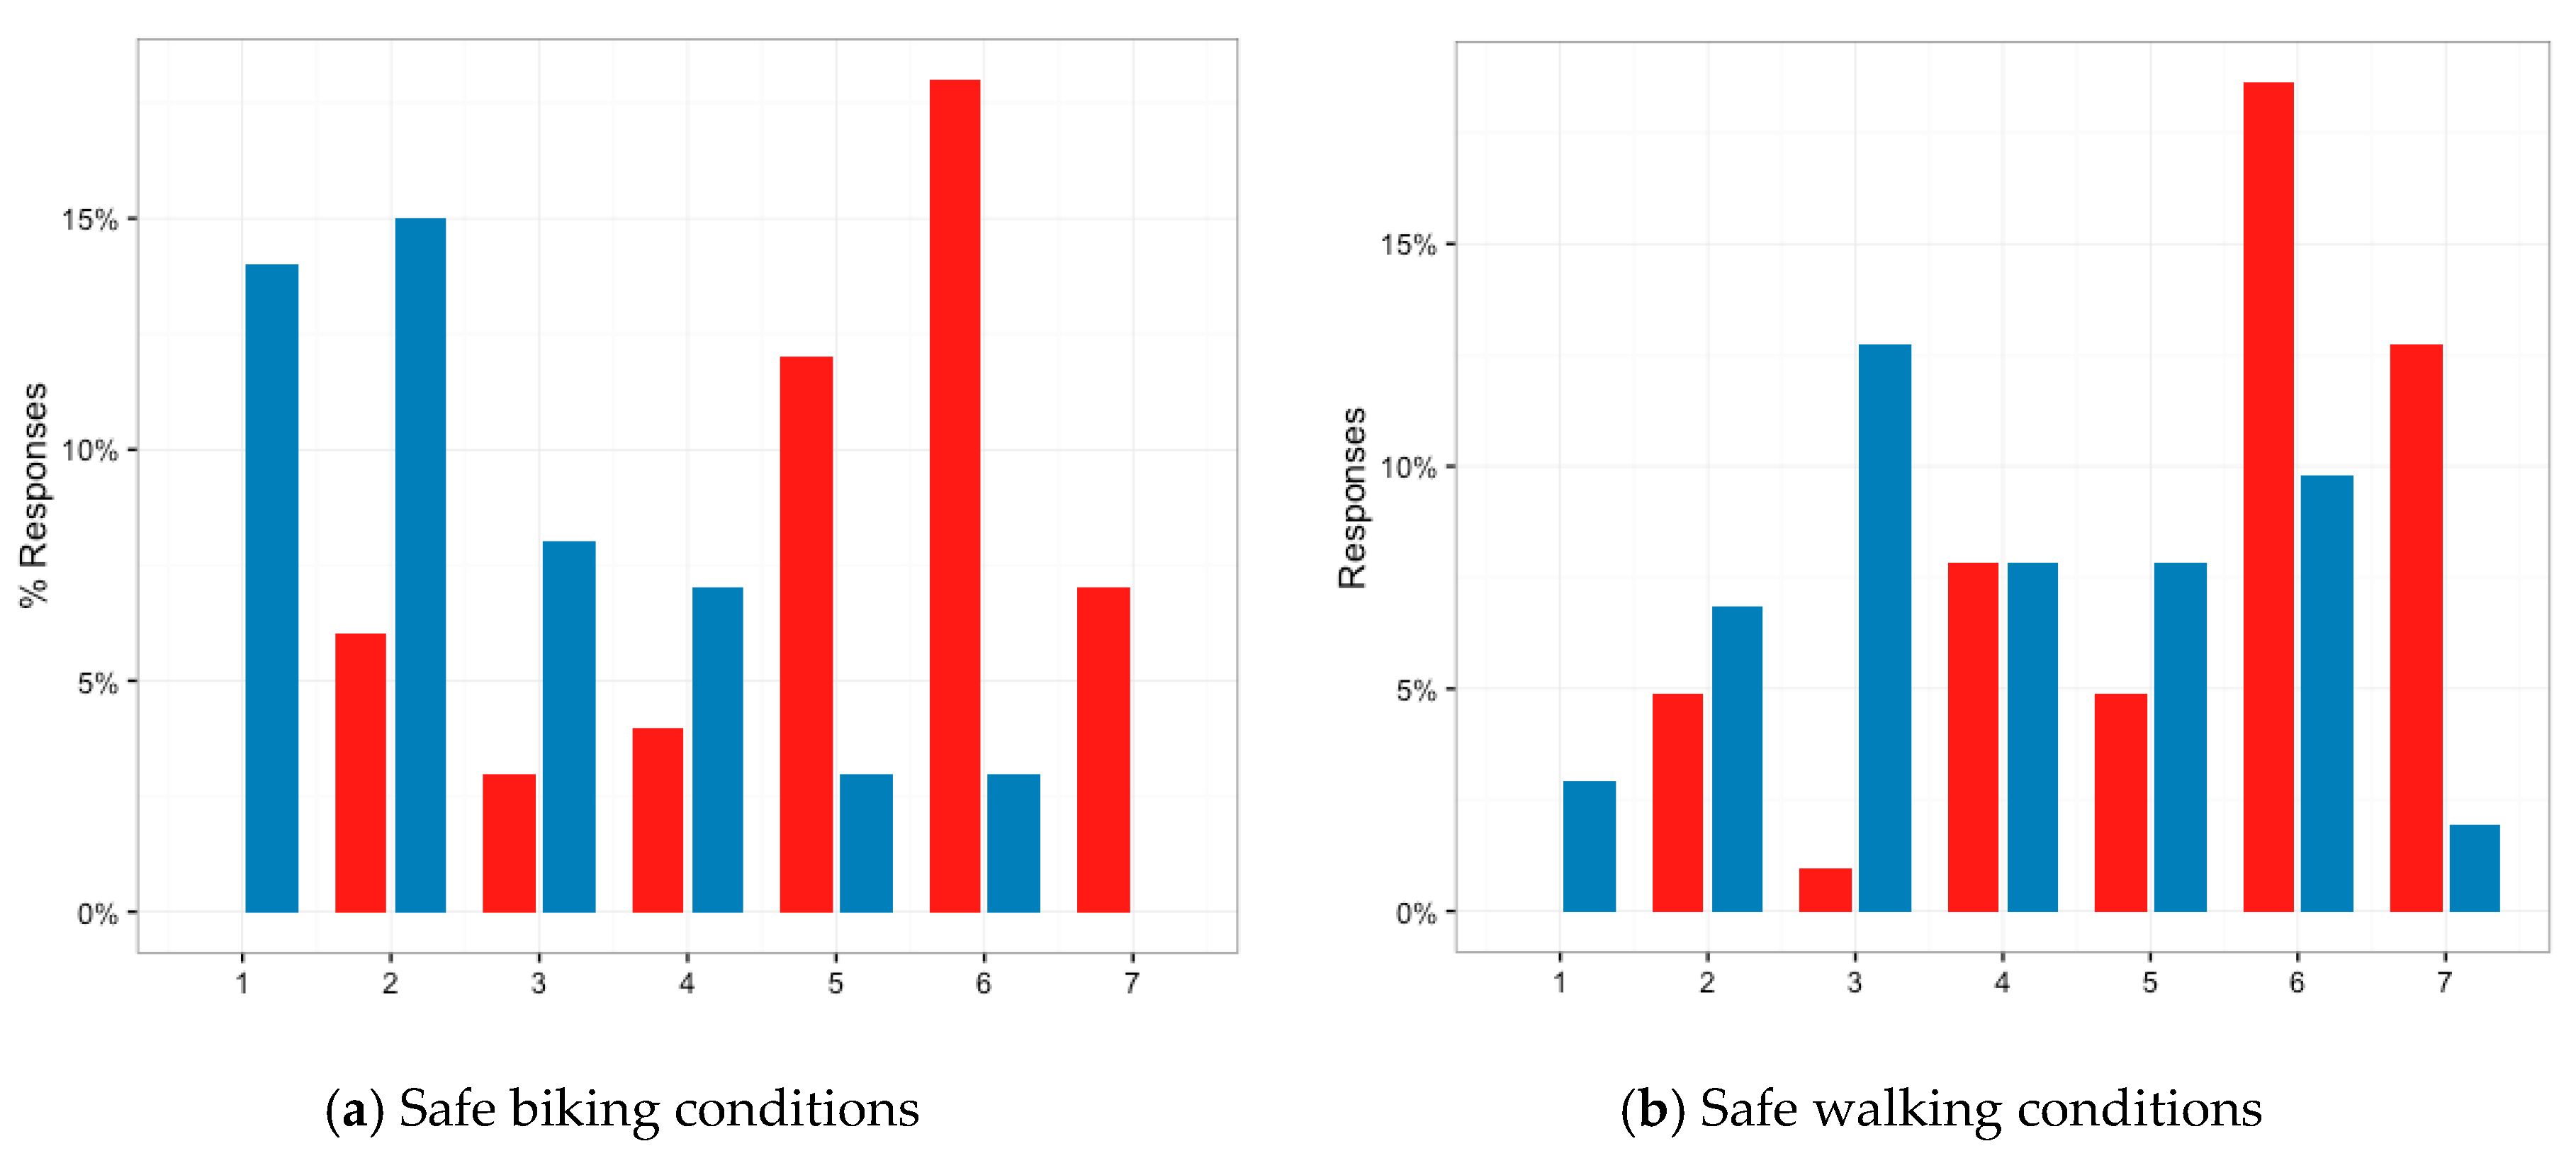
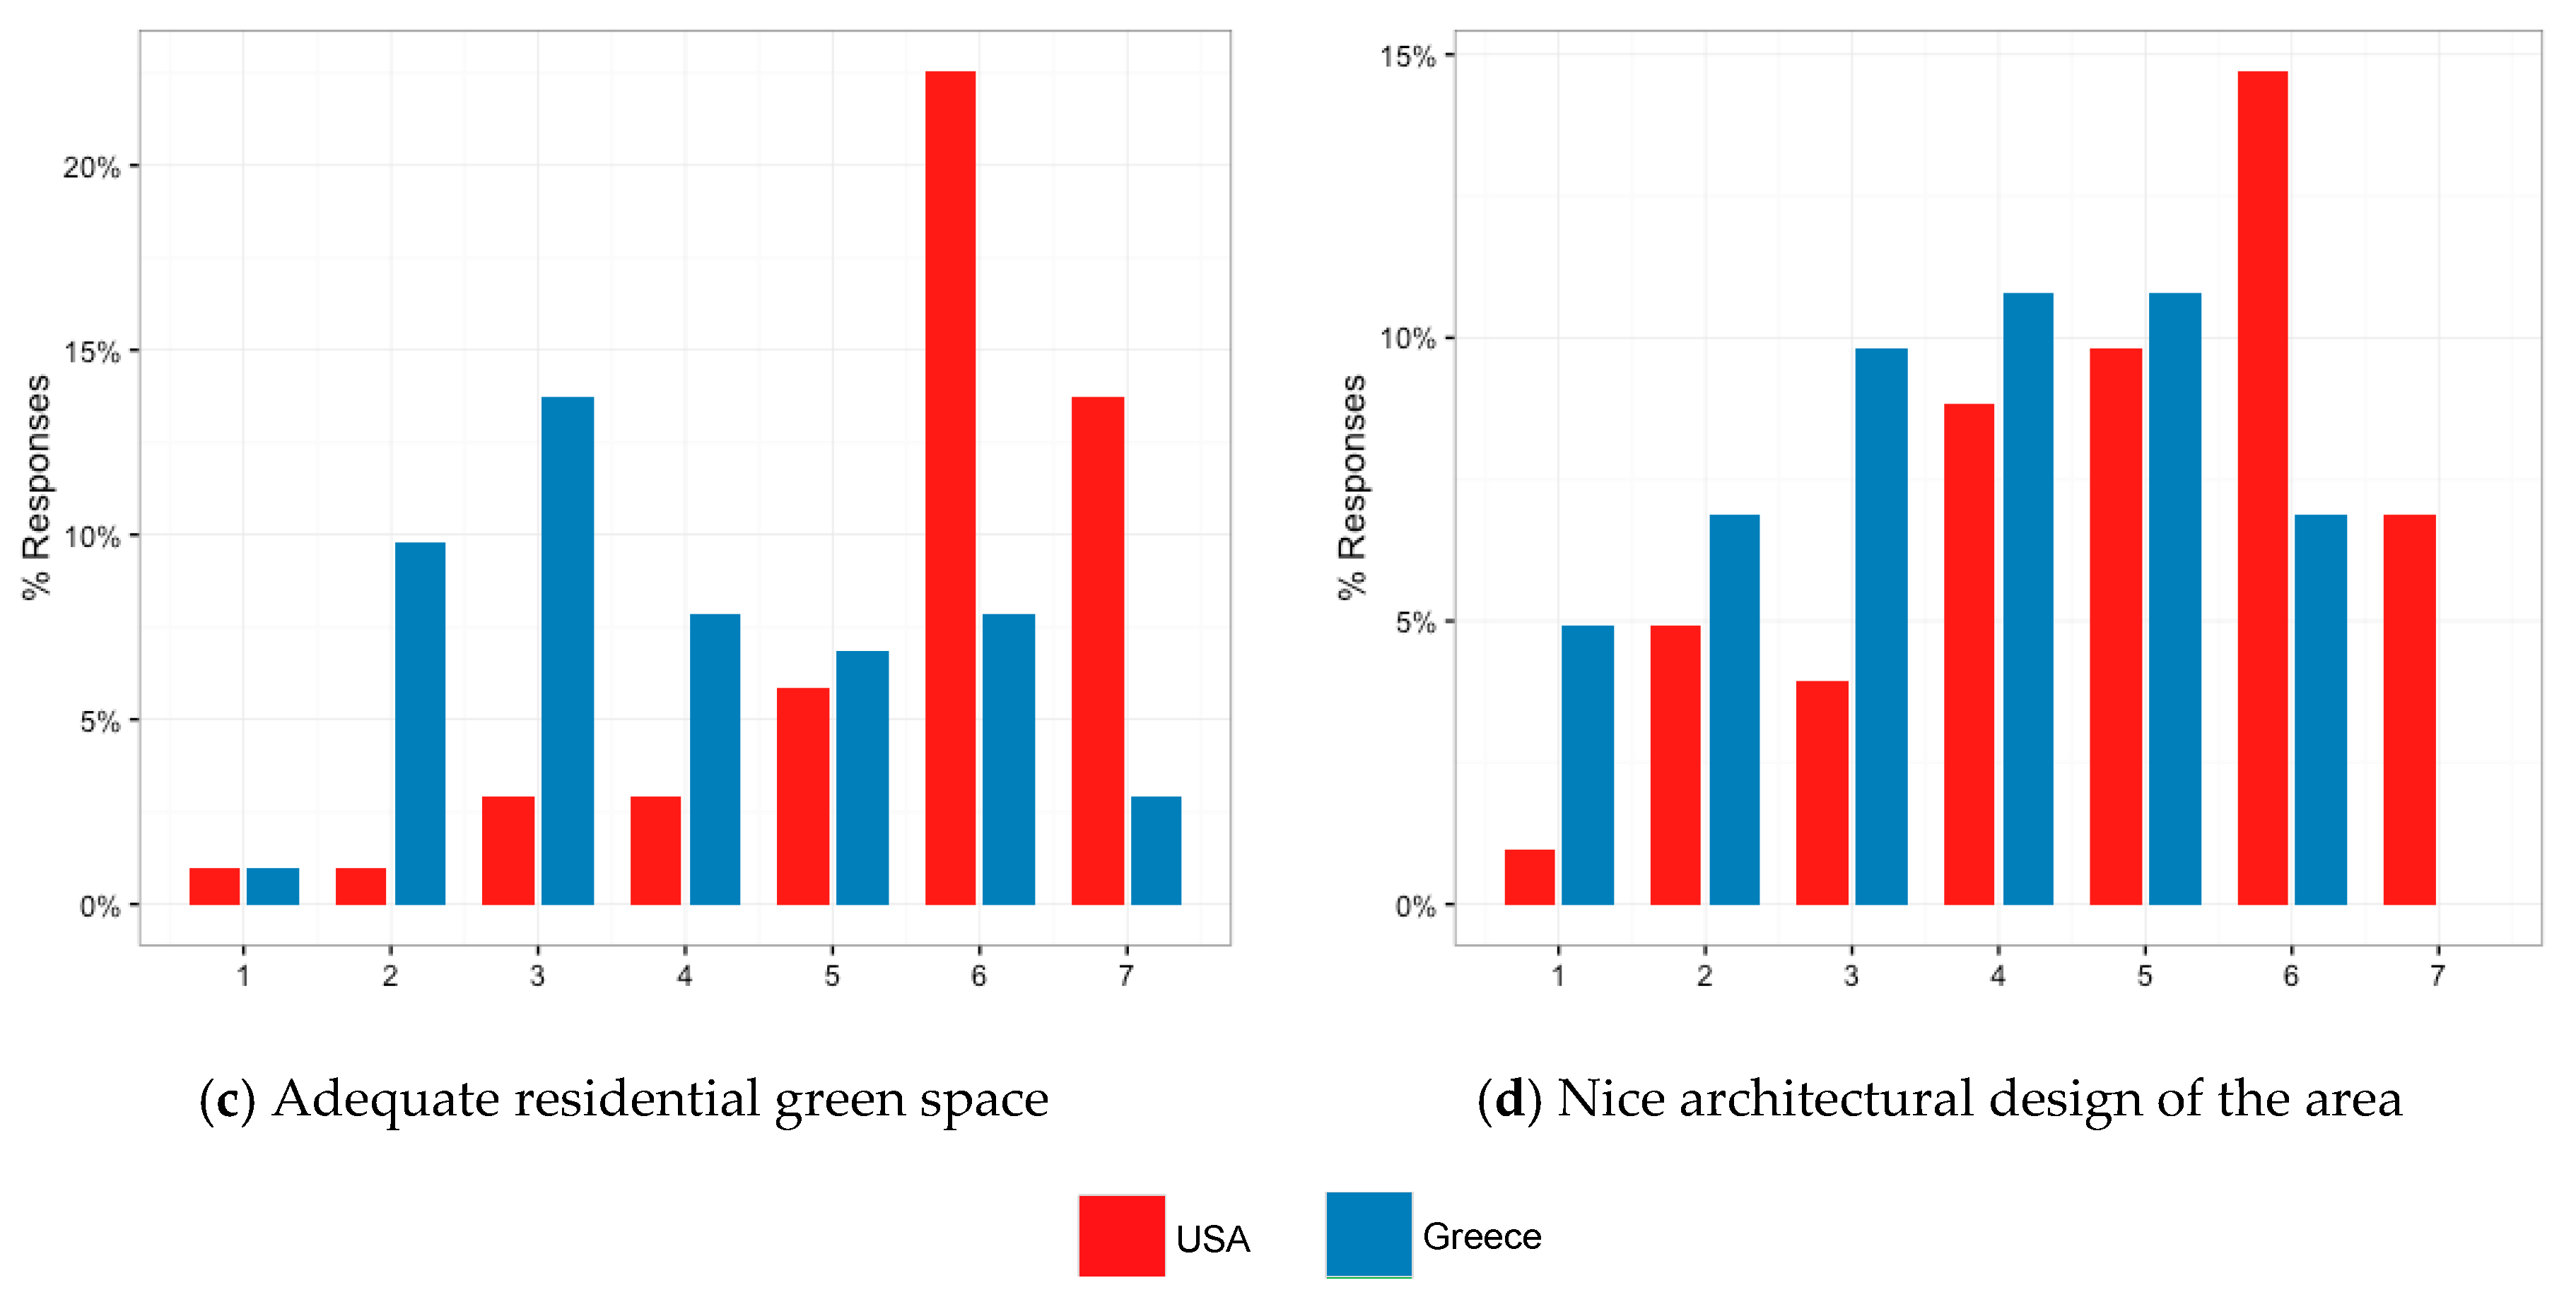
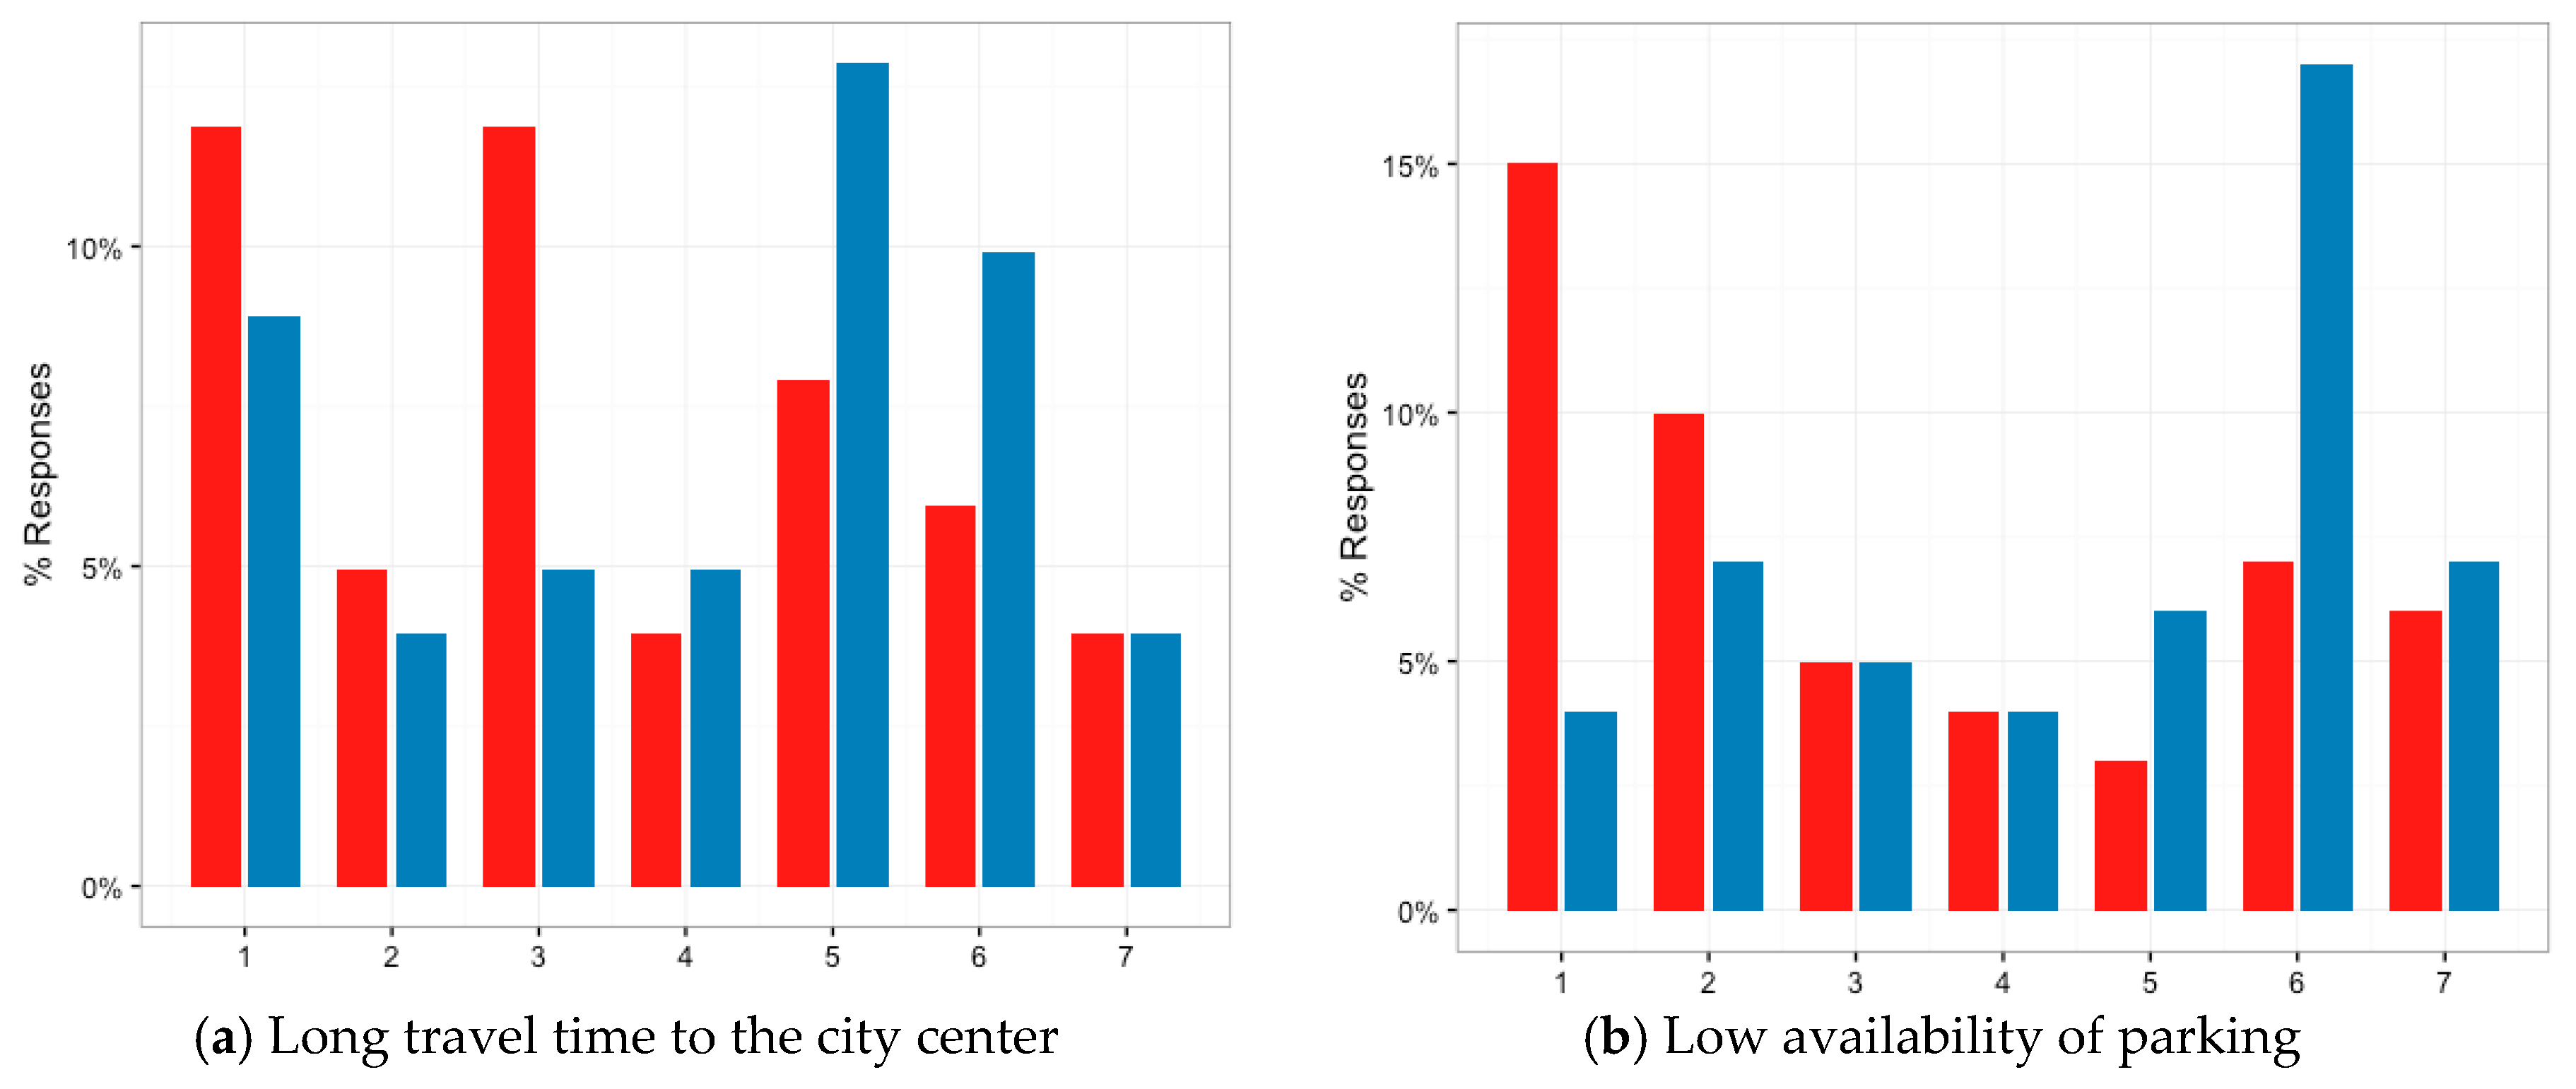
Wilcoxon tests’ results showed that accessibility and built environment contexts in which participants of this survey have lived in the US and Greece differ significantly. As we expected, after relocation in Greece respondents typically experienced lower car accessibility at regional level (e.g., more difficult access to central arteries and lower parking availability at usual destinations outside the neighbourhood) and worse conditions for walking and cycling at the neighbourhood level (mainly due to lack of adequate infrastructure, particularly pavements, cycle facilities and open spaces).
Quasi-longitudinal analysis showed that changes in driving, biking and walking are mainly associated with changes in accessibility, car availability and socio-demographic characteristics, but not with travel attitudes or neighbourhood preferences. This result adds to previous evidence linking built environment and car use after accounting for self-selection [10,11,12]. We should however note that in our case the transportation networks component of accessibility seems to play a very important role in changing travel behaviour. In other words, congestion in urban arteries as well as worse conditions of cycling and walking facilities in the Greek context were associated with more driving. Changes in bicycle use and walking between the US and Greece confirmed the importance of the transportation networks component of accessibility for those two modes of transport as well. It seems that in contexts where transport infrastructures are not adequately developed, like Greece, low safety levels for cycling as well as difficulties in public transportation access can influence the extent of bicycle use and walking. According to a recent study, lack of cycling infrastructures is considered by Greeks as one of the main inhibitors of bicycle use especially among women and older age groups [33]. The built environment component of accessibility was found to be important as well. Longer travel time to city center was associated with higher car use, higher density neighbourhoods and increased accessibility to local amenities were associated with increased bike use and better access to a district shopping center was associated with more walking. The critical role of distance to city center and residential density for travel behaviour in the Greek context has already been identified in an earlier study [34]. The results of this study indicate the importance of an integrated approach involving sustainable land use policies and development of networks for the alternative modes of transport for reducing car use and promoting cycling and walking.
The authors are aware that there are several limitations that should be taken into consideration in this study. First, the sample profile (mainly students and researchers that have moved from the US to Greece), along with the relatively small sample size, limit the generalizability and the robustness of our results. After this study, a logical next step would involve replication of these methods in a greater scale identifying as population, for example, any person that has moved from the US to a European city. A parallel qualitative in-depth exploration of behavioural changes after returning to a European city would enhance our understanding about residential and travel choice mechanisms. Second, many respondents may have returned to Greece a long time ago, meaning that they may not well remember the conditions of their US neighbourhood. Future research could avoid this limitation by focusing on relocation within shorter period before the survey (e.g., five instead of eight years). The expansion of geographical area of the study (i.e., relocation from the US to any European city) would allow easier collection of such sample. Also, respondents’ attitudes in this study are assumed to be constant before and after relocation, which simply may not be the case. This is an inherent limitation of the quasi-longitudinal approach. However, attitudes changes might partly cause the decision to relocate and therefore to account for some of the built environment effects on travel behaviour (see [5]). Measurement of respondents travel attitudes before and after relocation in a true panel study would solve this problem (see [11]). Finally, perception of accessibility and built environment characteristics may not reflect the objective reality of respondents’ neighbourhood characteristics [35,36], which may restrict the usefulness of our results with respect to policy implications. Therefore, we recommend that studies also involve objective measures of accessibility and built environment characteristics in their analysis. We should note though that there is a tradeoff between the level of geographical dispersion of the sample, and the ability to measure accessibility and built environment contexts of the participants’ neighbourhoods.
In conclusion, the results of our study add evidence to the existing literature identifying a causal relationship between the built environment and car use after accounting for travel attitudes. What this study reminds us, though, is that accessibility is defined not only by the spatial allocation of destinations (i.e., the built environment), but also by the transportation networks. Thus, any policies aiming to reduce car use and especially promote walking and cycling may first make sure that adequate transportation networks are developed.

Acknowledgments

The authors are grateful to the participants of this survey for sharing their experiences with changes in their mobility behaviour after relocation from the US to Greece. TU Delft Open Access funds covered the costs to publish this article in open access.

Author Contributions

Dimitris Milakis conceived the research concept. Dimitris Milakis, Dimitrios Efthymiou and Constantinos Antoniou designed the survey; Dimitrios Efthymiou analysed the data; Dimitris Milakis, Dimitrios Efthymiou and Constantinos Antoniou interpreted the results; Dimitris Milakis and Dimitrios Efthymiou wrote the paper. Constantinos Antoniou commented on the paper.

Conflicts of Interest

The authors declare no conflict of interest.

References

  1. Milakis, D.; Efthymiou, D.; Antoniou, C. Quasi-longitudinal analysis of links between built environment, travel attitudes and travel behavior: A case of Greeks relocating from US to Greece. In Proceedings of the 94th Annual Meeting of the Transportation Research Board, Washington, DC, USA, 11–15 January 2015. [Google Scholar]
  2. Cervero, R. Mobility and Urban Form. In Planning and Design for Sustainaible Urban Mobility; Global Report on Urban Settlements 2013; Routledge: New York, NY, USA, 2013; pp. 75–106. [Google Scholar]
  3. Ewing, R.; Cervero, R. Travel and the built environment. J. Am. Plan. Assoc. 2010, 76, 265–294. [Google Scholar] [CrossRef]
  4. Mokhtarian, P.L.; Cao, X. Examining the impacts of residential self-selection on travel behaviour: A focus on methodologies. Transp. Res. Part B 2008, 42, 204–228. [Google Scholar] [CrossRef]
  5. Cao, X.J.; Mokhtarian, P.L.; Handy, S.L. Examining the impacts of residential self-selection on travel behavior: A focus on empirical findings. Transp. Rev. 2009, 29, 359–395. [Google Scholar] [CrossRef]
  6. Van Wee, B. Self-Selection: A key to a better understanding of location choices, travel behavior and transport externalities? Transp. Rev. 2009, 29, 279–292. [Google Scholar] [CrossRef]
  7. Naess, P. Tempest in a teapot: The exaggerated problem of transport-related residential self-selection as a source of error in empirical studies. J. Transp. Land Use 2014, 7, 57–79. [Google Scholar] [CrossRef]
  8. Van Wee, B.; Van Boarnet, M.G. Reaction on the paper Tempest in a teapot: The exaggerated problem of transport-related residential self-selection as a source of error in empirical studies. J. Transp. Land Use 2014, 7, 81–86. [Google Scholar]
  9. Naess, P. Response to van wee and boarnet. J. Transp. Land Use 2014, 7, 87–92. [Google Scholar] [CrossRef]
  10. Krizek, K. Residential relocation and changes in urban travel: Does neighborhood-scale urban form matter? J. Am. Plan. Assoc. 2003, 69, 265–281. [Google Scholar] [CrossRef]
  11. Handy, S.; Cao, X.; Mokhtarian, P. Correlation or causality between the built environment and travel behavior? Evidence from Northern California. Transp. Res. Part 2005, 10, 427–444. [Google Scholar] [CrossRef]
  12. Aditjandra, P.T.; Cao, X.J.; Mulley, C. Understanding neighborhood design impact on travel behavior: Application of structural equations model to a British metropolitan data. Transp. Res. Part A 2012, 46, 22–32. [Google Scholar]
  13. Handy, S.; Cao, X.; Mokhtarian, P. Self-selection in the relationship between the built environment and walking. Empirical evidence from Northern California. J. Am. Plan. Assoc. 2006, 72, 55–74. [Google Scholar] [CrossRef]
  14. Cao, X.J.; Mokhtarian, P.L.; Handy, S.L. Cross-sectional and quasi-panel explorations of the connection between the built environment and auto ownership. Environ. Plan. A 2007, 39, 830–847. [Google Scholar] [CrossRef]
  15. Schneiner, J.; Holz-Rau, C. Changes in travel mode use after residential relocation: A contribution to mobility biographies. Transportation 2013, 40, 431–458. [Google Scholar] [CrossRef]
  16. Klinger, T.; Lanzendorf, M. Moving between mobility cultures: What affects the travel behavior of new residents? Transportation 2016, 43, 243–271. [Google Scholar] [CrossRef]
  17. Meurs, H.; Haaijer, R. Spatial structure and mobility. Transp. Res. Part D 2001, 6, 429–446. [Google Scholar] [CrossRef]
  18. Giles-Corti, B.; Bull, F.; Knuiman, M.; McCormack, G.; Van Niel, K.; Timperio, A.; Christian, H.; Foster, S.; Divitini, M.; Middleton, N. The influence of urban design on neighborhood walking following residential relocation: Longitudinal results from the RESIDE study. Soc. Sci. Med. 2013, 77, 20–30. [Google Scholar] [CrossRef] [PubMed]
  19. Kamruzzaman, M.; Washington, S.; Baker, D.; Brown, W.; Giles-Corti, B.; Turrell, G. Built environment impacts on walking for transport in Brisbane, Australia. Transportation 2016, 43, 53–77. [Google Scholar] [CrossRef]
  20. Van de Coevering, P.; Maat, K.; Kroesen, M.; van Wee, B. Causal effects of built environment characteristics on travel behavior: A longitudinal approach. Eur. J. Transp. Infrastruct. Res. 2016, 16, 674–697. [Google Scholar]
  21. Weijters, B.; Baumgartner, H. Misresponse to reversed and negated items in surveys: A review. J. Mark. Res. 2012, 49, 737–747. [Google Scholar] [CrossRef]
  22. Mann, H.B.; Whitney, D.R. On a test of whether one of two random variables is stochastically larger than the other. Ann. Math. Stat. 1947, 18, 50–60. [Google Scholar] [CrossRef]
  23. Likert, R. A technique for the measurement of attitudes. Arch. Psychol. 1932, 140, 5–53. [Google Scholar]
  24. Myers, J.L.; Well, A.D. Research Design and Statistical Analysis; Lawrence Erlbaum: Mahwah, NJ, USA, 2003. [Google Scholar]
  25. Lehamn, A. Jmp for Basic Univariate and Multivariate Statistics: A Step-By-Step Guide; SAS Press: Cary, NC, USA, 2005. [Google Scholar]
  26. Aditjandra, P.T.; Mulley, C.; Nelson, J.D. The influence of neighborhood design on travel behavior: Empirical evidence from North East England. Transp. Policy 2013, 26, 54–65. [Google Scholar] [CrossRef]
  27. Revelle, W. Psych: Procedures for Personality and Psychological Research; Northwestern University: Evanston, IL, USA, 2015. [Google Scholar]
  28. R Core Team. A Language and Environment for Statistical Computing; Foundation for Statistical Computing: Vienna, Austria, 2016. [Google Scholar]
  29. Washington, S.P.; Karlaftis, M.G.; Mannering, F.L. Statistical and Econometric Methods for Transportation Data Analysis; Chapman Hall/CRC: London, UK, 2003. [Google Scholar]
  30. Tyrinopoulos, Y.; Antoniou, C. Public transit user satisfaction: Variability and policy implications. Transp. Policy 2008, 15, 260–272. [Google Scholar] [CrossRef]
  31. Efthymiou, D.; Antoniou, C.; Waddell, P. Factors affecting the adoption of vehicle sharing systems by young drivers. Transp. Policy 2013, 29, 64–73. [Google Scholar] [CrossRef]
  32. Ziliak, S.T.; McCloskey, D.N. The Cult of Statistical Significance: How the Standard Error Costs Us Jobs, Justice, and Lives; University of Michigan Press: Ann Arbor, MI, USA, 2008. [Google Scholar]
  33. Milakis, D. Will Greeks cycle? Exploring intention and attitudes in the case of the new bicycle network of Patras. Int. J. Sustain. Transp. 2015, 9, 321–334. [Google Scholar] [CrossRef]
  34. Milakis, D.; Vlastos, T.; Barbopoulos, N. Relationships between urban form and travel behavior in Athens, Greece. A comparison with Western European and North American results. Eur. J. Transp. Infrastruct. Res. 2008, 8, 201–215. [Google Scholar]
  35. Krizek, J.K.; Horning, J.; El-Geneidy, A. Perceptions of accessibility to neighbourhood retail and other public services. In Accessibility Analysis and Transport Planning. Challenges for Europe and North America; Geurs, K.T., Krizek, K.J., Reggiani, A., Eds.; Edward Elgar: Cheltenham, UK, 2012. [Google Scholar]
  36. Van Acker, V.; Derrudder, B.; Witlox, F. Why people use their cars while the build environment imposes cycling. J. Transp. Land Use 2013, 6, 53–62. [Google Scholar]
Figure 1. Differences in the accessibility and built environment contexts between respondents’ neighbourhoods in the US and Greece (1: not at all true, 7: entirely true).
Sustainability 09 01774 g001aSustainability 09 01774 g001b
Figure 2. Differences in the accessibility and built environment contexts between respondents’ neighbourhoods in the US and Greece (1: not at all true, 7: entirely true).
Sustainability 09 01774 g002aSustainability 09 01774 g002b
Figure 3. Spearman statistic of GR–US variables (numbers refer to Table 2; bold indicates variable used in later models).
Sustainability 09 01774 g003
Table 1. Key socio-demographic characteristics of the sample.
Socio-Demographic CharacteristicSurvey
Age18–251.96%
26–3523.53%
36–4550.98%
46–5515.69%
56–653.92%
>663.92%
GenderMale58.82%
Female41.18%
MartialSingle49.01%
Married43.14%
Divorced3.92%
Widowed1.96%
Household size121.57%
227.45%
323.53%
415.68%
5 or more11.76%
Employment statusHomemaker1.96%
Retired5.88%
Student0%
Working full-time84.31%
Working part-time5.88%
Education level completedBachelor11.76%
Masters50.98%
Doctorate37.25%
Income (in thousands euros per year)<101.96%
10–153.92%
15–2517.65%
25–5032.37%
50–7515.69%
75–1007.84%
100–2003.92%
>2005.88%
NA9.80%
Car availabilityRespondents with access to a car92.16%
Table 2. Results of the Wilcoxon test applied on the distributions of US-GR responses.
VariableTest-Stat.p-ValueDif. In loc.
Car accessibility
1Difficult access to central arteries460.00−2.50
2Low availability of on -or off -street parking in the neighbourhood1510.00−2.00
3Low parking availability at usual destinations outside the neighbourhood65.50.00−3.00
4High levels of congestion in major urban arteries123.50.00−2.00
5Long travel time to the city center2490.05−1.00
6High cost of car use (e.g., gas, parking, maintenance)22.50.00−3.00
Accessibility of alternative means of transport
7Easy access to public transport services (bus/trolley/tram/metro/rail)4480.770.00
8Good public transport service (bus/trolley/tram/metro/rail) to city center and other regional destinations368.50.770.00
9Pavements—easy walking routes throughout the neighbourhood10200.003.00
10Good cycle facilities within neighbourhood and towards adjacent areas8320.002.50
11High cost of public transport use (e.g., single ticket, monthly pass)2940.360.50
Accessibility to shops/facilities
12Easy access to a district shopping center2240.640.00
13Easy access to other amenities/facilities (community/leisure center, facilities for children, local shops such as groceries, bakeries, coffee shops)305.50.440.50
14Parks and open spaces nearby7020.002.50
Travel safety
15Low level of car traffic on neighbourhood streets747.50.002.00
16Safe walking conditions7750.002.00
17Safe biking conditions8540.003.00
18Safe driving conditions6300.002.50
19Low crime rate within neighbourhood256.50.48−0.50
Neighbourhood physical characteristics
20High population density1830.02−1.50
21Adequate residential green space6580.002.50
22Nice architectural design of residential, civic buildings and/or street furniture698.50.001.50
Socializing
23Lots of interaction among neighbors211.50.02−1.00
24Economic level of neighbors similar to my level169.50.860.00
Table 3. Results of factor analysis for neighbourhood characteristics preferences.
Factor 1Factor 2Factor 3Factor 4
Difficult access to central arteries.
Low availability of on -or off -street parking in the neighbourhood. 0.708
Low parking availability at usual destinations outside the neighbourhood. 0.822
High levels of congestion in major urban arteries. 0.743
Long travel time to the city center.
High cost of car use (e.g., gas, parking, maintenance).
Easy access to public transport services (bus/trolley/tram/metro/rail). 0.878
Good public transport service (bus/trolley/tram/metro/rail) to city center and other regional destinations. 0.818
Pavements—easy walking routes throughout the neighbourhood.
Good cycle facilities within neighbourhood and towards adjacent areas.
High cost of public transport use (e.g., single ticket, monthly pass).
Easy access to a district shopping center. 0.699
Easy access to other amenities/facilities (community/leisure center, facilities for children, local shops such as groceries, bakeries, coffee shops). 0.730
Parks and open spaces nearby.0.693
Low level of car traffic on neighbourhood streets.0.660
Safe walking conditions.
Safe biking conditions. 0.606
Safe driving conditions.0.7180.609
Low crime rate within neighbourhood.0.671
High population density.
Adequate residential green space.0.759
Nice architectural design of residential, civic buildings and/or street furniture.0.810
Lots of interaction among neighbors0.605
Economic level of neighbors similar to my level.
Sum of square loadings5.7654.9662.7792.537
Proportion variance0.2400.2070.1160.106
Cumulative variance0.2400.4470.5630.669
Factor interpretationInfrastructure provisionLow-car environmentPublic transport provisionAccessibility
Table 4. Results of factor analysis for travel attitudes.
Factor 1Factor 2Factor 3
I like walking.0.846
I prefer to walk rather than drive whenever possible.0.927
I like riding a bicycle.
I prefer to cycle rather than drive whenever possible.
I like travelling by public transport.
I prefer to take public transport than drive whenever possible.
I like driving.
I love getting around the city by car. 0.936
I try to limit my driving to help improve air quality.
The cost of car use (gas, parking, tolls) affects the choices I make about my daily travel.
I often use the telephone/internet to avoid having to travel somewhere.
When I need to buy something, I usually prefer to get it at the closest store possible. 0.952
The trip to/from work is a useful transition between home and work.
I wish I could teleport from home to work.
I use my trip to/from work productively.
I need a car to do many things I like to do.
Driving saves a large amount of money.
Travelling by car is safer overall than taking public transport.
Travelling by car is safer overall than walking.
Travelling by car is safer overall than riding a bicycle.
Sum of square loadings4.0632.1231.683
Proportion variance0.2030.1060.084
Cumulative variance0.2030.3090.393
Factor interpretationWalking preferenceCar preferenceTravel altitude to trip convenience
Table 5. Linear regression model for change in driving. Explanatory variables measure differences between the Greek and US contexts (e.g., higher values of the variable ‘Long travel time to the city center’ indicate longer travel time to the city center in the Greek context).
VariableDriving
βt-Valuesig.
Intercept2.6254.377***
Own car in GR but not in US1.6682.417*
Difference in number of children (GR–US)1.7112.568*
Higher income in GR than in US1.2032.291*
High levels of congestion in major urban arteries−0.284−1.700
Long travel time to the city center0.3132.630*
Pavements—easy walking routes throughout the neighbourhood−0.130−1.378
Good cycle facilities within neighbourhood and towards adjacent areas−0.287−2.445*
High cost of public transport use (e.g., single ticket, monthly pass)0.3401.784.
R-squared0.79
F-stat8.322
Sig. codes: 0 ‘***’ 0.001 ‘**’ 0.01 ‘*’ 0.05 ‘.’ 0.1 ‘ ’.
Table 6. Linear regression model for change in biking. Explanatory variables measure differences between the Greek and US contexts (e.g., higher values of the variable ‘Safe biking conditions’ indicate safer biking conditions in the Greek context).
VariableBiking
βt-Valuesig.
Intercept4.68911.921***
Own car in GR but not in US−0.596−1.506
Difference in number of children (GR–US)−1.485−3.615**
Pavements—easy walking routes throughout the neighbourhood−0.149−2.051.
High cost of public transport use (e.g., single ticket, monthly pass)0.1811.532
Easy access to other amenities/facilities (community/leisure centre, facilities for children, local shops such as groceries, bakeries, coffee shops)0.1501.525
Low level of car traffic on neighbourhood streets−0.181−1.990.
Safe biking conditions0.6537.343***
High population density−0.173−1.817.
Nice architectural design of residential, civic buildings and/or street furniture0.1211.269
Lots of interaction among neighbors0.1561.413
R-squared0.80
F-stat10.46
Sig. codes: 0 ‘***’ 0.001 ‘**’ 0.01 ‘*’ 0.05 ‘.’ 0.1 ‘ ’.
Table 7. Linear regression model for change in walking. Explanatory variables measure differences between the Greek and US contexts (e.g., higher values of the variable ‘Easy access to a district shopping center’ indicate easier access to a district shopping center in the Greek context).
VariableWalking
βt-Valuesig.
Intercept4.5829.456***
Higher income in GR than in US−0.919−1.992.
Difference in number of children (GR–US)1.1592.048.
Own bike in GR but not in US4.2275.091***
Difficult access to central arteries−0.456−3.725**
Easy access to public transport services (bus/trolley/tram/metro/rail)0.1161.491
Good cycle facilities within neighbourhood and towards adjacent areas0.2022.085.
Easy access to a district shopping center (AB, Carrefour, etc.)0.2952.406*
Safe driving conditions−0.341−2.448*
Economic level of neighbors similar to my level0.8085.050***
R-squared0.72
F-stat8.506
Sig. codes: 0 ‘***’ 0.001 ‘**’ 0.01 ‘*’ 0.05 ‘.’ 0.1 ‘ ’.

