Residential Spatial Differentiation Based on Urban Housing Types—An Empirical Study of Xiamen Island, China


1
Key Laboratory of Urban Environment and Health, the Institute of Urban Environment, Chinese Academy of Sciences, Xiamen 361021, China
2
Key Laboratory of Guangdong for Utilization of Remote Sensing and Geographical Information System, Guangzhou Institute of Geography, Guangzhou 510070, China
3
University of Chinese Academy of Sciences, Beijing 100049, China
4
Department of Geosciences and Natural Resource Management, Faculty of Science, University of Copenhagen, Copenhagen 1958, Denmark
*
Author to whom correspondence should be addressed.
Sustainability 2017, 9(10), 1777; https://doi.org/10.3390/su9101777
Submission received: 23 August 2017
/
Revised: 26 September 2017
/
Accepted: 28 September 2017
/
Published: 30 September 2017
(This article belongs to the Section Sustainable Urban and Rural Development)
Abstract
:Residential spatial differentiation, also called residential segregation, is a representation of the differentiation of social stratum in economic income, social status, education degree, lifestyle, and other aspects, based on an urban geographical space. In this paper, Xiamen Island is taken as example to calculate the dissimilarity index and the multi-group dissimilarity index at three scales (districts, sub-districts, and communities) by using the land area, population size, and green space area of different housing types. The characteristics of residential differentiation are analyzed. It is found that both spatial differentiation and multi-group spatial differentiation have significant scale effects. The smaller the scale of the spatial statistics unit, the larger the spatial differentiation and multi-group spatial differentiation. Significant differences are found in residential differentiation among different housing types. The residential differentiation is, not only demonstrated in land area and population size, but also in the resources of green space. More importantly, a balanced allocation of green space will help to reduce the degree of residential differentiation. With urban expansion and social-economic development, residential spatial differentiation will likely change. An understanding of residential differentiation is a guide for urban master planning and detailed regulatory planning. It will help to promote social harmonious development and urban sustainable development by the reasonable configuration of land and resources.
1. Introduction
In recent years, urban socio-spatial differentiation has been widely studied in many cities [1,2,3,4], which is helpful to understand urban spatial and social structures. Residential spatial differentiation, also called residential segregation, refers to the differentiation of socio-economic characteristics that are expressed in, and shaped through, the organization of residential space [5,6].
In western countries, residential differentiation is usually about race, ethnicity, and religion. For example, Black-White segregation has been extensively studied in metropolitan America [2,7,8,9]. Johnston performed a comparative analysis of levels of ethnic residential segregation across five countries; Australia, Canada, New Zealand, the United Kingdom, and the United States of America [3]. Moderate levels of ethnic segregation also exist in most European cities [10,11].
In China, residential differentiation usually lies in indicators of class, income, wealth, and other aspects. Large cities such as Beijing, Shanghai, and Guangzhou have been widely studied [4,12,13]. For example, residential differentiation between the local and migrant elderly was analyzed based on social and physical resources at the community level [12]. Residential differentiation between social groups was found based on population census data at the community level [1,14].
With the development of science and technology, the availability of big data has greatly increased. In recent years, some literature indicates that people experience differentiation, not only in their residential neighborhoods, but also in their daily activities, physical mobility, or social networks [15,16]. For instance, spatial differentiation in shopping and leisure activity centers was analyzed in Seoul, South Korea [17]; segregation at workplaces for newly-arrived immigrant men and women was investigated in Sweden [18]; and activity differentiation, based on daily life experiences in terms of activity space, was studied in Hong Kong [19]. It greatly enriches the research content of differentiation. However, most previous studies usually measure residential differentiation by a dissimilarity index using population data [1,7,20]. To conduct new empirical studies in cities around the world by using new types of data from different scales is encouraging.
We think different housing types can reflect residential differentiation to some extent because housing symbolizes a social class of urban residents [21]. Housing in China was tightly controlled and characterized by a strong link between housing allocation and place of employment (and status within the workplace) under China’s planned economy [22]. Since 1978, China has embarked on a historic transition from a planned economy to a market economy. In the course of this, urban housing reform began in 1979 in selected cities and then extended nation-wide in 1988 [23,24]. With the development of a market economy, housing in work units was sold to staff and people could buy housing in the private market. Since the market-oriented housing system was established in 1998, house purchasing by individuals has become popular and housing prices in China have increased rapidly [25]. For now, housing has become the most important asset and the largest cost for a family in China [26].
In this study, residential differentiation is analyzed based on the distribution of different housing types at the district, sub-district, and community scales, not only from population aspects, but also from other aspects such as land area and resources area. Unlike most previous studies [3,11,12,14], which conduct residential differentiation only from single aspect or single scale, this paper aims to analyze urban residential differentiation from multi-scales and multi-aspects. Xiamen was selected because it was designated as one of the first four Special Economic Zones in China in 1980 and it has experienced housing reform over the past three decades. The empirical study of urban residential differentiation will provide methods and references for the scientific planning of urban planning and sustainable development strategies.
2. Materials and Methods
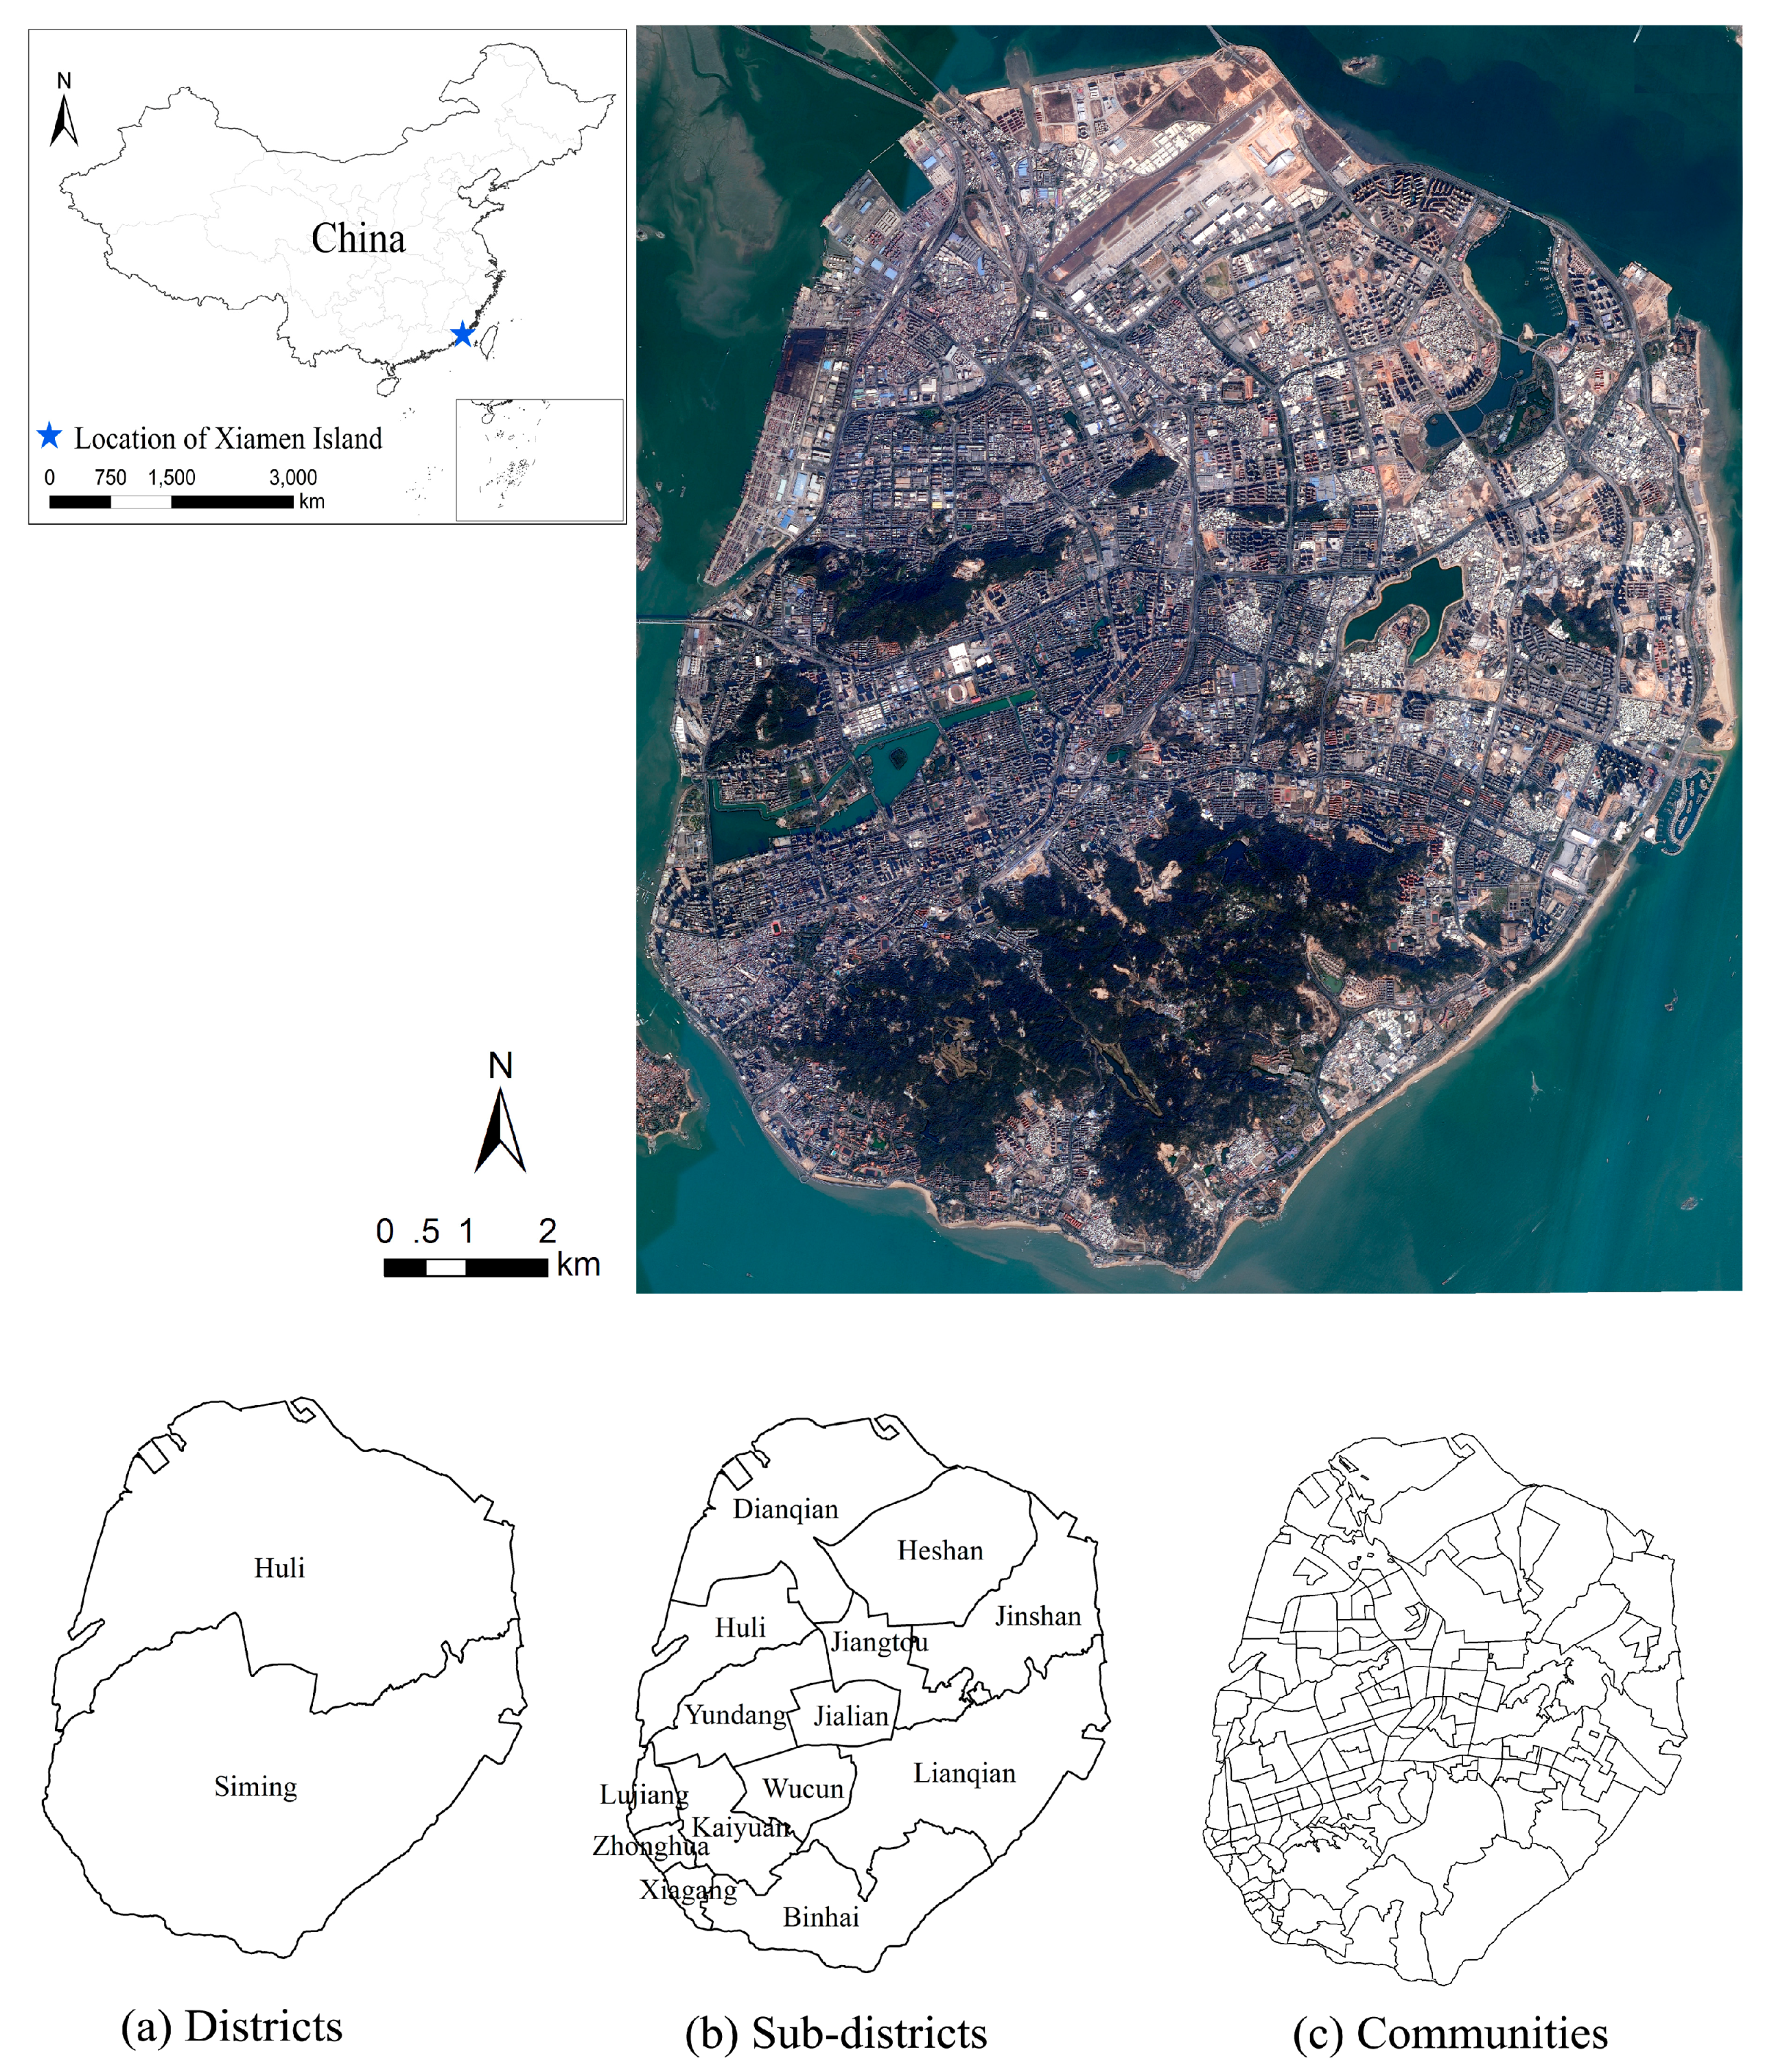
2.1. Study Area
In this paper, Xiamen Island (central urban area of Xiamen city) was chosen as a case study (Figure 1). It is located in Southeast China at a latitude of 24°25′N to 24°33′N and a longitude of 118°04′E to 118°12′E. It is a roughly circular island, covering two districts (Siming and Huli), 14 sub-districts (Lujiang, Zhonghua, Xiagang, Kaiyuan, Yundang, Jialian, Wucun, Lianqian, and Binhai are under the jurisdiction of Siming District, Huli, Jiangtou, Jinshan, Heshan, and Dianqian are under the jurisdiction of Huli District), and 143 communities.
Xiamen Island has a total area of 14,253.78 ha. On the land-use map in 2014, the main land use types of Xiamen Island were residential land and forest, taking 25.22% and 18.48% of the entire island. Bare land, road, and industrial land dominated 12.72%, 12.55%, and 11.29% of the land, respectively. In addition, there was some park, commercial land, public facilities land, water, and public service land, which accounted for 5.75%, 4.06%, 3.95%, 3.55%, and 2.42% of the total area, respectively.
There is a registered population of 1.90 million in Xiamen Island. Siming district has 0.96 million, and Huli district has 0.94 million. The most populous sub-district is Jiangtou, with a population of 310,116. The least-populated sub-district is Zhonghua, with a population of 37,791.
2.2. Data Resources
We collected the land-use map of Xiamen Island from the Xiamen Municipal Bureau of Land Resources and Real Estate Management, which was produced from Pleiades images in 2014. The land use types include forest, park, road, water, residential land, commercial land, industrial land, public service land, public facilities land, and other land (bare land). It is used to extract residential lands.
We gathered the population data of 2014 based on communities from the Xiamen Statistical Bureau, which is the resource to calculate the population size of different housing types.
A set of Chinese high-resolution satellite (GF-1) remote sensing images (22 January 2014) were acquired and processed. The GF-1 images include a panchromatic image with a 2 m resolution and a multi-spectral image with an 8 m resolution [27,28]. The 8-m multi-spectral image and the 2-m panchromatic image can be fused to get a new image containing blue, green, red, and near infrared bands at a resolution of 2 m. It is used to obtain green space in this study.
2.3. Methods
2.3.1. Field Investigation
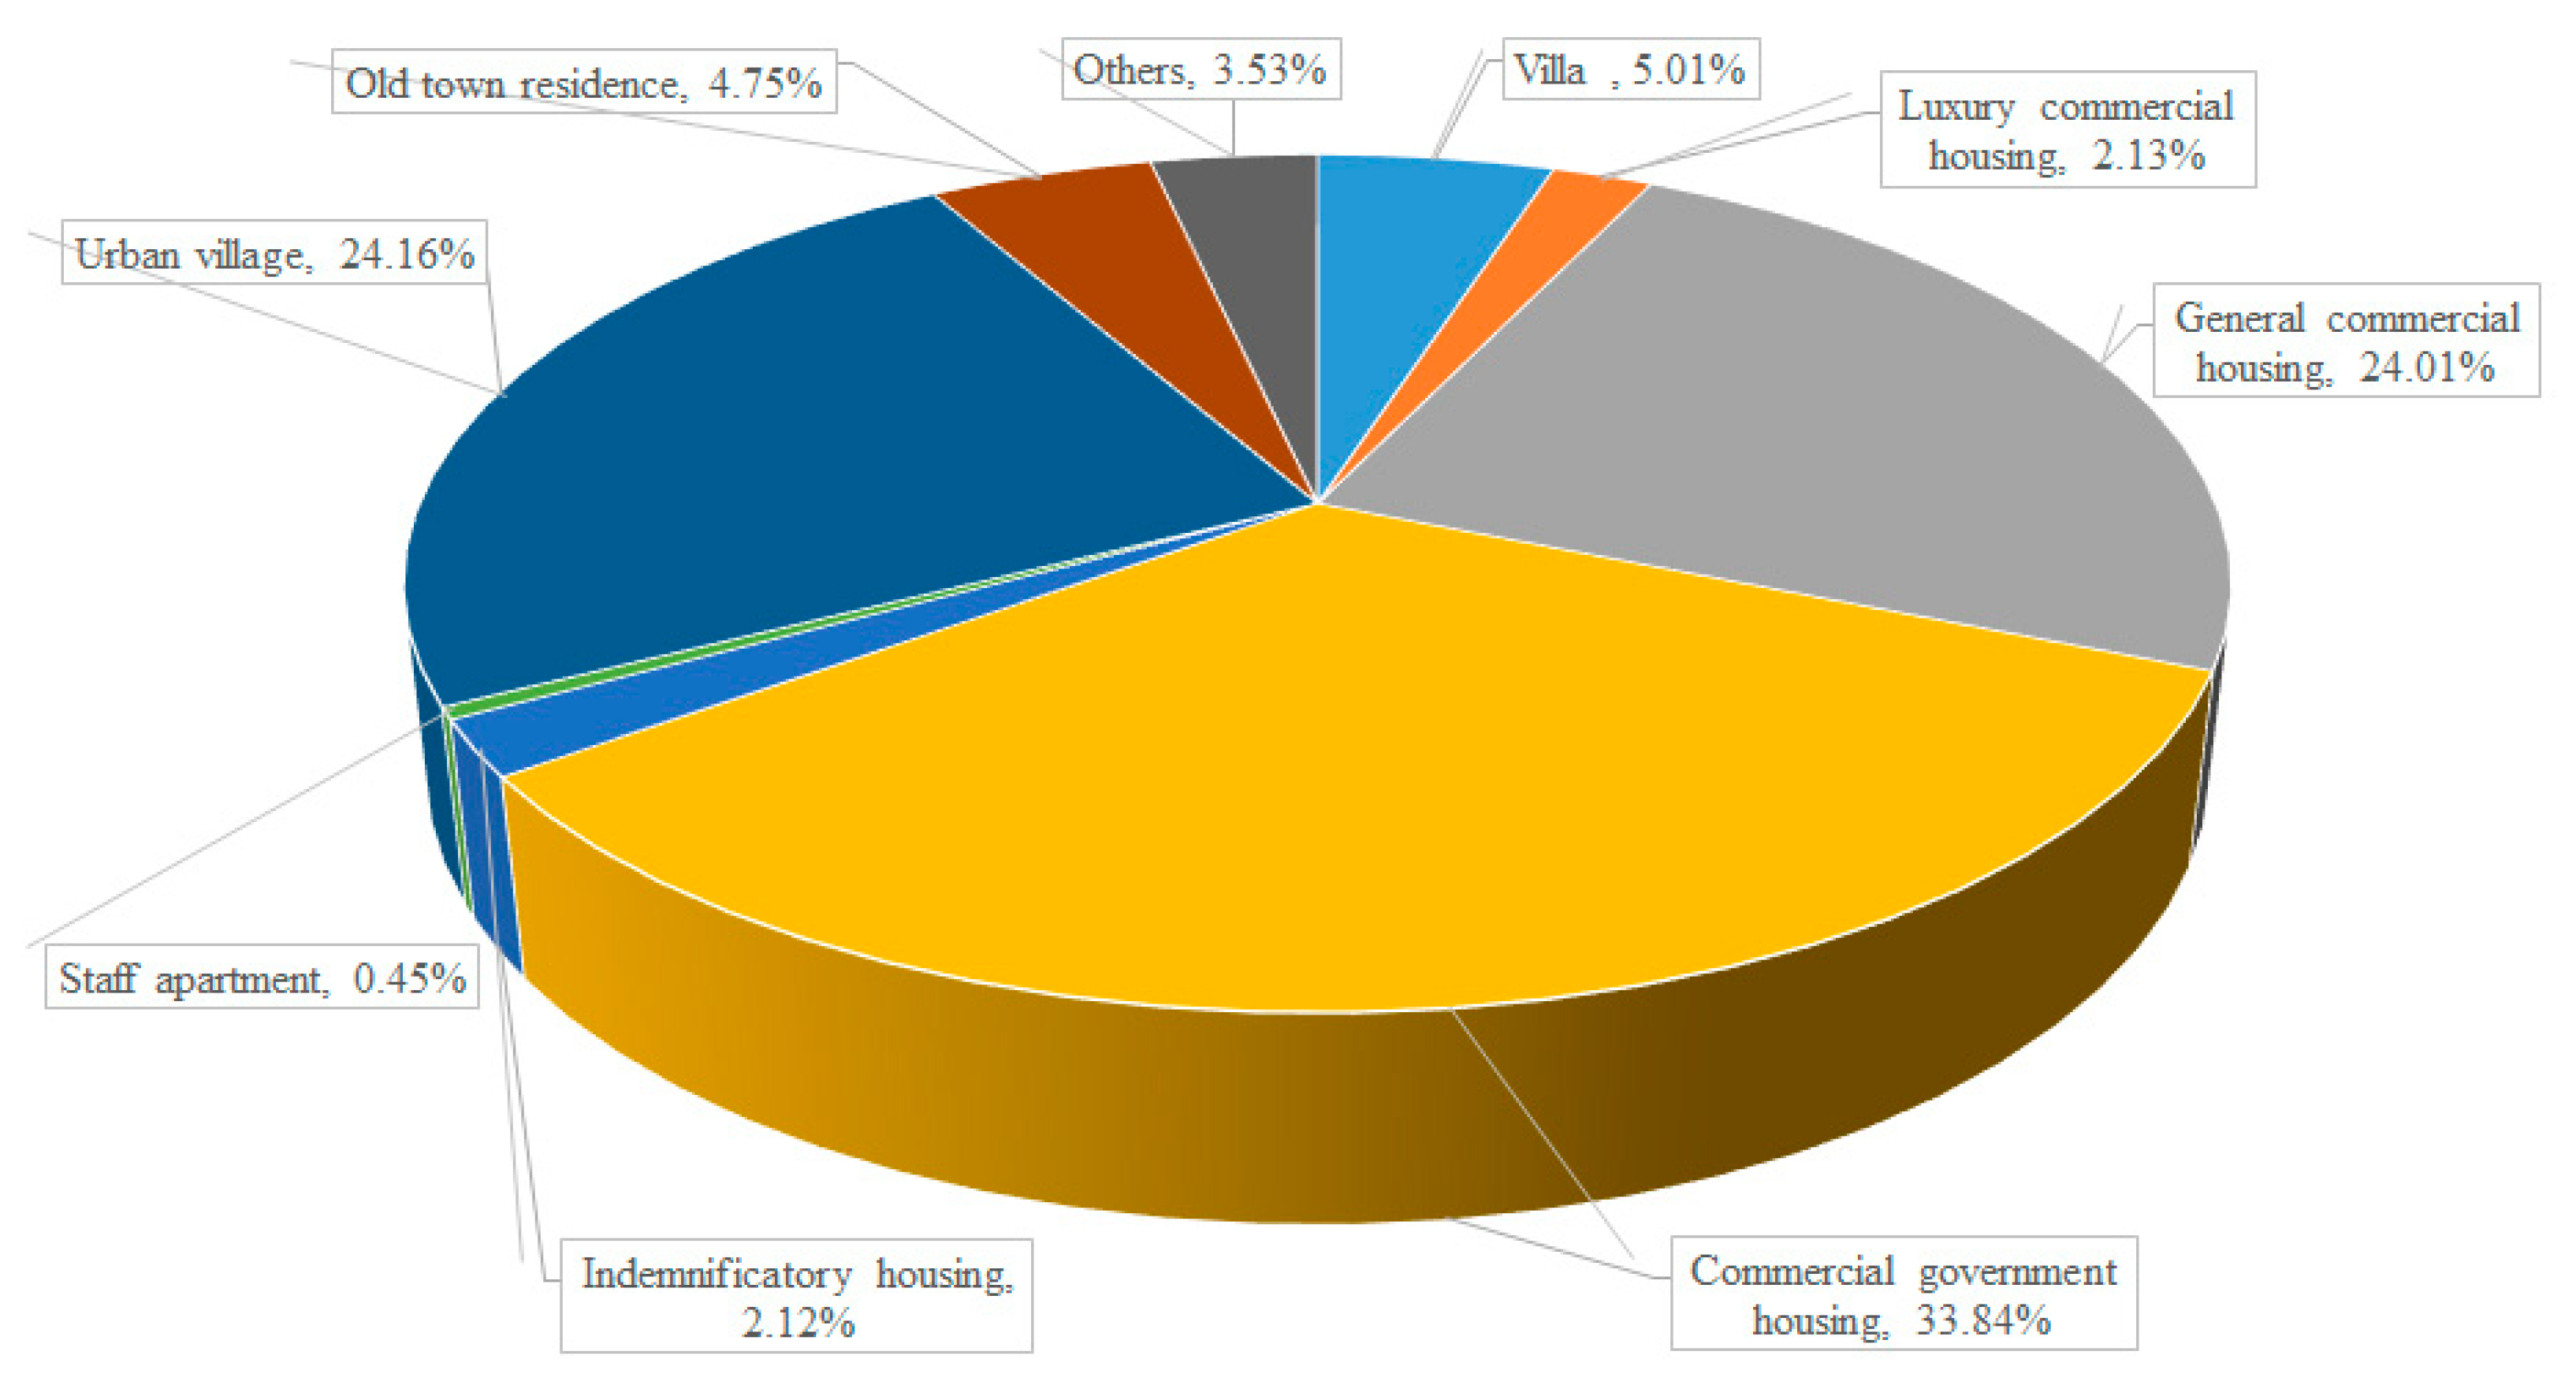
According to the field investigation, we divided the residential lands into villa, staff apartment, luxury commercial housing, commercial government housing, indemnificatory housing, general commercial housing, old town residence, urban village, and others. The classification is described in Table 1.
The overall distribution of housing types in Xiamen Island is shown in Figure 2.
2.3.2. Green Space Extraction
The Normalized Difference Vegetation Index (NDVI) is a commonly used spectral index to extract greenery, which is defined as the difference between the Near-Infrared (NIR) and Visible (VIS, generally red) bands divided by their sum [29,30,31]. It was used to extract urban green vegetation information by using Formula (1) and a threshold of 0.1.
where is band 5 of the GF-1 image and denotes band 4 of the GF-1 image.
2.3.3. Overlay Analysis
We consider that the population of communities (Figure 3) is concentrated on residential lands, so the residential population density of a community (population divided by the relevant residential land area of the community) could be analyzed. Then the population of separate residential land was calculated, which was overlaid with housing types to acquire the population distribution of separate housing types. At last, we calculated and analyzed the residential population density of different housing types by dividing the population by the relevant area of a certain housing type.
We define green space within residential lands as residential green space, so the green vegetation extracted by NDVI could be overlaid with residential lands to obtain the residential green space (Figure 4). On this basis, green space rate was calculated by dividing the green space area by the relevant area of a certain housing type.
All the overlay analyses were conducted in ArcGIS 10.3.
2.3.4. Residential Spatial Differentiation Analysis
The dissimilarity index () is used to quantitatively measure the urban differentiation of certain residential types in terms of land area, population quantity, and green space resources [7,32]; the descriptions and related formulas are shown in Table 2.
The dissimilarity index indicates the residential differentiation of a certain housing type in terms of land areas, population size, and green space resources. To calculate the residential differentiation of the total residential landscape, the multi-group dissimilarity index () should be used [31,32]; its descriptions and related formulas are shown in Table 3.
The value of ranges from 0 (no differentiation) to 1 (total differentiation). A greater value indicates a greater degree of residential differentiation. Normally, indicates a low degree of differentiation, indicates moderate differentiation, and indicates high differentiation [33,34]. In this study, , , and were calculated based on district, sub-district, and community scales, respectively. In order to analyse the general characteristics of the residential differentiation of different housing types, , , and at different scales were averaged separately.
The numerical range and meaning of are the same as those of . In this study, , , and were calculated based on district, sub-district, and community scales, respectively, and they were also averaged separately to represent the characteristics of the residential differentiation of the entire residential landscape.
2.3.5. Statistical Analysis
3. Results
3.1. The Statistical Analysis of Dissimilarity Index
The results of residential differentiation from multi-scales are shown in Table 4.
One-Way ANOVA analysis showed that a significant difference was found in the residential differentiation (F = 6.012, p < 0.05) between different housing types. From the results of a LSD test (Table 5), the housing types could be classified into four groups. Group A includes villas, luxury commercial housing, indemnificatory housing, and staff apartments, which did not show a significant difference between them. Group B includes general commercial housing and commercial government housing, which had significant differences compared to Group A. Group C is urban villages and Group D is old town residences. Both of these did not show a significant difference from Group A, but the difference between them was significant statistically.
3.2. Characteristics of Residential Differentiation Based on Dissimilarity Index
The results of the average dissimilarity indexes are shown in Table 6.
3.2.1. Land Differentiation
The average dissimilarity indexes of old town residences, staff apartments, and indemnificatory housing based on land area are above 0.6; the average dissimilarity indexes of luxury commercial housing, villas, and urban villages based on land area are between 0.3 and 0.6; and the average dissimilarity indexes of commercial government housing and general commercial housing based on land area are below 0.3.
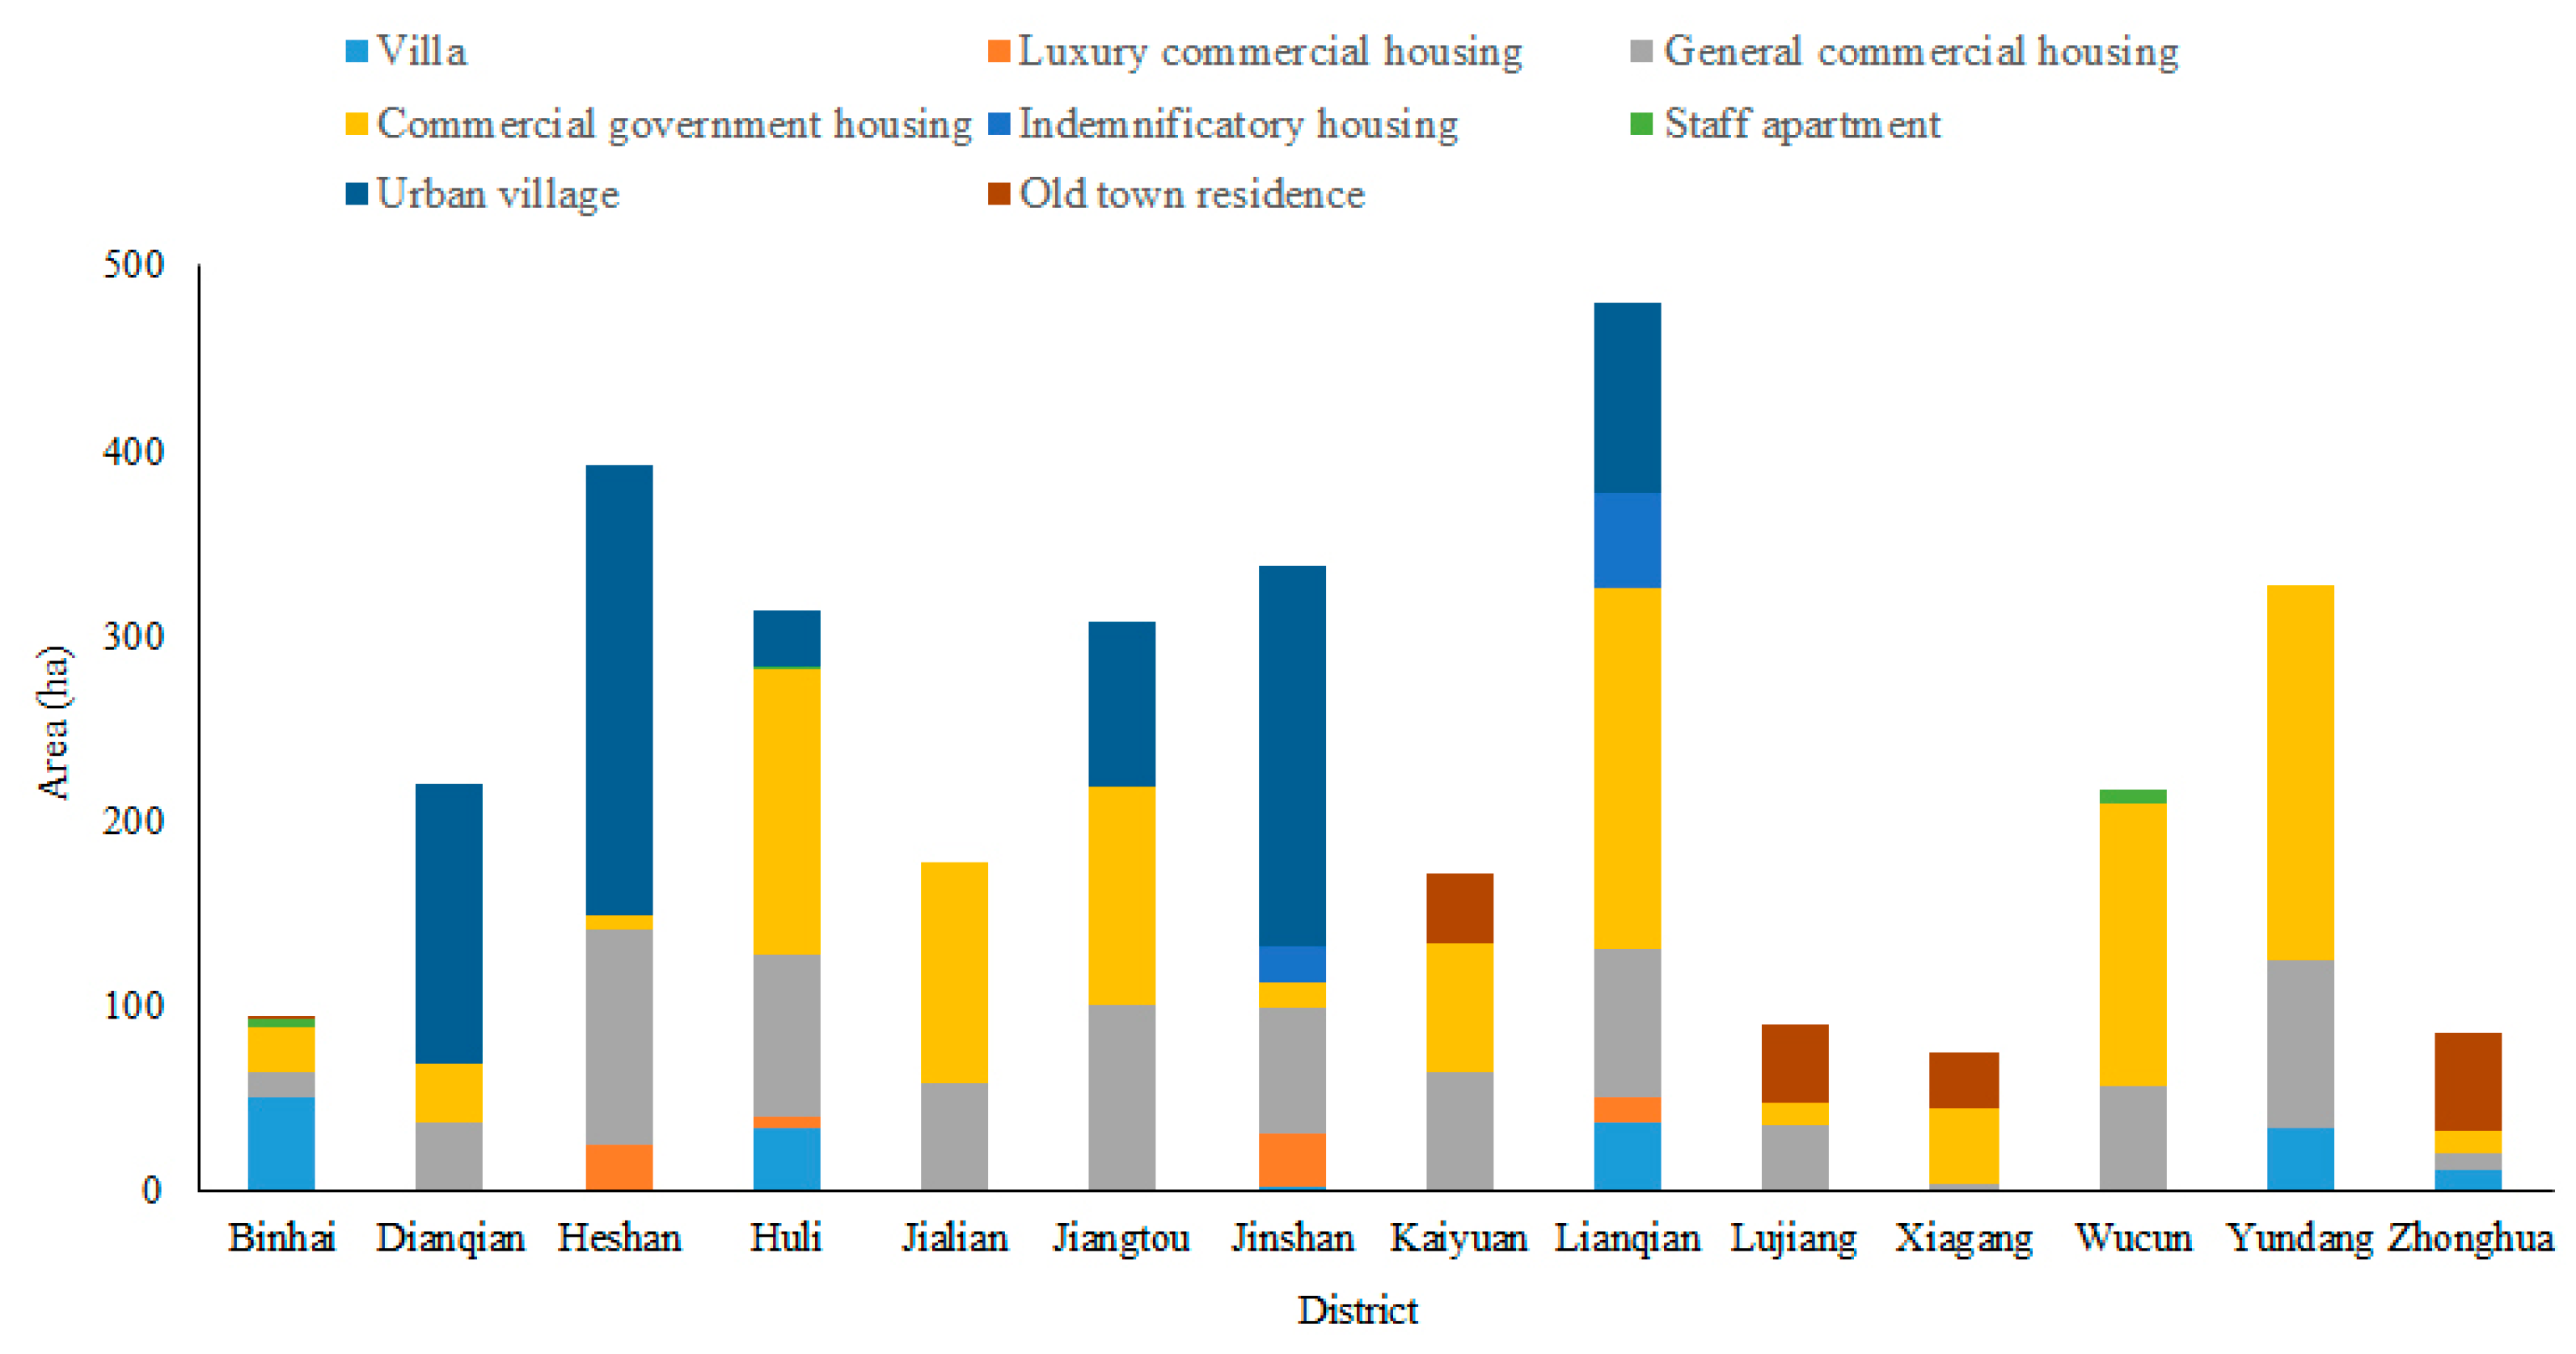
Xiamen Island has a total residential landscape area of 3408.18 ha. From the structure of the residential landscape (Figure 5), the dominant housing types are commercial government housing (1153.25 ha), general commercial housing (818.18 ha), and urban villages (823.52 ha). These accounted for 82.01% of the total residential land area. However, in terms of spatial distribution, commercial government housing and general commercial housing are dispersed in every district, every sub-district, and every community, while urban villages are mainly centralized in the sub-districts of Dianqian, Heshan, Jinshan, Jiangtou, and Lianqian (Figure 6). Consequently, the land-differentiation of urban villages will be higher than that of commercial government housing and general commercial housing. Villas (170.62 ha) and luxury commercial housing (72.75 ha) have small land use areas, both of which account for 7.14% of the total residential landscape area. They are unevenly distributed, mainly in the sub-districts of Binhai, Huli, Jinshan, Heshan, and Lianqian, with average dissimilarity indexes of 0.55 and 0.60, belonging to a medium degree of differentiation. The areas of indemnificatory housing (72.25 ha), staff apartments (15.45 ha), and old town residences (161.88 ha) are small, and the three accounted for only 7.32% of the total residential landscape, but each of them has a concentrated distribution. It can been seen in Figure 6 that indemnificatory housing is mainly distributed in Jinshan and Lianqian, staff apartments are mainly distributed in Wucun and Binhai, and old town residences are mainly distributed in Zhonghua, Lujiang, Kaiyuan, and Xiagang; therefore, their average dissimilarity indexes will be high, with high land-differentiation.
3.2.2. Population Differentiation
The average dissimilarity indexes of staff apartments, old town residences, indemnificatory housing, luxury commercial housing, and villas based on population are above 0.6; the average dissimilarity index of urban villages based on population is between 0.3 and 0.6; the average dissimilarity indexes of commercial government housing and general commercial housing based on population are below 0.3.
It can been seen from the structure of the residential landscape (Figure 7) that most people are living in commercial government housing and general commercial housing (655,200), urban villages (584,200), and general commercial housing (400,300). The population of these three accounted for 86.14% of the total population, but, because the population of commercial government housing and general commercial housing is dispersed in every district, every sub-district, and every community, the related population differentiation will be at a low degree. Compared to the population of commercial government housing and general commercial housing, the population of urban villages is not only large but also mainly concentrated in the sub-districts of Dianqian, Heshan, Jinshan, Jiangtou, and Lianqian, and there is very large difference among these sub-districts. For example, Dianqian (174,900) and Jiangtou (155,000) have the largest populations; thus, the average population dissimilarity index of villages is higher than that of commercial government housing and general commercial housing, with a medium degree of population differentiation. Staff apartments (19,000), old town residences (98,800), indemnificatory housing (23,400), luxury commercial housing (12,500), and villas (75,700) are relatively small in terms of population and only account for 12.05% of the total population. More importantly, each of them is concentrated in a few sub-districts; for instance, the population of staff apartments in Binhai reaches 15,700, while the population of old town residences in Lujiang and Zhonghua reaches 59,400; therefore, the average population dissimilarity indexes of these housing types will be high, with high population differentiation.
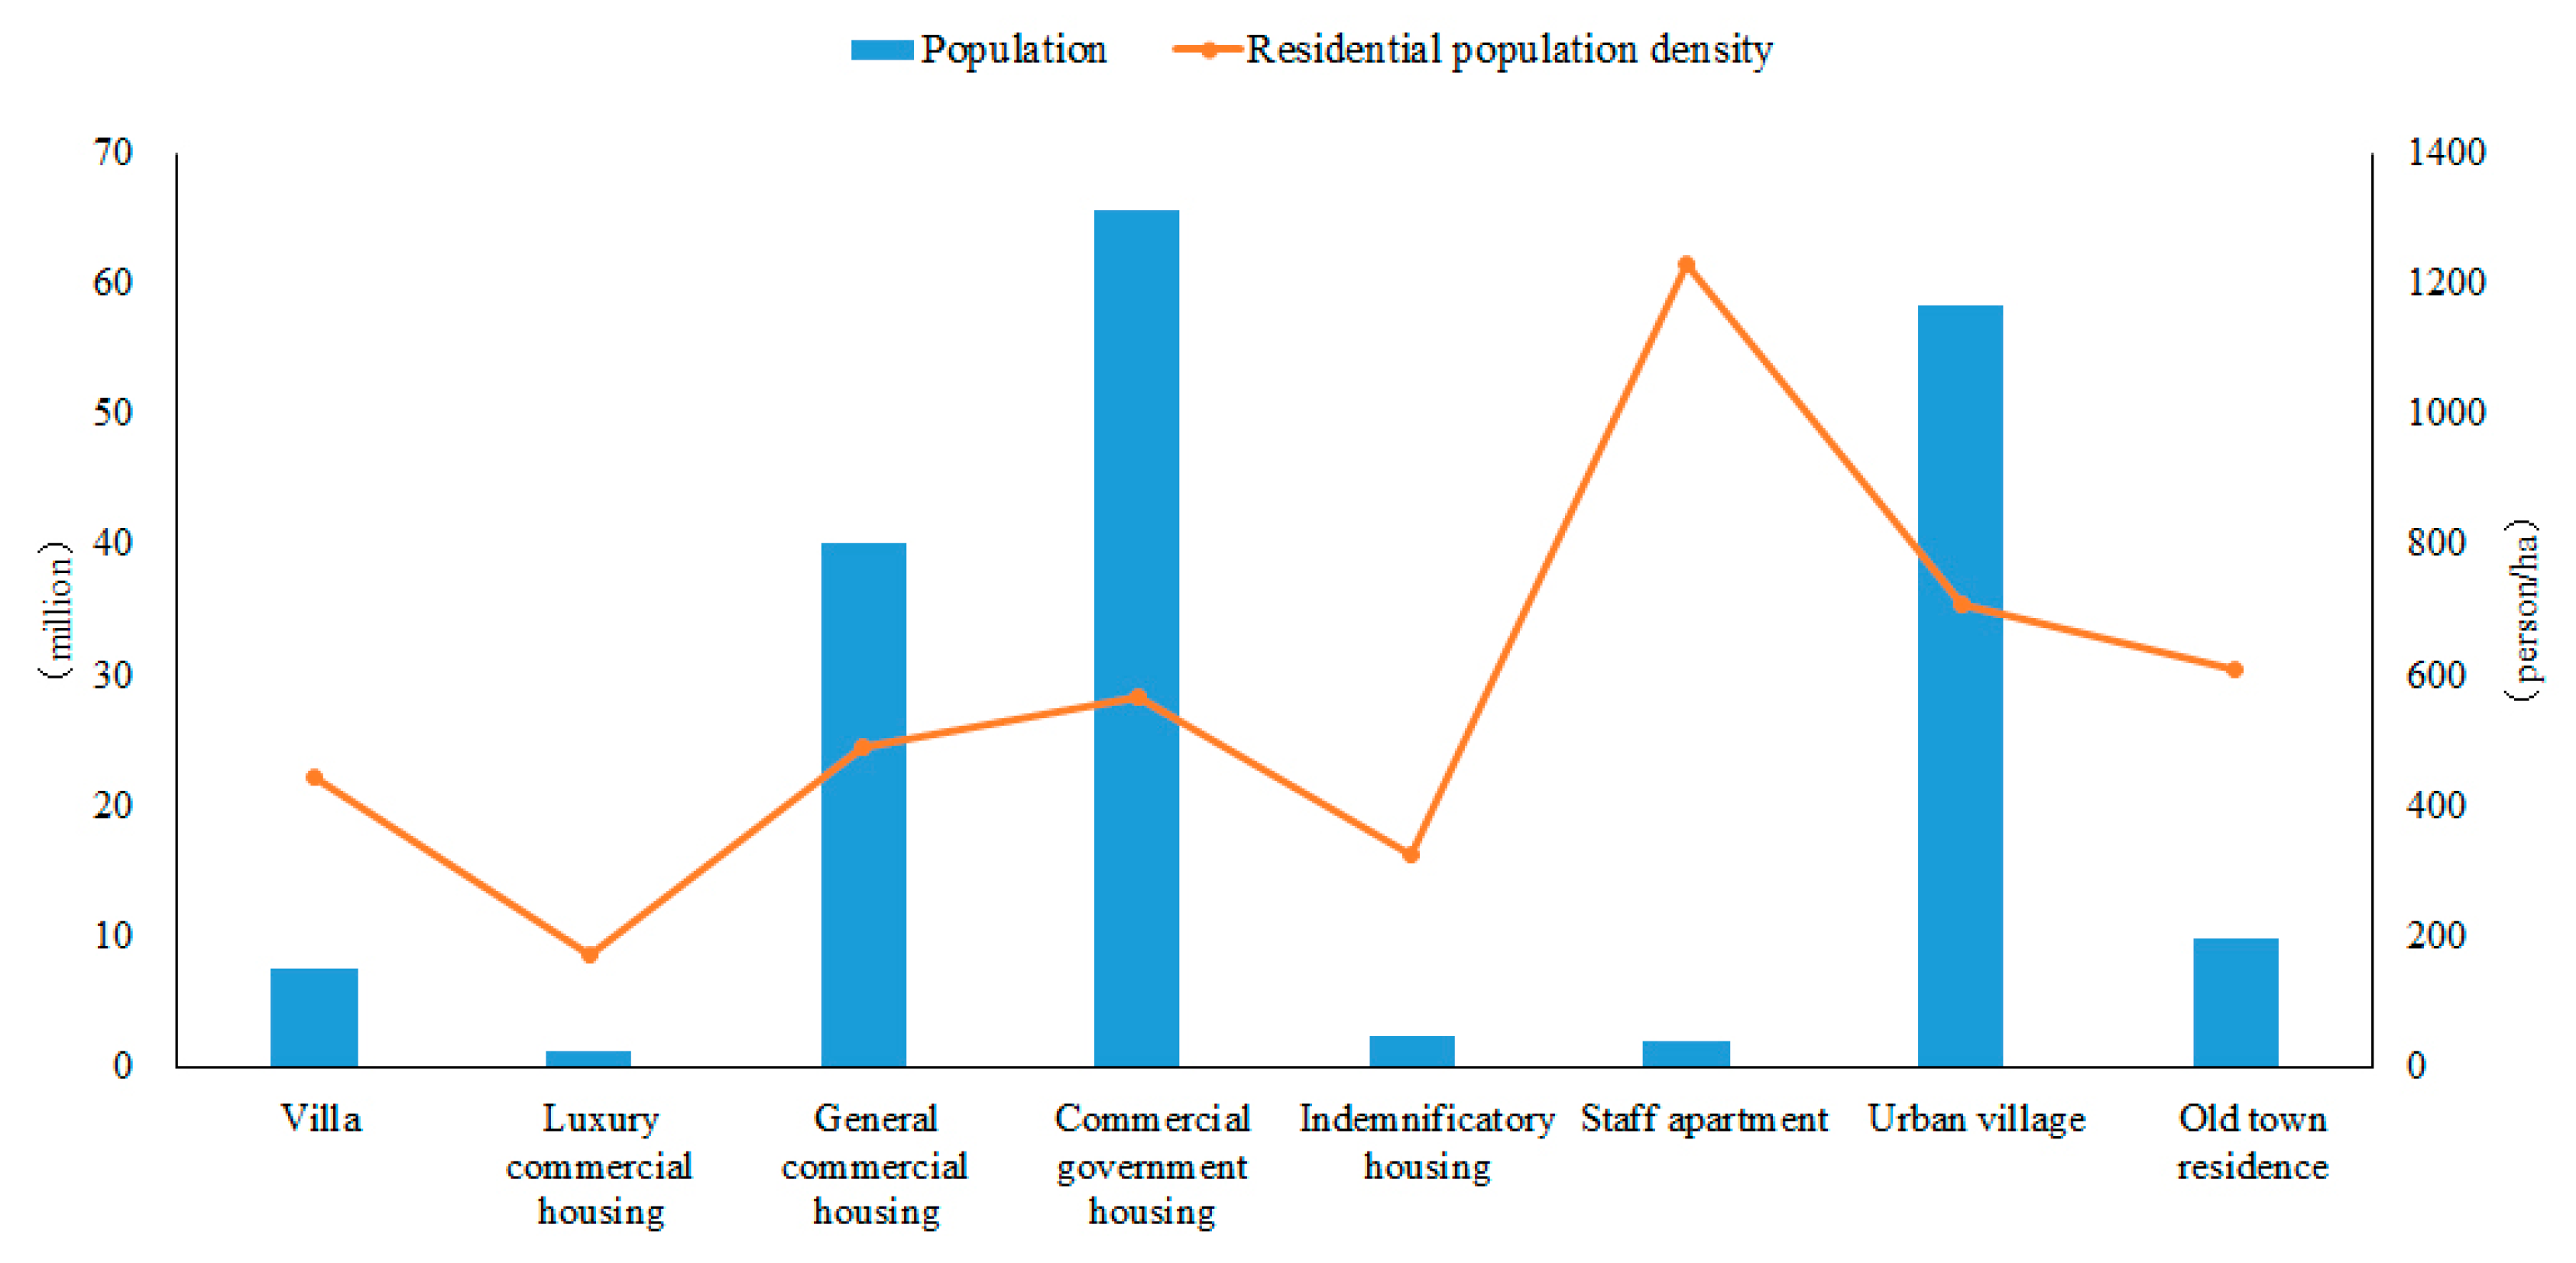
The results of the residential population density of different housing types are shown in Figure 8. As calculated, the average population density of the residential landscape in Xiamen Island is 558 persons/ha, while the density of staff apartments is as high as 1228 persons/ha, which is 2.20 times that of the entire residential population density; the residential population densities of urban villages and old town residences are, respectively, 709 persons/ha and 610 persons/ha, while the population density of luxury commercial housing is only 172 persons/ha. This demonstrates that there is a great difference in the residential population density between different housing types, which also reflects a certain spatial differentiation of population.
3.2.3. Green Space Differentiation
The average dissimilarity indexes of old town residences, luxury commercial housing, staff apartments, and urban villages based on residential green space are above 0.6; the average dissimilarity indexes of indemnificatory housing and villas based on residential green space are between 0.3 and 0.6; and the average dissimilarity indexes of commercial government housing and general commercial housing based on residential green space are below 0.3.
The statistical results show that there is 565.46 ha of residential green space in Xiamen Island. It can been seen from the structure of green space (Figure 9) that most green space is distributed mainly in commercial government housing (237.51 ha), general commercial housing (144.01 ha), and villas (76.84 ha), and they occupy 81.06% of the total residential green space. However, green space in commercial government housing and general commercial housing is spread over residential lands, and they are relatively evenly distributed, while the green space of villas is mainly in the sub-districts of Binhai (25.62 ha), Huli (17.62 ha), Lianqian (12.56 ha), and Yundang (11.92 ha); therefore, the average green space dissimilarity index of villas is higher than that of commercial government housing and general commercial housing. Accordingly, the green space differentiation of villas is of a medium degree, while the green space differentiation of commercial government housing and general commercial housing belongs to a low degree. The total amount of residential green space in urban villages (38.85 ha), old town residences (14.98 ha), luxury commercial housing (14.11 ha), indemnificatory housing (12.20 ha), and staff apartments (5.16 ha) is small, which only accounts for 15.08% of the total green space areas. Since each of these is concentrated in a few sub-districts, the average green space dissimilarity indexes of these housing types will be high, except for indemnificatory housing, which is of a medium degree.
The spatial differentiation of green space is, not only demonstrated in the areas, but also reflected in the green space rate. The minimum standard of green space rate is 30% in urban planning in China. From these results, which are shown in Figure 10, it can be seen that only the green space rates of villas and staff apartments are more than 30%, while the green space rates of urban villages and old town residences are less than 10%. Thus, the green space rates of different housing types have obvious differences between them.
3.3. Characteristics of Residential Differentiation Based on the Multi-Group Dissimilarity Index
The statistical results of the multi-group dissimilarity index are shown in Table 7.
The results of the multi-group dissimilarity indexes from different scales reflect that residential differentiation is, not only manifested in the distribution of land area and population size, but also in the allocation of green resources. From the average residential differentiation of the entire residential landscape, it can be seen that the multi-group dissimilarity index of residential land area in Xiamen Island is 0.52, and it is 0.54 and 0.49 for population size and green space area, respectively. Hence, compared with residential land area, the average multi-group dissimilarity index of population size increases by 0.02, while the average multi-group dissimilarity index of green space area decreases by 0.03. The multi-group dissimilarity indexes of land area, population size and green space area indicate that an imbalanced population distribution exacerbates residential differentiation under existing residential landscape patterns, while a relatively balanced allocation of green space within residential land eases residential differentiation to a certain extent.
3.4. The Scale Effect of the Dissimilarity Index and the Multi-Group Dissimilarity Index
The scale effect of the dissimilarity index is shown in Figure 11.
For each dissimilarity index of different residential types, whether it is , , or , the highest spatial differentiation states are on the community scale, and the lowest spatial differentiation states are on the district scale, while the spatial differentiation is between the two on the sub-district scale. It can be seen that residential differentiation has an obvious scale effect [37]; the smaller the scale of the statistical unit, the larger the corresponding residential differentiation.
From Table 7, we can see that there is also a significant scale effect on the multi-group dissimilarity indexes within land area, population size, and green space. As a result, the value of the multi-group dissimilarity index gradually increased as the spatial statistics area units decreased. From the district scale to the sub-district scale, , , and increased by 61.53%, 44.07%, and 90.11%, respectively; from the sub-district scale to the community scale, , , and increased by 53.87%, 48.82%, and 67.76%, respectively.
4. Conclusions and Discussion
Based on the case area of Xiamen, China, this study focused on residential differentiation at different scales. Based on residential land distributions, population size, and green space, the dissimilarity index and the multi-group dissimilarity index from multi-scales (districts, sub-districts, and communities) were estimated, and the spatial differentiation of each housing type and the entire residential landscape were analyzed. The results showed that there were obvious scale effects on the dissimilarity index and multi-group dissimilarity index. The smaller the scale of the spatial statistics unit, the larger the spatial differentiation and multi-group spatial differentiation. Residential differentiation was not only demonstrated in land area and population size but also in the resource of green space. For the entire residential landscape of Xiamen Island, the rank of average residential differentiation was > > . For the separate housing types on Xiamen Island, a significant difference was found in residential differentiation. Commercial governmental housing and general commercial housing had low degrees of spatial differentiation; luxury commercial housing, indemnificatory housing, villas, and urban villages had a medium degree of spatial differentiation; and old town residences and staff apartments had high spatial differentiation.
Residential spatial differentiation (residential segregation) was accompanied by the differentiation of urban class because social class, in any social form, will not be eliminated; therefore, residential differentiation must exist as a social phenomenon [16]. If land differentiation is viewed as basic residential differentiation, population distribution promotes basic residential differentiation and the resource of green space within a residential landscape diminishes it. These results demonstrate the importance of resource allocation.
Although the market economy of real estate determines the different social classes living in different communities, the needs for housing from different classes have been correctly matched. For instance, wealthy people can buy a villa or luxury commercial housing; people who can afford a mortgage can buy general commercial housing or commercial government housing; and people who cannot afford a mortgage can apply for indemnificatory housing or a staff apartment. Thus, appropriate residential differentiation meets the needs of different social classes, which will promote the healthy development of a city. However, excessive residential differentiation will bring unfair allocation of public resources, increasing social stratification and fomenting social tension. Since residential differentiation is a double-edged sword, controlling the degree of residential differentiation is significant for city managers. The results of this study reflect that Xiamen Island has concentrated distributions of old town residences and staff apartments and homogenous distributions of commercial governmental housing and general commercial housing. During the urban expansion, if old town residences experience no rebuilding, their distribution will be more and more concentrated and the spatial differentiation will be higher and higher. Since most people can afford commercial governmental housing and general commercial housing, their homogenous distribution shows that the planning and construction of residential land is reasonable for considering the needs of most residents. However, the high spatial differentiation of staff apartments needs government attention.
With urban development, the composition and structure of residential land will change, thus affecting urban residential differentiation. Understanding the status and characteristics of urban residential differentiation can provide a reference for urban master planning and detailed regulatory planning, which is conducive to the social development of harmony and stability, as well as the healthy development of a city. Urban planning usually sets several construction indicators, involving the distribution of land use, population control, and green space construction [38,39]. According to the results of this study, residential differentiation is influenced by the indicators of size, type, and the distribution of residential land in a city, which should be well-controlled by urban master planning at different scales. In this way, serious residential differentiation due to the agglomeration of certain housing types will be avoided. Public resources within residential land should be rationally allocated and balanced in detailed regulatory planning so as to alleviate the degree of existing residential differentiation.
Acknowledgments
The authors are grateful for the support of the National Science Foundation of China (41371540, 41671444), the Science Foundation of Fujian Province (2015J05086), the Science and Technology Planning Project of Guangdong Province (2017A020217005, 2016A020222006, 2015A030401069), and Guangdong Academy of Sciences’ Scientific Platform and Innovation Capability Construction (2016GDASPT-0103) and Special Project of Science and Technology Development (2017GDASCX-0101).
Author Contributions
Caige Sun, Tao Lin, Yu Zhao, Meixia Lin, and Zhaowu Yu worked collectively. Specifically, Tao Lin developed the original idea for the study and conducted the organization of the content. Caige Sun calculated the dissimilarity index and the multi-group dissimilarity index and performed the analyses of the results. Yu Zhao and Meixia Lin conducted the processing of the population data and the remote sensing images. Zhaowu Yu provided literature guidance and developed a proposal for the study. All of the co-authors drafted and revised the article collectively, and all authors read and approved the final manuscript.
Conflicts of Interest
The authors declare no conflicts of interest. The founding sponsors had no role in the design of the study; in the collection, analyses, or interpretation of data; in the writing of the manuscript; or in the decision to publish the results.
References
- Wu, Q.; Cheng, J.; Chen, G.; Hammel, D.J.; Wu, X. Socio-spatial differentiation and residential segregation in the Chinese city based on the 2000 community-level census data: A case study of the inner city of Nanjing. Cities 2014, 39, 109–119. [Google Scholar] [CrossRef]
- Whittemore, A.H. The Experience of Racial and Ethnic Minorities with Zoning in the United States. J. Plan. Lit. 2017, 32, 16–27. [Google Scholar] [CrossRef]
- Johnston, R.; Poulsen, M.; Forrest, J. The geography of ethnic residential segregation: A comparative study of five countries. Ann. Assoc. Am. Geogr. 2007, 97, 713–738. [Google Scholar] [CrossRef]
- Gu, C.; Wang, F.; Liu, G. The structure of social space in Beijing in 1998: A socialist city in transition. Urban Geogr. 2005, 26, 167–192. [Google Scholar] [CrossRef]
- Popenoe, D. Urban residential differentiation: An overview of patterns, trends, and problems. Sociol. Inq. 1973, 43, 35–56. [Google Scholar] [CrossRef]
- Smith, S. Residential Segregation: Geographic Aspects; Elsevier Ltd.: Kidlington, UK, 2004. [Google Scholar]
- Hall, M.; Stringfield, J. Undocumented migration and the residential segregation of Mexicans in new destinations. Soc. Sci. Res. 2014, 47, 61–78. [Google Scholar] [CrossRef] [PubMed]
- Iceland, J.; Sharp, G. White Residential Segregation in U.S. Metropolitan Areas: Conceptual Issues, Patterns, and Trends from the U.S. Census, 1980 to 2010. Popul. Res. Policy Rev. 2013, 32, 663–686. [Google Scholar] [CrossRef] [PubMed]
- Cutler, D.M.; Glaeser, E.L.; Vigdor, J.L. The rise and decline of the American ghetto. J. Political Econ. 1999, 107, 455–506. [Google Scholar] [CrossRef]
- Kazepov, Y. Cities of Europe: Changing contexts, local arrangements, and the challenge to social cohesion. Cities Eur. 2005, 1, 3–33. [Google Scholar]
- Gale, R. Religious Residential Segregation and Internal Migration: The British Muslim Case. Environ. Plan. A 2013, 45, 872–891. [Google Scholar] [CrossRef]
- Liu, Y.; Dijst, M.; Geertman, S. Residential segregation and well-being inequality between local and migrant elderly in Shanghai. Habitat Int. 2014, 42, 175–185. [Google Scholar] [CrossRef]
- Zhou, S.; Deng, L.; Kwan, M.-P.; Yan, R. Social and spatial differentiation of high and low income groups’ out-of-home activities in Guangzhou, China. Cities 2015, 45, 81–90. [Google Scholar] [CrossRef]
- Wu, Q.; Cheng, J.; Young, C. Social differentiation and spatial mixture in a transitional city—Kunming in southwest China. Habitat Int. 2017, 64, 11–21. [Google Scholar] [CrossRef]
- Kwan, M.-P. Beyond space (as we knew it): Toward temporally integrated geographies of segregation, health, and accessibility: Space-time integration in geography and GIScience. Ann. Assoc. Am. Geogr. 2013, 103, 1078–1086. [Google Scholar] [CrossRef]
- Wissink, B.; Schwanen, T.; van Kempen, R. Beyond residential segregation: Introduction. Cities 2016, 59, 126–130. [Google Scholar] [CrossRef]
- Kim, G.-E.; Choi, M.J. Spatial Homophily of Commercial Areas: The Case of Seoul. Sustainability 2017, 9, 1012. [Google Scholar]
- Tammaru, T.; Strömgren, M.; van Ham, M.; Danzer, A.M. Relations between residential and workplace segregation among newly arrived immigrant men and women. Cities 2016, 59, 131–138. [Google Scholar] [CrossRef]
- Wang, D.; Li, F. Daily activity space and exposure: A comparative study of Hong Kong’s public and private housing residents’ segregation in daily life. Cities 2016, 59, 148–155. [Google Scholar] [CrossRef]
- Grbic, D.; Ishizawa, H.; Crothers, C. Ethnic residential segregation in New Zealand, 1991–2006. Soc. Sci. Res. 2010, 39, 25–38. [Google Scholar] [CrossRef]
- Warnock, V.C.; Warnock, F.E. Markets and housing finance. J. Hous. Econ. 2008, 17, 239–251. [Google Scholar] [CrossRef]
- Tang, M.; Coulson, N.E. The impact of China’s housing provident fund on homeownership, housing consumption and housing investment. Reg. Sci. Urban Econ. 2017, 63, 25–37. [Google Scholar] [CrossRef]
- Li, S.-M.; Li, L. Life course and housing tenure change in urban China: A study of Guangzhou. Hous. Stud. 2006, 21, 653–670. [Google Scholar] [CrossRef]
- Wang, H.; Wang, L.; Su, F.; Tao, R. Rural residential properties in China: Land use patterns, efficiency and prospects for reform. Habitat Int. 2012, 36, 201–209. [Google Scholar] [CrossRef]
- Wang, X.-R.; Hui, E.C.-M.; Sun, J.-X. Population migration, urbanization and housing prices: Evidence from the cities in China. Habitat Int. 2017, 66, 49–56. [Google Scholar] [CrossRef]
- Wang, M.; Yang, Y.; Jin, S.; Gu, L.; Zhang, H. Social and cultural factors that influence residential location choice of urban senior citizens in China—The case of Chengdu city. Habitat Int. 2016, 53, 55–65. [Google Scholar] [CrossRef]
- Jia, K.; Liang, S.; Gu, X.; Baret, F.; Wei, X.; Wang, X.; Yao, Y.; Yang, L.; Li, Y. Fractional vegetation cover estimation algorithm for Chinese GF-1 wide field view data. Remote Sens. Environ. 2016, 177, 184–191. [Google Scholar] [CrossRef]
- Liu, K.; Fu, J.; Li, F. Evaluation Study of Four Fusion Methods of GF-1 PAN and Multi|spectral Images. Remote Sens. Technol. Appl. 2015, 30, 980–986. [Google Scholar]
- Tucker, C.J. Red and photographic infrared linear combinations for monitoring vegetation. Remote Sens. Environ. 1979, 8, 127–150. [Google Scholar] [CrossRef]
- Fathizad, H.; Tazeh, M.; Kalantari, S.; Shojaei, S. The investigation of spatiotemporal variations of land surface temperature based on land use changes using NDVI in southwest of Iran. J. Afr. Earth Sci. 2017, 134, 249–256. [Google Scholar] [CrossRef]
- Bang-gu, L.; Jian-gang, X.; An-Xin, M. Evolution of residential differentiation in Central Shanghai City (1947–2007): A view of residential land-use types. Geogr. Res. 2012, 31, 1089–1102. [Google Scholar]
- Sakoda, J.M. A generalized index of dissimilarity. Demography 1981, 18, 245–250. [Google Scholar] [CrossRef] [PubMed]
- Massey, D.S. American Apartheid: Segregation and the Making of the Underclass. Am. J. Sociol. 1990, 96, 329–357. [Google Scholar] [CrossRef]
- Zhou, C.; Yang, G.; Wang, S. The Characters and Influencing Mechanism of Spatial-temporal Variations of Migrant Workers in Shenzhen. Sci. Geogr. Sin. 2016, 36, 1643–1653. [Google Scholar]
- Plume, M.L. SPSS (Statistical Package for the Social Sciences) A2—Bidgoli, Hossein. In Encyclopedia of Information Systems; Elsevier: New York, NY, USA, 2003; pp. 187–196. [Google Scholar]
- Molugaram, K.; Rao, G.S. Chapter 11—ANOVA (Analysis of Variance). In Statistical Techniques for Transportation Engineering; Butterworth-Heinemann: Oxford, UK, 2017; pp. 451–462. [Google Scholar]
- Massey, D.S.; Denton, N.A. The dimensions of residential segregation. Soc. Forces 1988, 67, 281–315. [Google Scholar] [CrossRef]
- Li, F.; Wang, R.; Paulussen, J.; Liu, X. Comprehensive concept planning of urban greening based on ecological principles: A case study in Beijing, China. Landsc. Urban Plan. 2005, 72, 325–336. [Google Scholar] [CrossRef]
- Wang, K.; Zhang, J.; Ze, X.U.; Ying, X.U. Coordinative and transition-oriented technical regulations for land-use planning: An analysis on the code for classification of urban land use and planning standards of development land (GB 50137-2011). City Plan. Rev. 2012, 36, 42–48. [Google Scholar]
Figure 1.
Location of Xiamen Island and its distribution of (a) districts, (b) sub-districts, (c) and communities.
Figure 1.
Location of Xiamen Island and its distribution of (a) districts, (b) sub-districts, (c) and communities.

Figure 2.
Distribution of urban housing types in Xiamen Island.

Figure 3.
Distribution of population.

Figure 4.
Distribution of residential green spaces.

Figure 5.
Composition of different housing type areas in Xiamen Island.

Figure 6.
Distribution of housing type areas in different sub-districts.

Figure 7.
Population structure of different housing types in Xiamen Island.

Figure 8.
Population size and residential population density of different housing types.

Figure 9.
Composition of different residential green spaces in Xiamen Island.

Figure 10.
Distribution of residential green space areas and green space rates.

Figure 11.
, , and based on different scales.


Table 1.
Housing types and descriptions.
| Housing Type | Description |
|---|---|
| Villa | Luxurious country residences with extensive grounds, usually detached or semi-detached suburban houses |
| Staff apartment | Employer-owned buildings containing living quarters for staff |
| Luxury commercial housing | Apartments of very high quality and services, intended to be sold to wealthy people |
| Commercial government housing | Apartments sold to workers as private properties by the government after the end of central planning |
| Indemnificatory housing | Apartments provided to low-income families at low rent by the government |
| General commercial housing | Apartments sold to the general public at market prices |
| Old town residence | Historic houses |
| Urban village | Village-style housing that gradually formed along the urban fringes |
| Others | Any housing types not included above. |
Table 2.
Descriptions and formulas for dissimilarity indexes.
| Symbol | |||
|---|---|---|---|
| Represents | Land spatial differentiation of a certain housing type | Population spatial differentiation of a certain housing type | Spatial differentiation of the residential green space of a certain housing type |
| Formulas | |||
| Land area for a certain housing type in area unit i | Population size for a certain housing type in area unit i | Green space area for a certain housing type in area unit i | |
| Land areas for all housing types in area unit i | Population sizes for all housing types in area unit i | Green space areas for all housing types in area unit i | |
| Land area for a certain housing type in the entire research area | Population size for a certain housing type in the entire research area | Green space area for a certain housing type in the entire research area | |
| Land areas for all housing types in the entire research area | Population sizes for all housing types in the entire research area | Green space areas for all housing types in the entire research area | |
| Numbers of area units | Numbers of area units | Numbers of area units |
Area units can be districts, sub-districts, and communities.
Table 3.
Descriptions and formulas for multi-group dissimilarity indexes.
| Symbol | |||
|---|---|---|---|
| Represents | Land spatial differentiation of the entire residential landscape | Population spatial differentiation the entire residential landscape | Spatial differentiation of the residential green space of the entire residential landscape |
| Formulas | |||
| , | |||
| Land area for a certain housing type j in area unit i | Population size for a certain housing type j in area unit i | Green space area for a certain housing type j in area unit i | |
| Land areas for all housing types in area unit i | Population sizes for all housing types in area unit i | Green space areas for all housing types in area unit i | |
| Land area for a certain housing type j in the entire research area | Population size for a certain housing type j in the entire research area | Green space area for a certain housing type j in the entire research area | |
| Numbers of area units | Numbers of area units | Numbers of area units | |
Area units can be districts, sub-districts, and communities.
Table 4.
Land spatial differentiation, population spatial differentiation, and spatial differentiation of the residential green space of different housing types.
Table 4.
Land spatial differentiation, population spatial differentiation, and spatial differentiation of the residential green space of different housing types.
| Villa | Luxury Commercial Housing | General Commercial Housing | Commercial Government Housing | Indemnificatory Housing | Staff Apartment | Urban Village | Old Town Residence | ||
|---|---|---|---|---|---|---|---|---|---|
| District | 0.24 | 0.35 | 0.04 | 0.18 | 0.17 | 0.40 | 0.41 | 0.46 | |
| Sub-district | 0.57 | 0.56 | 0.15 | 0.30 | 0.76 | 0.76 | 0.47 | 0.87 | |
| Community | 0.85 | 0.89 | 0.46 | 0.46 | 0.89 | 0.97 | 0.63 | 0.94 | |
| District | 0.34 | 0.38 | 0.06 | 0.18 | 0.27 | 0.49 | 0.42 | 0.50 | |
| Sub-district | 0.65 | 0.66 | 0.20 | 0.26 | 0.82 | 0.90 | 0.45 | 0.86 | |
| Community | 0.90 | 0.95 | 0.50 | 0.45 | 0.92 | 0.97 | 0.56 | 0.93 | |
| District | 0.11 | 0.55 | 0.17 | 0.10 | 0.09 | 0.36 | 0.47 | 0.37 | |
| Sub-district | 0.45 | 0.69 | 0.20 | 0.23 | 0.74 | 0.78 | 0.56 | 0.89 | |
| Community | 0.73 | 0.94 | 0.52 | 0.39 | 0.91 | 0.96 | 0.80 | 0.95 |
Table 5.
Multiple comparisons by a Least Significant Difference (LSD) test.
| (J) Housing type | Villa | Luxury Commercial Housing | General Commercial Housing | Commercial Government Housing | Indemnificatory Housing | Staff Apartment | Urban Village | Old Town Residence | |
|---|---|---|---|---|---|---|---|---|---|
| (I) Housing type | |||||||||
| Villa | / | −0.13 | 0.28 * | 0.25 * | −0.08 | −0.19 | −0.01 | −0.21 | |
| Luxury commercial housing | 0.13 | / | 0.41 * | 0.38 * | 0.04 | −0.07 | 0.13 | −0.09 | |
| General commercial housing | 0.28 * | −0.41 * | / | -0.03 | −0.36 * | −0.48 * | −0.27 * | −0.49 * | |
| Commercial government housing | −0.25 * | −0.38 * | 0.03 | / | −0.34 | −0.45 * | −0.25 * | −0.47 * | |
| Indemnificatory housing | 0.08 | −0.04 | 0.36 * | 0.34 * | / | −0.11 | 0.09 | −0.13 | |
| Staff apartment | 0.19 | 0.07 | 0.48 * | 0.45 * | 0.11 | / | 0.20 | −0.02 | |
| Urban village | 0.01 | −0.13 | 0.27 * | 0.25 * | −0.09 | −0.20 | / | −0.22 * | |
| Old town residence | 0.21 | 0.09 | 0.49 * | 0.47 * | 0.13 | 0.02 | 0.22 * | / | |
* The mean difference is significant at the 0.05 level.
Table 6.
Average dissimilarity indexes of different housing types.
| Average | Average | Average | |
|---|---|---|---|
| Villa | 0.55 | 0.63 | 0.43 |
| Luxury commercial housing | 0.60 | 0.66 | 0.72 |
| General commercial housing | 0.21 | 0.25 | 0.29 |
| Commercial government housing | 0.30 | 0.3 | 0.24 |
| Indemnificatory housing | 0.61 | 0.67 | 0.58 |
| Staff apartment | 0.71 | 0.79 | 0.7 |
| Urban village | 0.51 | 0.48 | 0.61 |
| Old town residence | 0.76 | 0.76 | 0.74 |
[0, 0.3] represents a low degree of differentiation, [0.3, 0.6] represents a medium degree of differentiation, and [0.6, 1] represents a high differentiation.
Table 7.
Multi-group residential differentiation of the entire residential landscape.
| Scale | Average | |||
|---|---|---|---|---|
| District | Sub-District | Community | ||
| 0.31 | 0.49 | 0.76 | 0.52 | |
| 0.35 | 0.51 | 0.76 | 0.54 | |
| 0.24 | 0.46 | 0.77 | 0.49 | |
[0, 0.3] represents a low degree of differentiation, [0.3, 0.6] represents a medium degree of differentiation, and [0.6, 1] represents a high differentiation.
© 2017 by the authors. Licensee MDPI, Basel, Switzerland. This article is an open access article distributed under the terms and conditions of the Creative Commons Attribution (CC BY) license (http://creativecommons.org/licenses/by/4.0/).
Share and Cite
MDPI and ACS Style
Sun, C.; Lin, T.; Zhao, Y.; Lin, M.; Yu, Z. Residential Spatial Differentiation Based on Urban Housing Types—An Empirical Study of Xiamen Island, China. Sustainability 2017, 9, 1777. https://doi.org/10.3390/su9101777
AMA Style
Sun C, Lin T, Zhao Y, Lin M, Yu Z. Residential Spatial Differentiation Based on Urban Housing Types—An Empirical Study of Xiamen Island, China. Sustainability. 2017; 9(10):1777. https://doi.org/10.3390/su9101777
Chicago/Turabian StyleSun, Caige, Tao Lin, Yu Zhao, Meixia Lin, and Zhaowu Yu. 2017. "Residential Spatial Differentiation Based on Urban Housing Types—An Empirical Study of Xiamen Island, China" Sustainability 9, no. 10: 1777. https://doi.org/10.3390/su9101777
Note that from the first issue of 2016, this journal uses article numbers instead of page numbers. See further details here.