Shedding New Light on Project Portfolio Risk Management


1
Faculty of Economics, Maria Curie-Sklodowska University, Maria Curie-Sklodowska 5, 20-031 Lublin, Poland
2
Faculty of Organisation and Management, Silesian University of Technology, Akademicka 2A, 44-100 Gliwice, Poland
*
Author to whom correspondence should be addressed.
Sustainability 2017, 9(10), 1798; https://doi.org/10.3390/su9101798
Submission received: 9 August 2017
/
Revised: 15 September 2017
/
Accepted: 30 September 2017
/
Published: 4 October 2017
(This article belongs to the Section Sustainable Urban and Rural Development)
Abstract
:This paper constitutes an innovative attempt to analyse the risks and negative phenomena dependencies within a project portfolio. Based on the available literature, the risks and negative phenomena (that is, the problems with the availability of resources, interpersonal conflicts, irregularities in the portfolio balance, etc.) specific to a project portfolio were identified. Theoretical constructs were then used to connect the identified risks with the negative phenomena. Structural equations were used to confirm the existence and quality of these constructs, as well as models describing connections between phenomena. The determination of the structural equations also provided a setting in which statistical methods (χ2, RMSEA and CFI) could be used to investigate the level of fit of the constructs and models to the empirical data.
1. Introduction
Risk management is an important element of comprehensive project portfolio management. In turn, project risk management is wholly oriented towards the achievement of project objectives [1]. Key aspects of project risk management have been thoroughly described in the available literature on the subject, with regard to its uses [2,3] and interpersonal [4] aspects. However, project portfolio risk management constitutes a relatively new study area. Available studies unambiguously indicate the significant limitations of traditional risk management, i.e., it is oriented towards individual risk management projects in a multi-project environment [5,6,7]. Based on the work of Markowitz [8], a portfolio may be described as a set of projects that, when managed together, allow for the maximisation of their expected values at the assumed risk level [9] (p. 97). Therefore, the literature indicates that portfolio risk management constitutes a much wider issue than the management of an individual project risk [10] and requires a holistic approach [7,11]. This is a result of the occurrence of a new risk, which is a derivative of interdependencies and relationships between projects completed within the portfolio [12] (p. 85). Risk identifications for projects initiated and completed within the portfolio may be conducted simultaneously, thus positively affecting the efficiency of these actions [13,14,15]. Therefore, properly conducted project portfolio risk management allows for the minimisation of the likelihood of mistakes and failures, which consequently has a positive impact on portfolio success [16]. While addressing the issue of personnel, it must be stated that risk management requires a holistic approach from the portfolio manager. Neglecting this approach may cause problems with risk monitoring at the portfolio level [5]. Risk management also requires unique competencies from a portfolio manager that allow for the formation of desired behaviours in the organisation [17,18]. It aims to clarify the roles of some of the organisation’s actors in the context of portfolio management, such as the roles of portfolio officers [19], middle managers [20], and top managers [17]. Initially, studies mainly addressed issues in project portfolio risk management with organisational solutions [5,7,9,21]. Later on, empirical studies were also published [13,14,22,23]. The studies mentioned characterise the impact of the formalisation and the quality of risk management on the project portfolio success.
An analysis of the literature allowed us to formulate two observations. Within the project portfolio, there may be risk involved in both the portfolio and its structure, as well as in the relationship between the components within the portfolio. The literature also discusses emerging phenomena (such as the availability of resources, interpersonal conflicts, irregularities in the balance portfolio, etc.), which can negatively affect portfolio success. Caused by risks, phenomena can determine Critical Success Factors (CSFs) in managing project portfolios (e.g., [24,25,26,27]). In addition, an analysis of the available literature indicates that there is a significant lack of studies, raising issues concerning the identification and analysis of causal connections, on the one hand, between phenomena and the risks causing them and, on the other hand, between the phenomena. Identification of this research gap has allowed for the formulation of cognitively interesting research questions (RQ):
- RQ1: What risks are characteristic of a project portfolio?
- RQ2: What risks cause negative portfolio phenomena?
- RQ3: Do such negative phenomena affect each other and how?
In order to answer the questions above, a research project was conducted in the period 2014–2017. In the first step, based on the available literature, negative phenomena were selected and project portfolio risks were identified and named using the Delphi method [28]. In the second step, likelihood and impact were measured for the identified risks. The last stage comprised an analysis of theoretically foreseen interdependencies between project portfolio risks and negative phenomena, conducted with the use of structural equation modelling [29]. Using this statistical procedure, types and strengths of risks and negative phenomena dependencies were identified. The calculated structural equations also confirmed the existence and quality of constructs describing the causal connections between risks and negative phenomena, as well as the models describing such predicted connections among phenomena. Therefore, it may be stated that this paper aims to identify risks, as well as find a match between the theoretical models describing the relationships between project portfolio risks and the negative phenomena that the empirical data revealed. In the opinion of the authors, the research conducted contributes to the analysis of theoretically suggested and predicted project portfolio risks relations, and the results have significant application value.
2. Portfolio Risk Management—Theoretical Background
2.1. Project Portfolio Management
Currently, project portfolio management is receiving increased attention both in practice and as a field of academic research [13,14,17,30,31]. The portfolio management concept originates from studies conducted by Markowitz [8], which had the realities of capital investment as their theoretical background. Over the years, however, this concept evolved, finding applications in the area of new products development [32] and then project management [10,33,34]. When applied to project portfolio management, the portfolio theory concerns the constant allocation of resource choices [35], while taking into account interdependencies among projects. Guidelines regulating project portfolio management issues have been included in global studies [12,36]. Enterprises then adopt guidelines cited in the standards, e.g., taking into account the effectiveness of the decision-making process [37] and applied organisational solutions [38,39].
A project portfolio is a collection of single projects and programs that are carried out under a single sponsorship and typically compete for scarce resources. A coordinated project portfolio reflects an organisation’s investment strategy, adds value beyond the results of an individually managed project, and optimises the available resources [40], and should represent a balance between associated risks. In addition, attention is paid to the strategic dimension manifested through the compliance of the strategic fit of a portfolio with the organisation’s strategic objectives [30]. The focus is on the alignment of projects and programs to the organisation’s strategy and the balance of the project portfolio, while regarding risks and benefits [12]. The task of project portfolio management is to manage the resources and other constraints, coordinate the group of projects, and manage the interfaces between projects [7,41]. Portfolio management specificity results from the course of the projects’ life cycles. Jonas suggests a chronological sequence of four interdependent life cycle phases: portfolio structuring, resource management, portfolio steering, and organisational learning through portfolio exploitation [17]. It follows that project portfolio management consists of portfolio structuring, resource management, and portfolio steering [18]. The objectives of project portfolio management are well established in the literature: the maximisation of portfolio value, the portfolio balance, and the alignment of the projects with strategic goals [33,41,42].
2.2. Project Portfolio Risk Management
Risk is defined as an uncertain event or condition that, if it occurs, has a significant positive or negative effect on at least one strategic portfolio objective [12] (p. 85). While raising risk management issues, attention should be drawn to two significant aspects. Understanding and defining the notions of uncertainty and risk is the first aspect. Within the framework of this issue, two different views are outlined. One is an understanding of risk as a consequence of uncertainty, and this perception is quite popular [5,43]. Separation of the issues of risk and uncertainty constitutes a very different view [44]. In this view, uncertainty implies a situation for which it is impossible to define the probability of an event occurring. This perception has opened a new research area in the literature: the management of this version of uncertainty. Available studies discuss this subject both from a theoretical [45,46,47] and empirical point of view [48]. The second significant aspect of risk management involves the consideration of risk as an event that not only generates hazards, but also reveals opportunities that may be taken by the organisation [5,9,12]. In this paper, emphasis is placed on the potential negative effects of risk occurrence on project portfolio success.
Project risk management issues are well described, both with regard to their methods [1,49] and applications [2,3,50,51,52]. The management of risks at the portfolio level may enhance the effectiveness of risk management compared to the independent consideration of risks at the project level [16,53]. An analysis of available studies within the scope of portfolio risk management allows for the identification of studies discussing this issue in a theoretical and empirical way. Pellegrinelli was the first to discuss the issue. He disclosed the difference between risk management at the levels of project and program, indicating that program risk management is a broader issue requiring a different approach [10]. Olson indicated significant differences between risk management at the project level and risk management at the project portfolio level [7]. In turn, Sanchez presented a theoretical model describing risk management at the project portfolio level [9,21]. As previously mentioned, studies discussing project portfolio risk management issues empirically are currently being published. Teller presents an extensive empirical study demonstrating the impact of formalisation and quality of risk management on the success of the portfolio [13,14,22,23]. In addition, McFarlan indicates the usefulness of a complex approach to portfolio risk in the decision-making process [54]. A separate trend with regard to portfolio risk management is constituted by studies describing the specificity of engineering [55,56] and IT [57] project portfolio risk management.
The Project Management Institute [12] (pp. 85–86) describes three categories of portfolio risks, i.e., structural, component, and overall risks. Structural risks are risks associated with the composition of a group of projects and the potential interdependencies among components. Component risks are project risks that the project manager needs to adjust to the portfolio level for information or action. The overall risk considers the interdependencies between projects and is, therefore, more than just the sum of individual project risks [53]. This approach to project portfolio risk categorisation has been adopted in the course of this research.
3. Hypothesis Development
The particular project portfolio risks were selected and named through the course of the literature review [5,6,7,9,13,14,16,17,18,23,30,33,40,41,42,56,58,59,60,61,62,63,64,65,66,67,68]. Every identified risk was defined, described, and placed into one of the component, structural, or overall risk categories. The listed risks were then assessed by experts using the Delphi method [28,69]. After the assessment procedure, during which expert consensus was reached, thirty-six project portfolio risks were selected (see Table 1). The identification of the risk characteristics of the project portfolio facilitated a response to the first research question (RQ1).
During the literature review, a series of project portfolio phenomena were also selected [7,9,16,17,18,20,23,30,33,40,41,56,58,59,60,61,62,63,64,65,66,67,68]. These phenomena result from the occurrence of (one or more) risk(s) that may occur during the execution of the project portfolio. The first identified phenomenon was insufficient control over the environment of the portfolio—this was manifested by the appearance in the portfolio environment of new conditions or situations, causing a lack of stability of basic parameters of projects and programs completed within the portfolio. The second phenomenon was limitation of material and financial resources—manifested by problems with the accessibility of resources and their balance, as well as problems with the maintenance of the portfolio’s financial liquidity and stability of its financing. The third phenomenon was problems with communication within the portfolio—this may be manifested through irregularities in processing, aggregating and distributing information, as well as through problems with the transfer of knowledge within the portfolio. The fourth phenomenon was the occurrence of interpersonal conflicts—this may be manifested by conflicts between the portfolio managers, top level and middle level managers, as well as a lack of involvement from top management in portfolio execution. The fifth phenomenon was incorrect portfolio structure—usually this results from incorrect portfolio volume and structure, which may adversely affect the achievement of strategic objectives. The last phenomenon selected was irregularities in portfolio balance—resulting from mistakes in prioritisation.
In order to answer the second research question (RQ2: What risks cause negative portfolio phenomena?), the identified risks were connected with the above-described phenomena. These actions resulted in the development of six separate theoretical constructs (latent variables), in which a direct causal connection between the identified risk and the specific phenomenon was assumed (see Table 2).
It was assumed that the first construct (P1), which described the phenomenon of a lack of control over the portfolio environment, resulted from the occurrence of significant changes in the project or program environment, improperly defined priorities for particular portfolio elements, a lack of developed methodical standards within the scope of portfolio element management, and the occurrence of conflicts between the portfolio element managers and the parent organisation’s decision-makers. This latent variable’s associated risks result in a lack of control over changes in basic parameters of portfolio elements and problems with the definition of priorities within the portfolio [61,64,68]. Such situations arise when methodological negligence causes problems at the meeting point of the portfolio, i.e., the parent organisation [17]. The second construct (P2) described the phenomenon of limited access to material and financial resources. It was assumed that the components of this latent variable included the risks causing the unavailability of resources necessary to execute works within the portfolio [40,60,64], resulting in irregularities in the portfolio’s financial areas (the possibility of the portfolio financing collapse and the lack of financial liquidity within the portfolio) [16,56,70]. The third construct (P3) described the phenomenon of problems with communication within the portfolio. It was assumed that this resulted from the disturbances of information flow and communication within the elements of the portfolio and from the lack of transfer of information and knowledge between the elements of the portfolio [33,60,68], as well as from ignoring risks taken by portfolio element managers [13,17,19,20]. The fourth construct (P4) described the phenomenon of the occurrence of interpersonal conflicts. It was assumed that this latent variable resulted from the conflicts between the project and program managers within the portfolio and conflicts between portfolio and portfolio element managers [17,18,20,65]. The fifth construct (P5) assumed that improper portfolio structure resulted from an overly complicated hierarchical structure of portfolio management, a portfolio diversity range that was too wide from the point of view of the portfolio executors’ applied capacity, and the mismatch between the portfolio structure and the parent organisation’s strategy [30,66,67,71]. The sixth construct (P6) described irregularities in the portfolio balance that resulted from improperly defined priorities for particular portfolio elements, improper portfolio balance, and a lack of developed methodical standards within the scope of portfolio element management. This variable included the risks suggested in the literature, resulting in serious problems with portfolio balance [39,41,56,59,62,66]. Confirmation of the existence of these constructs will provide the answer to the second research question (RQ2).
In order to answer the third research questions (RQ3: Do such negative phenomena affect each other and how?), connections between the constructs of the project portfolio were analysed. Six research hypotheses were formed to describe the predicted relationships between the above-described constructs, including the negative phenomena and the risks causing them. They are presented below:
- Hypothesis 1 (H1). The latent variable describing the phenomenon “Improper portfolio structure” (P5) has a causal connection with the latent variable describing the phenomenon “Occurrence of interpersonal conflicts” (P4).
- Hypothesis 2 (H2). The latent variable describing the phenomenon “Lack of control over the portfolio environment” (P1) has a causal connection with the latent variable describing the phenomenon “Limited access to material and financial resources” (P2).
- Hypothesis 3 (H3). The latent variable describing the phenomenon “Occurrence of interpersonal conflicts” (P4) has a causal connection with the latent variable describing the phenomenon “Problems with communication” (P3).
- Hypothesis 4 (H4). The latent variable describing the phenomenon “Irregularities in the portfolio balance” (P6) has a causal connection with the latent variable describing the phenomenon “Limited access to material and financial resources”(P2).
- Hypothesis 5 (H5). The latent variable describing the phenomenon “Lack of control over the portfolio environment” (P1) has a causal connection with the latent variable describing the phenomenon “Occurrence of interpersonal conflicts” (P4).
- Hypothesis 6 (H6). The latent variable describing the phenomenon “Problems with communication” (P3) has a causal connection with the latent variable describing the phenomenon “Limited access to material and financial resources” (P2).
The research hypotheses were verified through the determination of structural equations to mathematically describe the dependencies. The adopted research method assumed, firstly, the confirmation of the above-described theoretical constructs, thus facilitating an empirical confirmation of the correctness of the theoretical predictions and answering the second research question (RQ2). Then, the causal connections among the latent variables were researched, thus facilitating the verification of the six research hypotheses indicated above and answering the third research question (RQ3).
4. Project Portfolio Risks and Negative Phenomena Dependencies
4.1. Sample Description
At the next research stage, each risk from the list was assessed with regard to the likelihood of its occurrence and impact. This assessment was conducted by respondents with professional experience in program and project portfolio management [34] (p. 217). Four hundred individuals were asked to conduct a project portfolio risk assessment, and 73 of those individuals participated (i.e., an 18% response rate) in 2015.
The level of education in the group of respondents who conducted the assessment was broken down as follows: 12% had doctoral degrees (3rd degree studies), 42% had postgraduate degrees (including MBAs), 37% were higher education graduates (2nd degree studies), and 7% were 1st grade studies graduates. One of the respondents claimed a secondary technical education. In terms of professional experience, 8% had 16–25 years of in multi-project management, 15% had 11–15 years of such experience, 47% had 5–10 years of experience, and 30% had less than four years of experience in multi-project management. Within the group, 64% of respondents were working in service enterprises, 21% in production companies, while 11% were in enterprises of a mixed type. Based on the characteristics of the research participants, it may be assumed that the research sample included individuals who had management experience with various project portfolios, with regard to their size, type, and industry. Therefore, a cautious assumption can be made that the results obtained may describe the significance level and illustrate relations among risks for the full spectrum of project portfolios.
Respondents assessed particular risks from the list using a special questionnaire published on a website. The questionnaire included all of the risks from the list, together with their names and descriptions. The listed risks were distributed randomly in the questionnaire, so as not to suggest to the experts their affiliation with the component, structural, or overall risk categories [12]. In light of the specificity of experts’ professional experience and the consequent necessity of mobility, they were able to carry out a risk assessment via computers and other available mobile devices (tablets, mobile phones).
4.2. Method
As mentioned above, the assessment that respondents having multi-project management professional experience undertook constituted the 36 risks. Operationalisation of every assessed risk, according to the approach suggested in the literature on the subject, included two variables: risk likelihood and risk impact on portfolio objectives [3] (pp. 143–145), [1] (pp. 91–93), [72] (pp. 242–252), [73] (p. 47). The variables were described on the ordinal scale. The risk likelihood variable was expressed on a 5-point scale, where: 1 meant very low risk likelihood, 2—low, 3—average, 4—high, and 5—very high risk likelihood. The risk impact variable was also assessed on a 5-point scale, where: 1 meant insignificant risk impact on portfolio objectives, 2—minor impact, 3—moderate impact, 4—major impact, and 5—very high impact on portfolio objectives. Respondents, while assessing those variables based on their experience of recently managed programs or portfolios (ex post approach), anticipated the likelihood of occurrence and impact of particular risks on objectives of a hypothetical portfolio (ex ante approach).
Described phenomena (i.e., insufficient control over the portfolio environment, limited material and financial resources, information flow disturbances, occurrence of interpersonal conflicts, improper portfolio structure, and irregularities in the portfolio balance), together with the associated risks, were treated as theoretical constructs (latent variables). Then, relations within the construct (between risks and the latent variable) and interdependencies among latent variables (i.e., phenomena) suggested in the literature were tested and confirmed, while the match between models and the obtained empirical data was tested as well [29,74]. This allowed for the confirmation of interdependencies between the identified project portfolio risks that had been foreseen in theory. The fit of the models with the empirical data were evaluated using Chi-Square (χ2), Root Mean Square Error Approximation (RMSEA), and the Comparative Fit Index (CFI). The χ2 statistic is used to test the alternative hypothesis of no fit, assuming a perfect model fit. Thus, the value of the test statistic will be statistically insignificant, i.e., p > 0.05, for a good-fit model. We must bear in mind, however, that numerous analyses indicated that these statistics were not of key importance. Conversely, a value of RMSEA < 0.05 confirms good model fit. In turn, RMSEA within the 0.06–0.08 range points to a satisfactory model fit, while RMSEA within the 0.08–0.10 range indicates inadequate model fit. RMSEA > 0.10 means that the model poorly fits the empirical data. The group of absolute measures also includes the Comparative Fit Index. In older works, values of this indicator ≥ 0.90 describe models which fit the empirical data well. Analysis of current literature shows that CFI values ≥ 0.95 are now considered necessary for a well-fitting model [29,75,76].
Risk likelihood constituted the variable applied to determine a co-variance matrix. An assumption was made that if, together with an increase in the likelihood of occurrence of one risk, the likelihood of occurrence of another risk increased, the occurrence of one risk increased the likelihood of another risk occurring.
For all applied tests, the threshold significance level p = 0.05 was adopted.
4.3. Results
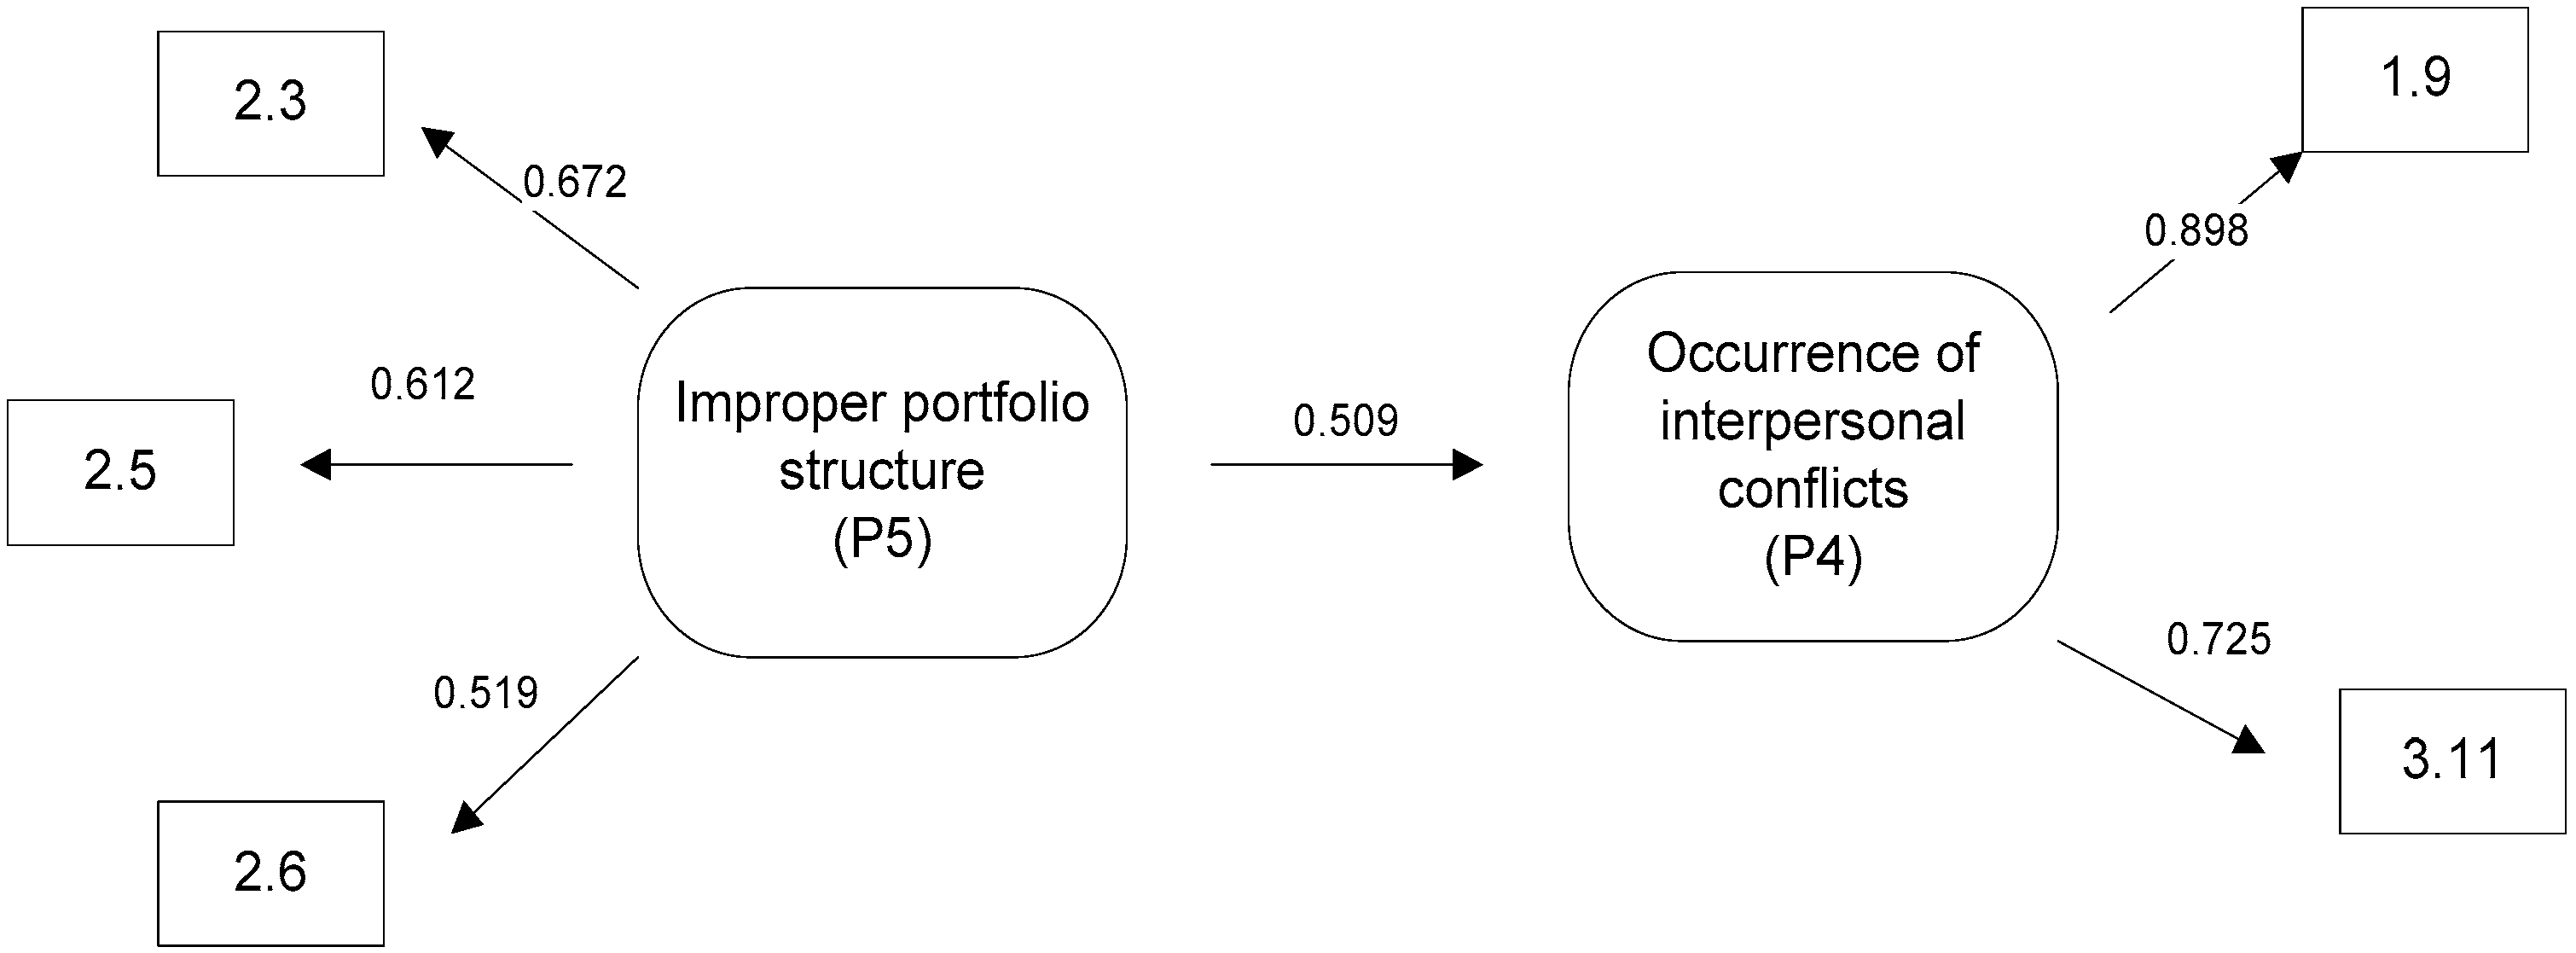
In the figures that follow, values over arrows within the constructs (pointing to the left and right from the phenomenon toward their associated risks) and between them correspond to the co-variance coefficient for standardised variables. The co-variance coefficient is similar to the correlation coefficient, which explains why its interpretation is similar [77]. The first model (see Figure 1) assumed the impact of an incorrect portfolio structure on the occurrence of interpersonal conflicts. For this model, the χ2 p-value was 0.395, the RMSEA factor was 0.017, and the goodness-of-fit index CFI was 0.999. Thus, there was a good match between the model and empirical data
Model no. 1 presented above assumes (research hypothesis H1) that improper portfolio structure (P5) (which may be caused by an overly complicated hierarchical structure of portfolio management (2.3), excessively wide portfolio diversity from the point of view of applied capacity (2.5), and a mismatch between the portfolio structure and the parent organisation’s strategy (2.6)) increases the likelihood of occurrence of interpersonal conflicts (P4) (including conflicts between project and program managers within the portfolio (1.9), as well as conflicts between portfolio managers and portfolio element managers (3.11)). While analysing the model, it may be stated that irregularities in the portfolio structure may significantly (co-variance coefficient = 0.509) impact the occurrence of interpersonal conflicts. The Table 3 contains equations describing the model presented.
The second proposed model (Figure 2) assumes that a lack of control over the portfolio environment implied the occurrence of limited access to material and financial resources. In that model, the following assumption was tested: namely, that the likelihood of occurrence of the latent variable “Lack of control over the portfolio environment” increased the likelihood of occurrence of the latent variable “Limited access to cost and financial resources.” For this model, the χ2 (p-value) was 0.201. The RMSEA index was 0.065, indicating a satisfactory model match. In turn, the CFI index was 0.967, demonstrating a good match between the model and the empirical data
The model presented above assumes (research hypothesis H2) that a lack of control over the widely understood portfolio environment (P1) (which is a consequence of significant changes in the project or program environment (1.1), incorrectly defined priorities for particular portfolio elements (1.4), a lack of developed methodical standards within the scope of portfolio element management (1.7), and conflicts between portfolio element managers and the parent organisation’s decision-makers (1.10)) increases the likelihood of limited access to material and financial resources (P2) (resulting in the unavailability of resources necessary to perform work within the portfolio (3.3), possible occurrence of a lack of financial liquidity within the portfolio (3.7), and portfolio financing collapse (3.8)). The value of the co-variance coefficient (0.680) allows us to reach the conclusion that a lack of control over the portfolio environment usually results in limited access to material and financial resources. The Table 4 presents equations that mathematically describe the discussed phenomena.
The third proposed model (in two variants: 3a and 3b) assumes that the occurrence of interpersonal conflicts contributes to the occurrence of problems with communication (research hypothesis H3). Therefore, in both models, the following assumption was tested: the likelihood of the occurrence of “Occurrence of interpersonal conflicts” increased the likelihood of the occurrence of “Problems with communication.”
For model 3a, the χ2 p-value was 0.445. The value of the RMSEA index was 0, while the CFI index came to 1, thus demonstrating a good match with the model.
As can be seen above (Figure 3), model 3a assumes that the occurrence of interpersonal conflicts (P4) (consisting of conflicts between project and program managers within the portfolio (1.9) and conflicts between portfolio managers and portfolio element managers (3.11)) increases the likelihood of occurrence of problems with communication within the portfolio (P3) (including disturbances in information flow and communication within the portfolio elements (1.5), lack of transfer of information and knowledge among portfolio elements (3.1), and portfolio element managers ignoring risks (1.6)). The value of the co-variance coefficient (0.516) between the two latent variables tested allows us to reach the conclusion that the occurrence of interpersonal conflicts usually results in the occurrence of problems with communication within the portfolio (see Table 5).
The figure and equations shown below describe the relationships among latent and observable variables in the model 3b. In this model, the χ2 (p-value) was 0.647, the value of the RMSEA index was 0, and the CFI index was 1, demonstrating a good match with the model.
Model 3b (see Figure 4) is an extension of the previously presented model 3a. It considers cause and effect interdependencies between two latent variables “Occurrence of interpersonal conflicts” (P4) and “Problems with communication” (P3) and the risk “Lack of involvement of top-level and middle-level managers in the portfolio execution” (3.12). This model may be interpreted as follows: occurrence of interpersonal conflict results in problems with communication and a lack of involvement of managers in portfolio execution. Occurrence of problems with communication increases the tendency for a lack of involvement of managers in the portfolio execution. While looking at the values of co-variance coefficients among these variables, a weak connection between both latent variables tested and the latent variable “Occurrence of interpersonal conflicts” and risk 3.12 have been established for this model (see Table 6). Also, there is a moderate interdependency between the latent variable “Problems with communication” and risk 3.12 (value 0.458).
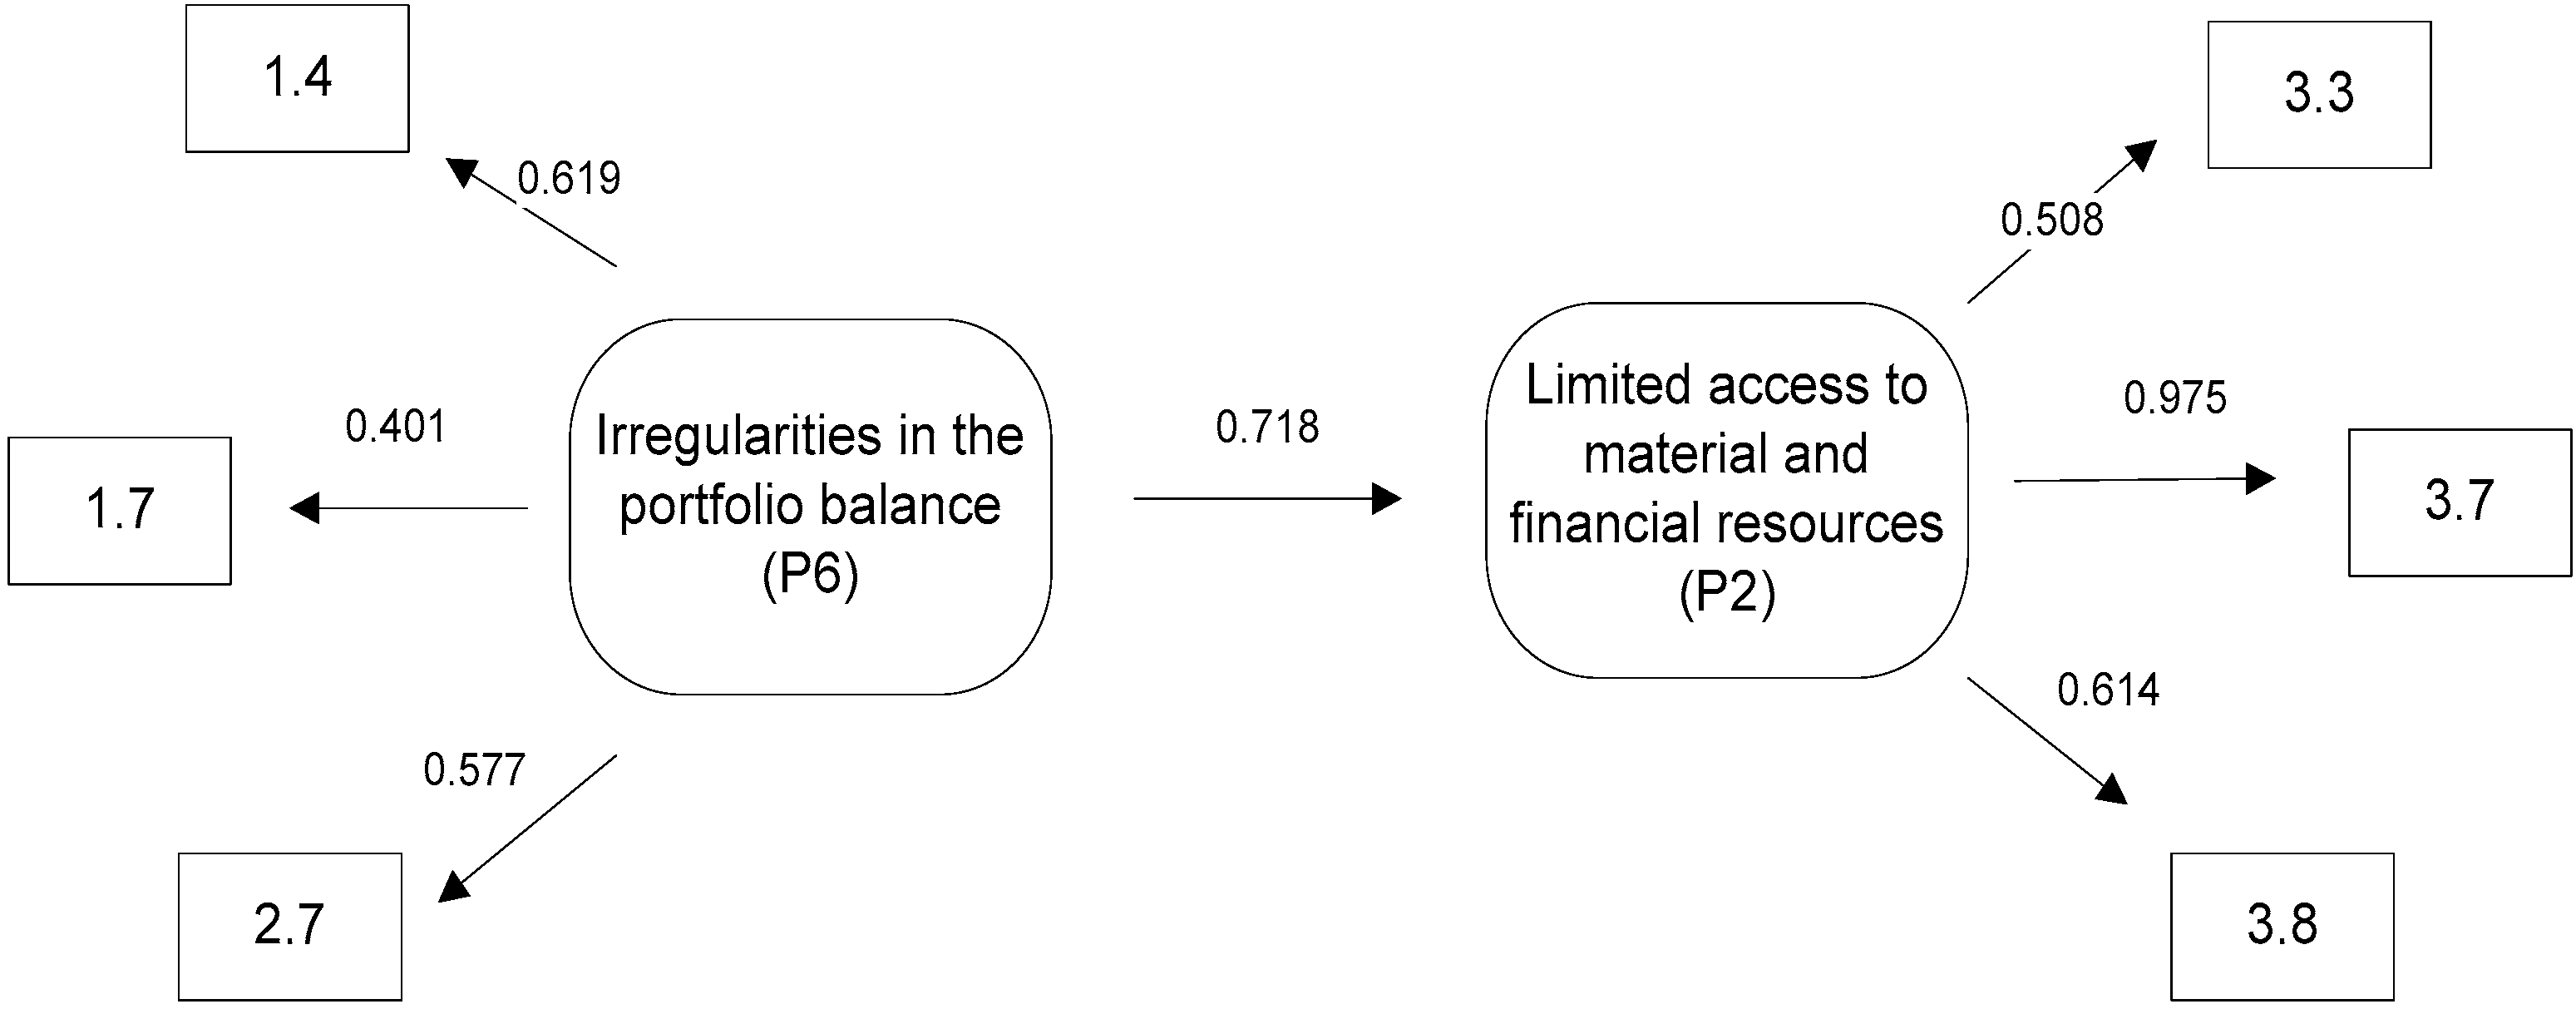
Model 4 assumes that irregularities in the portfolio balance cause limited access to material and financial resources (research hypothesis H4). In this model, the following assumption was tested: the likelihood of occurrence of “Irregularities in the portfolio balance” (P6) increased the likelihood of occurrence of “Limited access to material and financial resources” (P2). In model no. 4, the χ2 p-value was 0.111. The value of the RMSEA factor was 0.093. This means that there is a poor match between the model and the empirical data. The CFI index was 0.945, thus indicating a good match with the model. With regard to these results, it was decided to adopt a theoretical model. The fact that it didn’t fit the empirical data as well as the previously presented models did was taken into consideration. A scheme representing model 4 is shown below (see Figure 5).
The model presented above assumes that irregularities in the portfolio balance (P6) (which results from incorrectly defined priorities for particular portfolio elements (1.4), lack of developed methodical standards within the scope of portfolio element management (1.7), and incorrect portfolio balance (2.7)) increase the likelihood of limited access to material and financial resources (P2) (including the unavailability of resources necessary to perform work within the portfolio (3.3), a possible occurrence of the lack of financial liquidity within the portfolio (3.7), and portfolio financing collapse (3.8)). The value of the co-variance coefficient (0.718) allows us to reach the conclusion that irregularities in the portfolio balance usually result in limited access to material and financial resources. The table below presents equations that mathematically describe the discussed phenomena (see Table 7).
Finally, the fifth and sixth models, which were used to test research hypotheses H5 and H6, respectively, were not confirmed. The first model (testing H5) assumes that the lack of control over the portfolio environment (the latent variable P1, which included risks 1.1, 1.4, 1.7, and 1.10) results in the occurrence of interpersonal conflicts (P4, which included risks 1.9 and 3.11). The second model (testing H6) assumes that the problems with communication (P3, which included risks 1.5, 3.1, and 1.6) causes limited access to resources (P2, which included risks 3.3, 3.7, and 3.8). The computations concluded that they were statistically insignificant. The Table 8 contains parameters of the all tested models.
4.4. Findings
The research verified assumptions concerning the relationships between negative phenomena and the risks causing those phenomena for a hypothetical project portfolio. The first structural model describing the relationship between irregular portfolio structure (P5) and the occurrence of interpersonal conflicts (P4) is statistically significant and well-adjusted to empirical data (χ2 p-value = 0.395, RMSEA = 0.017, CFI = 0.999). The co-variance coefficient was 0.509. It is interpreted much like the correlation coefficient [77], and, as such, it indicates a strong causal connection between P5 and P4 and positive verification of the first research hypothesis (H1). The second analysed model assumes that the lack of control over the portfolio environment (P1) might result in limited access to material and financial resources (P2). The relationship was found to be statistically significant and well-adjusted to the empirical data (χ2 p-value = 0.201, RMSEA = 0.065, CFI = 0.967). In this model, the co-variance coefficient between the latent variables was 0.680, which confirmed a strong causal connection between those variables. It also verified the second research hypothesis (H2). The third model presented describes the impact of interpersonal conflicts (P4) on problems with communication (P3). The analysed model is statistically significant and well-adjusted (χ2 p-value = 0.445, RMSEA = 0, CFI = 1). In this model, the co-variance coefficient was 0.516, which confirmed the causal connection between the latent variables and, hence, the third research hypothesis (H3). A variant of this model, which extends the perception of these two phenomena through a connection of risks causing a lack of commitment of middle and high-level managers to the portfolio execution, is also correct (χ2 p-value = 0.647, RMSEA = 0, CFI = 1). It should be emphasised, however, that the relationships between latent variables and risk 3.12 identified in this model are more tenuous. The last model presented validates the fourth research hypothesis (H4), suggesting that irregularities in portfolio balance (P6) would result in limited access to material and financial resources (P2). The model appears to be statistically relevant and adjusted to the empirical data to a satisfactory degree (χ2 p-value = 0.111, RMSEA = 0.093, CFI = 0.945).
The other two models, the first of which assumes that insufficient control over the portfolio environment (P1) would result in the occurrence of interpersonal conflicts (P4), and the second of which assumes that problems with communication (P3), would result in limited access to material and financial resources (P2); although adjusted to the empirical data to a satisfactory degree (for the first: χ2 p-value = 0.715, RMSEA = 0, CFI = 1, and for the second: χ2 p-value = 0.982, RMSEA = 0, CFI = 1), it appeared to be statistically irrelevant. Hence, the fifth (H5) and sixth (H6) research hypotheses could not be confirmed.
The research method assumed the existence of causal connections between the phenomena described by the latent variables and the risks connected with them. Thus, the confirmed existence of theoretical constructs describing negative phenomena and the risks causing them provided an answer to the second research question (RQ2). The verification of the research hypotheses describing the assumed relationships between constructs describing negative phenomena occurring within the project portfolio produced an answer to the third research question (RQ3).
5. Conclusions
Due to the application of a statistical procedure, i.e., the modelling of structural equations, the authors’ suppositions, based on theory and concerning relationships between identified project portfolio risks and negative phenomena, were confirmed. Using the applied research procedure, theoretical models were developed and then statistically tested with regard to their match with obtained empirical data. Only relationships predicted by the researchers based on an analysis of the available literature were studied. Four of the six proposed theoretical models (i.e., models 1, 2, 3a, 3b, and 4) appeared to be statistically significant and well matched to the empirical data, confirming the first four research hypotheses (H1–H4). Two models (i.e., models 5 and 6) were not confirmed. The computations conducted to find the level of match between those models and the empirical data indicated that the fits were statistically insignificant. Hence, it was not possible to confirm the fifth and sixth research hypotheses (H5, H6). Therefore, in the course of the research, answers to the second and third research questions (RQ2 and RQ3) were obtained.
A cognitively interesting direction of future research may be an analysis of the relationship between the risks characteristic of various types of project portfolios (e.g., technical, IT, and research and development). The research described in this paper distinguished risk at a very general level in order to convey universally the interactions of different types of project portfolio risk. This process was intentional and its objective was to allow cognition and understanding of phenomena foreseen in the literature. It is also possible that the research results will enable researchers to test the proposed models under different conditions (e.g., while studying different types of relationships between the identified risks) or test more developed models based on the interdependencies studied and described in this paper. In addition, it would seem that the obtained results also have practical applications. For project portfolio managers, the risk list developed on the basis of theoretical studies may constitute a starting point for an extension to new risks specific to their enterprises. Having at their disposal knowledge of the significance level of particular risks and, most importantly, of the statistically defined interdependencies among risks and negative phenomena, portfolio managers will have an improved understanding of the interdependencies among risks identified in a portfolio. In the opinion of the authors, this knowledge will enable portfolio managers to develop and test models describing project portfolio risks and the interdependencies between them, adjusted to the specificity of a particular enterprises’ activity. The application of such models, supported by IT solutions, will enable organisations to simulate the results of a specific risk occurrence at the stage of portfolio planning.
Acknowledgments
The paper was written as part of a research project financed by the National Science Centre, which granted funds based on decision no. DEC-2013/09/B/HS4/01311.
Limitations
Based on the characteristics of the research participants, it was assumed that the research sample included persons that had experience in the management of various project portfolios of different size, type, and industry. Therefore, a cautious assumption was made that the results obtained may describe the significance level and illustrate relations among risks for the full spectrum of project portfolios. It is also important to note that the specificity of the adopted research procedure, namely structural equation modelling, assumes that these models are only deductive, which means that positive verification of a model does not prove that the causal connection assumed in the model occurs, but only that the model tested may be accurate. Also, the analysis of equivalent models may show similar fit indicators of tested models to empirical data.
Author Contributions
Mariusz Hofman, Grzegorz Grela and Seweryn Spalek conceived and designed the experiments; Mariusz Hofman and Grzegorz Grela performed the experiments; Mariusz Hofman, Seweryn Spalek, and Grzegorz Grela analyzed the data and wrote the paper; Mariusz Hofman, Seweryn Spalek, and Grzegorz Grela read and edited the manuscript.
Conflicts of Interest
The authors declare no conflict of interest.
References
- Jaafari, A. Management of risks, uncertainties and opportunities on projects: Time for a fundamental shift. Int. J. Proj. Manag. 2001, 19, 90–91. [Google Scholar] [CrossRef]
- Raz, T.; Michael, E. Use and benefits of tools for project risk management. Int. J. Proj. Manag. 2001, 19, 9–17. [Google Scholar] [CrossRef]
- Baccarini, D.; Archerv, R. The risk ranking of projects: A methodology. Int. J. Proj. Manag. 2001, 19, 139–145. [Google Scholar] [CrossRef]
- De Bakker, K.; Boonstra, A.; Wortmann, H. Risk management affecting IS/IT project success through communicative action. Proj. Manag. J. 2011, 42, 75–90. [Google Scholar] [CrossRef]
- Olsson, R. In search of opportunity management. Is the risk management process enough? Int. J. Proj. Manag. 2007, 25, 745–752. [Google Scholar] [CrossRef]
- Anavi-Isakow, S.; Golany, B. Managing multi-project environments through constant work-in-process. Int. J. Proj. Manag. 2003, 21, 9–18. [Google Scholar] [CrossRef]
- Olsson, R. Risk management in a multi-project environment. An approach to manage portfolio risks. Int. J. Qual. Reliab. Manag. 2008, 25, 60–71. [Google Scholar] [CrossRef]
- Markowitz, H. Portfolio selection: Efficient diversification of investments; John Wiley & Sons, Inc.: New York, NY, USA, 1959. [Google Scholar]
- Sanchez, H.; Robert, B.; Pellerin, R. A project portfolio risk-opportunity identification framework. Proj. Manag. J. 2008, 39, 97–109. [Google Scholar] [CrossRef]
- Pellegrinelli, S. Programme management: Organising project-based change. Int. J. Proj. Manag. 1997, 15, 141–149. [Google Scholar] [CrossRef]
- Lee, K.; Lee, N.; Li, H. A particle swarm optimization-driven cognitive map approach to analyzing information systems project risk. J. Am. Soc. Inf. Sci. Technol. 2009, 60, 1208–1221. [Google Scholar]
- Project Management Institute (PMI). The Standard for Portfolio Management, 2nd ed.; PMI: Newton Square, PA, USA, 2008. [Google Scholar]
- Teller, J.; Unger, B.; Kock, A.; Gemünden, H. Formalization of project portfolio management. The moderating role of project portfolio complexity. J. Prod. Innov. Manag. 2012, 30, 559–600. [Google Scholar] [CrossRef]
- Teller, J.; Kock, A. An empirical investigation on how portfolio risk management influences project portfolio success. Int. J. Proj. Manag. 2013, 31, 817–829. [Google Scholar] [CrossRef]
- Kutsch, E.; Hall, M. The rational choice of not applying project risk management in information technology projects. Proj. Manag. J. 2009, 40, 72–81. [Google Scholar] [CrossRef]
- De Reyck, B.; Grushka-Cockayne, Y.; Lockett, M.; Calderini, S.; Moura, M.; Sloper, A. The impact of project portfolio management on information technology projects. Int. J. Proj. Manag. 2005, 23, 524–537. [Google Scholar] [CrossRef]
- Jonas, D. Empowering project portfolio managers. How management involvement impacts project portfolio management performance. Int. J. Proj. Manag. 2010, 28, 818–831. [Google Scholar] [CrossRef]
- Beringer, C.; Jonas, D.; Kock, A. Behavior of internal stakeholders in project portfolio management and its impact on success. Int. J. Proj. Manag. 2013, 31, 830–846. [Google Scholar] [CrossRef]
- Unger, B.; Gemünden, H.; Aubry, M. The three roles of a project portfolio management office: Their impact on portfolio management execution and success. Int. J. Proj. Manag. 2012, 30, 608–620. [Google Scholar] [CrossRef]
- Blomquist, T.; Müller, R. Practices, roles and responsibilities of middle managers in program and portfolio management. Proj. Manag. J. 2006, 37, 52–66. [Google Scholar]
- Sanchez, H.; Robert, B.; Bourgault, M.; Pellerin, R. Risk management applied to projects, programs, and portfolios. Int. J. Manag. Proj. Bus. 2009, 2, 14–35. [Google Scholar] [CrossRef]
- Teller, J.; Kock, A.; Gemünden, H. Risk Management in Project Portfolios Is More Than Managing Project Risks: A Contingency Perspective on Risk Management. Proj. Manag. J. 2013, 45, 67–80. [Google Scholar] [CrossRef]
- Teller, J. Portfolio Risk Management and Its Contribution to Project Portfolio Success: An Investigation of Organization, Process and Culture. Proj. Manag. J. 2013, 44, 36–51. [Google Scholar] [CrossRef]
- Pinto, J.K.; Covin, J.G. Critical factors in project implementation: A comparison of construction and R&D projects. Technovation 1989, 9, 49–62. [Google Scholar]
- Patanakul, P. Key attributes of effectiveness in managing project portfolio. Int. J. Proj. Manag. 2015, 33, 1084–1097. [Google Scholar] [CrossRef]
- Costantino, F.; Di Gravio, G.; Nonino, F. Project selection in project portfolio management: An artificial neural network model based on critical success factors. Int. J. Proj. Manag. 2015, 33, 1744–1754. [Google Scholar] [CrossRef]
- Spalek, S. Success factors in project management. Literature review. In Proceedings of the 8th International Technology, Education and Development Conference INTED2014, Valencia, Spain, 10–12 March 2014. [Google Scholar]
- Linstone, H.; Turoff, M. Delphi: A brief look backward and forward. Technol. Forecast. Soc. Chang. 2011, 78, 1712–1719. [Google Scholar] [CrossRef]
- Bollen, K. With new incremental structural index for general equation models made. Sociol. Methods Res. 1989, 17, 303–316. [Google Scholar] [CrossRef]
- Meskendahl, S. The influence of business strategy on project portfolio management and its success—A conceptual framework. Int. J. Proj. Manag. 2010, 28, 807–817. [Google Scholar] [CrossRef]
- Taroun, A. Towards a better modeling and assessment of construction risk: Insights from a literature review. Int. J. Proj. Manag. 2014, 32, 101–115. [Google Scholar] [CrossRef]
- Wheelwright, S.; Clark, K. Creating project plans to focus product development. Harvard Bus. Rev. 1992, 70, 67–83. [Google Scholar]
- Cooper, R.; Edgett, S.; Kleinschmid, E. Portfolio management for new product development: Results of an industry practices study. R D Manag. 2001, 31, 361–380. [Google Scholar] [CrossRef]
- Patanakul, P.; Milosevic, D. The effectiveness in managing a group of multiple projects: Factors of influence and measurement criteria. Int. J. Proj. Manag. 2009, 27, 216–233. [Google Scholar] [CrossRef]
- Chapman, C.; Ward, S. Why risk efficiency is a key aspect of best practice projects. Int. J. Proj. Manag. 2004, 22, 619–632. [Google Scholar] [CrossRef]
- Office of Government Commerce (OGC). Portfolio Management Guide; The Stationery Office: Norwich, UK, 2008.
- Martinsuo, M.; Poskela, J. Use of evaluation criteria and innovation performance in the front end of innovation. J. Prod. Innov. Manag. 2011, 28, 896–914. [Google Scholar] [CrossRef]
- Müller, R.; Martinsuo, M.; Blomquist, T. Project portfolio control and portfolio management performance in different contexts. Proj. Manag. J. 2008, 39, 28–42. [Google Scholar] [CrossRef]
- Jerbrant, A.; Karrbom-Gustavsson, T. Managing project portfolios: Balancing flexibility and structure by improvising. Int. J. Manag. Proj. Bus. 2013, 6, 131–151. [Google Scholar] [CrossRef]
- Pennypacker, J.; Dye, L. Portfolio management and managing multiple projects. Planning, Scheduling and Allocating Resources for Competitive Advantage. In Managing Multiple Projects; Pennypacker, J., Dye, L., Eds.; Marcel Dekker Inc.: New York, NY, USA; Basel, Switzerland, 2002; pp. 1–10. [Google Scholar]
- Elonen, S.; Artto, K. Problems in managing internal development projects in multi-project environments. Int. J. Proj. Manag. 2003, 21, 395–402. [Google Scholar] [CrossRef]
- Kendall, G.; Rollins, S. Advanced Project Portfolio Management and the PMO; J. Ross Publishing: Plantation, FL, USA, 2003; pp. 3–448. [Google Scholar]
- De Meyer, A.; Loch, H.; Pich, T. Managing project uncertainty. From variation to chaos. MIT Sloan Manag.Rev. 2002, 43, 60–67. [Google Scholar] [CrossRef]
- Perminova, O.; Gustafsson, M.; Wikström, K. Defining uncertainty in projects: A new perspective. Int. J. Proj. Manag. 2008, 26, 73–79. [Google Scholar] [CrossRef]
- Martinsuo, M.; Korhonen, T.; Laine, T. Identifying, framing and managing uncertainties in project portfolios. Int. J. Proj. Manag. 2014, 32, 732–746. [Google Scholar] [CrossRef]
- Petit, Y.; Hobbs, B. Project portfolios in dynamic environments: Sources of uncertainty and sensing mechanisms. Proj. Manag. J. 2010, 41, 46–58. [Google Scholar] [CrossRef]
- Petit, Y. Project portfolios in dynamic environments: Organizing for uncertainty. Int. J. Proj. Manag. 2012, 30, 539–553. [Google Scholar] [CrossRef]
- Korhonen, T.; Laine, T.; Martinsuo, M. Management Control of Project Portfolio Uncertainty: A Managerial Role Perspective. Proj. Manag. J. 2014, 45, 21–37. [Google Scholar] [CrossRef]
- Kliem, R.; Ludin, I. Reducing Project Risk; Gower Publishing Limited: Aldershot, UK, 1997. [Google Scholar]
- Kwak, Y.; Stoddard, J. Project risk management: Lessons learned from software development environment. Technovation 2004, 24, 915–920. [Google Scholar] [CrossRef]
- Patterson, F.; Neailey, K. A Risk Register Database System to aid the management of project risk. Int. J. Proj. Manag. 2002, 20, 365–374. [Google Scholar] [CrossRef]
- Marcelino-Sádaba, S.; Pérez-Ezcurdia, A.; Echeverría Lazcano, A.; Villanueva, P. Project risk management methodology for small firms. Int. J. Proj. Manag. 2014, 32, 327–340. [Google Scholar] [CrossRef]
- Aritua, B.; Smith, N.; Bower, D. Construction client multi-projects: A complex adaptive systems perspective. Int. J. Proj. Manag. 2009, 27, 72–79. [Google Scholar] [CrossRef]
- McFarlan, F. Portfolio approach to information systems. Harvard Bus. Rev. 1981, 59, 142–150. [Google Scholar]
- Ghim Hwee, N.; Tiong, R. Model on cash flow forecasting and risk analysis for contracting firms. Int. J. Proj. Manag. 2002, 20, 351–363. [Google Scholar] [CrossRef]
- Caron, F.; Fumagalli, M.; Rigamonti, A. Engineering and contracting projects: A value at risk based approach to portfolio balancing. Int. J. Proj. Manag. 2007, 25, 569–578. [Google Scholar] [CrossRef]
- Jun, L.; Qiuzhen, W.; Qingguo, M. The effects of project uncertainty and risk management on IS development project performance. A vendor perspective. Int. J. Proj. Manag. 2011, 29, 923–933. [Google Scholar] [CrossRef]
- Archer, N.; Ghasemzadeh, F. An integrated framework for project portfolio selection. Int. J. Proj. Manag. 1999, 17, 207–216. [Google Scholar] [CrossRef]
- Fricke, S.; Shenhar, A. Managing multiple engineering projects in a manufacturing support environment. IEEE Trans. Eng. Manag. 2000, 47, 258–268. [Google Scholar] [CrossRef]
- Cooper, R.; Edgett, S.; Kleinschidit, E. New problems, New solutions. Making portfolio management more effective. In Managing Multiple Projects; Pennypacker, J., Dye, L., Eds.; Marcel Dekker Inc.: New York, NY, USA; Basel, Switzerland, 2002. [Google Scholar]
- Archer, N.; Ghasemzadeh, F. Project portfolio selection and management. In The Wiley Guide to Managing Projects; Morris, P.W.G., Pinto, J.K., Eds.; John Wiley & Sons Inc.: New York, NY, USA, 2004; pp. 237–255. [Google Scholar]
- Martinsuo, M.; Lehtonen, P. Role of single-project management in achieving portfolio management efficiency. Int. J. Proj. Manag. 2007, 25, 56–65. [Google Scholar] [CrossRef]
- Rajegopal, S.; McGuin, P.; Waller, J. Project Portfolio Management; Palgrave Macmillan: London, UK, 2007; pp. 134–136. [Google Scholar]
- Blichfeldt, B.; Eskerod, P. Project portfolio management—There’s more to it than what management enacts. Int. J. Proj. Manag. 2008, 26, 359–363. [Google Scholar] [CrossRef]
- Payne, H. Management of multiple simultaneous projects. A state-of-the-art review. Int. J. Proj. Manag. 2009, 27, 72–79. [Google Scholar] [CrossRef]
- Kaisera, M.; Arbib, F.-E.; Ahlemannc, F. Successful project portfolio management beyond project selection techniques: Understanding the role of structural alignment. Int. J. Proj. Manag. 2015, 33, 126–139. [Google Scholar] [CrossRef]
- Kopmann, J.; Kock, A.; Killen, C.; Gemünden, H. The role of project portfolio management in fostering both deliberate and emergent strategy. Int. J. Proj. Manag. 2017, 35, 557–570. [Google Scholar] [CrossRef]
- Pender, S. Managing incomplete knowledge. Why risk management is not sufficient. Int. J. Proj. Manag. 2001, 19, 79–87. [Google Scholar] [CrossRef]
- Von der Gracht, H. Consensus measurement in Delphi studies. Review and implications for future quality assurance. Technol. Forecast. Soc. Chang. 2012, 79, 1525–1536. [Google Scholar] [CrossRef]
- Paquin, J.-P.; Gauthier, C.; Morin, P.-P. The downside risk of project portfolios: The impact of capital investment projects and the value of project efficiency and project risk management programmes. Int. J. Proj. Manag. 2016, 34, 1460–1470. [Google Scholar] [CrossRef]
- Relich, M. A knowledge-based system for new product portfolio selection. In New Frontiers in Information and Production Systems Modelling and Analysis; Różewski, P., Novikov, D., Bakhtadze, N., Zaikin, O., Eds.; Springer: Cham, Switzerland, 2016. [Google Scholar]
- Project Management Institute (PMI). A Guide to the Project Management Body of Knowledge, (PMBOK© Guide), 3rd ed.; PMI: Newton Square, PA, USA, 2004. [Google Scholar]
- International Project Management Association (IPMA). International Competence Baseline Version 3.0; Van Haren Publishing NL: Zaltbommel, The Netherlands, 2006. [Google Scholar]
- Marsh, H.; Hocevar, D. Application of Confirmatory Factory Analysis to the Study of Self-concept: First- and Higher-Order Factor Models and Their Invariance across Groups. Psychol. Bull. 1986, 97, 562–582. [Google Scholar] [CrossRef]
- De Carvalho, J.; Chima, F. Applications of Structural Equation Modeling in Social Sciences Research. Am. Int. J. Contemp. Res. 2014, 4, 6–11. [Google Scholar]
- Hu, L.; Bentler, P. Cutoff Criteria for Fit Indexes in Covariance Structure Analysis: Conventional Criteria versus New Alternatives. Struct. Equ. Model. 1999, 6, 1–55. [Google Scholar] [CrossRef]
- Guilford, P. Psychometric Methods, 2nd ed.; McGraw-Hill: New York, NY, USA, 1954; pp. 482–483. [Google Scholar]
Figure 1.
Graphical representation of model no. 1.

Figure 2.
Graphical representation of model no. 2.

Figure 3.
Graphical representation of model no. 3a.

Figure 4.
Graphical representation of model no. 3b.

Figure 5.
Graphical representation of model no. 4.


Table 1.
Project portfolio risk list (names without descriptions).
| Component Risk | Structural Risk | Overall Risk |
|---|---|---|
| 1.1 Significant changes in the project or program environment 1.2 Change in an approach of key project or program stakeholders 1.3 Significant change in the basic parameters of particular portfolio elements 1.4 Improperly defined priorities for particular portfolio elements 1.5 Disturbances in information flow and communication within the portfolio elements 1.6 Ignoring risks by portfolio element managers 1.7 Lack of developed methodical standards within the scope of portfolio element management 1.8 Improperly operating steering committees of projects, project groups and programs 1.9 Conflicts between project and program managers within the portfolio 1.10 Conflicts between portfolio element managers and the parent organisation’s decision-makers 1.11 Improper competencies of project and program managers 1.12 Risks arising from the application of innovative technical and material solutions in the portfolio elements | 2.1 Too large a portfolio from the point of view of the portfolio executors’ capacity 2.2 Significant portfolio fragmentation 2.3 Overly complicated hierarchical structure of portfolio management 2.4 Significant portfolio homogeneity 2.5 Portfolio diversity range too wide from the point of view of portfolio executors’ applied capacity 2.6 Mismatch between the portfolio structure and the parent organisation’s strategy 2.7 Improper portfolio balance | 3.1 Lack of transfer of information and knowledge among the portfolio elements 3.2 Improper control over life cycles of projects and programs 3.3 Unavailability of resources necessary to execute works within the portfolio 3.4 Lack of coordination of the involvement of key resources in the execution of the portfolio 3.5 Relationships among products created by the portfolio elements 3.6 Problems with access to the portfolio financing capital 3.7 Possibility of the lack of financial liquidity within the portfolio 3.8 Portfolio financing collapse 3.9 Non-compliance of a key element strategy with the portfolio’s strategy 3.10 Conflicts among objectives of projects and programs executed within the portfolio 3.11 Conflicts between portfolio managers and portfolio element managers 3.12 Lack of involvement of top-level and middle-level managers in portfolio execution 3.13 Lack of appropriate competencies of the portfolio manager and of the portfolio support structures 3.14 Risks arising from the unknowns at the cost estimation of the execution of selected portfolio elements 3.15 Risks related to the personnel stability of the portfolio managing team and the possibility of losing key portfolio element managers 3.16 Lack of developed methodical standards within the scope of portfolio management 3.17 Formulation of fixed-price contracts for the portfolio elements |
Table 2.
Description of theoretical constructs.
| Phenomenon | Associated Risks | Risk Category |
|---|---|---|
| P1—Lack of control over the environment of the portfolio | 1.1 Occurrence of significant changes in the project or program environment | Component risk |
| 1.4 Improperly defined priorities for particular portfolio elements | ||
| 1.7 Lack of developed methodical standards within the scope of portfolio element management | ||
| 1.10 Occurrence of conflicts between the portfolio element managers and the parent organisation’s decision-makers | ||
| P2—Limitation of material and financial resources | 3.3 Unavailability of resources necessary to execute works within the portfolio | Overall risk |
| 3.7 Possibility of the lack of financial liquidity within the portfolio | ||
| 3.8 Portfolio financing collapse | ||
| P3—Problems with communication within the portfolio | 1.5 Disturbances of information flow and communication within the elements of the portfolio | Component risk |
| 3.1 Lack of transfer of information and knowledge between the elements of the portfolio | Overall risk | |
| 1.6 Ignoring risks taken by portfolio element managers | Component risk | |
| P4—Occurrence of interpersonal conflicts | 1.9 Conflicts between the project and program managers within the portfolio | Component risk |
| 3.11 Conflicts between portfolio managers and portfolio element managers | Overall risk | |
| P5—Improper portfolio structure | 2.3 Overly complicated hierarchical structure of portfolio management | Structural risk |
| 2.5 Portfolio diversity range is too wide from the point of view of the portfolio executors’ applied capacity | ||
| 2.6 Mismatch between the portfolio structure and the parent organisation’s strategy | ||
| P6—Irregularities in the portfolio balance | 1.4 Improperly defined priorities for particular portfolio elements | Component risk |
| 2.7 Improper portfolio balance | Structural risk | |
| 1.7 Lack of developed methodical standards within the scope of portfolio element management | Component risk |
Table 3.
Equations describing the structural model no. 1.
| Estimate | Std. Err | Z-Value | P(>|z|) | Std. lv | Std. all | |
|---|---|---|---|---|---|---|
| Latent variables: | ||||||
| fac1 =~ | ||||||
| y3 | 1.000 | 0.678 | 0.672 | |||
| y5 | 0.885 | 0.280 | 3.160 | 0.002 | 0.600 | 0.612 |
| y6 | 0.612 | 0.205 | 2.983 | 0.003 | 0.414 | 0.519 |
| fac2 =~ | ||||||
| x9 | 1.000 | 0.758 | 0.898 | |||
| z11 | 0.943 | 0.289 | 3.260 | 0.001 | 0.715 | 0.725 |
| Regressions: | ||||||
| fac2 ~ | ||||||
| fac1 | 0.570 | 0.207 | 2.753 | 0.006 | 0.509 | 0.509 |
Table 4.
Equations describing the structural model no. 2.
| Estimate | Std. Err | Z-Value | P(>|z|) | Std. lv | Std. all | |
|---|---|---|---|---|---|---|
| Latent variables: | ||||||
| fac1 =~ | ||||||
| x1 | 1.000 | 0.433 | 0.453 | |||
| x4 | 1.212 | 0.413 | 2.934 | 0.003 | 0.525 | 0.561 |
| x7 | 1.410 | 0.449 | 3.144 | 0.002 | 0.611 | 0.663 |
| x10 | 1.630 | 0.515 | 3.162 | 0.002 | 0.706 | 0.675 |
| fac2 =~ | ||||||
| z3 | 1.000 | 0.460 | 0.507 | |||
| z7 | 2.400 | 0.599 | 4.005 | 0.000 | 1.103 | 0.984 |
| z8 | 1.283 | 0.328 | 3.917 | 0.000 | 0.590 | 0.607 |
| Regressions: | ||||||
| fac2 ~ | ||||||
| fac1 | 0.722 | 0.289 | 2.494 | 0.013 | 0.680 | 0.680 |
Table 5.
Equations describing the structural model no. 3a.
| Estimate | Std. Err | Z-Value | P(>|z|) | Std. lv | Std. all | |
|---|---|---|---|---|---|---|
| Latent variables: | ||||||
| fac1 =~ | ||||||
| x9 | 1.000 | 0.845 | 1.000 | |||
| z11 | 0.760 | 0.229 | 3.314 | 0.001 | 0.642 | 0.651 |
| fac2 =~ | ||||||
| x5 | 1.000 | 0.695 | 0.676 | |||
| x6 | 0.967 | 0.216 | 4.477 | 0.000 | 0.672 | 0.663 |
| z1 | 1.072 | 0.226 | 4.731 | 0.000 | 0.744 | 0.796 |
| Regressions: | ||||||
| fac2 ~ | ||||||
| fac1 | 0.424 | 0.162 | 2.616 | 0.009 | 0.516 | 0.516 |
Table 6.
Equations describing the structural model no. 3b.
| Estimate | Std. Err | Z-Value | P(>|z|) | Std. lv | Std. all | |
|---|---|---|---|---|---|---|
| Latent variables: | ||||||
| fac1 =~ | ||||||
| x9 | 1.000 | 0.853 | 1.010 | |||
| z11 | 0.745 | 0.221 | 3.368 | 0.001 | 0.636 | 0.644 |
| fac2 =~ | ||||||
| x5 | 1.000 | 0.716 | 0.697 | |||
| x6 | 0.961 | 0.202 | 4.744 | 0.000 | 0.688 | 0.679 |
| z1 | 0.992 | 0.196 | 5.070 | 0.000 | 0.710 | 0.760 |
| Regressions: | ||||||
| fac2 ~ | ||||||
| fac1 | 0.308 | 0.138 | 2.236 | 0.025 | 0.367 | 0.367 |
| z12 | 0.300 | 0.087 | 3.440 | 0.001 | 0.419 | 0.458 |
| fac1 ~ | ||||||
| z12 | 0.255 | 0.085 | 2.982 | 0.003 | 0.299 | 0.326 |
Table 7.
Equations describing the structural model no. 4.
| Estimate | Std. Err | Z-Value | P(>|z|) | Std. lv | Std. all | |
|---|---|---|---|---|---|---|
| Latent variables: | ||||||
| fac1 =~ | ||||||
| x4 | 1.000 | 0.580 | 0.619 | |||
| y7 | 0.732 | 0.285 | 2.567 | 0.010 | 0.424 | 0.401 |
| x7 | 0.918 | 0.279 | 3.294 | 0.001 | 0.532 | 0.577 |
| fac2 =~ | ||||||
| z3 | 1.000 | 0.461 | 0.508 | |||
| z7 | 2.371 | 0.602 | 3.938 | 0.000 | 1.093 | 0.975 |
| z8 | 1.295 | 0.331 | 3.917 | 0.000 | 0.597 | 0.614 |
| Regressions: | ||||||
| fac2 ~ | ||||||
| fac1 | 0.570 | 0.220 | 2.590 | 0.010 | 0.718 | 0.718 |
Table 8.
Comparison of the developed and tested models.
| Model | Hypothesis | Co-Variance Coefficient | p-Value | RMSEA | CFI | Statistically * Significant |
|---|---|---|---|---|---|---|
| Model 1 | H1 (P5 –> P4) | 0.509 | 0.395 | 0.017 | 0.999 | Yes |
| Model 2 | H2 (P1 –> P2) | 0.680 | 0.201 | 0.065 | 0.967 | Yes |
| Model 3a | H3 (P4 –> P3) | 0.516 | 0.445 | 0.000 | 1.000 | Yes |
| Model 3b | H3 (P4 –> P3) | 0.367 | 0.647 | 0.000 | 1.000 | Yes |
| Model 4 | H4 (P6 –> P2) | 0.718 | 0.111 | 0.093 | 0.945 | Yes |
| Model 5 | H5 (P1 –> P4) | - | 0.715 | 0.000 | 1.000 | No |
| Model 6 | H6 (P3 –> P2) | - | 0.982 | 0.000 | 1.000 | No |
* α = 0.05.
© 2017 by the authors. Licensee MDPI, Basel, Switzerland. This article is an open access article distributed under the terms and conditions of the Creative Commons Attribution (CC BY) license (http://creativecommons.org/licenses/by/4.0/).
Share and Cite
MDPI and ACS Style
Hofman, M.; Spalek, S.; Grela, G. Shedding New Light on Project Portfolio Risk Management. Sustainability 2017, 9, 1798. https://doi.org/10.3390/su9101798
AMA Style
Hofman M, Spalek S, Grela G. Shedding New Light on Project Portfolio Risk Management. Sustainability. 2017; 9(10):1798. https://doi.org/10.3390/su9101798
Chicago/Turabian StyleHofman, Mariusz, Seweryn Spalek, and Grzegorz Grela. 2017. "Shedding New Light on Project Portfolio Risk Management" Sustainability 9, no. 10: 1798. https://doi.org/10.3390/su9101798
Note that from the first issue of 2016, this journal uses article numbers instead of page numbers. See further details here.