Technology Commercialization through Sustainable Knowledge Sharing from University-Industry Collaborations, with a Focus on Patent Propensity

Graduate School of Smart City Science Management, Hongik University, Room 306-2, Sejoung-roJochiwon, (30016) Sejong, Korea; hjh0037@ hongik.ac.kr; Tel.: +82-010-5430-5049† The current study was supported by the Hongik University New Faculty Research Support Fund.
†
The current study was supported by the Hongik University New Faculty Research Support Fund.
Sustainability 2017, 9(10), 1808; https://doi.org/10.3390/su9101808
Submission received: 29 August 2017
/
Revised: 1 October 2017
/
Accepted: 2 October 2017
/
Published: 7 October 2017
Abstract
:The process of technology commercialization involves numerous hurdles, from the original idea to its translation into the market. Patenting brings to light the research activities created through university-industry collaborations. This paper explores patent propensity, as related to commercializing innovative activities resulting from collaborations between universities and regional small and medium enterprises (SMEs). To achieve our aims, we apply a robust regression analysis to test five research hypotheses using firm-level data on 263 firms located in the Gwangju region of Korea. Our empirical results show that certain industry characteristics are negatively related to the propensity to patent. In addition, and contrary to expectations, it is found that the InnoBiz firms that the government designated as innovative SMEs are not performing any differently from general firms. It is only the CEO’s academic credentials that are found to be positively related to propensity to patent. From the findings, we can conclude that patenting propensity is likely related to CEOs’ managerial strategies rather than the particular characteristics of the technology in question. We also suggest new technology commercialization related with universities’ policies and support to promote regional SMEs including conglomerated firms as well as universities.
1. Introduction
To stay ahead in an era of incredibly rapid change and stiff global completion, firms have had to pursue access to exclusive resources, such as new knowledge. As a consequence, industry-university collaboration has emerged as a sustainable enabling solution for technology transfer and commercialization, and as a fertile breeding ground for new inventions [1,2,3,4].
Universities have important roles to play and contributions to make to the creation of knowledge and technology at the economic and social levels of a nation. University-industry collaboration may begin in response to a firm’s need for new technology, or conversely, when new knowledge generated within a scientific field yields practical applications. By means of this collaboration, it is possible to make a bridge for the exchange of new knowledge and technologies generated within the university, and the real-world practice and marketing experience of particular organizations [5,6]. Numerous prior studies argue that university-industry collaborations, in particular where these are formed within science and technology-based industrial sectors, should be recognized as an important impetus for economic growth [7]. Reference [6] argued that the more experience accumulated by biotech with university partners, the greater the performance impact of these university-industry collaborations, while [8] demonstrate that firms located in proximity to universities are likely to grow faster than other firms thanks to university-industry collaboration. In particular, these collaborations have the potential to act as a bridge in transforming academic discoveries into commercially successful innovations [6].
Absorbing new knowledge and technology from universities as well as maximizing their capacity to use that knowledge for performance gains is critical for a firm’s survival through the utilization of open innovation [9,10,11]. Not surprisingly, university activities such as technology transfer and commercialization have received much attention in the literature in recent years [12,13,14,15]. It is firms, rather than universities, which act as the main entities for commercializing innovations.
Patenting of new inventions via industry-university collaboration is the first step in a long process of commercialization. In fact, what is ‘commercialization’ from the standpoint of the firm, becomes ‘knowledge transfer’ from the point of view of the university. Technology commercialization is the act of reaching the market, using the outputs of research [16]. In order to implement the process of commercialization, there are numerous difficulties and hurdles to be overcome. Patents covering the output of innovation can be used as a tool not only for protection in innovation management but also for incentive creation, collaboration, negotiation and licensing, etc., [17,18,19].
Patent propensity can also be expected to vary according to industry, along with other factors. The object of this study is to discover whether there is any empirical evidence that characteristics of the industry, characteristics of the firm, InnoBiz (an innovative firm certified by the government), age of the firm, research division or the academic credentials of the CEO might affect a firm’s patent propensity. This paper will expound upon the ways in which innovation polices can be targeted to influence the firm’s growth. It also sheds new light on various methods of technology transfer and commercialization and on innovation polices aimed at influencing firms’ growth in a particular region. In addition, while there are a few studies which have analyzed technology transfer commercialization by using hard data, in this paper it is analyzed on the level of the firm. Also, the focus of this paper on a specific stage—patenting—sets it apart from most prior studies, which have approached industry-university collaboration from the standpoint of the overall process of technology transfer and commercialization, by means of an exploratory and qualitative approach.
In order to achieve the research goal, we considered a sample of 263 small and medium enterprises (SMEs) in manufacturing industries—including some high-tech enterprises—operating in Gwangju, South Korea, that have engaged in joint research with universities. Specifically, this paper used data on firms that had received a government designation of ‘innovative’ sometime between 2014 and 2016. The author collected the data from multiple institutions (i.e., SMEs center, the Association of Managerial Foundation in Gwangju and the InnoBiz Association). According to the findings, the CEO’s academic credentials constitute the primary factor that is positively correlated with patent propensity. Surprisingly, with regard to the characteristics of the industry, both automotive parts, and electronics and electricity are less likely to patent innovations, reflecting the fact that these industries are more interested in cost comparativeness. The lack of any significant differences in innovation activities and outcomes between InnoBiz firms and general SMEs is highly unexpected. Another factor of importance is the number of researchers, which has a positive effect on patent propensity.
The remainder of the study is structured as follows. Section 2 presents the literature review and the hypotheses we investigated. Section 3 presents our data sets, variables, and estimation methodology. Section 4 presents the results and discusses them. Finally, Section 5 presents the conclusions and implications of the research.
2. Literature Review and Hypothesis
2.1. Knowledge and Technology Transfer, and Commercialization
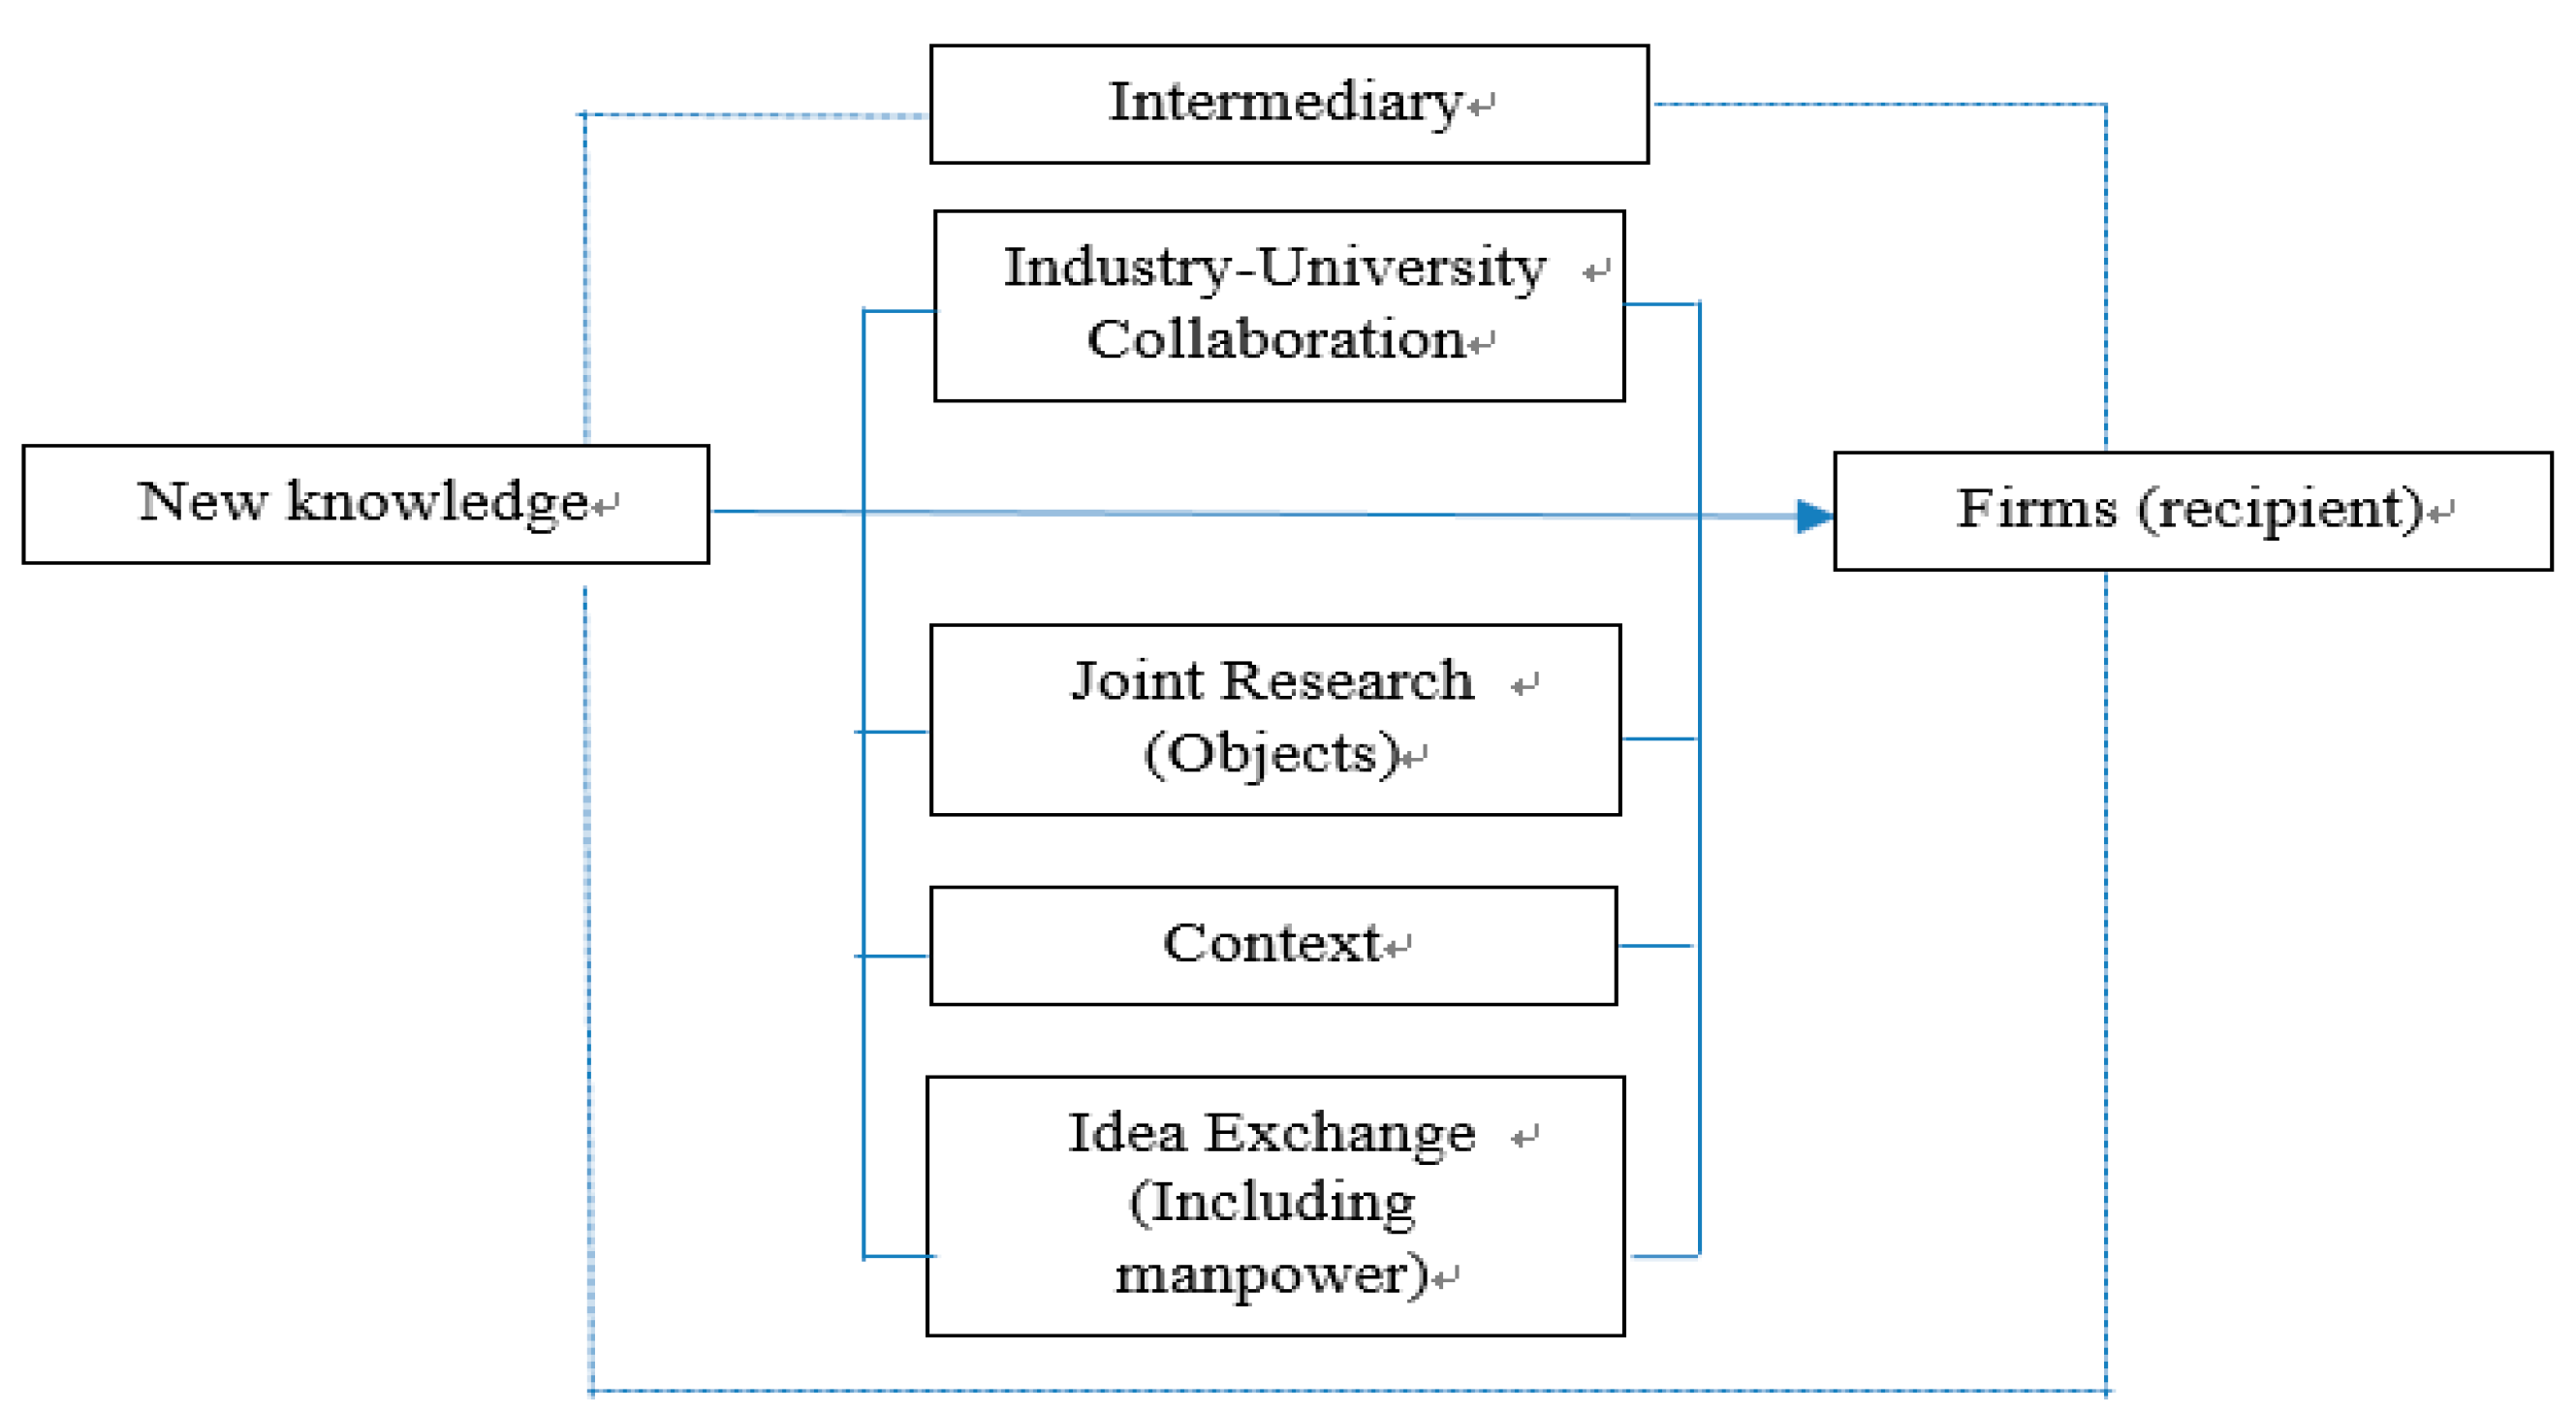
Success in the commercialization of innovation can be achieved by the acquisition of new knowledge, which involves confronting numerous hurdles related to the knowledge stream. Reference [20] defined technology transfer and commercialization as the process of acquiring ideas and complementary knowledge, and developing and manufacturing salable goods. Taking these prior definitions as a basis, technology transfer can be defined as an intentional, goal-oriented process, as displayed in Figure 1. Technology transfer typically occurs between two organizational entities: the source (universities) and the recipient (firms). The object of transfer can take on various forms (knowledge, technology, know-how, technology consulting, exchange of experts, etc.) through industry-university collaborations. The context includes intrinsic factors such as risk, duration and cost. Within universities, intermediaries such as the school’s technology transfer office and technology incubators play an important role between parties.
The knowledge and technology stream is at the core of university-industry collaboration. The intensity of a knowledge stream can be influenced by the strategic approach of an industry partner. University-industry collaboration affects strategic initiatives by, for example, combining competences, sharing resources and distributing risks. Reference [21] argue for four collaboration types according to the rate of application of knowledge and the degree of complementariness of knowledge, namely the Knowledge Chain Model, the Business Network Model, the Research Network Model and the Learning Network Model. The core of all four of the collaborations is a knowledge and technology stream that flows according to the partner’s purposes. In the Knowledge Chain Model, knowledge can be acquired and then integrated into the supply chain by an actor’s interest in sharing. The purpose of the Business Network Model is to acquire complimentary knowledge in order to achieve a strategic common goal. Likewise, the Research and Learning Network Model aims to exploit the increased knowledge and innovative capability of their participants. In fact, in order to discover new knowledge to help stay afloat in competitive markets, within the Research and Learning Network Model, a firm must purpose to seek new knowledge and applications. These are pursued by means of university-industry collaboration, which can take on various forms. In particular, a technology transfer office (TTO) functions as an intermediary to enable collaboration between the university and firms.
2.2. Patent Propensity and Innovative Firms
Patents can contribute to a firm’s performance through improvements in innovation, productivity and market value [22,23], and patent-based indicators are increasingly used to assess the rate of innovative activities. Of course, it is well-known that not all inventions are patentable and that not all patentable inventions are actually patented. At the level of the firm, an increasing number of empirical works have explored the characteristics in a particular firm which increase the likelihood of innovation within it and enhance its productivity [24]. As mentioned earlier, patent propensity varies across industries. Reference [25] demonstrated differences in patent propensity by industry, ranging from 50% in primary metals to 86% in petroleum and machinery, in a survey of 100 manufacturing firms in the United States.
Studies of European firms have confirmed such industry variations and have additionally demonstrated that patent propensity is lower for process innovations than for product innovations [17,26]. Patent protection is commonly held to be more effective in general for product innovation than process invention because the latter is more difficult to reverse engineer [18]. Based on a survey of 1300 Dutch manufacturing firms, [26] showed that patent propensity was higher among R&D-centered firms and [19] found that patent numbers correlated linearly with R&D; in other words, the more a firm invests in R&D, the more patents it registers. In addition, R&D expenditures contribute to increased diversification of activities, making SMEs more competitive [27].
Reference [23] found that a firm’s propensity to patent increases their technology leads in industries in which reverse engineering is relatively easy; that is, if a firm is highly successful but threatened by low-cost imitations, it is more likely to patent because it has more to lose. Reference [19] found that if R&D facilities are located geographically close to a firm, that firm is likely to have higher patent propensity. The regional government of Gwangju, which is located more than 390 km from the capital, Seoul, has, since 2001, been endeavoring to attract public R&D facilities to the region; as a result, there are many R&D facilities including the Korea Photonics Technology Institute in the region. According to findings by [9], more innovative firms are likely to search for new knowledge created at universities, and in fact, InnoBiz SMEs participate in more industry-university collaborations. InnoBiz firms are recognized by the Korean government as innovative. This, taken with the literature review above, leads to the following hypothesis:
Hypothesis 1.
InnoBiz firms are more likely to have patent propensity than general SMEs.
2.3. The SMEs’ Own Research Capacity
One of the most commonly measured types of innovation activities is R&D intensity. In the Triple Helix Model, the location of a firm is important both in terms of positioning it to access knowledge spillover from universities and in terms of reducing costs [8]. Firms in an optimal location also showed more positive R&D intensity [9]. Reference [19] defined R&D intensity as a firm’s patent to R&D investment ratio. Similar to Scherer’s definition, R&D intensity has commonly used the ratio of investment in research and development to turnover or total sales. In order to effectively fulfill the innovation output, inter- and intra-organizational structure and relationships are important [28]. The same study also demonstrates that in order to boost firm growth, a firm must have effective internal organization, such as that of a research institute. The functions of research institutes vary, but may include the discovery of suitable strategies for diversifying activities, which have been shown to be vital for firm survival, the forging of strategic cooperative ties between firms working together on R&D projects, the absorption of external knowledge and increasing the capacity to implement complementary strategies with other firms or R&D institutions [29].
Reference [30] found that within firms, a centralized R&D institute and long-term incentives for managers predict more heavily cited and original patents, suggesting that centralized R&D is more conducive to original research. Reference [31] found that a centralized R&D division will generate innovations that have a larger and broader impact on subsequent technological evolution compared with decentralized research. Existing small firms located in rural areas often lack their own research institutes. This is not the case, however, with InnoBiz firms, where an established in-house research division is a mandatory requirement for obtaining InnoBiz certification. Nevertheless, some small firms have their own research laboratories and allotted research budget in spite of financial difficulties. In capturing the firm’s own research activities, this paper formulates the following hypothesis:
Hypothesis 2.
The SMEs which have their own research institute and research fund are more likely to have a patent propensity than others.
2.4. Firm Size and Age
As mentioned above, SMEs are likely to look for new knowledge from universities, in particular those located in their vicinity [9]. Of course, this will vary according to the characteristics of the firm.
A number of previous studies discuss a positive relationship between firm size and patent propensity. Reference [25] surveyed 100 U.S. firms and showed that patent propensity increases with firm size, and in an empirical study of Europe’s 604 largest industrial firms, patent propensity was found to be positively correlated with the size of the firm. [17,19] showed that patent propensity differs according to industry characteristics, firm size and the geographic location of R&D facilities. In addition, Reference [19] conducted a survey of 2777 innovative firms in the 1920s and 1930s, and emphasized that patent propensity depended on whether R&D facilities exist or not. Reference [32] found, using financial, geographic, and patent data, that patent propensity was closely related to firm size.
Many firm-level studies have investigated firm growth, and [28] have concluded that smaller firms grow more rapidly than larger ones; in the context of SMEs, larger, older firms will be expected to grow less than smaller, younger ones, and therefore, we can expect that there will be a negative correlation between size and growth, and between age and growth. Small or young firms tend to have higher patent-to-R&D ratios than large firms [33]. One part of the explanation could be that small firms have higher R&D yields but lower patent propensities than large firms. Another factor could be that innovation activities in large firms are underestimated when measured with patent statistics, whereas innovation activities in small firms are underestimated when measured by R&D statistics. Based on the above considerations, we formulate the following hypothesis:
Hypothesis 3.
Older firms show greater patent propensity than younger firms.
2.5. Industry Sector and Innovation Type
Reference [34] argued, based on a review of the relevant literature, that SMEs’ innovative activities are more likely to involve product rather than process innovation, more likely to focus on niche rather than mass markets and more likely to involve linkages to external resources. Small firms are also more likely to patent, license, and convince investors and banks of the value of their inventions [35].
Innovative small firms typically have specialized technology strategies that concentrate on product innovation for specific producers’ goods, such as machine tools, scientific instruments, specialized chemicals, or software. Their key strategic strength centers around their ability to match technology with specific customer requirements, while key strategic tasks include finding and maintaining a stable product niche, and benefiting systematically from user experience. Reference [25] found that patent propensity varied depending on a firm’s characteristics, for example, their industry, ranging from 50% in primary metals to 86% in petroleum and machinery; the patentable invention-per-R&D ratio thus varies by industry. Reference [17] showed, by using a survey of 604 European industrial firms, that propensity to patent varied by industry, e.g., for product innovations, the propensity ranged from 8.1% in textiles to 79.2% in pharmaceuticals. Patent propensity is higher for product innovations (average 35.9%) than process innovations (average 24.8%). Reference [36] argued that innovation types (e.g., technology driven sectors such as biochemical and material sectors etc.) are closely related with patent propensity.
Reference [19] showed that firms in the 1920s and 1930s were more likely to patent than modern R&D firms. Industry, firm size and geographic location of R&D facilities are important determinants of the propensity to file for at least one patent. The literature review above suggests the following hypothesis:
Hypothesis 4.
Industry sector’s innovation types are related to patent propensity.
2.6. CEO’s Academic Career
Patenting is an important managerial activity. Reference [37] found that protection for property rights encouraged innovation activities. In this context, CEOs may manage their firms in order to boost innovation by means of strong protection of property rights. Reference [38] also showed that more competition increased patent propensity and R&D investment aimed at enhancing a firm’s absorptive capacity.
The skill-set of a CEO comprises both observable and quantifiable characteristics, such as education and work experience, as well as unobservable and potentially non-quantifiable characteristics, such as leadership and team-building skills. Managers make a number of strategic choices when attempting to recover returns from innovation investments, including which appropriation strategy to use and whether or not to patent; these are some of the strategic choices that depend on firm size among other factors. Interestingly, [39] showed that a CEO’s age was related to innovation performance in Korea. Namely, young CEOs are likely to have higher performance than their older CEO counterparts, and young CEOs are likely to have better academic credentials than their older counterparts.
A CEO’s education potentially impacts their ability in three non-mutually exclusive ways. First, education could potentially contribute to the CEO’s knowledge, perspective and ability to understand technical and abstract concepts. Second, a higher level of education could be a sign of the CEO’s ability to persevere in challenging intellectual activities. Finally, the social networks acquired in college and graduate schools can be helpful professionally in future innovative ventures. As discussed above, however, a CEO’s education is just one of the indicators of a CEO’s ability. It is a priori unclear how much impact the CEO’s education has on the performance of the firm. The concept of entrepreneurship is neither entirely clear in the literature nor commonly agreed upon despite its long history, arguably dating back to the seventeenth century. However, here, entrepreneurial SMEs are defined as SMEs that base their businesses on new or improved technologies and/or that are newly established or have new or improved means of commercialization and growth. Thus, the preceding literature review suggests the following hypothesis:
Hypothesis 5.
CEOs’ academic and career credentials are positively related to patents as innovation output.
2.7. Other Control Variables
We used multiple control variables in our analyses, the selection of which were guided by previous findings in the literature. For instance, we controlled for the number of researchers in this paper; if a firm has a research division, the number of researchers already affects the firm’s patent activities, in that a researcher still works primarily in a research role rather than in product development or marketing, and thus, given our sample, we controlled for the number of researchers.
3. Data and Research Methodology
As described above, the object of this study was to establish the relationship between innovative firms and patent propensity among firms in Gwangju that had engaged in any form of industry-university collaboration. The assembled dataset was composed of 15 variables that served as ways of characterizing each firm, including financial performance, over the three years from 2012 to 2014. We considered the regional industry conditions and collected data from the automotive parts and machinery, electronic and electricity, and photonics industries, accounting for form representativeness.
The data set is unique. We collected the patent data from the Korea Institute of Patent Information (KIPI), an affiliated public institute of the Korean Intellectual Property Office. The KIPI has been designated as a specialized institute that provides information on industrial property rights to build an information infrastructure for Korea’s intellectual property. We obtained the data for the independent variables (e.g., R&D intensity, firm age, CEO’s academic degree and number of researchers) from the Korean Investment Service, a Moody’s affiliate, and the Korean Small and Medium Business Administration (SMBA). The SMBA has supported Korea’s SME-led innovation, as a dynamo of the national economy. Its primary mission has been to foster challenging and innovative SMEs in order to maximize Korea’s growth potential. In particular, SMBA’s regional branch office keeps data such as CEOs’ career histories, where firm employees come from, each firm’s financial state and main product lines. We utilized these data to analyze innovative outputs as a means of complementary data.
The data came from 263 firms that had participated in industry-university collaboration programs more than once within a decade, collected from official databases and covering the period from 2012 to 2015. This formed an appropriate sample for the exploration of our research hypotheses, given that these SMEs are well-known for their high entrepreneurial and manufacturing capabilities. Concerning firm size, we used SMBA’s definition that an SME has fewer than 350 employees; the firms for our analysis employed from 1 to 303 workers, with a mean of 36. One hundred and twelve firms (43%) held InnoBiz certification. The frequency distribution of the industry variables was 151 (58%), 51 (19%) and 61 (23%) firms in the automotive parts and machinery, electronics and electricity, and photonics industries, respectively; the distribution (Figure 2) shows that Gwangju was home to the largest automotive firm, KIA, and thus, the first and second tiers of KIA are comprised of more than 50% of the regional firms. Figure 2 shows that the ratio of industry is balanced in representing the regional firms. As a global car maker, KIA has been pivotal in its contribution to the regional economy and its growth; there are many automotive product SMEs in this particular value chain. Traditionally, the electronics and electricity industry has been the second largest contributor to Gwangju’s regional economy.
From the raw data, we found that the ratio of InnoBiz firms—43%—was relatively high, particularly in view of the fact that InnoBiz certification began only in 2001; we can assume that young firms with less than ten years of operation are mainly InnoBiz firms. The data also suggests that young firms could be more innovative than others: considering the number of patents for each firm in the three years of the study, younger firms had more patents than older firms. Thus, InnoBiz firms are likely to engage in more innovative activity and to generate more patents. The Korean government selected the photonics industry as one of its high-tech industries for the 21st century and has established plans for substantial investment and systematic promotion of this industry, and in its 2001 regional economic policy, the central government designated Gwangju as a photonics industry complex area in order to boost the regional SMEs. The Korea Association for Photonics Industry Development (KAPID) was established with the purpose of developing South Korea’s photonics industry and promoting and expanding relevant businesses. As part of the government’s strong support, the KAPID was set up as a major civil organization to promote the industry, a high value-added cutting-edge industry based on new technologies.
As mentioned above, in accordance with the government’s plan to promote the photonics industry, the nation’s largest photonics-oriented industrial complex was established in Gwangju. Table 1 shows that relatively few firms (84 out of 263, 32%) had a research division, considering that 112 firms were InnoBiz certified; the data suggests that some of the InnoBiz firms do not have a research division, and certainly, just because a firm has a research division does not mean it is innovative. The average firm age was 12 years, which is relatively young. With regard to the CEOs’ academic credentials, only a few had PhDs. For the photonics industry, cutting-edge technology and pure science knowledge are required, and it can be expected that the higher the CEO’s credentials, such as a PhD, the greater the likelihood of their innovation success, but only 28 CEOs had a PhD. Interestingly, more than half of the firms in our data set had no patents; many firms have not been seeking to obtain patents as an important innovative output from the data description.
Table 2 reports the summary statistics of the data. The correlation matrix of the dependent and independent variables (Appendix A) showed that the correlations among the independent variables were not strong, suggesting that multicollinearity and confounded effects were not a serious problem.
Based on the findings from the review of literature on SMEs’ innovation activities and innovative outcomes (patents) and the availability of representative data, we may postulate a model of patent propensity as follows:
where the subscript i indicates firm, ResFun, Age, ResDiv, Researcher, InnoBiz, IndCode and CEOdeg are research fund, age of firm, research division, InnoBiz certified, industry code and CEO degree, the β’s are the effects of the explanatory variables on the number of patents and ε is an error term that captures the effects of left-out variables, measurement error in patents and random events. IndCode and CEOdeg are categorical variables. For the purpose of conducting a sensitivity analysis of the relationships between patents and the explanatory variables, we estimated approximations to multiple models using multivariate regression analysis and ordinary least squares (OLS) with robust standard errors. The results are presented below.
Patentsi = β0 + β1ResFuni + β2Agei + β3ResDivi + β4Researcheri + β5InnoBizi + β6IndCodei + β7CEOdegi + εi
In summary, the hypothesis that InnoBiz firms are more creative in patents than general SMEs (H1) was statistically rejected. SMEs’ research funds and having a research division are important in patent propensity in terms of SMEs’ performance, which was also statistically rejected with respect to the research institute (H2). The hypothesis that older firms show greater patent propensity than younger firms (H3) was statistically insignificant and thereby rejected. The industry sector’s characteristics are related to its patents (H4) was significantly negative for both the automotive parts and machinery, and electronics and electricity industries. Finally, Hypothesis 5 that CEOs’ academic careers are related to patents was statistically significantly positive for CEOs with PhDs but not below.
4. Results and Implications
Patents are frequently considered to indicate the outputs of research and development, and they can be considered useful in valuing the output of research activities. However, there are some shortcomings to patents as an indicator. For example, some companies or individuals may not want to disclose the results of their research in order to preserve exclusive or monopoly rights to their invention or innovation. In this paper, we tested five research hypotheses; in order to elaborate on the empirical findings, we also used interviews. Table 3 presents the empirical results from our patent propensity model estimates. In investigating Hypothesis 1, we found that InnoBiz firms being more creative in patents than general SMEs, was statistically rejected. As we mentioned previously, InnoBiz firms were designated by the government as more innovative than general SMEs based on their innovative performance, which was assessed based on the Oslo manual’s standardized list of innovation and innovativeness indicators. Thus, once an SME obtains InnoBiz certification, it is considered an innovation-driven firm, and as such, this finding was unexpected. Of course, innovation output can be measured by various aspects including patents and share of sales attributed to new products and processes. In light of the interesting findings of Holgersson’s study, the result for Hypothesis 1 is somewhat understandable. Reference [40] conducted a survey on patenting and entrepreneurship in the United States and analyzed the responses of 1332 early-stage technology companies that had been founded since 1998. In the findings from that study, the traditional theory that patents provide an incentive to invent was subtly adjusted; surprisingly, the start-up executives’ responses indicated that patents generally provide relatively weak incentives to conduct innovative activities.
Previous research findings show that in order to boost growth, a firm needs to have good internal research organization and capacity including a research division [28]. However, Hypothesis 2 that having a research fund and a research division are important in patent propensity in terms of SMEs’ performance was also statistically rejected with respect to having a research division. In other words, it can be assumed that firms’ research divisions may not pursue patenting but instead focus on other performance activities such as designing new product lines and creating new marketing strategies.
As mentioned above, the functions of research divisions vary and include identifying suitable strategies for diversifying activities for firm survival, strategically cooperating with other firms with respect to R&D projects, absorbing more external knowledge [41] and building capacity to implement complementary strategies with other firms or R&D institutions [31]. Second, it can be assumed that research divisions may not facilitate research and development but may give priority to survival strategies as do other management divisions. According to the interviews with researchers, there are a number of reasons for not seeking patent protection: the technology may not be patentable; the costs may be too high to prosecute and enforce the patent; there may also be the perception that with reverse engineering, patents afford relatively weak protection; and there can be the fear of disclosure. However, a somewhat expected result was that having a research fund and a number of researchers as control variables was positively related with patenting significantly.
Small or young firms tend to have higher patent-to-R&D ratios than large ones; one explanation could be that small firms have higher R&D yields but lower patent propensities than large firms. Another explanation could be that innovation activities in large firms are underestimated when measured with patent statistics whereas those in small firms are underestimated when measured by R&D statistics.
Hypothesis 3, that older firms show greater patent propensity than younger firms, was found to be statistically insignificant and thereby rejected. Considering the data analysis, we expected this finding given that more than 80% (157) of the younger firms that were less than ten years old had no patents. Even though young firms are more likely to invest in R&D through collaboration, the rejection of Hypothesis 3 maybe explained by unmeasured variables such as external effects. Based on the discussions with entrepreneurs and researchers, the most common reasons start-ups chose not to patent their innovations included not wanting to disclose the information; the cost of obtaining the patent, including attorneys’ fees; that competitors could easily invent around the patent; that they believed a trade secret was adequate protection; the cost of enforcing the patent, including court actions; that they did not believe the technology was patentable; and that they had no need for legal protection. The literature review showed that [25,42] found patent propensity to vary by firm characteristics, and the patentable-invention-to-R&D ratio varied across industries.
Hypothesis 4, that a firm’s characteristics are related to its patents, was significantly negative for both the automotive parts and machinery, and electronics and electricity industries. Based on the discussion with entrepreneurs and researchers, we found that regardless of firms’ characteristics, the reasons they did not want to patent were the cost of filing and the belief that the technology was not patentable; this finding shows that compared with industry conditions in neighboring regions such as Changwon, Gwangju is lagging behind. Our analysis of the raw data for the automotive parts and machinery industry showed that these firms originated in automotive mold manufacturing, and the mold industry has been known as the representative industry in Gwangju; in general, in the mold industry, what is important is not patenting but manufacturing with cost competitiveness. We found that core automotive and machinery parts were brought from SMEs in the Changwon area rather than Gwangju. In order to improve the automotive industry tier systems, there have recently been a number of InnoBiz firms started up with support from the local government. Electrical and electricity SMEs in Gwangju show far fewer patents than those in Changwon over the three years of the study period. However, it is interesting that electrical and electricity SMEs are notably highly productive in patenting. The local government has focused on nurturing the household robot industry in the next generation of growth engines based on the existing infrastructure, including the production technology of the biggest home appliance cluster in the country. In particular, in order to boost the household robot industry, a specialized center was established in 2011.
Surprisingly, in this study, the automotive parts and electronics and electricity industries had fewer patents. According to the information gathered through personal interviews, this finding could be attributed to KIA, a Korean car maker, and Samsung. The automotive industry is characterized by a vertically integrated structure at the center of the assembler; if a small firm as the first and/or second tier of the assembler cooperates with a car maker, this firm should follow the car maker’s requirements. Therefore, small firms appear not to implement their own managerial strategies for innovation; rather, they are likely to be subordinates of the car maker. In other words, instead of using their own innovation strategies spontaneously, SMEs mainly focus on the car maker’s requirements. That is, small firms are primarily interested in enhancing their comparative cost advantage, and as such, many SMEs are less likely to patent. Another reason for the smaller number of patents in the automotive parts industry is that assemblers require parts to be continuously produced for more than ten years once production begins, regardless of the possibility of a hiatus or cessation in car production. Nevertheless, it is very difficult to catch up with the development of new car models so that they keep in line with old products. Importantly, car makers do not like SMEs with patent propensity strategies, as revealed by the interviews. However, the appliance factory pulled out in 2008, and SMEs collaborated with Samsung to change their product lines; thus, we found no clustering effect from cooperative innovation in the empirical results.
Gwangju is located south of Seoul and has relatively few firms compared with other industrial cities in Korea; except for KIA, a large automotive firm that is representative of Korean automotive firms along with Hyundai, there are only a few firms. Since the beginning of 2000, the central government has been providing support in order to bring about a revitalization of regional industry, but in Gwangju, the most rapidly expanding industry is the photonics industry, which, owing to public policy support, has been growing rapidly since 2001. As of 2014, 364 firms and more than 8000 new employment opportunities had been created over the previous ten years. In that sense, these firms should be more innovative than other industry sectors, but we found no evidence for higher patent propensity in the photonics industry.
Managers make numerous strategic choices when attempting to capture returns from innovation investments, including a determination that the appropriation strategy is used and whether or not to patent, strategic choices that depend on the firm size among other things. A CEO’s education potentially impacts his or her abilities in three non-mutually exclusive ways. First, education could potentially contribute to the CEO’s knowledge, perspective and ability to understand technical and abstract concepts. Second, higher education could be a sign of the CEO’s intellect and ability to persevere through challenging intellectual activities. Finally, the social networks acquired in college and graduate school can be helpful professionally in the future. As discussed above, however, education is just one of the determinants of a CEO’s ability. Hence, it is a priori unclear how much impact CEO education has on firm performance.
Hypothesis 5 that CEOs’ academic careers are related to patents displayed a statistically significant positive correlation for CEOs with PhDs, but not for those with lower level degrees, a finding with important implications. First, CEOs who have a doctoral degree may tend towards innovation. In reviewing the previous studies, patents can contribute to firms’ performance through improvements in innovation, productivity and market value. In contrast, a CEO’s academic background is not related to the performance of the firm in Korea [35], but age is related in that younger CEOs are likely to perform better than older CEOs. Younger CEOs are also more likely to have higher academic degrees (e.g., more than 90% of CEOs of venture firms in Korea have PhDs) than their older counterparts. One reason for the higher academic credentials in Gwangju is likely to be the presence of the photonics industry. In addition, it is commonly known that the photonics industry is innovative, and as such, there are many InnoBiz (designated innovative) firms in Gwangju compared with other regions in Korea.
Gwangju city has nurtured the photonics industry by promoting it as a strategic regional industry since 2000, and has established an international photonics industry cluster where industrial, academic and research functions are integrated based on a high-tech scientific industrial zone structure; here, photonics-related InnoBiz firms established by CEOs with PhDs enhance the national photonics development technology infrastructure. This resulted in the establishment of the Advanced Photonics Research Institute, which includes the Korea Photonics Technology Institute. From the empirical results of this study, we note that the research fund to turnover ratio, the number of researchers, and high-caliber CEOs are positively related to patent production and are statistically significant.
This paper is distinct from prior studies in that this empirical analysis focused on the perspective from the point of view of firms, because it is firms which are the main agent in the commercialization of technology. In the majority of previous studies, technology transfer and commercialization were analyzed according to characteristics of the university (e.g., public vs. private, size, location, research driven) or the presence of a university technology transfer office [8,9,42], as well as the effects on technology transfer and commercialization by organizational function.
5. Final Remarks and Policy Suggestions
Little is known in empirical terms about patenting resulting from university-industry collaboration. Patents have been used to study a broad range of measures reflecting the performance of a firm, such as growth and survival. The ultimate policy goal with respect to industry-university collaboration (IUC) is to enhance the firm’s innovation strength. According to the empirical results it is only the CEO’s academic credentials that are found to be positively related to propensity to patent regardless of industry sector and innovation types. Patent propensity is likely to relate to the underlying managerial decision of whether to apply for patent protection for an invention or not. Empirical findings also reveal that a patent is an effective way to technology transfer from universities into firms. One reason for this might be the fact that patenting is related to technology commercialization. In a dynamic setting, to promote collaboration activities, policy supports are needed. Since the industry-university collaboration law was enacted in 2003, the promotion of industry-university collaboration has been a major regional innovation policy in Korea. Just one year after this, the policy program, New University for Regional Innovation (NURI) was enacted, with the aim of regional development stimulated by central government. Even though universities are the new knowledge creators as both partners and facilitators of small medium enterprise (SME) innovation, the key players that can directly contribute to regional development are SMEs located within specific regions. This is because the primary role of universities is to teach and to conduct basic research. In order to nurture SMEs, taking Korea’s industry ecology system into consideration, large firms are important partners for technology commercialization.
Under NURI, the roles of the university should be enlarged according to the Triple Helix Model, in that a university becomes a catalyst linking small firms and large firms. This is because according to the in-depth interview, a small or new regional venture firm can be expected to face many difficulties meeting business partners for technology commercialization. Based on data from the in-depth interviews, what is desperately needed in launching the market for SMEs on a regional basis is not only technology transfer, but support for the new policy, such as sharing risk systems (e.g., information about new markets, market trends and market competition conditions).
It is a time of incredible technological change. SMEs look to the source of new knowledge for commercialization each day. Knowledge transfer in industry-university collaboration can be either formal or informal [43,44]. While patenting propensity is likely to depend on the formal channel of knowledge transfer (i.e., contract), informal channels (i.e., personal contacts) between industry and academic researchers also have the potential to influence commercialization [45]. Universities have conspicuously expanded their missions from their original task of preserving knowledge to producing new technology and developing and disseminating new knowledge to the firms for their use. Knowledge sharing between universities and firms is critical to keep sustainable growth for both.
Technology commercialization often demands collaboration between two or more functional units that are separated by structural, cultural and organizational boundaries. The author suggests intellectual property rights alliances (IPR ALLIANCE) among universities as a bridge connecting university and industry. IPR alliance, offering patent strategic services for small firms without sufficient capabilities using the innovation outputs, can be an important hub for commercialization partners with firms. IPR Alliance can play a strategic win-win role for both universities and industries. It can be a new regional innovation ecosystem.
One of the limitations of this study was the narrow scope of patents used as a means of unveiling the knowledge from university-industry collaborations, despite the wide variety of methods associated with knowledge transfer and commercialization. Patenting propensity is also more likely to depend on managerial aspects. Even though a firm has new inventions instead of patenting, know-how or secrecy also can be associated with knowledge transfer. However, this may act as a stimulus for additional research directed specifically towards the commercialization processes relating to universities.
Acknowledgments
The current study was supported by the Hongik University New Faculty Research Support Fund.
Conflicts of Interest
The authors declare no conflict of interest.
Appendix A

Table A1.
Correlation coefficients, (N = 263).
| (1) | (2) | (3) | (4) | (5) | (6) | |
|---|---|---|---|---|---|---|
| InnoBiz | Firmage | Resdiv | Researcher | Patent | Resfund | |
| (1) | 1.0000 | |||||
| (2) | 0.1915 0.0018 | 1.0000 | ||||
| (3) | 0.2511 <0.0001 | 0.0383 0.5360 | 1.0000 | |||
| (4) | 0.0160 0.7954 | 0.1348 0.0288 | 0.6932 <0.0001 | 1.0000 | ||
| (5) | 0.0713 0.2488 | 0.0665 0.2823 | 0.2639 <0.0001 | 0.3308 <0.0001 | 1.0000 | |
| (6) | 0.0606 0.3271 | −0.0081 0.8950 | 0.2571 <0.0001 | 0.1348 0.0288 | 0.3811 <0.0001 | 1.0000 |
Note: Person Correlation Coefficients, Pr > |r| H0; Rho = O.
References
- Abbate, T.; Cesaroni, F. The market orientation of academic spin-off firms. Int. J. Entrep. Innov. Manag. 2017, 21, 395–421. [Google Scholar] [CrossRef]
- Galati, F.; Bigliardi, B.; Petroni, A.; Marolla, G. Which factors are perceived as obstacles for the growth of Italian academic spin-offs? Technol. Anal. Strateg. Manag. 2017, 29, 84–104. [Google Scholar] [CrossRef]
- Munari, F.; Sobrero, M.; Toschi, L. Financing technology transfer: Assessment of university-oriented proof-of-concept programmes. Technol. Anal. Strateg. Manag. 2017, 29, 233–246. [Google Scholar] [CrossRef]
- Bigliardi, B.; Galati, F.; Marolla, G.; Verbano, C. Factors affecting technology transfer offices’ performance in the Italian food context. Technol. Anal. Strateg. Manag. 2015, 27, 361–384. [Google Scholar] [CrossRef]
- Etzkowitz, H. The evolution of the entrepreneurial university. Int. J. Technol. Glob. 2004, 1, 64–77. [Google Scholar] [CrossRef]
- Rothaermel, F.T.; Deeds, D.L. Alliance type, alliance experience and alliance management capability in high-technology ventures. J. Bus. Ventur. 2006, 21, 429–460. [Google Scholar] [CrossRef]
- Cohen, W.; Nelson, R.; Walsh, J. Links and impacts: The influence of public research on industrial R&D. Manag. Sci. 2002, 48, 1–23. [Google Scholar]
- Audretsch, D.E.; Lehmann, E.; Warning, S. University spillovers and new firm location. Res. Policy 2005, 34, 1113–1122. [Google Scholar] [CrossRef]
- Han, J.H.; Heshmati, A. Determinants of financial rewards from industry-university collaboration in South Korea. Int. J. Innov. Manag. 2016, 20. [Google Scholar] [CrossRef]
- Yun, J.J. How do we conquer the growth limits of capitalism? Schumpeterian dynamics of open innovation. J. Open Innov. Technol. Mark. Complex. 2015, 1, 1–20. [Google Scholar] [CrossRef]
- Yun, J.J.; Jeong, E.S.; Yang, J.H. Open innovation of knowledge cities. J. Open Innov. Technol. Mark. Complex. 2015, 1–16. [Google Scholar] [CrossRef]
- Póvoa, L.M.C.; Rapini, M.S. Technology transfer from universities and public research institutes to firms in Brazil: What is transferred and how the transfer is carried out. Sci. Public Policy 2010, 37, 147–159. [Google Scholar] [CrossRef]
- Boh, W.F.; De-Haan, U.; Strom, R. University technology transfer through entrepreneurship: Faculty and students in spinoffs. J. Technol. Trans. 2016, 41, 661–669. [Google Scholar] [CrossRef]
- Lee, S.; Kim, B.S.; Kim, Y.; Kim, W.; Ahn, W. The framework for factors affecting technology transfer for supplier and buyers of technology in Korea. Technol. Anal. Strateg. Manag. 2017, 1–14. [Google Scholar] [CrossRef]
- Bengtsson, L. A comparison of university technology transfer offices’s commercialization strategies in the Scandinavian countries. Sci. Public Policy. 2017, 44, 565–577. [Google Scholar]
- Bradley, S.; Hayter, C.; Link, A. Models and methods of university technology transfer. Found. Trends Entrep. 2013, 9, 571–650. [Google Scholar] [CrossRef]
- Arundel, A.; Kabla, I. What percentage of innovations are patented? Empirical estimates for European firms. Res. Policy 1998, 27, 127–141. [Google Scholar] [CrossRef]
- Granstrand, O. The Economics and Management of Intellectual Property; Edward Elgar Publishing: Cheltenham, UK, 1999; pp. 212–222. [Google Scholar]
- Nicholas, T. Did R&D firms used to patent? Evidence from the first innovation surveys. J. Econ. Hist. 2011, 71, 1029–1056. [Google Scholar]
- Mitchell, W.; Singh, K. Survival of businesses using collaborative relationships to commercialize complex goods. Strateg. Manag. J. 1996, 17, 169–195. [Google Scholar] [CrossRef]
- Grimaldi, M.; Cricelli, L. Knowledge-based Inter-Organizational Collaborations. J. Knowl. Manag. 2010, 14, 348–358. [Google Scholar]
- Bloom, N.; Van Reenen, J. Patents, real options and firm performance. Econ. J. 2002, 112, 97–116. [Google Scholar] [CrossRef]
- Wagner, M. On the relationship between environmental management, environmental innovation and patenting: Evidence from German manufacturing firms. Res. Policy. 2007, 36, 1587–1602. [Google Scholar] [CrossRef]
- Heger, D.; Zaby, A.K. Giving away the game? The impact of the disclosure effect on the patenting decision. ZEW Discuss. Pap. 2012, 12–22. [Google Scholar] [CrossRef]
- Mansfield, E. Patents and innovation: An empirical study. Manag. Sci. 1986, 32, 173–181. [Google Scholar] [CrossRef]
- Brouwer, E.; Kleinknecht, A. Innovation output, and a firm’s propensity to patent: An exploration of CIS micro data. Res. Policy 1999, 28, 615–624. [Google Scholar] [CrossRef]
- Roger, M. Networks firm size and innovation. Small Bus. Econ. 2004, 22, 141–153. [Google Scholar] [CrossRef]
- Eisingerich, A.B.; Rubera, G.; Seifert, M. Managing service innovation and inter-organizational relationships for firm performance: To commit or diversify? J. Serv. Res. 2009, 11, 344–356. [Google Scholar] [CrossRef]
- Arora, A.; Gambardella, A. Markets for Technology and their Implications for Corporate Strategy. Ind. Corp. Chang. 2001, 10, 419–451. [Google Scholar] [CrossRef]
- Lerner, J.; Wulf, J. Innovation and Incentives: Evidence from Corporate, R&D. Rev. Econ. Stat. 2007, 89, 634–644. [Google Scholar]
- Argyre, N.; Silverman, B. R&D organization structure and the development of corporate technological knowledge. Strateg. Manag. J. 2014, 25, 929–958. [Google Scholar]
- Chabchoub, N.; Niosi, J. Explaining the propensity to patent computer soft software. Technovation 2005, 25, 971–978. [Google Scholar] [CrossRef]
- Bound, J.; Cummins, C.; Griliches, Z.; Hall, B.H.; Jaffe, A.B. Who does R&D and who patents? In R&D, Patents and Productivity; Griliches, Z., Ed.; University of Chicago Press: Chicago, IL, USA, 1984; pp. 21–54. [Google Scholar]
- Hoffman, K.; Parejo, M.; Bessant, J.; Perren, L. Small firms, R&D technology and innovation in the UK: A literature review. Technovation 1998, 18, 39–55. [Google Scholar]
- Rassenfosse, G. How SMEs exploit their intellectual property assets: Evidence from survey data. Small Bus. Econ. 2012, 39, 437–452. [Google Scholar] [CrossRef]
- Marcus, H. Patent management in entrepreneurial SMEs: A literature review and an empirical study of innovation appropriation, patent propensity, and motive. R&D Manag. J. 2012, 43, 21–36. [Google Scholar]
- Boldrin, M.; Levine, D.K. Against Intellectual Monopoly; Cambridge University Press: Cambrige, UK, 2008; pp. 23–33. [Google Scholar]
- Barry, B.; Heather, R.; Jan, Y. The evolving state-of-art in technology transfer research: Revising the contingent effectiveness model. Res. Policy 2015, 44, 34–49. [Google Scholar]
- Kim, J.H.; Han, J.H. Differentiated Effects of Product Strategy and CEO Characteristics on Venture Firms’ Growth: The Moderating Role of Organizational Life Cycle Stage. J. Technol. Innov. 2014, 22, 25–58. (In Korean) [Google Scholar]
- Hall, B.H. Exploring the patent explosion. J. Technol. Trans. 2004, 30, 35–48. [Google Scholar] [CrossRef]
- Azagra-Caro, J.M.; Barberá-Tomás, D.; Edwards-Schachter, M.; Tur, E.M. Dynamic interactions between university-industry knowledge transfer channels: A case study of the most highly cited academic patent. Res. Policy 2017, 46, 463–474. [Google Scholar]
- Siegel, D.S.; Wright, M. Intellectual property: The assessment. Oxf. Rev. Econ. Policy 2007, 23, 529–540. [Google Scholar] [CrossRef]
- Powers, J.B.; McDoougall, P. University start-up formation and technology licensing with firms that go public: A resource-based view of academic entrepreneurship. J. Bus. Ventur. 2005, 20, 291–311. [Google Scholar] [CrossRef]
- Vedovello, C. Science parks and university-industry interaction: Geographical proximity between the agent as a driving force. Technovation 1997, 17, 491–531. [Google Scholar] [CrossRef]
- Carayannis, E.G.; Cherepovitsyn, A.Y.; Ilinova, A.A. Technology commercialization in entrepreneurial universities: The US and Russian experience. J. Technol. Trans. 2016, 41, 1135–1147. [Google Scholar] [CrossRef]
Figure 1.
The dimensions of knowledge and technology transfer.

Figure 2.
Frequency distribution of firms by industry classification.

Table 1.
The frequency distributions of the categorical variables (n = 263).
| Variables | Frequency | Percent (%) | Cumulative Frequency | |
|---|---|---|---|---|
| Industry | Industry 1 (automotive parts and machinery) | 151 | 58 | 151 |
| Industry 2 (electronics and electricity) | 51 | 19 | 202 | |
| Industry 3 (photonics) | 61 | 23 | 263 | |
| InnoBiz | 1 (for InnoBiz firm, otherwise 0) | 112 | 43 | 112 |
| 0 | 151 | 57 | 263 | |
| Firm age | 1~10 years | 109 | 42 | 109 |
| 11~20 years | 122 | 45 | 231 | |
| More than 21 | 32 | 13 | 263 | |
| Research Division | 1 (for yes, otherwise 0) | 84 | 32 | 263 |
| 0 | 179 | 68 | 179 | |
| Patents | 1~10 | 74 | 28 | 253 |
| More than 11 | 10 | 4 | 263 | |
| CEO Academic degree | Master’s degree or below | 235 | 89 | 235 |
| PhD | 28 | 11 | 263 | |
Table 2.
Summary statistics of variables.
| Variable | Definition of Variable | Mean | StdDev | Minimum | Maximum |
|---|---|---|---|---|---|
| Patent | Number of patents created during the 3 years (dependent variable) | 1.76 | 3.64 | 0.00 | 28.00 |
| Res Fund | Total research expenditure (in 1000 KW) | 54,802 | 175,621 | 0.00 | 141,696 |
| Ind Code1 | Automotive parts and machinery, dummy | 0.25 | 0.43 | 0.00 | 1 |
| Ind Code2 | Electronics and electricity industry, dummy | 0.19 | 0.40 | 0.00 | 1 |
| Ind Code3 | Photonics industry, dummy | 0.23 | 0.42 | 0.00 | 1 |
| InnoBiz | Innovative firm certified by the government | 0.43 | 0.50 | 0.00 | 1 |
| Firm age | Number of years the firm has been in existence from its foundation | 12.59 | 6.07 | 2.00 | 32.00 |
| Res Div | Research division within an SME, dummy | 0.32 | 0.47 | 0.00 | 1 |
| Researcher | Number of researchers in the research division | 1.59 | 3.35 | 0.00 | 21 |
| CEO deg1 | CEO graduated from university, dummy | 0.48 | 0.50 | 0.00 | 1 |
| CEO deg2 | CEO has a PhD, dummy | 0.11 | 0.31 | 0.00 | 1 |
| Employees | Number of employees | 35.59 | 45.54 | 1.00 | 303 |
Note: Other industries and high school degree are reference categories.
Table 3.
Least squares estimation results for the patent propensity model, n = 263.
| Dependent Variable | Patent | ||||||
|---|---|---|---|---|---|---|---|
| Variable | Parameter Estimate | OLS Std Error | t-Value | Pr > |t| | Heterosc. Consistent Std Errors | ||
| Std Error | t-Value | Pr > |t| | |||||
| Intercept | 1.1375 | 0.6236 | 1.82 | 0.0056 | 0.4290 | 2.65 | 0.0051 |
| Ln Res fund | 0.2086 | 0.0424 | 4.91 | 0.0001 | 0.0645 | 3.24 | 0.0014 |
| Ind Code1 | −1.5276 | 0.5368 | −2.85 | 0.0048 | 0.5005 | −3.05 | 0.0025 |
| Ind Code2 | −1.3415 | 0.5930 | −2.26 | 0.0245 | 0.6684 | −2.01 | 0.0458 |
| Ind Code3 | −0.9689 | 0.5445 | −1.78 | 0.0762 | 0.6226 | −1.56 | 0.1209 |
| InnoBiz | 0.2530 | 0.4463 | 0.57 | 0.5714 | 0.4481 | 0.56 | 0.5729 |
| Firm age | 0.0128 | 0.0340 | 0.38 | 0.7069 | 0.0291 | 0.44 | 0.6600 |
| Res div. | −0.0732 | 0.6383 | −0.11 | 0.9088 | 0.6039 | −0.12 | 0.9037 |
| Researcher | 0.2976 | 0.0849 | 3.50 | 0.0005 | 0.1150 | 2.59 | 0.0102 |
| CEO deg1 | −0.1076 | 0.4292 | −0.25 | 0.8023 | 0.3653 | −0.29 | 0.7686 |
| CEO deg2 | 1.8790 | 0.6989 | 2.69 | 0.0077 | 1.1389 | 1.65 | 0.1002 |
| Root MSE | 3.2013 | ||||||
| CoeffVar | 179.9013 | ||||||
| F-value (prob.) | 8.6300 (0.0001) | ||||||
| Adj R2 | 0.2256 | ||||||
© 2017 by the author. Licensee MDPI, Basel, Switzerland. This article is an open access article distributed under the terms and conditions of the Creative Commons Attribution (CC BY) license (http://creativecommons.org/licenses/by/4.0/).
Share and Cite
MDPI and ACS Style
Han, J. Technology Commercialization through Sustainable Knowledge Sharing from University-Industry Collaborations, with a Focus on Patent Propensity. Sustainability 2017, 9, 1808. https://doi.org/10.3390/su9101808
AMA Style
Han J. Technology Commercialization through Sustainable Knowledge Sharing from University-Industry Collaborations, with a Focus on Patent Propensity. Sustainability. 2017; 9(10):1808. https://doi.org/10.3390/su9101808
Chicago/Turabian StyleHan, Junghee. 2017. "Technology Commercialization through Sustainable Knowledge Sharing from University-Industry Collaborations, with a Focus on Patent Propensity" Sustainability 9, no. 10: 1808. https://doi.org/10.3390/su9101808
Note that from the first issue of 2016, this journal uses article numbers instead of page numbers. See further details here.