Economic and Environmental Optimization of an Airport Terminal Building’s Wall and Roof Insulation


1
School of Civil Aviation, Dicle University, TR-21280 Diyarbakır, Turkey
2
Department of Airframe and Power Plant Maintenance, Faculty of Aeronautics and Astronautics, Anadolu University, TR-26470 Eskisehir, Turkey
*
Author to whom correspondence should be addressed.
Sustainability 2017, 9(10), 1849; https://doi.org/10.3390/su9101849
Submission received: 26 July 2017
/
Revised: 6 October 2017
/
Accepted: 11 October 2017
/
Published: 18 October 2017
(This article belongs to the Section Energy Sustainability)
Abstract
:HVAC systems use the largest share of energy consumption in airport terminal buildings. Thus, the efficiency of the HVAC system and the performance of the building envelope have great importance in reducing the energy used for heating and cooling purposes. In this study, the application of thermal insulation on the walls and roof of the Hasan Polatkan Airport terminal building was investigated from energy, environment and cost aspects. This study determined the optimum insulation thickness and assessed its effects on environmental performance based on energy flows. Environmental payback periods were calculated depending on the optimum insulation thickness. The life cycle assessment (LCA) method was used to assess whether the decrease in energy consumption after applying the insulation balanced the environmental effects during the period between the production and application of the thermal insulation material. The global warming potential (GWP) based on IPCC100, and the effects on human health (HH), the ecosystem and natural resources were evaluated according to the ReCiPe method. LCA results were obtained by processing data taken from ecoinvent 3 database present in the Sima Pro 8.3.0.0 software. Applying thermal insulation on the walls and roof of the terminal building was found to decrease heat loss by 48% and 56%, respectively. In addition, the analyses showed that the environmental payback periods for the thermal insulation were shorter than the economic payback periods.
1. Introduction
Studies have shown that greenhouse gas emissions, especially fossil-fuel-based CO2, play a leading role in global warming. In recent years, climate change and fossil fuel-based greenhouse gas emissions have become one of the most important environmental problems [1]. Global energy consumption will increase by an estimated 56% by 2040. Most of this demand is met by fossil fuels, which will cause serious problems regarding the depletion of energy resources as well as global warming issues [2]. If necessary precautions are not taken to decrease CO2 and other greenhouse gas emissions, the Earth’s surface temperature will increase by an estimated 1.1–6.4 °C in the late 2100s [3]. An average temperature increase of 2 °C may do irreversible damage to the environment, human health (HH) and natural ecosystems [4]. According to the joint resolution taken during the 2015 Paris Accords, 195 countries committed to an increase in global temperature of no more than 1.5 °C above preindustrial periods [5]. Energy consumption, like global warming, has very important effects on HH, ecosystems and natural resources.
The International Energy Agency (IEA) has explained that the transportation sector’s 26.4% share of carbon emissions is a criterion for climate change and global warming threat, with the aviation sector representing approximately 2% of this effect [3]. The International Civil Aviation Organization (ICAO) estimates that the aviation sector represents 2% share of all CO2 emissions, which will increase by approximately 3–4% every year [6]. The rapid development of aviation in the last 20 years has brought increasing energy demand from airports. The number of airline passengers increases by approximately 5% each year, which is associated with the fact that different flight points (cities and countries) are involved in the system. The involvement of different flight points in the system has led to an increased number of airports and other aviation facilities. The number of airports operating in Turkey was 37 in 2003, which increased to 55 in 2017, and is estimated to increase in the coming years [7,8].
In general, when examining the energy consumption at airports, terminal buildings have the largest share, as seen in Figure 1 [7].
The HVAC system uses the largest share of the energy consumed at terminal buildings, as seen in Figure 2 [9]. Terminal buildings generally have areas and volumes that are too large, and comfort conditions cause higher energy consumption. Thus, HVAC systems must be emphasized in energy efficiency studies of airport terminal buildings. Regarding the quantity of energy consumed for air-conditioning in terminal buildings, the performance of the building envelope also has a very important role, as does the efficiency of the HVAC system.
Approximately 70% of the energy consumed in airport terminal buildings is used for heating, cooling and air conditioning purposes; this rate is higher in countries with cold climates. Thus, the building envelope has great importance in the energy amount used, especially for heating and cooling. Some critical components for decreasing energy consumption used for heating and cooling purposes include [10]:
- Determination of the optimum insulation thickness through life cycle cost (LCC) assessment to decrease the thermal loss under cold climate conditions (from the walls, roof and ground);
- Low thermal transmittance and high-performance windows with a suitable solar heat recovery coefficient;
- Roofs and walls with reflective surfaces for warm climates;
- A sealing level in the structure that prevents infiltration;
- Minimization of the thermal bridges on the building envelope; and
- Passive solar design.
Thermal insulation is one of the most important factors in decreasing energy usage in buildings, especially for heating and cooling purposes. Determining the optimum thickness of the insulation for the building envelope is important in terms of environment, energy saving and cost [11,12]. Insulation in the buildings is a simple yet very important energy-efficient method that can be applied in all residential, commercial and industrial areas. Thermal insulation materials have high thermal resistance to decrease the thermal flow rate of a material or composite material [13].
Airports consume very large amounts of energy for reasons such as the increasing number of passengers, increased airport capacities and the comfort requirements of terminal buildings in parallel to the development of aviation. There are numerous studies on energy efficiency and sustainability at airports. Balaras et al. [14] determined that installing thermal insulation on external walls and roofs and replacing single-glazed windows with double-glazed windows in 29 airports in Greece considerably reduced the energy used to heat and cool the terminal buildings, and the initial investment cost would be returned economically within a short time period. Mardaljevic [15] examined a roof-shadowing system installed on the 3rd Terminal building of Changi Airport and studied the maximum utilization due to daylight. Cardona et al. [16] examined the compliance of combined heating and cooling power (CHCP) systems in terminal buildings of three existing airports in Italy in terms of energy savings. In addition, Cardona et al. [17] examined the CHCP plant used at the Malpensa 2000 international airport in terms of its energy efficiency and energy management. Koroneos et al. [18] developed an optimization model for renewable energy resources to meet the energy demands of Thessaloniki airport in Macedonia, such as for heating, cooling and lighting, and to determine optimum sharing. Somcharoenwattana et al. [19] chose an airport in Thailand as a case and assessed the use of cogeneration plants at the airport in terms of energy efficiency and the environment. Zomer et al. [20] examined the photovoltaic (PV) systems used to produce renewable energy at two airports in Brazil. Sun et al. [21] recommended a method of integrating chilled water systems into adjacent buildings to transfer excess cooling from one building to another to enhance the general energy performance of Hong Kong International Airport. Kılkış [22] analyzed the environmental effects of incorrect location selection of a new airport with a passenger capacity of 150 million passengers per year, including 657,000 trees cut down in the area of the airport to be built in Istanbul. It was concluded that increasing the capacities of existing airports in Istanbul would be more economic and promote higher conservation. Kilkis and Kilkis [23] developed a sustainability ranking index with five dimensions (airport services and quality, energy consumption and generation, carbon dioxide emissions and mitigation planning, environmental management and biodiversity, and atmosphere and low emission transport). It is possible to decrease the environmental effect of airports by consuming energy generated from renewable energy sources. In the analyses performed by Sukumaran and Sudhakar [24] at the 12 MW solar-powered Cochin International Airport Limited (CIAL) airport, they verified that the airport had nearly zero carbon footprint and was clean, green and sustainable economically and environmentally.
The examinations and studies have shown that optimum insulation thicknesses are not assessed in terms of environment and cost for the heat losing and gaining surfaces in the airport terminal buildings. In this study, the optimum insulation thickness of Hasan Polatkan International Airport was determined. Environmental payback periods were calculated depending on the optimum insulation thickness. Environmental calculations were performed by using the Life Cycle Assessment (LCA) method. In environmental calculations, global warming potential (GWP) was assessed according to IPCC 100a, and it was expressed as being CO2 equivalent. The total effects of HH, ecosystems damage (ED), and resource availability (RA) were determined according to ReCiPe method, which expresses them by a single score of mPt. For the renovation processes to be performed at airport terminal buildings, the optimum insulation thickness effect and LCA methods have been assessed in this study for the first time, which will bring a different point of view to the literature.
2. Materials and Methods
2.1. Airports and Terminal Buildings
Airports are very important points for local, national and global transportation. Main airport functions include providing access to air transportation both for passengers and cargo. Rapid growth of aviation during the last 20 years has caused a significant increase in the number of airports. Airports can be examined in two areas: airside and landside. The landside area includes terminal buildings, cargo terminals and vehicle parking. In this area, the main customer is the passenger and all the activities are performed to meet the needs of the passengers. The airside (apron, aerodrome, control tower, aircraft maintenance plants, etc.) area covers all the facilities and buildings regarding the aircraft. When the airports are examined in terms of energy consumption amounts, they consume almost as much energy as a small city [7].
- Airport size (area and volume of conditioned spaces)
- Airport architecture (compact, pier finger terminals, satellite terminals, and remote satellite terminals)
- Airport location—climate (average temperature, humidity, HDD, and CDD)
- Operational hours
- Terminal building insulation
- HVAC system and control unit
- Passenger and employee behavior
- Energy management
- Airport maintenance level
- Aircraft maintenance facility’s Capacity
- Daylight utilization
- Solar heating utilization during winter
- Traffic density
- Passenger number
- Proper mechanical and electrical systems operations
Hasan Polatkan International Airport, which is within the body of Anadolu University, Faculty of Aeronautics and Astronautics, opened to traffic on 29 March 1989. It was established to meet the demand for flight training for the pilot department of Anadolu University, Faculty of Aeronautics and Astronautics and for air transportation for Eskişehir and the surrounding cities. Until July 2005, it was used to train for flights and for purposes such as air taxi, ambulance, training flights of private flight schools, maintenance, VIP, emergency landing, etc. As of 2005, the airport was opened to international traffic. The airport operated within the scope of the university, and there was a terminal building, an air traffic control tower, two aircraft maintenance hangars, a fire station building and a meteorology station. In 2015 and 2016, the airport served 6046 and 6523 commercial and training flights, respectively, and it is estimated that this figure will increase in the coming years [26,27].
The visualizations taken by a thermal camera at the Hasan Polatkan Airport Terminal building show that thermal losses and thermal irregularities were pretty high in the building envelope. Total wall and roof areas were calculated from the architectural project of the terminal building, and as seen in Figure 3 and Figure 4, it is observed that the total area of these surfaces was relatively high. Then, the heat transfer coefficient (U) of the walls, windows and roof was calculated using a multifunctional measuring device. In addition, the U values—depending on the current structural components in the architectural project (wall and roof)—were calculated, and they were nearly the same as the values measured. The absence of thermal insulation on the building envelope causes high environmental effects related to the use of energy and the energy consumption used for heating purposes. In this study, the energy consumption caused by the lack of thermal insulation at Hasan Polatkan Airport and the relevant environmental effects will be assessed. The renovation and retrofit processes to be applied to the buildings (thermal insulation) will significantly decrease the energy used for heating and cooling purposes. Only the LCA method can determine whether the positive environmental effects due to the reduction in energy will balance the negative environmental effects caused by the renovation processes.
2.2. Heat Losses at the External Walls and Roof
Heat losses and gains at the buildings occur due to the air infiltration and via the walls, roof, floor and windows on the external surfaces. One of the most frequently used methods for determining the energy amount required for heating and cooling is the degree-day method. The degree-day number can be calculated in Equations (1) and (2) by determining an equilibrium temperature. The value of the equilibrium temperature can be selected for which no heating and cooling is required. The equilibrium temperature varies according to the temperature of the internal environment requested, the characteristics of the building and the usage. Traditionally, 18 °C is the equilibrium temperature for heating, and 22 °C is equilibrium temperature for cooling. These were selected and the degree-day value was calculated. For Eskişehir, heating degree-day (HDD) and cooling degree-day (CDD) values were calculated by taking the average of outdoor air temperatures for long years as a basis [12,28].
is the base temperature and is the daily mean outdoor temperature.
Annual heat losses and gains for the unit surface area can be calculated, as shown in Equations (3) and (4), by using the U and degree-day values [11,29,30,31,32].
𝜂 is the efficiency of the heating system, and COP is the performance coefficient of the cooling system.
The total U value for a typical surface including thermal insulation is:
where Ri and R0 are the inside and outside thermal resistances of air film, respectively, and Rw is the heat transfer resistance of uninsulated surface (wall and roof). Rins is the thermal resistance of insulation.
where k is the thermal conductivity of the insulation, and x is the thickness of the insulation.
Rw,t is the total thermal resistance of non-insulated surface:
The total heat transfer coefficient, including insulation material, is given as follows:
The annual energy need for heating, can be calculated by the following Equation.
The annual energy demand for cooling, can be calculated by the following Equation.
2.3. Determining the Optimum Insulation Thickness
The application of insulation on the external surfaces of the building envelope significantly decreased the thermal losses and gains across the building’s surface. To calculate optimum insulation thickness, a cost analysis should be done. Annual heating and cooling cost analyses for unit surface area can be calculated by the following Equations [11].
and are the annual heating and cooling costs for the unit area, respectively; is the unit price of the fuel used for heating; and is the unit price of electricity. H is the lower heating value of the fuel. Optimum insulation thickness can be calculated as shown below. Present worth factor is a function of interest and inflation ratio [12,29,30,31,32,33].
When ,
When ,
When ,
where is the interest rate, is the inflation rate, PWF is the present worth factor, LT is the lifetime and r represents actual interest rate. The LT value used in the calculations, the lifetime of the building or the lifetime of the insulation material can be selected. In numerous studies, this calculation was performed by selecting 10, 20, 25 and 30 years for this value. In this study, calculation was made by accepting LT as being 20 years.
The cost of the thermal insulation material is calculated by using the following Equation.
, and are the heating, cooling and heating–cooling costs, respectively.
Optimum insulation thickness is calculated by minimizing the heating and cooling costs. Derivatives of Equations (18)–(20), according to were taken, and they were equalized to zero. Thus, the optimum insulation thickness can be found. Optimum insulation thicknesses for heating, cooling and both heating and cooling are calculated in Equations (21)–(23).
The optimum insulation thickness for cooling follows:
The optimum insulation thickness for heating and cooling follows:
2.4. Payback Period
In this study, the period when the monetary value of the energy saved for heating and cooling after the building envelope is insulated and how it would balance the initial investment cost for insulation was evaluated. The annual hard savings after insulation only done for heating can be calculated, as in Equation (24). The annual hard savings for both heating and cooling can be calculated, as in Equation (25). CH and CH,C signify the heating energy cost and both heating and cooling energy cost before insulation [11].
Payback period:
In this study, expanded polystyrene (EPS) was selected as the thermal insulation material. The price and density of the insulation material for the walls and roofs were considered to be the values determined by the Ministry of Environment and Urbanization. Density-related k values were accepted as the values in the current production standard, and the calculations were done accordingly [34]. Table 1 shows the values. Parameters used in the calculations are summarized in Table 2. The airport is heated by floor-type condensing boilers, and natural gas is used as the resource. In addition, floor-type split air conditioners are used for cooling.
3. Life Cycle Assessment
Life cycle assessment (LCA) is a method that assesses all environmental aspects (climate change, HH, ecosystems, and resource) during the period elapsing from when the raw material of a product or a process from nature is obtained until its return to nature as a waste. The stages of a life cycle include all the steps: obtaining the raw material from nature, processing and converting it into a product or service, handling and distribution, being used by the consumer, going to waste or being recycled [35,36]. The LCA method includes the purpose and scope, life cycle inventory, life cycle impact assessment (LCIA) and interpretation steps, according to ISO 14040 [37] and ISO 14044 [38].
The purpose of this study was to analyze the environmental effects of the thermal insulation applied on the walls and roof and the absence of thermal insulation (actual case) on the airport terminal building envelope. It also aimed to investigate whether environmental effects caused by the amount of natural gas saved for heating after the thermal insulation was balanced in the periods that elapsed from production of thermal insulation material to its application to the wall and roof of the terminal building.
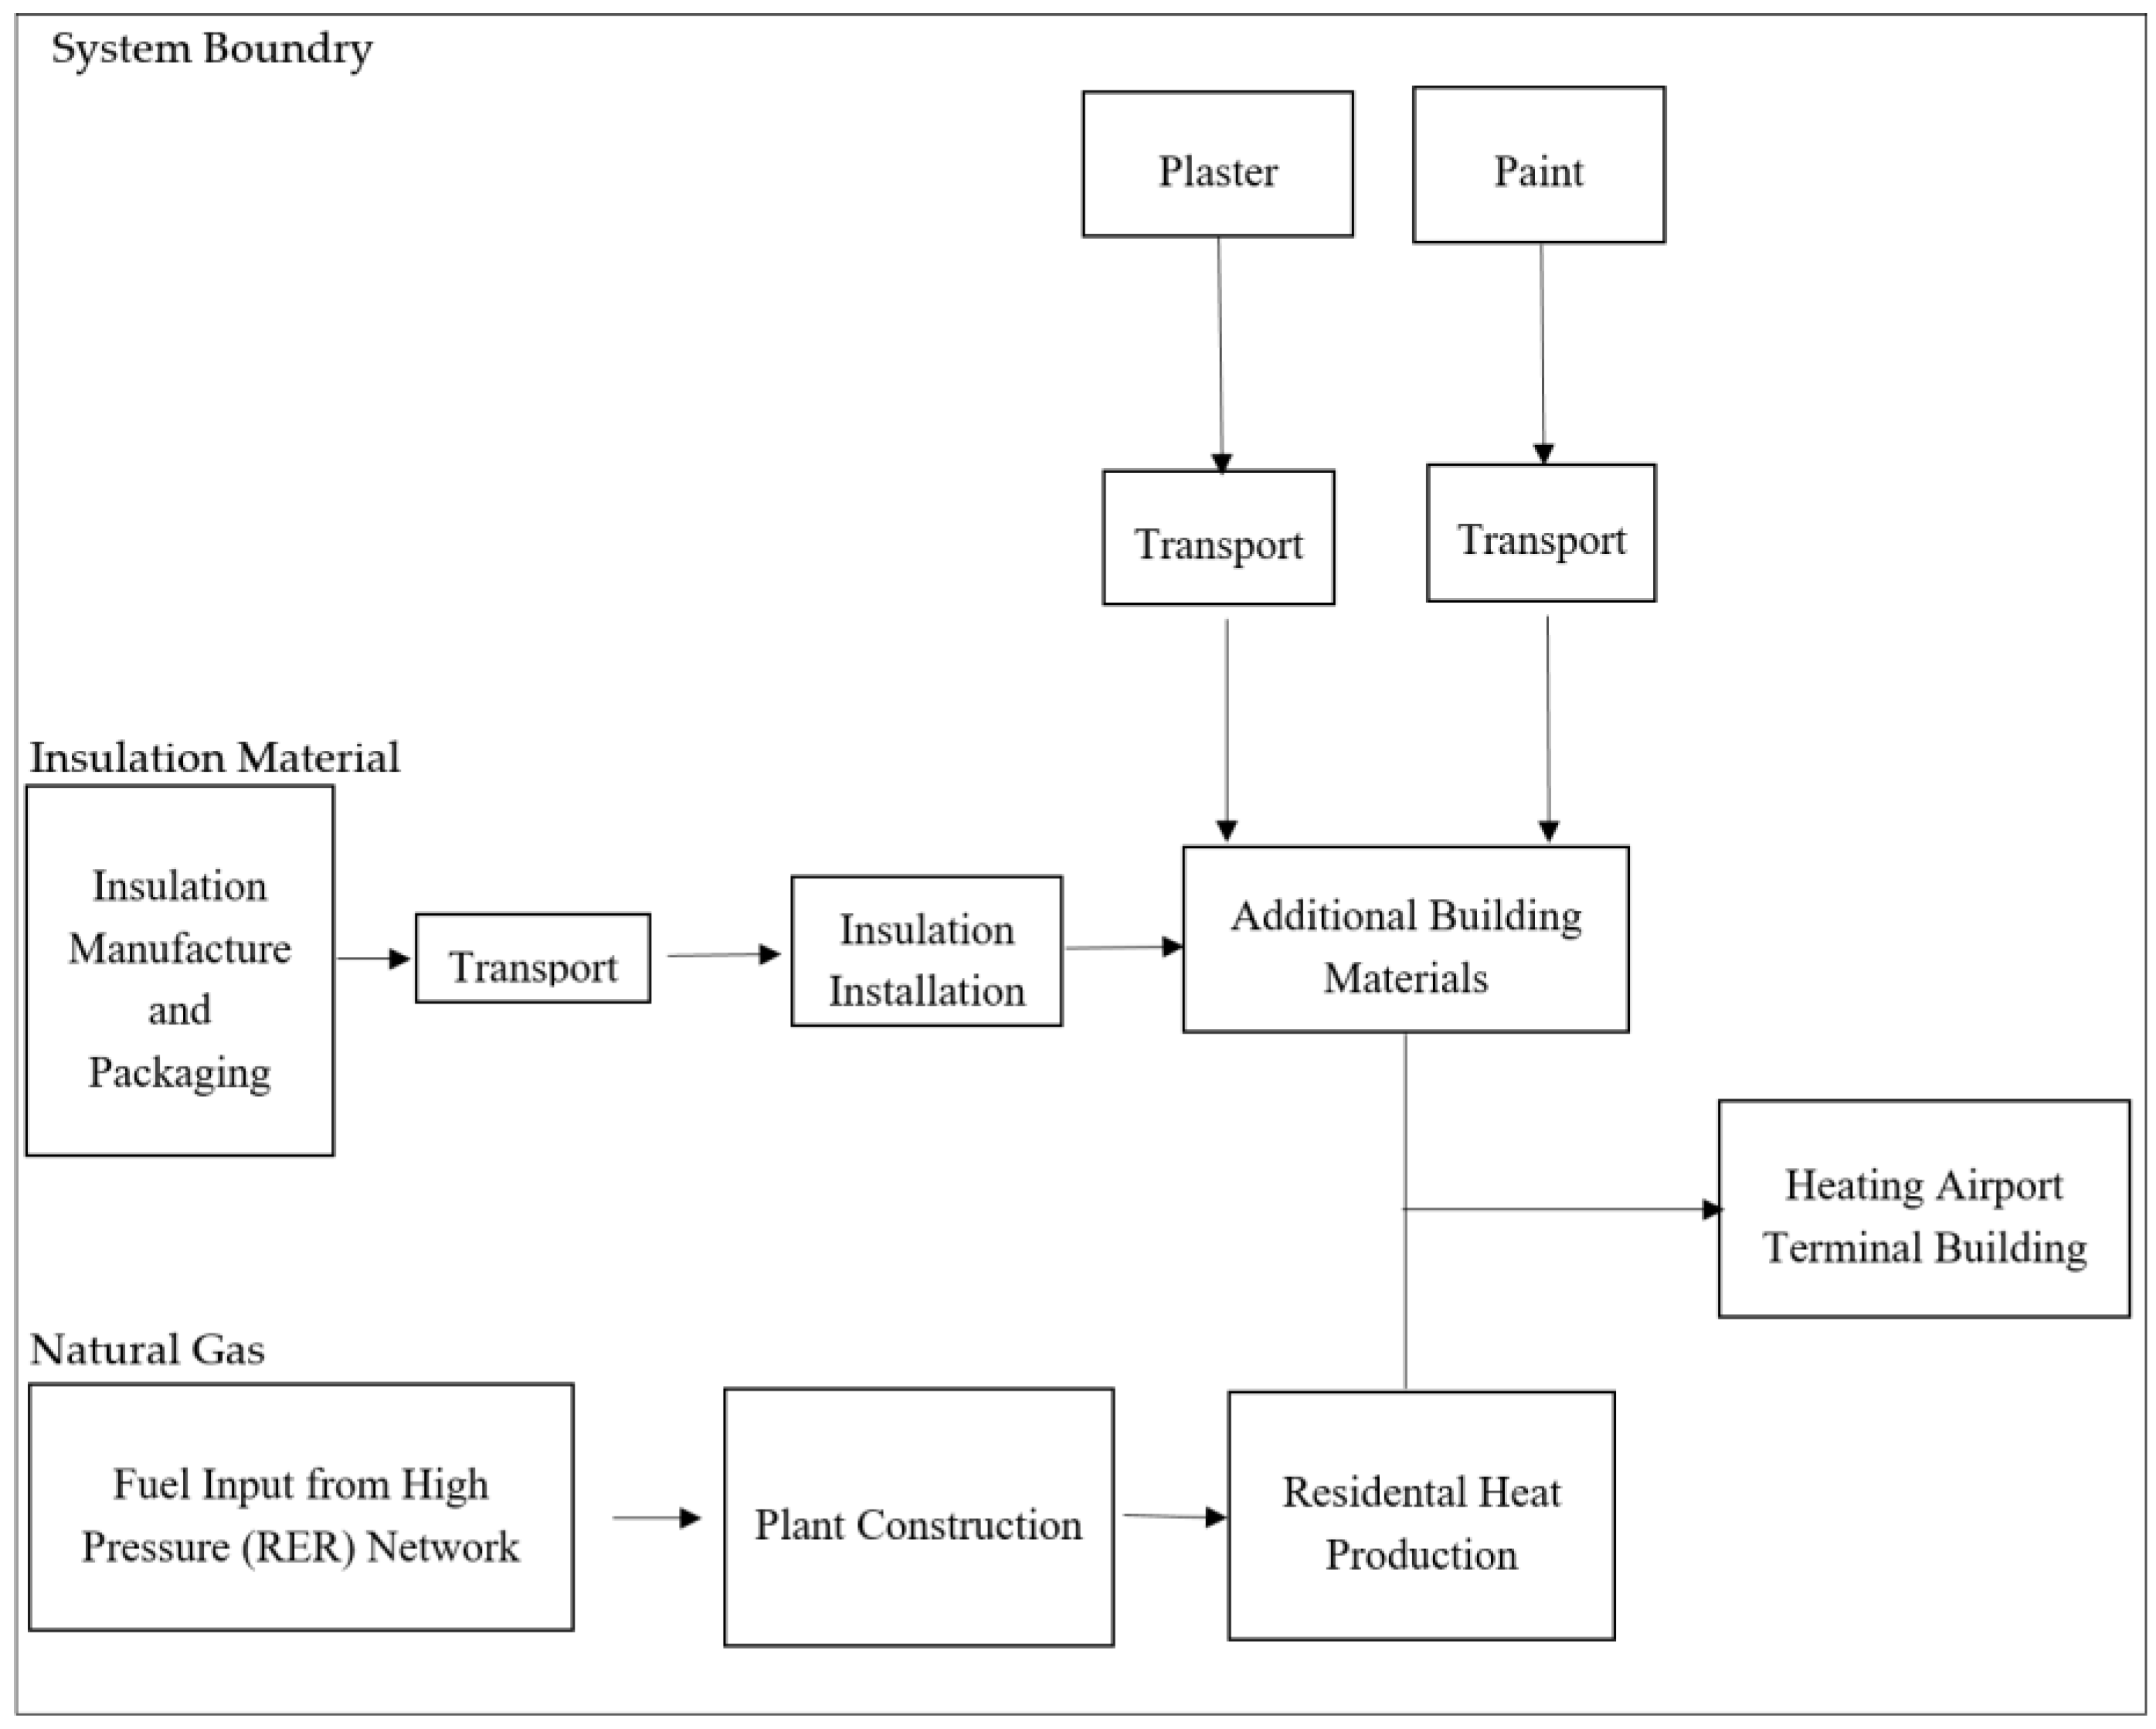
In this study, the system boundaries for the insulating material and natural gas are shown in Figure 5. The system boundary for the insulating material applies to the period from its production at factory to its installation on the terminal building envelope. For natural gas, it includes fuel input from high pressure (RER) network, infrastructure (boiler) and heat production. In addition, the system boundaries for plaster (on the surface where the insulating material will be installed on the wall and on the insulating material after its installation) required for the installation of insulating material and the system boundaries for the paint required for painting of the surface after installation of the insulating material include their production at factory, transfer and installation. Additional building material refers to waterproof membrane used in roof insulation applications. It is assumed that the insulating material has been produced at the largest production plant of Turkey for thermal insulating materials. It is also assumed that the insulating material was transported from the factory to the application area by a lorry and the approximated distance between two points is 250 km. Another assumption has been made regarding the production of the plaster and paint is, they are produced at the closest facility and transportation of such items is done by a lorry on 15 km distance. In this study, the period was taken as 20 years for both economic and environmental effects.
The functional unit selected is one square meter of walls and roof area. The data used in the model were examined in two categories including foreground and background data. The foreground data (thickness and quantity of plaster, paint and waterproof membrane, and boiler efficiency) have been obtained from related technical reports, and the literature. The environmental effects that emerge as a result of production of insulating and other materials at the factory and their transfer process and production of 1 kWh heat from natural gas have been obtained from the current ecoinvent 3 database on SimaPro. In this study, the environmental effects of the energy used during application of insulation have been neglected.
LCA analyses were performed using SimaPro 8.3.0.0. The data used in the model were obtained by processing data taken from ecoinvent 3 database present in Sima Pro 8.3.0.0 software. IPCC 2013 is the updated version of IPCC 2007, and it was developed by the International Panel on Climate Change. By this method, the impacts of climate change factors can be calculated for periods of 20, 100 and 500 years. In this study, the IPCC 2013 100a was used for calculating GWP [39].
In this study, other environmental effects (HH, DE and RA) were assessed using ReCiPe Endpoint (H) V1.13/Europe ReCiPe H/A. ReCiPe is the advanced version of the Eco-indicator 99 and CML 2002 methods. ReCiPe is used to estimate 17 different midpoint effects, as shown in Figure 6 (these are relatively strong, but difficult to interpret). The endpoint level is formed by the conversion of these 17 midpoint effects to three endpoint categories. These three endpoint categories are the damage to HH, ED and RA [40].
In this study, green house payback time (GPBT) was calculated in kg CO2 Equation (28); ReCiPe payback time (RPBT) was calculated in mPt, which is the total endpoint score. GPBT and RPBT were calculated by using the following equation.
where Life Cycle Impact (LCI) of insulation material signifies the effects of all stages—the system limits of which is shown in Figure 5. LCI of energy saving represent the annual avoided impact due to saved natural gas.
4. Results and Discussion
In this study, first, the energy consumption caused by the lack of thermal insulation at Hasan Polatkan Airport and the relevant environmental effects were assessed, and then, the environmental and economic payback time (PBT) were calculated by comparing this with the energy consumption amount with insulation. The renovation and retrofit processes to be applied on the buildings (thermal insulation) will significantly decrease the energy used for heating and cooling purposes. Using the LCA method determined whether the positive environmental effects due to the reduction in energy will balance the negative environmental effects caused by the renovation processes (production at the factory, packaging, transportation and installation), and the environmental payback periods were calculated.
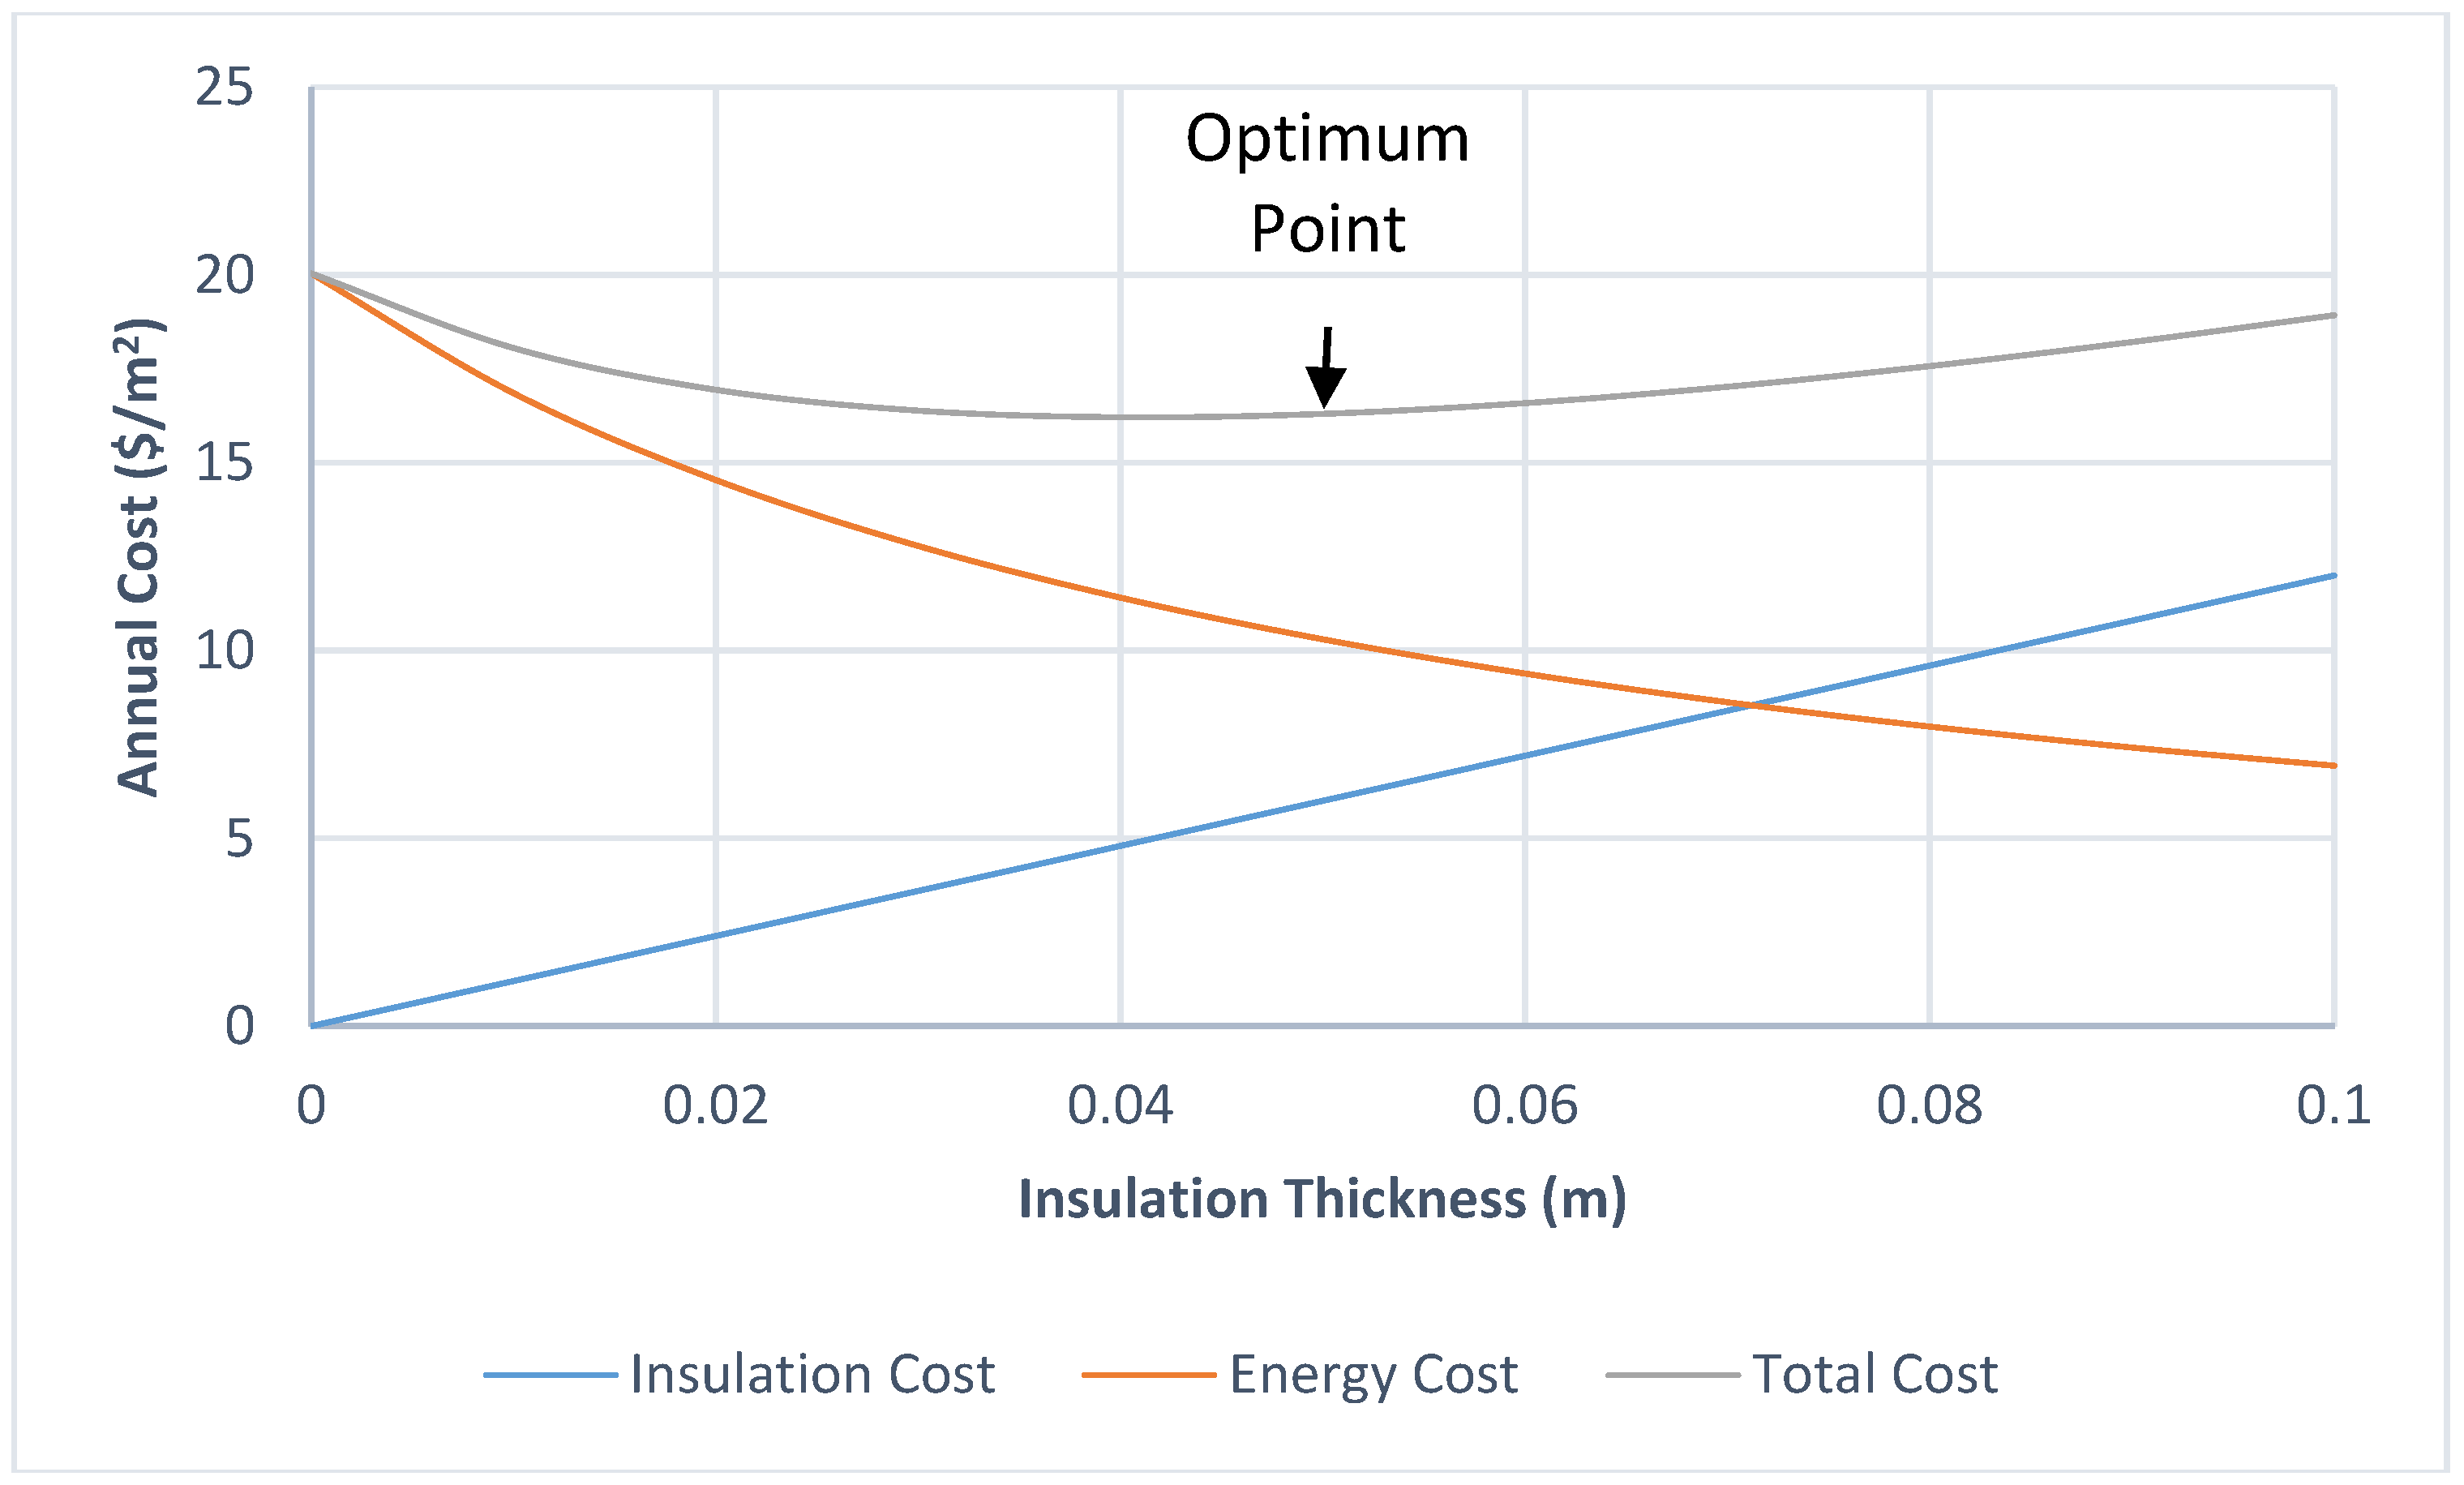
In this section, optimum insulation thickness for the walls and roof was calculated by using the degree-day method. Calculated optimum insulation thickness and PBT are shown in Table 3. Optimum insulation thickness was calculated for only heating, only cooling and both heating and cooling. Figure 7 and Figure 8 show the results. Optimum insulation thicknesses for the walls and the roof were found to be 0.0502 m and 0.0734 m, respectively. Then, the economic payback time (EPBT), depending on the optimum insulation thickness, was calculated. The EPBT for the walls and the roof was calculated to be 6.38 and 7.02 years, respectively.
It was observed that optimum insulation thickness increased (as shown in Figure 9) as the degree-day number increased.
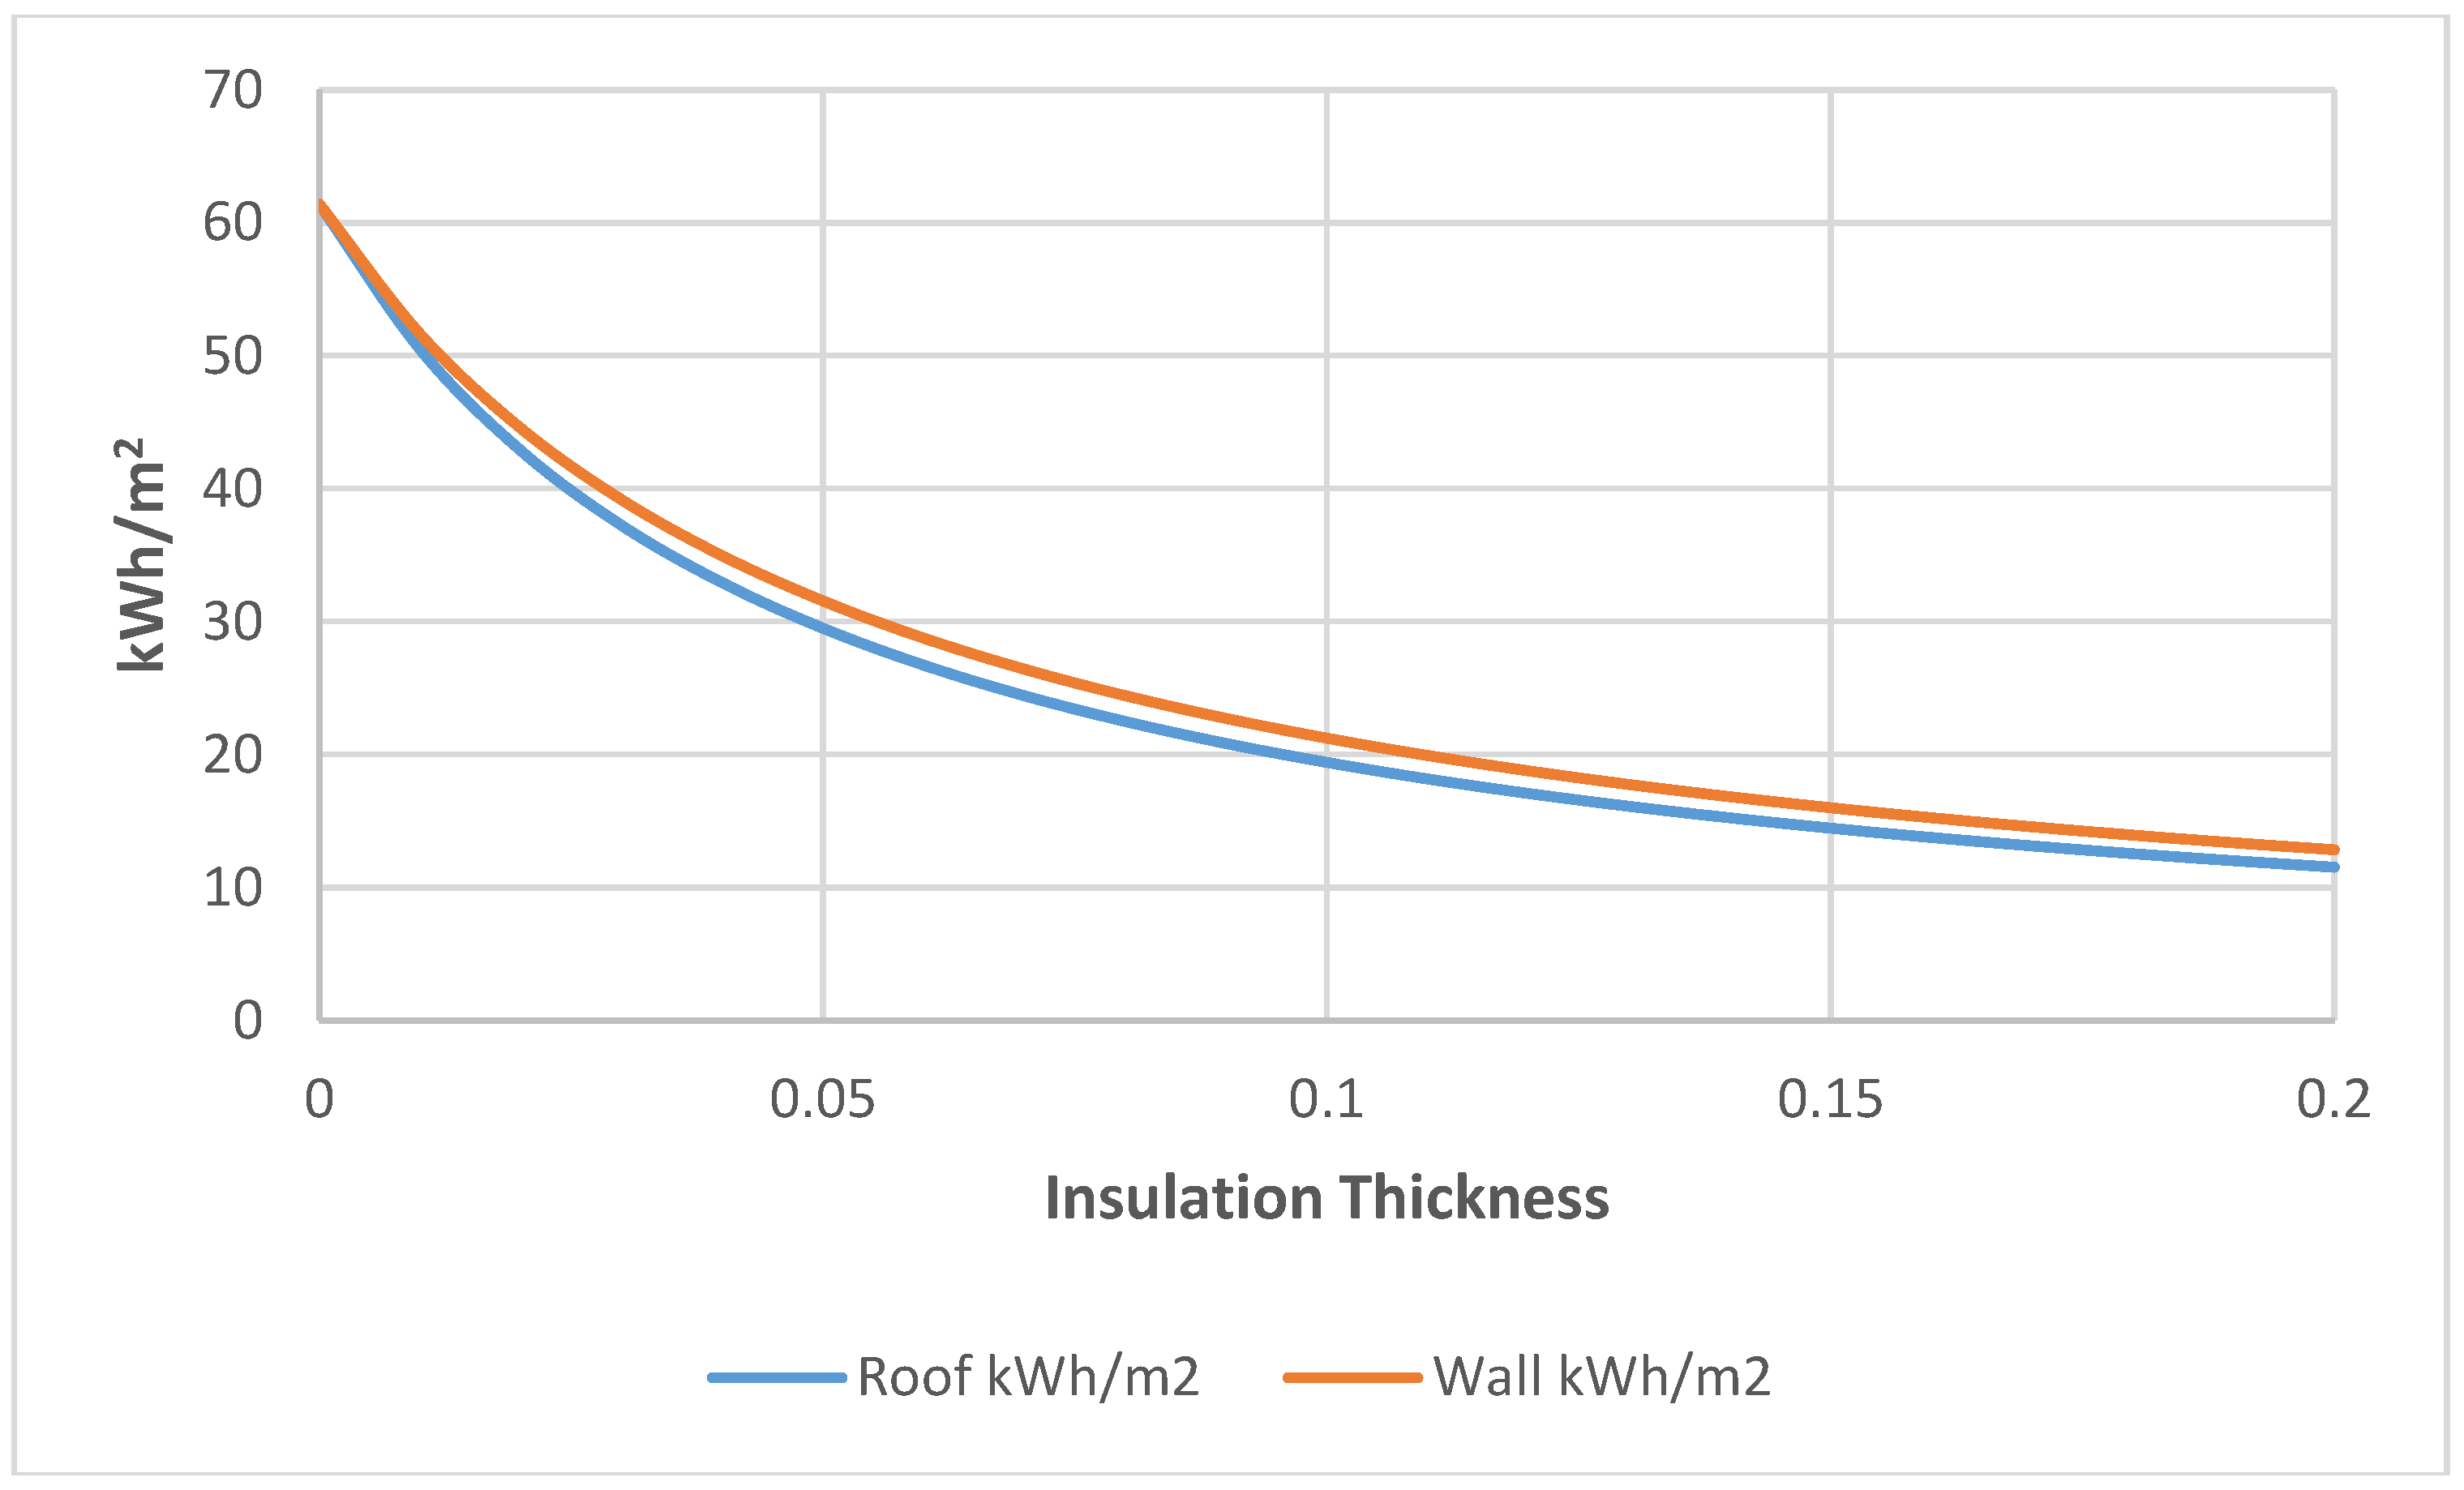
As a result of the insulation thickness increase, heat losses occurring on the external surfaces and the associated environmental effects were significantly reduced. When the optimum insulation thickness calculated for the walls and the roof was applied, the heat losses and environmental effects decreased by 48% and 56%, respectively. The decrease in the heat losses occurring on the external surfaces due to the increase in the insulation thickness is shown in Figure 10.
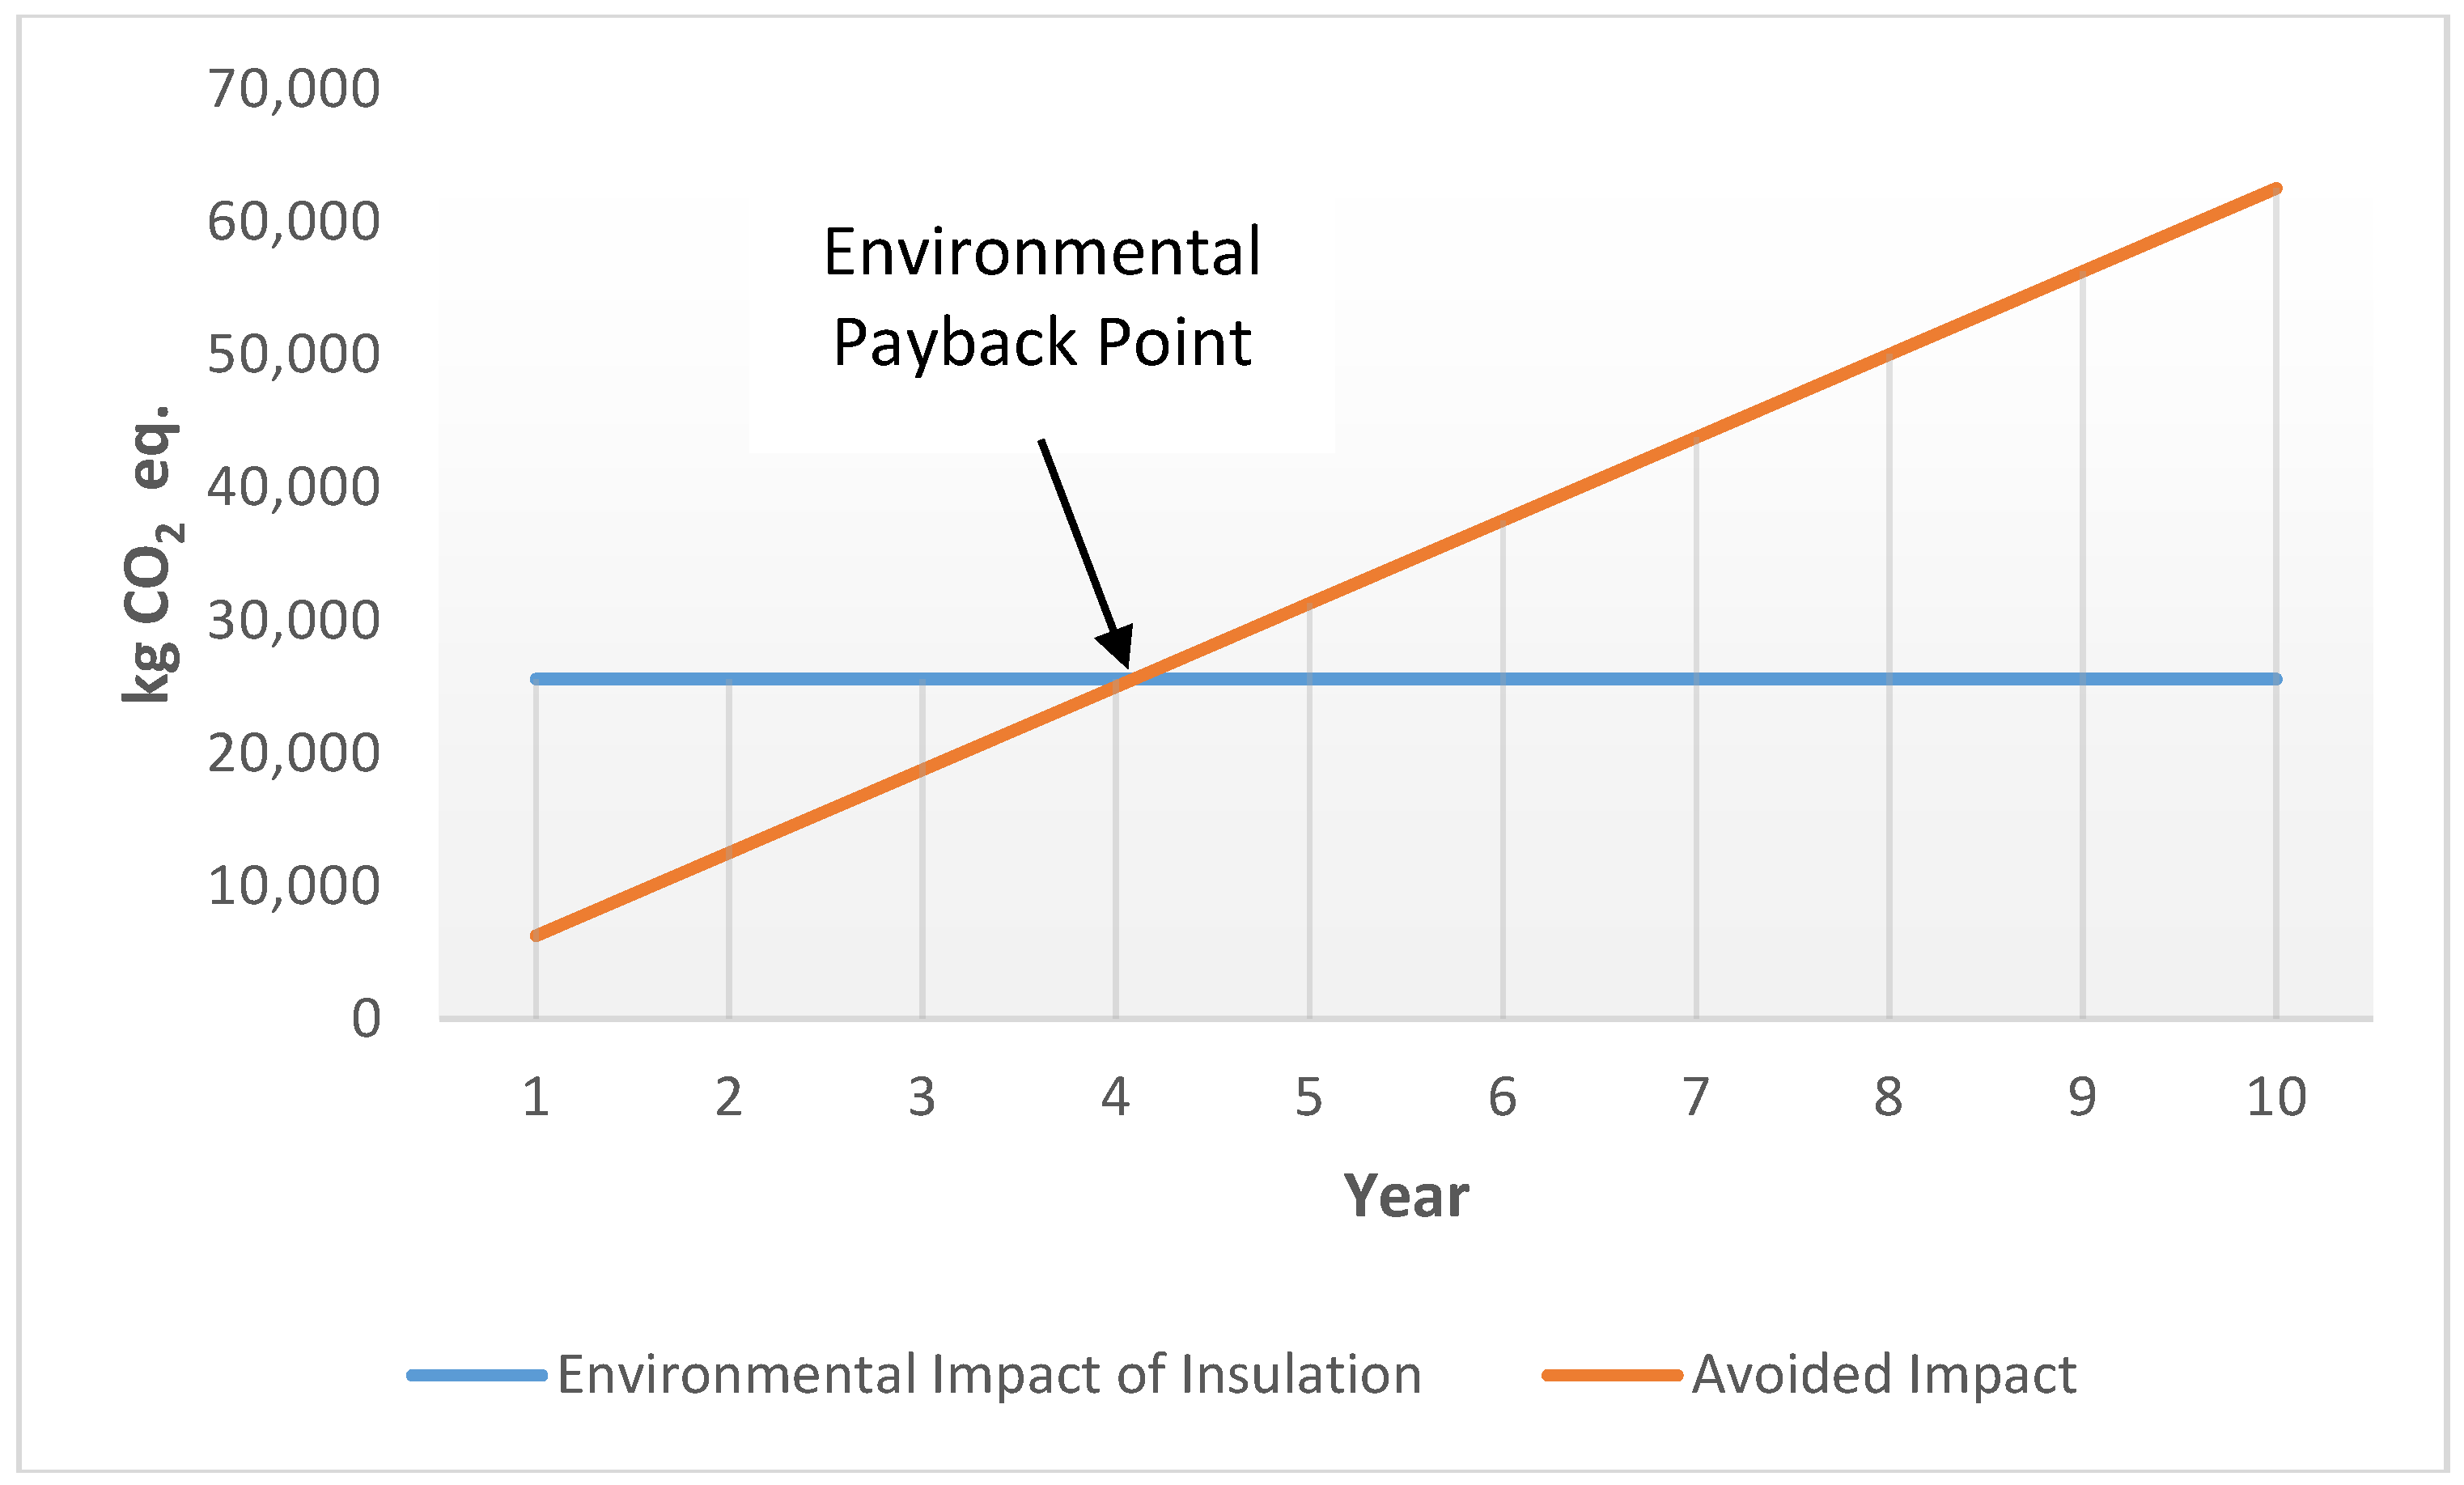
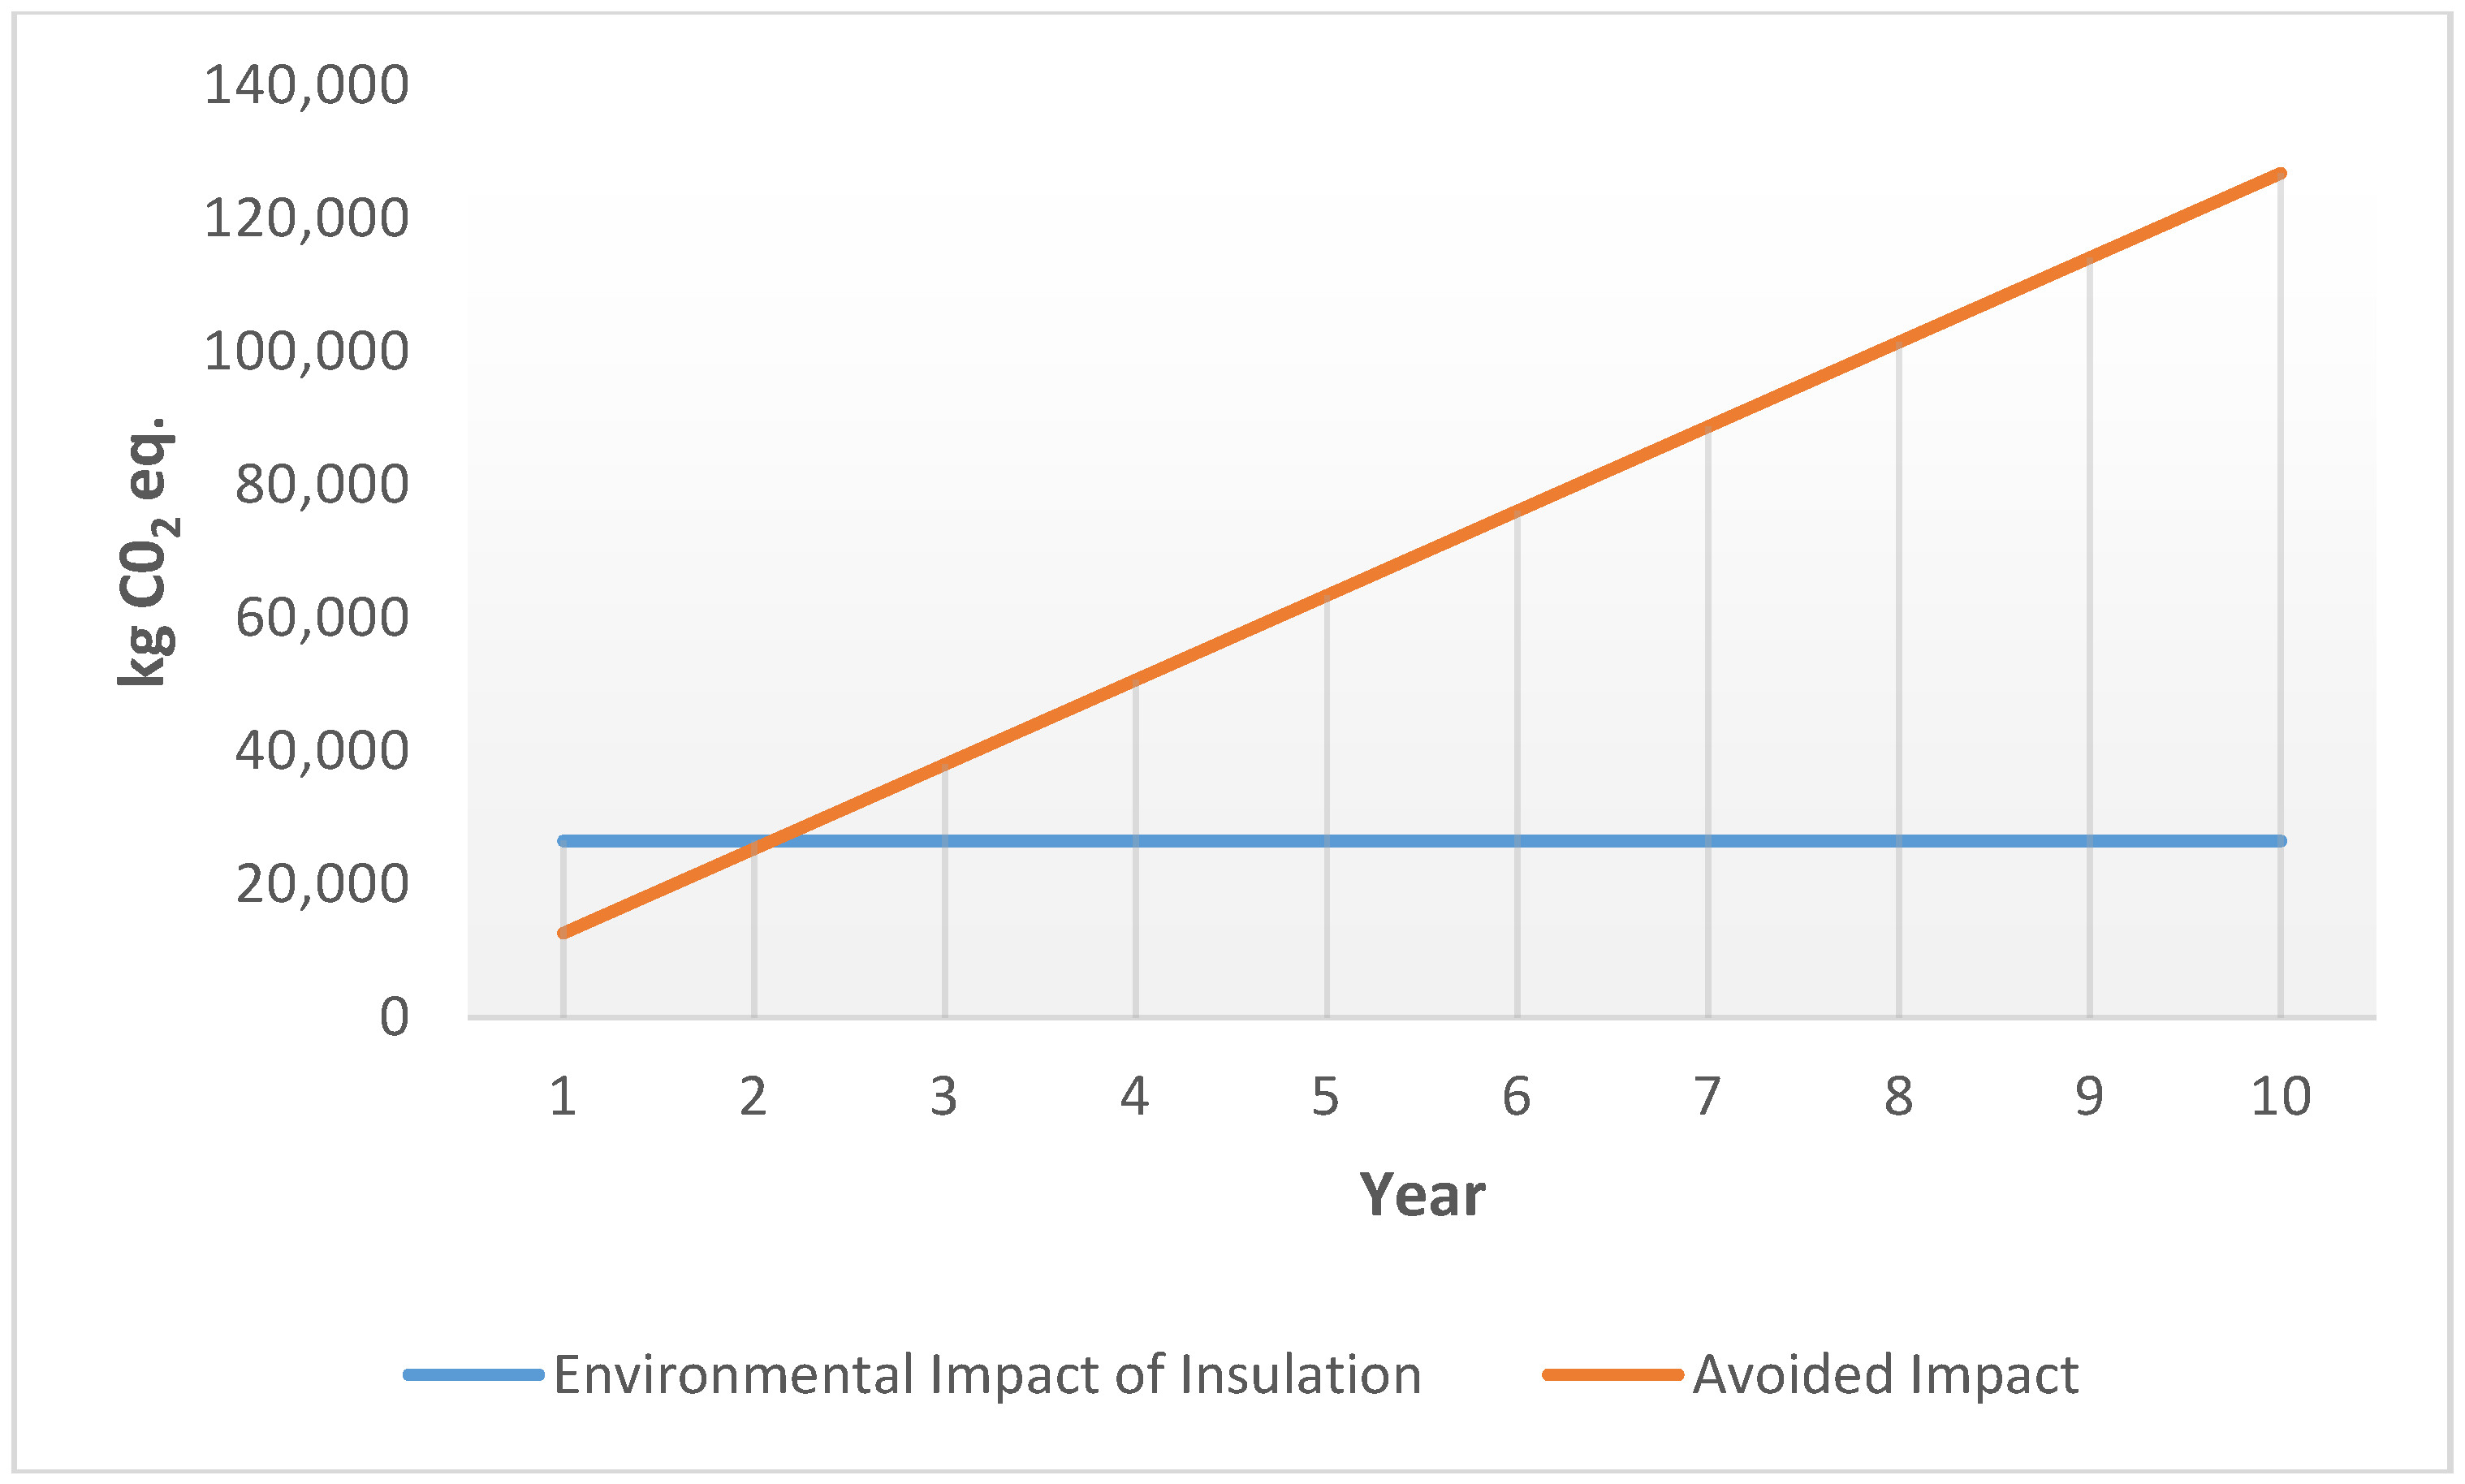
Figure 11, Figure 12, Figure 13 and Figure 14 correspond to the impact of the application of insulation materials and the other required materials on the environment and the case in which these impacts have been avoided are depicted on same figures. Environmental payback point is obtained by dividing the environmental impact of insulation by the environmental impact of the energy saved after application of insulation. This point is the one where the positive environmental impact arising from energy saving balances LCI of insulating material. Environmental payback periods were assessed for the walls and the roof according to IPCC 2013 100a, and they are shown in Figure 11 and Figure 12. GPBT for the walls and the roof were found to be 4.09 and 2.09 years, respectively.
HH, ED and RA effects were calculated by using the ReCiPe method, and their total effects were assessed in mPt. The RPBT for the walls is shown in Figure 13 and Figure 14, and they were found to be 4.04 and 5 years, respectively.
When the application of thermal insulation on the airport terminal building envelope (wall and roof) was assessed from economic and environmental aspects, the environmental performance was found to be much better than the economic performance.
The results of this study examining the energy, environmental and economic performance of thermal insulation in the terminal building of an airport were compared with the examples in the literature. Many studies examining the optimum insulation thickness for different climate zones and different building components (wall, roof) were carried out in the literature [11,12,13,29,30,31,32,33]. These studies evaluated the optimum insulation thickness only from economic aspects, and this study additionally investigated the environmental performance. In the example of the literature, it is seen that the optimum insulation thickness was calculated as 0.061 and 0.047 m for the walls and roofs of existing buildings in the climate zone where there is an airport terminal building [31]. However, in this study, these values for wall and roof were found as 0.0502 and 0.0734 m, respectively. Surely, the reason for the difference that occurred here is that the i, g, LT and Rw,t values that were used in the calculation were basically different.
A research examined the environmental payback periods of different insulation materials (EPS, phenolic foam, and mineral wool) by the LCA method and for 16 different environmental impacts [41]. EPS's environmental payback period is shorter than other insulation materials in 14 of these 16 environmental impacts. In both studies, similarly, the environmental impacts of natural gas saved by applying heat insulation were compared and environmental payback periods were calculated. In this study, EPS was chosen as insulation material. However, in contrast, 17 environmental impacts were evaluated over a single score (mPt).
In terms of environmental impact, Sohn et al. investigated the optimal insulation level for different scenarios using the ReCiPe method [42]. Although this method was also taken as a basis in this study, the optimum insulation thickness based on the economic analyses can be seen as a significant difference. In the literature, there are also studies evaluating the economic and environmental performance of thermal insulation in the building sector by means of the LCC and LCA methods. In these studies, the optimum thickness of the thermal insulation applied to the building envelope (wall, roof and floor) was calculated by an integrated cost and environmental life cycle analysis [43,44]. However, in this study, the environmental performance of the optimum insulation thickness was evaluated, and environmental payback periods were also calculated to be able to make a comparison.
The environmental performance of the best economic scenarios related to energy efficiency can only be determined using the LCA method. Nowadays, intensive consumption of energy at the airports and legal requirements related to environment require carrying out studies on energy efficiency at the airports. This study will also contribute to the environmental assessment of the studies that were directly carried out on energy efficiency.
5. Conclusions
HVAC systems use the most energy in the airport terminal buildings. When considering the energy amount used, especially for heating and cooling, more efficient heating and cooling systems and the performance of the building envelope can provide significant reductions in the energy amounts consumed without compromising comfort conditions. The absence of thermal insulation on the Hasan Polatkan International Airport terminal building envelope causes the amount of energy consumed and the associated environmental effects to increase. In this study, optimum insulation thicknesses and environmental payback were calculated for the walls and the roof of the airport terminal building. The LCA method assessed whether the positive environmental effects due to the reduction in energy used for heating and cooling purposes by the application of the insulation material on the building envelope balanced the negative environmental effects. It was also examined whether these effects were caused by the process that started from production at the factory until its application on the building envelope. In the study, GWP was assessed by using the IPCC 100a method, whereas the total effects of HH, ED and RA were assessed by using the ReCiPe method.
By the application of thermal insulation on the walls and the roof, the heat loss from these surfaces would decrease by 48% and 56%, respectively. According to the environmental assessments performed by the LCA method, GPBT for the walls and the roof was found to be 4.09 and 2.09 years, respectively, while RPBT was found to be 4.04 and 5 years, respectively. Additionally, considering cost assessment, the initial investment costs will be met in 6.38 and 7.02 years, respectively. Comparing the environmental payback time with the economical payback time, it is found that the environmental performance of the insulation better than the economic performance. Furthermore, considering GBPT and RBPT parameters for the wall and roof, it is seen that these environmental effects are same for the wall. On the other hand, it is observed that GWP impact for the roof balances in shorter time in comparison to HH, ED and RA impacts. One of the most important results of the study was that the environmental payback period is shorter than the economic payback periods. Additionally, the importance of thermal insulation becomes more comprehensible when balancing the environmental effects within a short period and when the environmental effects to later be prevented are considered.
Acknowledgments
This study was supported by the Anadolu University Scientific Research Projects Commission under Grant No. 1610F668.
Author Contributions
Mehmet Kadri Akyüz, Önder Altuntaş and Mehmet Ziya Söğüt conceived the idea for this study, analyzed the data and interpreted LCA results. All authors wrote the manuscript and have read and approved the final manuscript.
Conflicts of Interest
The authors declare no conflict of interest.
References
- Miao, L. Examining the impact factors of urban residential energy consumption and CO2 emissions in China–Evidence from city-level data. Ecol. Indic. 2017, 73, 29–37. [Google Scholar] [CrossRef]
- Gopalakrishnan, B.; Ramamoorthy, K.; Crowe, E.; Chaudhari, S.; Latif, H. A structured approach for facilitating the implementation of ISO 50001 standard in the manufacturing sector. Sustain. Energy Technol. Assess. 2014, 7, 154–165. [Google Scholar] [CrossRef]
- Intergovernmental Panel on Climate Change I. Climate Change 2007: Synthesis Report. Available online: https://www.ipcc.ch/pdf/assessment-report/ar4/syr/ar4_syr_full_report.pdf (accessed on 14 July 2016).
- World Wildlife Fund. 2 °C is Too Much. Available online: http://www.worldwildlife.org/climate/Publications/ (accessed on 14 July 2016).
- UNFCCC. Adoption of the Paris Agreement; Proposal by the President, United Nations, Paris. In Proceedings of the Conference of the Parties (COP), Paris, France, 30 November–11 December 2015. [Google Scholar]
- International Civil Aviation Organization. Available online: http://www.icao.int/environmental-protection/Pages/aircraft-engine-emissions.aspx (accessed on 7 May 2017).
- Ortega Alba, S.; Manana, M. Energy Research in Airports: A Review. Energies 2016, 9, 349. [Google Scholar] [CrossRef]
- Turkish Ministry of Transportation, Maritime Affairs and Communications. Available online: http://www.udhb.gov.tr/images/faaliyet/a5ec26a31a72281.pdf (accessed on 7 May 2017).
- Airport Energy Efficiency and Management. Available online: http://www.aci-asiapac.aero/services/main/17/upload/service/17/self/55cc67d1e0443.pdf (accessed on 7 May 2017).
- IEA. Transition to Sustainable Buildings—Strategies and Opportunities to 2050; International Energy Agency: Paris, France, 2013. [Google Scholar]
- Kurekci, N.A. Determination of optimum insulation thickness for building walls by using heating and cooling degree-day values of all Turkey’s provincial centers. Energy Build. 2016, 118, 197–213. [Google Scholar] [CrossRef]
- Kaynakli, O. Parametric investigation of optimum thermal insulation thickness for external walls. Energies 2011, 4, 913–927. [Google Scholar] [CrossRef]
- Al-Homoud, M.S. Performance characteristics and practical applications of common building thermal insulation materials. Build. Environ. 2005, 40, 353–366. [Google Scholar] [CrossRef]
- Balaras, C.A.; Dascalaki, E.; Gaglia, A.; Droutsa, K. Energy conservation potential, HVAC installations and operational issues in Hellenic airports. Energy Build. 2003, 35, 1105–1120. [Google Scholar] [CrossRef]
- Mardaljevic, J. Spatio-temporal dynamics of solar shading for a parametrically defined roof system. Energy Build. 2004, 36, 815–823. [Google Scholar] [CrossRef]
- Cardona, E.; Piacentino, A.; Cardona, F. Energy saving in airports by trigeneration. Part I: Assessing economic and technical potential. Appl. Therm. Eng. 2006, 26, 1427–1436. [Google Scholar] [CrossRef]
- Cardona, E.; Sannino, P.; Piacentino, A.; Cardona, F. Energy saving in airports by trigeneration. Part II: Short and long-term planning for the Malpensa 2000 CHCP plant. Appl. Therm. Eng. 2006, 26, 1437–1447. [Google Scholar] [CrossRef]
- Koroneos, C.; Xydis, G.; Polyzakis, A. The optimal use of renewable energy sources—The case of the new international “Makedonia” airport of Thessaloniki, Greece. Renew. Sustain. Energy Rev. 2010, 14, 1622–1628. [Google Scholar] [CrossRef]
- Somcharoenwattana, W.; Menke, C.; Kamolpus, D.; Gvozdenac, G. Study of operational parameters improvement of natural-gas cogeneration plant in public buildings in Thailand. Energy Build. 2011, 43, 925–934. [Google Scholar] [CrossRef]
- Zomer, C.D.; Costaa, M.R.; Nobrea, A.; Rüthera, R. Performance compromises of building-integrated and building-applied photovoltaics (BIPV and BAPV) in Brazilian airports. Energy Build. 2013, 66, 607–615. [Google Scholar] [CrossRef]
- Sun, Y.; Wang, S.; Cui, B.; Yim, M.S. Energy performance enhancement of Hong Kong International Airport through chilled water system integration and control optimization. Appl. Therm. Eng. 2013, 60, 303–315. [Google Scholar] [CrossRef]
- Kılkış, B. Energy consumption and CO2 emission responsibilities of terminal buildings: A case study for the future Istanbul International Airport. Energy Build. 2014, 76, 109–118. [Google Scholar] [CrossRef]
- Kılkış, Ş.; Kılkış, Ş. Benchmarking airports based on a sustainability ranking index. J. Clean. Prod. 2016, 130, 248–259. [Google Scholar] [CrossRef]
- Sukumaran, S.; Sudhakar, K. Fully solar powered airport: A case study of Cochin International airport. J. Air Transp. Manag. 2017, 62, 176–188. [Google Scholar] [CrossRef]
- Costa, A.; Blanes, L.M.; Donnelly, C.; Keane, M.M. Review of EU Airport Energy Interests and priorities with Respect to ICT, Energy Efficiency and Enhanced Building Operation CASCADE. Available online: http://www.cascade-eu.org/cms/uploads/media/35_ICEBO_2012_Paper_v06_to_be_submitted.pdf (accessed on 7 May 2017).
- Battal, U.; Küçükönal, H.; Oktal, H. Bölgesel Havaalanlarına Bir Örnek: Eskişehir Anadolu Üniversitesi Uluslararası Havaalanı. In Proceedings of the VI. Aviation Symposium, Nevşehir, Turkey, 12–14 May 2006. [Google Scholar]
- General Directorate of State Airports Authority, Statistics. Available online: http://www.dhmi.gov.tr/istatistik.aspx (accessed on 29 May 2017).
- ASHRAE. ASHRAE Handbook—Fundamentals (SI), Energy Estimating and Modeling Methods; Chapter 31; ASHRAE: Atlanta, GA, USA, 2001. [Google Scholar]
- Kaynakli, O. A review of the economical and optimum thermal insulation thickness for building applications. Renew. Sustain. Energy Rev. 2012, 16, 415–425. [Google Scholar] [CrossRef]
- Bulut, H.; Büyükalaca, O.; Yılmaz, T. Türkiye için ısıtma ve soğutma derece-gün bölgeleri. In Proceedings of the 16. National Heat Science and Technique Congress, Kayseri, Turkey, 30 May–2 June 2007. [Google Scholar]
- Sisman, N.; Kahya, E.; Aras, N.; Aras, H. Determination of optimum insulation thicknesses of the external walls and roof (ceiling) for Turkey’s different degree-day regions. Energy Policy 2007, 35, 5151–5155. [Google Scholar] [CrossRef]
- Kaynakli, Ö.; Kaynakli, F. Determination of Optimum Thermal Insulation Thicknesses for External Walls Considering the Heating, Cooling and Annual Energy Requirement. Uludağ University J. Faculty Eng. 2016, 21, 227–242. [Google Scholar] [CrossRef]
- Bolattürk, A. Determination of optimum insulation thickness for building walls with respect to various fuels and climate zones in Turkey. Appl. Therm. Eng. 2006, 26, 1301–1309. [Google Scholar] [CrossRef]
- Thermal insulation products for buildings- Factory made products of expanded polystrene (EPS)- Specification. Available online: https://infostore.saiglobal.com/store/PreviewDoc.aspx?saleItemID=2543709 (accessed on 6 October 2017).
- Khasreen, M.M.; Banfill, P.F.; Menzies, G.F. Life-cycle assessment and the environmental impact of buildings: A review. Sustainability 2009, 1, 674–701. [Google Scholar] [CrossRef] [Green Version]
- Günkaya, Z.; Özdemir, A.; Özkan, A.; Banar, M. Environmental Performance of Electricity Generation Based on Resources: A Life Cycle Assessment Case Study in Turkey. Sustainability 2016, 8, 1097. [Google Scholar] [CrossRef]
- International Organization for Standardization. Environmental Management—Life Cycle Assessment—Principles and Framework; International Standard ISO 14040; ISO: Geneva, Switzerland, 2006. [Google Scholar]
- International Organization for Standardization. Environmental Management—Life Cycle Assessment—Requirements and Guidelines; International Standard ISO 14040; ISO: Geneva, Switzerland, 2006. [Google Scholar]
- SimaPro Methods Library. Available online: https://www.pre-sustainability.com/download/manuals/DatabaseManualMethods.pdf (accessed on 20 May 2017).
- Goedkoop, M.; Heijungs, R.; Huijbregts, M.; De Schryver, A.; Struijs, J.; Van Zelm, R. ReCiPe 2008: A life cycle impact assessment method which comprises harmonised category indicators at the midpoint and the endpoint level. 2009, 1, p. 3. Available online: http://www.lcia-recipe.net (accessed on 15 October 2017).
- Tingley, D.D.; Hathway, A.; Davison, B. An environmental impact comparison of external wall insulation types. Build. Environ. 2015, 85, 182–189. [Google Scholar] [CrossRef]
- Sohn, J.L.; Kalbar, P.P.; Birkved, M. Life cycle based dynamic assessment coupled with multiple criteria decision analysis: A case study of determining an optimal building insulation level. J. Clean. Prod. 2017, 162, 449–457. [Google Scholar] [CrossRef]
- Rodrigues, C.; Freire, F. Building retrofit addressing occupancy: An integrated cost and environmental life-cycle analysis. Energy Build. 2017, 140, 388–398. [Google Scholar] [CrossRef]
- Braulio-Gonzalo, M.; Bovea, M.D. Environmental and cost performance of building’s envelope insulation materials to reduce energy demand: Thickness optimization. Energy Build. 2017, 150, 527–545. [Google Scholar] [CrossRef]
Figure 1.
Distribution of an airport’s energy consumption.

Figure 2.
Typical energy consumption at a terminal building.

Figure 3.
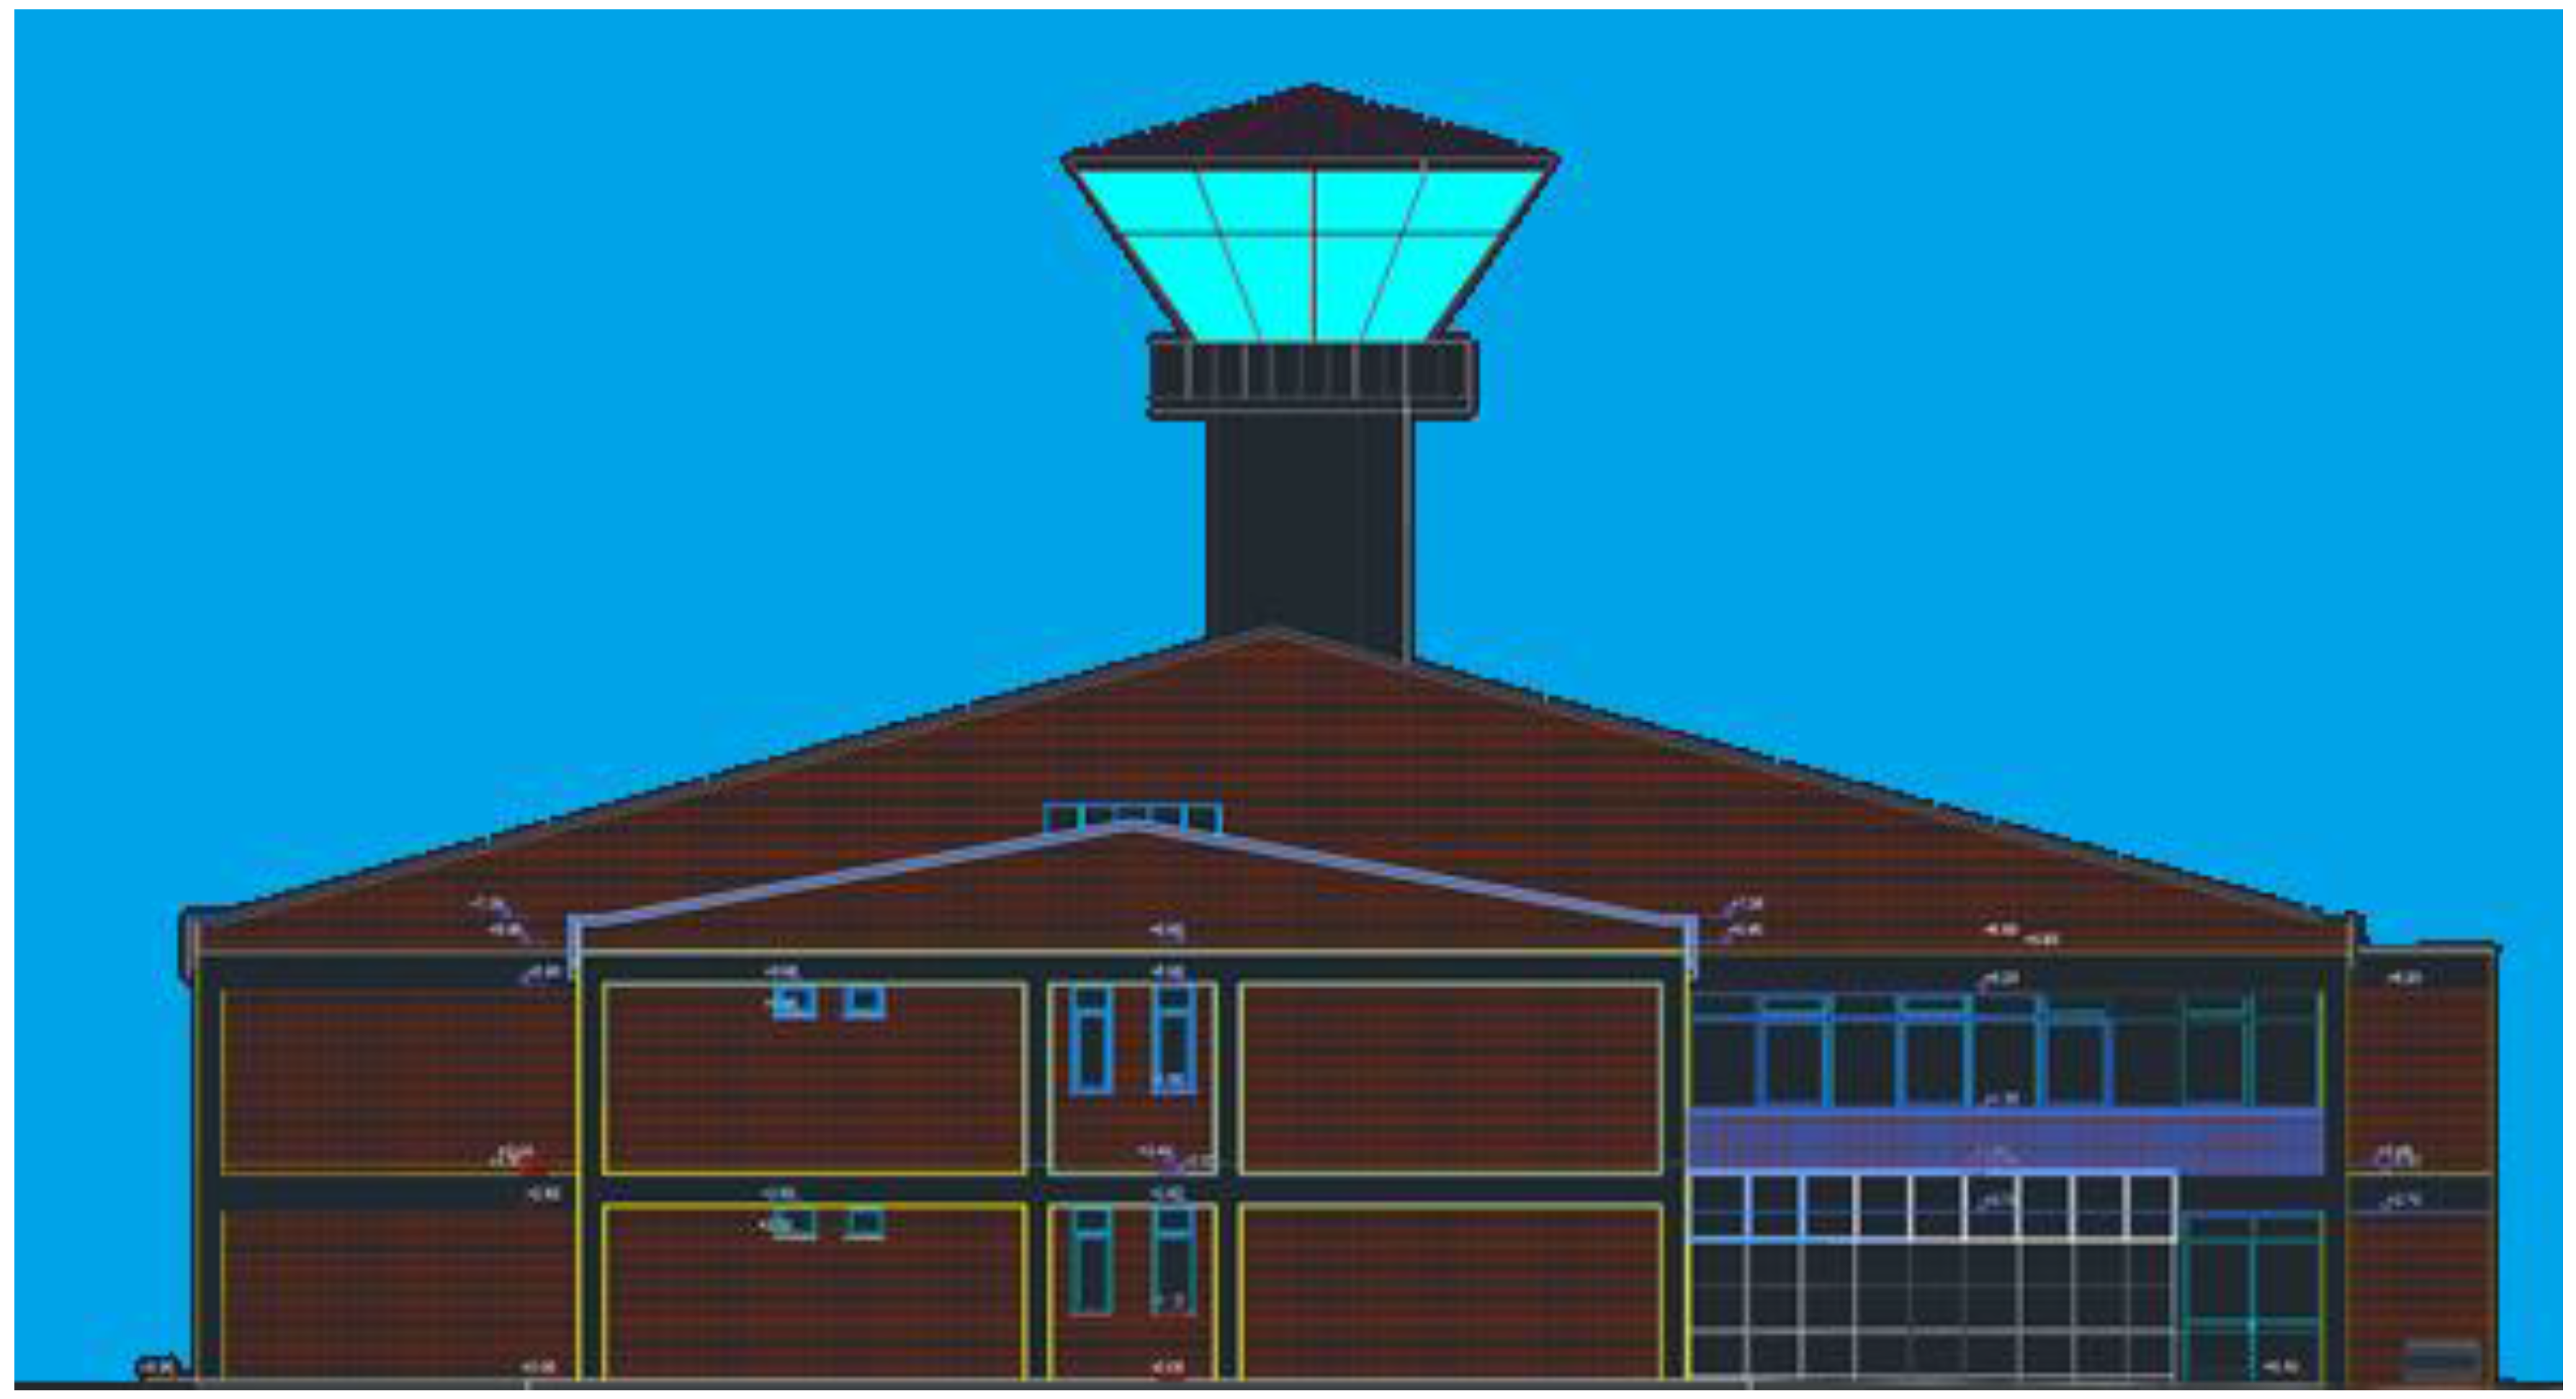
Frontal view of the Hasan Polatkan International Airport Terminal building.

Figure 4.
Side view of the Hasan Polatkan International Airport Terminal building.

Figure 5.
System boundaries of the LCA study.

Figure 6.
Relationship between ReCiPe midpoint indicator and endpoint indicator.

Figure 7.
Optimum insulation thickness (wall).

Figure 8.
Optimum insulation thickness (roof).

Figure 9.
Optimum insulation thickness versus HDD.

Figure 10.
Heat loss versus insulation thickness.

Figure 11.
Wall GPBT and avoided impact.

Figure 12.
Roof GPBT and avoided impact.

Figure 13.
Wall RPBT and avoided impact.

Figure 14.
Roof RPBT and avoided impact.


Table 1.
Properties and cost of the insulation materials.
| EPS | Wall | Roof |
|---|---|---|
| Density (kg/m3) | 16 | 30 |
| k (W/mK) | 0.04 | 0.035 |
| Cy ($/m3) | 120 | 65 |
Table 2.
Parameters used in the calculations.
| Parameter | Value |
|---|---|
| i | 17 |
| g | 11 |
| LT | 20 year |
| PWF | 12.044 |
| H | 344,850,00 J/m3 |
| η | 0.9 |
| Ce | 0,11 $/kWh |
| Cfuel | 0.312 $/m3 |
| CDD | 27 |
| HDD | 3049 |
Table 3.
Calculated optimum insulation thickness and PBT.
| Xopt,H (m) | Xopt,C (m) | Xopt H,C (m) | EPBT (year) | GPBT (year) | RPBT (year) | |
|---|---|---|---|---|---|---|
| Wall | 0.0502 | 0.0 | 0.0502 | 6.38 | 4.09 | 4.04 |
| Roof | 0.0734 | 0.0 | 0.0734 | 7.02 | 2.09 | 5 |
© 2017 by the authors. Licensee MDPI, Basel, Switzerland. This article is an open access article distributed under the terms and conditions of the Creative Commons Attribution (CC BY) license (http://creativecommons.org/licenses/by/4.0/).
Share and Cite
MDPI and ACS Style
Akyüz, M.K.; Altuntaş, Ö.; Söğüt, M.Z. Economic and Environmental Optimization of an Airport Terminal Building’s Wall and Roof Insulation. Sustainability 2017, 9, 1849. https://doi.org/10.3390/su9101849
AMA Style
Akyüz MK, Altuntaş Ö, Söğüt MZ. Economic and Environmental Optimization of an Airport Terminal Building’s Wall and Roof Insulation. Sustainability. 2017; 9(10):1849. https://doi.org/10.3390/su9101849
Chicago/Turabian StyleAkyüz, Mehmet Kadri, Önder Altuntaş, and Mehmet Ziya Söğüt. 2017. "Economic and Environmental Optimization of an Airport Terminal Building’s Wall and Roof Insulation" Sustainability 9, no. 10: 1849. https://doi.org/10.3390/su9101849
Note that from the first issue of 2016, this journal uses article numbers instead of page numbers. See further details here.