Multi-Criteria Analyses of Urban Planning for City Expansion: A Case Study of Zamora, Spain
by
 , ,
, ,
Marco Criado
1, 
Antonio Martínez-Graña
1,* ,
,
Fernando Santos-Francés
2,
Sergio Veleda
1 and
Caridad Zazo
3 1
Department of Geology, Faculty of Sciences, Plaza de la Merced s/n, University of Salamanca, 37008 Salamanca, Spain
2
Department of Soil Sciences, Faculty of Environmental Sciences, Avenue Filiberto Villalobos, 119, University of Salamanca, 37007 Salamanca, Spain
3
CSIC-National Museum of Natural Sciences, Geology section, José Gutiérrez Abascal Street 2, 28006 Madrid, Spain
*
Author to whom correspondence should be addressed.
Sustainability 2017, 9(10), 1850; https://doi.org/10.3390/su9101850
Submission received: 2 September 2017
/
Revised: 23 September 2017
/
Accepted: 2 October 2017
/
Published: 16 October 2017
(This article belongs to the Special Issue Sustainability in an Urbanizing World: The Role of People)
Abstract
:This study has established a methodology to determine the most environmentally suitable area for the expansion of Zamora (Spain) using geographic information system (GIS) technology. The objective was to develop a GIS-based methodology for the identification of urban peripheral areas that are suitable for the accommodation of new buildings and services, that are compliant with environmental criteria, and that guarantee an adequate quality of life for the future population such that extra construction costs are avoided. The methodological core is based on two multi-criteria analyses (MCAs): MCA-1 determines areas suitable for building—the most environmentally sustainable areas that do not present risks or discomforts to the population—by analyzing the restrictive factors; MCA-2 takes the sectors that received a favorable evaluation in MCA-1, determines which of those have a lower economic overhead for construction, and analyzes the different conditioning criteria related to their pre-existing infrastructures. Finally, the location of the sectors is determined by a decision factor that satisfies some strategic need of the municipality.
1. Introduction
Population settlements bring forth groups of buildings in determined places and of specific qualities. In the last century, the process of urbanization has grown considerably globally due to the fact that currently half of the world’s population resides in urban areas [1]. As a result, urbanization has been the main cause of the irreversible loss of land [2,3,4]. In this context, some cities have grown without a clearly defined ordinance, and over time this type of growth should be regulated through official building regulations with the aim of achieving sustainable medium- and long-term growth, according to new trends and population demands. In such cases—and especially for those areas where no type of regulated planning exists, i.e., countries with large populations and few resources—serious environmental and social problems appear. The rectification of this problem is the main challenge for planners of the 21st century [5,6,7,8,9]. In Spain, there has also been an intense period of urbanization in recent decades—especially between 1995 and 2007—incited by a time of high economic activity during which large metropolitan areas in both large- and medium-sized cities were expanded and consolidated.
Nowadays, it is known that the different urbanistic activities that are carried out within a given population settlement should be correctly planned in order to achieve a territorial model that guarantees environmental protection, and at the same time provides an adequate quality of life for the populace. Different planning activities should be supervised to ensure they comply with the objectives, which leads to the development of different methodologies on this topic [10].
However, over time, urban planning has varied according to the tools and technologies available, existing knowledge and thoughts, and the goals, aims, and general environmental awareness of the time. The origins of urban planning were the small-scale performances (projects) of different architects in various European cities at the end of the 19th century. In the 20th century, society pursues a model of development based on economic growth, and cities are seen as a source of wealth and progress. Therefore, hardly any urban planning takes place, as the generation of wealth is prioritized over any other criteria. Only a few models have been developed to study urban growth; they either analyze the economic activities of the population—such as those based on the theory of the central place [11,12,13,14]—or are based on connection techniques, and seek to generate a continuum of urban forms (linear, concentric, etc.) through the new aggregates, with urban growth intimately related to the resulting geometry. Some models propose how urban expansion should be carried out to reach a certain geometry in the city, such as those based on the cellular automata model (CA) [15] or the diffusion-limited aggregation model (DLA) [16,17,18] proposed by Witten and Sander [19,20]. Fortunately, in the 1990s, the population began to become aware of the health of the environment, which is why urban planning has taken on a new dimension. Nowadays, in addition to economic development, urban planning aims to achieve sustainable development and social equity [21,22,23], integrating environmental criteria in decision-making phases in order to address pollution and public health problems arising from the urbanization of large areas without adequate planning [24,25,26,27,28]. To achieve these objectives, urban planning has been articulated by a large amount of legislation, and a large number of tools, methodologies and techniques have been incorporated, many of which are related to geographic information systems (GISs).
GIS technology has gained a great deal of importance since traditional cartography has been replaced by geographically referenced data [29]. To date, GIS is an essential tool used by municipal managers and planners in the management and planning of different resources owing to its easy handling of geo-spatial data throughout the various stages of planning [30,31,32,33,34]. Over the last 25 years, due to the boom of GIS and the gradual integration of environmental criteria in the urbanization and decision-making process, a multitude of works related to territorial planning, sustainable development, and the use of GIS have been carried out [35,36,37,38,39,40]. There have also been several planning studies, similar to this work, based on multi-criteria evaluations in which different environmental factors, such as geology, hydrology, vegetation, and topography, are analyzed and considered in the planning process [41,42,43,44,45,46,47].
The present study includes certain peculiarities in the two multi-criteria analyses (MCAs) used, each of which have different characteristics. In the first multi-criteria analysis (MCA-1), the aim is to evaluate each of the components that make up the urbanization process and to apply the principles of prevention and precaution [48,49], eliminating from the urbanization process those sectors that have any of the restrictive criteria, so the weights of the different criteria is the same. In the second multi-criteria analysis (MCA-2), the weighting is carried out using the Saaty method [50,51,52], which is widely used in most related research. Its peculiarity is that it is used to analyze different urban infrastructures and their possible connection with the different growth zones, with the objective of determining the areas of growth that would suggest a lower economic cost.
Finally, the objective of this work is to develop a methodology using GIS technology, via the analysis of geographical data and established factors, which permits the spatial determination of peripheral areas of the city that accommodate, in a sustainable way, the development of new buildings and urban services. This methodology can be applied to any environment in an easy and efficient manner, and without the need for large economic costs due to its characteristics.
2. Materials and Methods
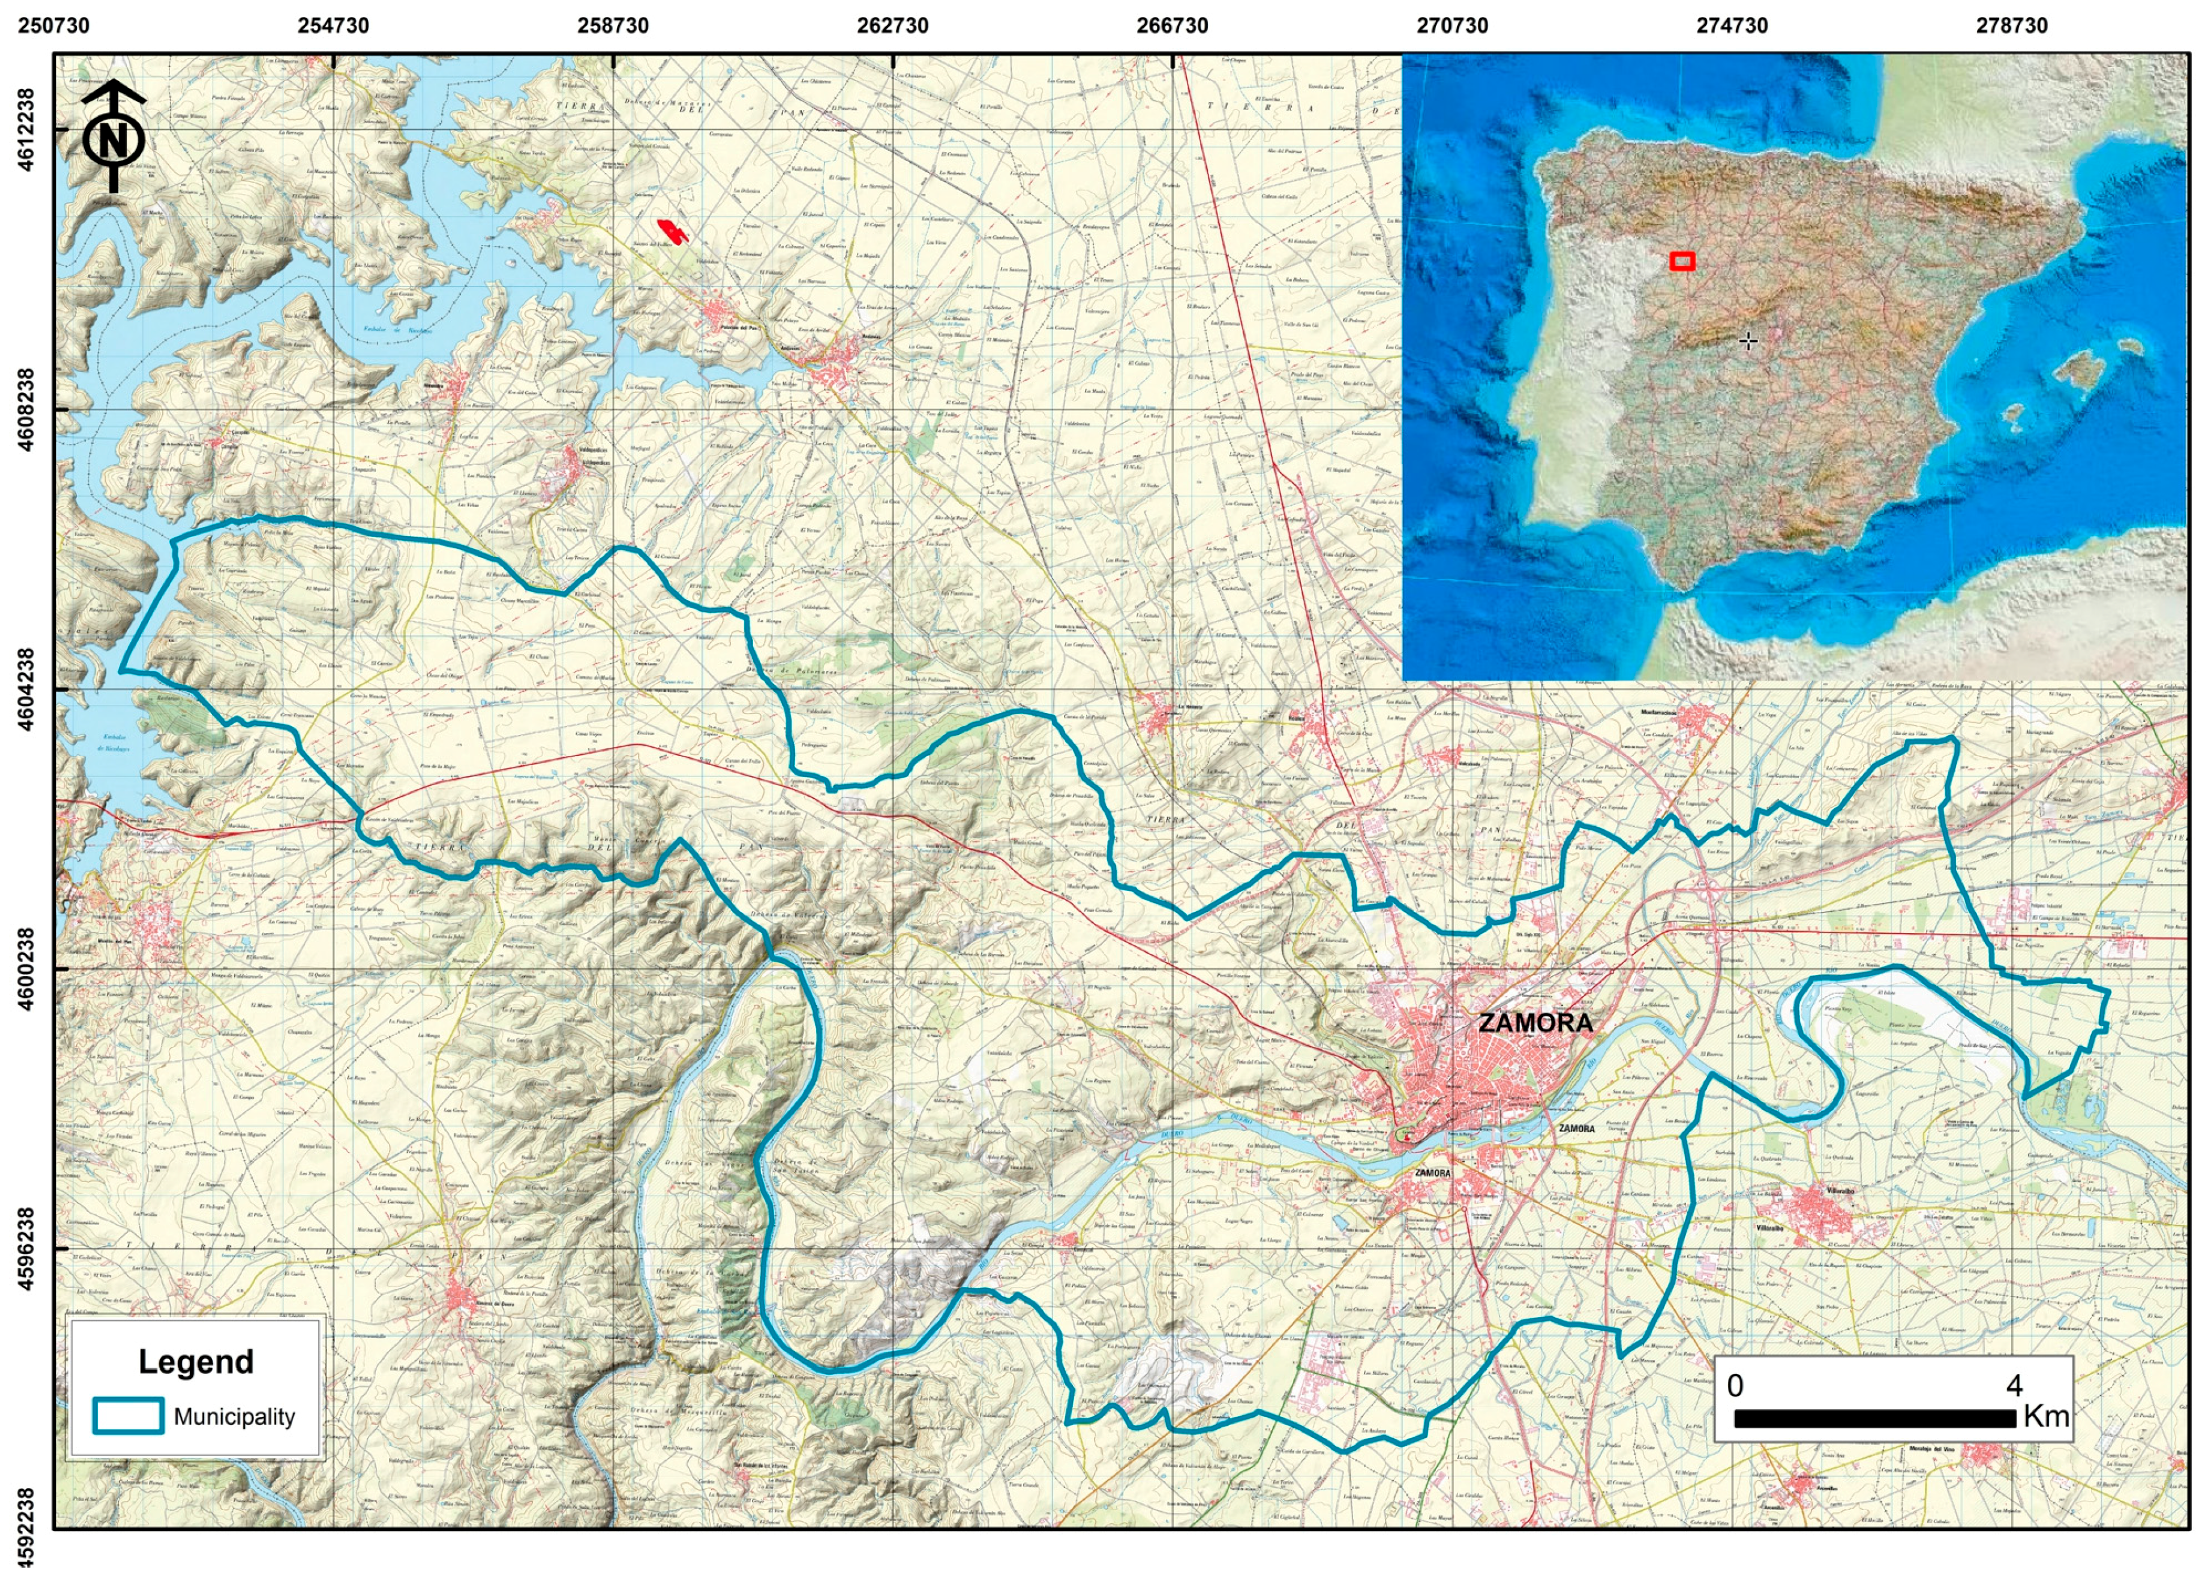
The method to determine the expansion of an urban area was applied to the city of Zamora. Zamora is the capital of the province of Zamora, in the region of Castile and Leon, in the west of Spain (Figure 1). It is a city of 63,217 inhabitants, and much of the industry and services of the area is concentrated. As the surrounding municipalities are mainly agricultural, the population tends to be concentrated in Zamora.
The identification of the most favorable area for amplifying Zamora’s city center was carried out based on a combination of restrictive (elements that impede the construction of housing in certain areas) and conditioning (elements that determine which areas, suitable for building, are the most economically profitable) urbanistic criteria, in which the periphery areas most adequate for accommodating new buildings were localized. The selection of the final sectors was done in agreement with the decision criteria, defined by the objectives or the actions outlined by the government (Figure 2). Finally, a cadastral study was conducted on the selected areas, the appropriate type of housing was chosen, the value of the resulting parcels was analyzed, and a public transport network was designed to connect the new built-up areas with the city center.
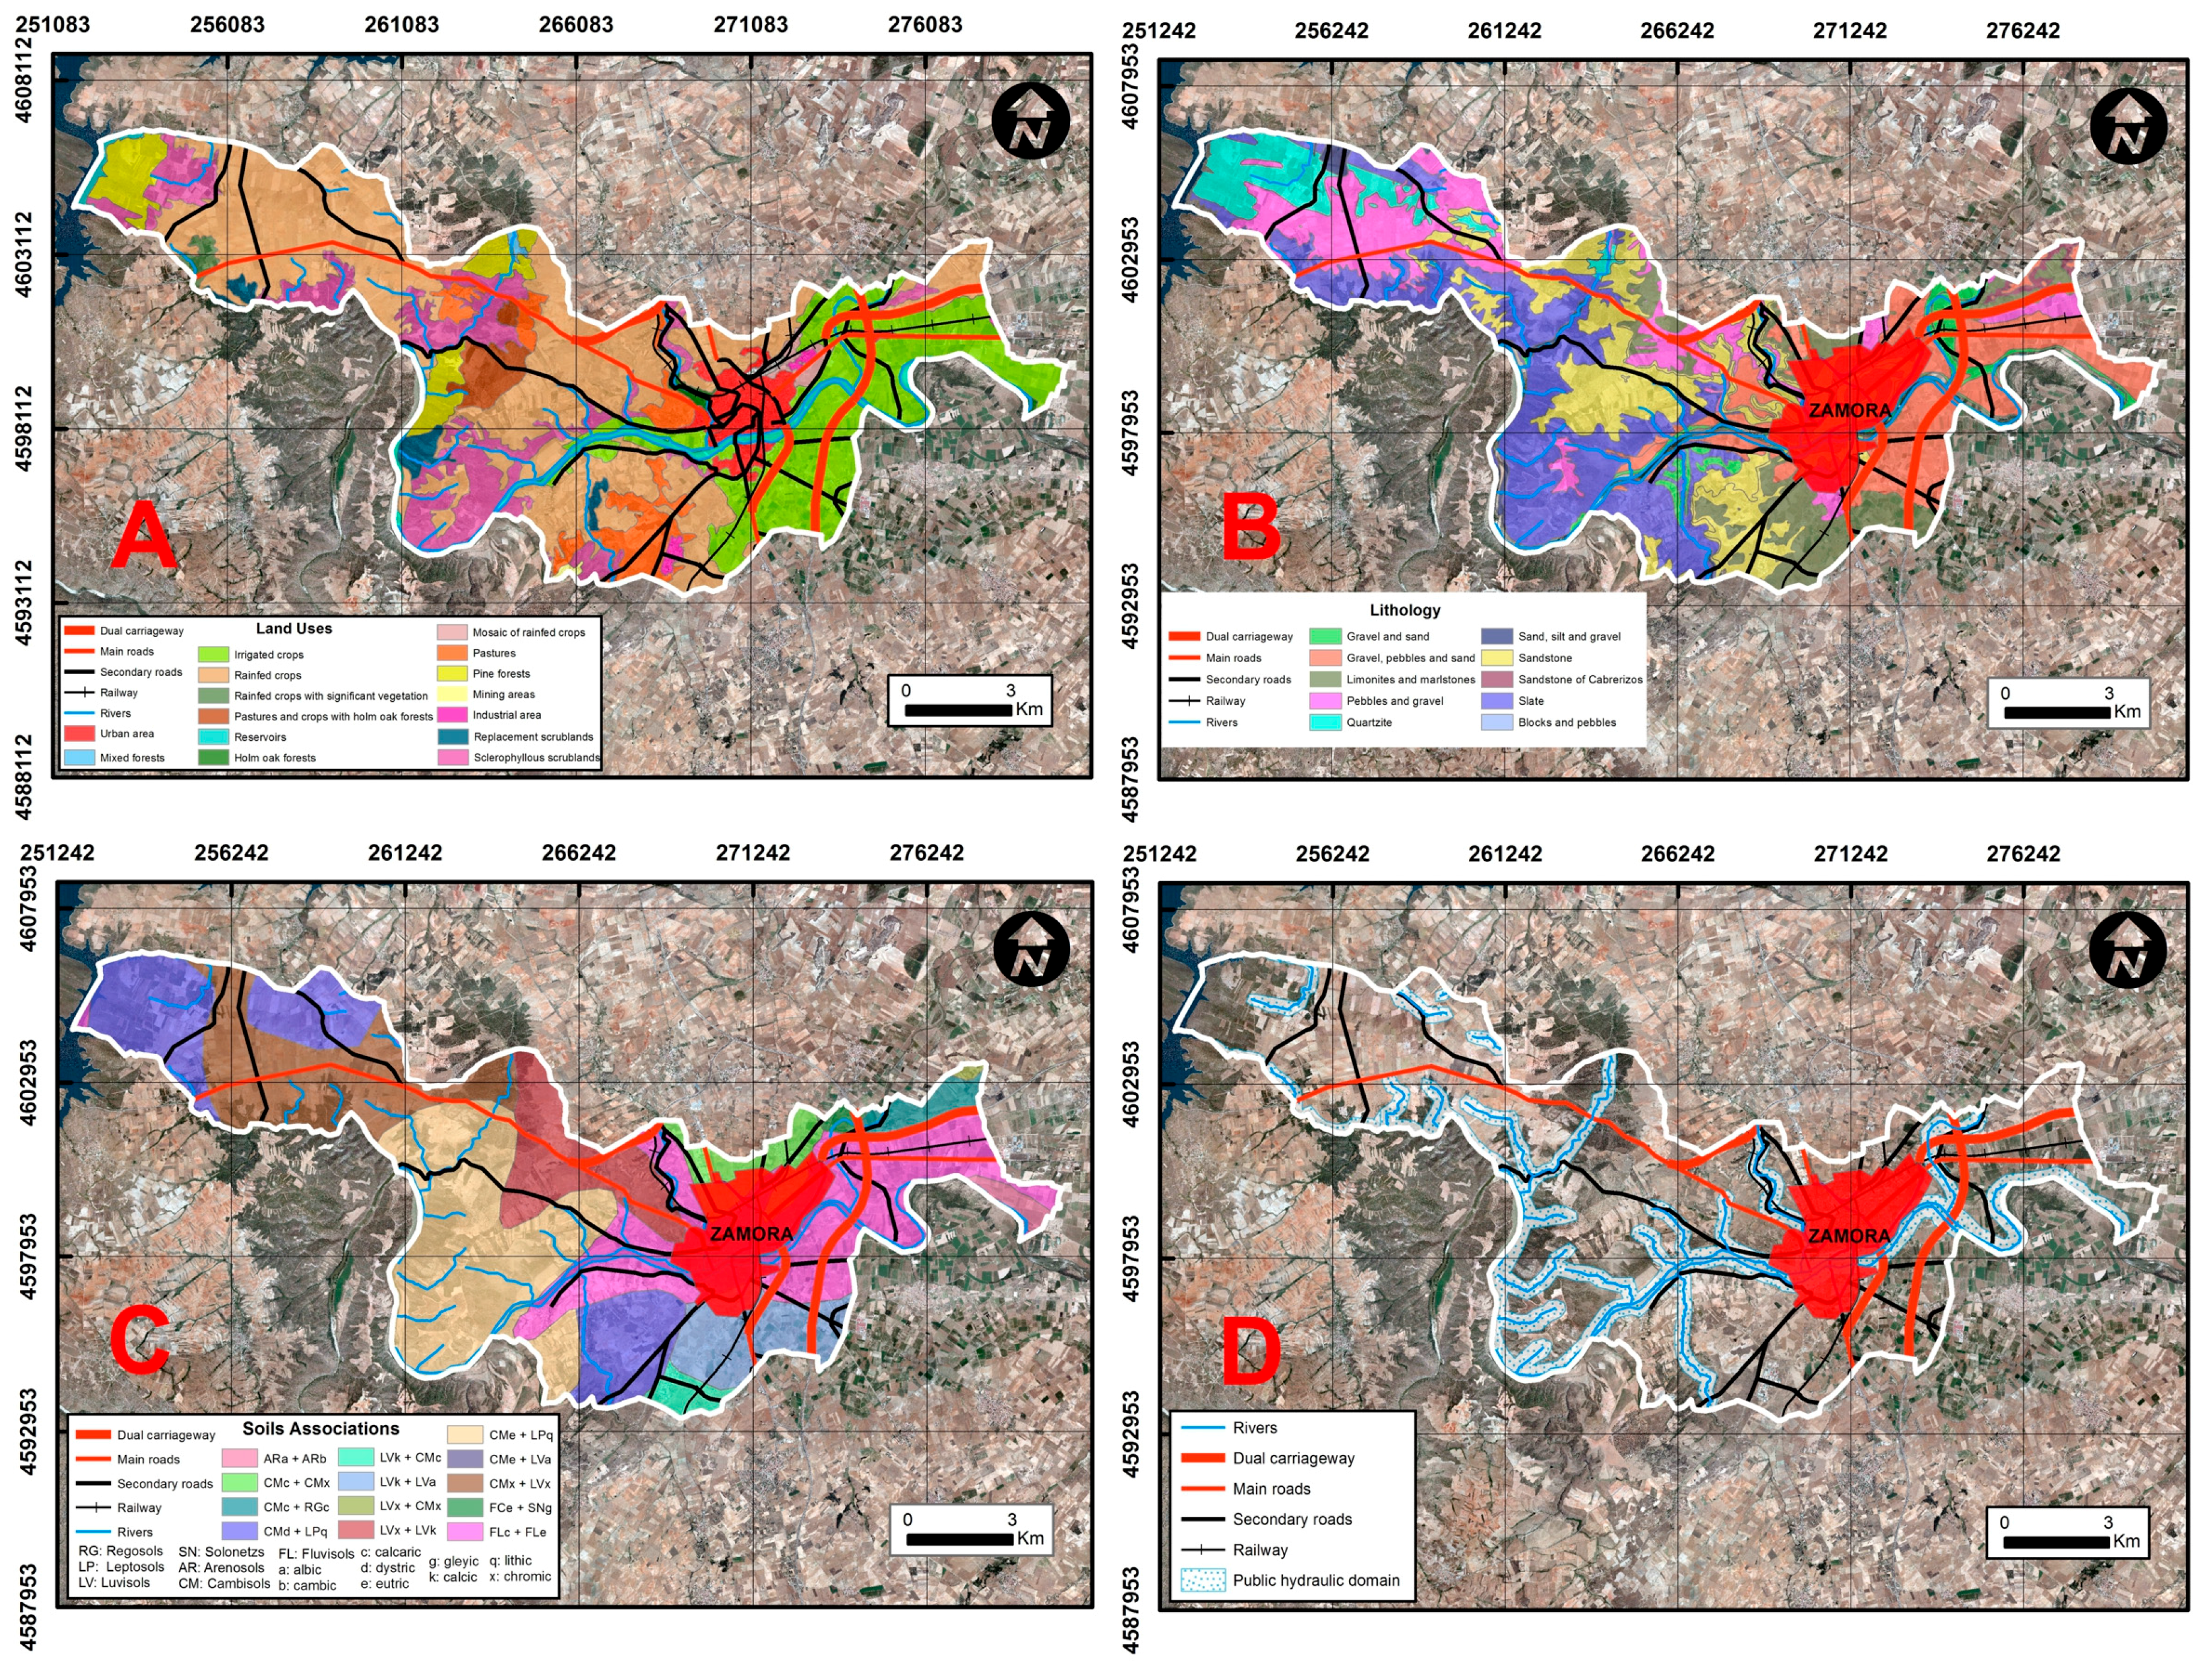
Before carrying out a detailed study regarding the various factors, Zamora’s physical environment was characterized (in terms of land use and geological, edaphological, and hydrological characteristics) in order to provide a basis for the analysis of restrictive factors, using information from the National Geographic Institute of Spain. The land use map (Figure 3A) highlights those agricultural areas in the eastern sector of the city containing irrigation crops and non-irrigated crops, grasslands, and forest, and scrub formations in western areas. On the other hand, the geological map (Figure 3B) shows that the city is seated mainly over quaternary materials, made up of pebbles, gravel, and sands deposited by the Duero River. It was over these materials that the deepest layers of land within the area (fluvisols) developed and were comprised of soil typical of the valley of the Duero River, while the other sectors were situated more to the east of the city and appeared to be mainly seated over sandstone lithology. Over this material, the luvisols formed, and in the far north and south, limonites and loams appeared—luvisols developed in the southern part of the city, and cambisols appeared in the far north, as shown on the soil map, for which the FAO classification has been used [53] (Figure 3C). The hydrological map (Figure 3D) exhibits the rivers and streams of the town as well as the areas protected by the Hydraulic Public Domain (HPD) [54,55,56].
The sites of interest—important zones for everyday life, such as schools, administrative buildings, main squares or municipal markets, which will be utilized in subsequent analyses—were identified. They were then localized spatially by elaborating a geo-database as an excel (.sls) file, which contained their locations and could be imported into the GIS software. These areas were geolocalized in the map using a geocoding service. In addition, the town was divided into 300 m grids using Hawth’s Tools. Those areas that fell within the outskirts of Zamora were selected based on their location, and were the areas that would finally be put forward for construction.
2.1. Study of Restrictive Factors (MCA-1)
A multi-criteria analysis was carried out in which all criteria were assigned the same weight since the city of Zamora is not an area that has difficulties with space for expansion. Therefore, we believe that it is important that the different sectors proposed for the expansion of the city meet all the established factors in order to achieve an environmentally sustainable urban expansion that guarantees an adequate quality of life for the future population.
The different criteria established individually were analyzed using the GIS. Then, the sectors of the periphery in which these restrictions appear were determined. If a single restriction appeared in a sector, that sector would be excluded for building because it would present one of the following: high construction costs (1-high slopes); ecological zones of interest (2-protected natural areas); natural resources (3-soils with greater productive capacity); or risk of discomfort for the population (4-geotechnical risks, 5-areas with low quality of life for the population due to environmental impacts, and 6-risks of flooding). The GIS compiled information on the 6 restrictive factors and selected all those sectors of the periphery in which at least one such factor existed, these zones being eliminated from the process [57].
2.1.1. Steep Slopes
Current geotechnical know-how allows building despite adverse scenarios, but great economic investment is needed. In the current study, due to the abundance of spaces on the outskirts of Zamora that could accommodate new buildings, it was advisable not to build in high-slope areas so as not to increase construction costs. The authors think that this limit can be established in 30% of the areas. Starting with the DEM (digital elevation model), these areas were determined by obtaining the curve levels, creating a DEM in the format of a triangulated irregular network (TIN) and subjecting it to a slope analysis—a raster slope map was generated that reclassified and differentiated between areas with a slope less than 24% and areas with a slope greater than 24%. The slope map of Zamora showed that there were no slopes in its peripheral area that were greater than 24%. Thus, this factor did not present any restriction on the process of urbanization.
2.1.2. Use of Protected Land
The areas that were declared “protected land” due to their natural characteristics should not be built upon. These zones are delimited through a study of the physical environment and of the land use map. Protected land includes the following three types: areas of ecological value (includes the most valuable ecosystems); areas of agro-environmental value (contains areas with high productive value and areas associated with rivers and streams that harbor important fauna and flora in their banks); and environmentally fragile areas (areas with different peculiarities, such as complex relief, steep slopes, soil erosion, Mediterranean relict shrub areas, or highly visible landscapes) [58].
2.1.3. Capability of Land for Agriculture
In order to produce a thematic land capability map that indicates how valuable lands are in a particular region according to their productivity, information was taken from a basic land map. Afterwards, the land was evaluated to define the land classes according to the universally recognized land-capability classification system, using a broad database of environmental, morphological, physical, and chemical soil data, and its capacity for agricultural and forest use. Lastly, each soil was assigned its corresponding land class (10 profiles were chosen from the most representative soils in the area), leaving the richest and most productive soils protected (Classes I and II).
2.1.4. Geotechnics
Some zones present several risks that affect building on the land, making such areas unsuitable for urbanization. These areas were determined using a geotechnical characteristics analysis for which a geotechnical map was created using the geological map of Zamora as its basis, upon which various existing risks were added (lithological, hydrological, geotechnical, and geomorphological) in accordance with the Geotechnical Map of Spain. Areas that presented geotechnical problems related to hydrology, lithology, or geomorphology were then excluded from the process of urbanization to avoid possible risks to the community and extra construction costs.
2.1.5. Areas of Low Quality of Life
New buildings should be situated within clean areas with optimum environmental conditions, that is, areas without environmental disturbances produced by humans, such as noises and bad odors. The influence of the city’s treatment plant on the quality of life of the new residents was thus taken into account. In order to guarantee the well-being of the community, an analysis of the influence of proximity was conducted within multiple rings [59].
2.1.6. Flood Risk
Those areas with a risk of flooding, so as to protect the community and to avoid economic losses, should not be urbanized. To determine the areas affected by flood events, the cartography of studies already performed in the area was obtained for different periods of return [60]. Studies related to the period of return of 500 years were taken as the reference for the establishment of the flood zones, since these flood episodes are the most intense and cause the greatest damage to the population. To finalize the MCA-1, through the selection of attributes by the GIS, those sectors in which one or more of the analyzed criteria is manifested are excluded from the process and will not be able to house new buildings.
2.2. Study of Conditioning Criteria (MCA-2)
After those periphery sectors without restrictions were determined, they were differentiated based on their suitability to accommodate new buildings—the most adequate were those areas that required the lowest extra costs. These sectors were compared using a series of conditioning criteria.
2.2.1. Proximity to Pre-Existing Urban Infrastructures
The future buildings needed to provide basic supplies of electricity (Criteria 1, C1), potable water (C2), and waste disposal (C3), and the new infrastructures that covered these services should connect up with the already existing ones—the best areas to build were those nearest to already existing networks. Using the plan/blueprint of pre-existing networks, which are geo-referenced and digitalized, the GIS was used to calculate the distance between the growth points and the infrastructures, choose the minimum distance, and elaborate a distance map using the interpolation method of inverse distance.
2.2.2. Road Density (C4)
The presence of roads in growth sectors implied a significant economic benefit, as the cost involved in connecting roads to already existing infrastructures was lower. To determine the number of roads, a density analysis of the framework of the city was carried out.
2.2.3. Proximity to Administrative Zone (C5)
The new buildings needed to be located relatively close to the city center (administrative and commercial zone) in order to provide a high level of serviceability to the future population. Using an area of influence with multiple concentric rings of 500 m and its reclassification, a descending valuation was established for the different areas as they moved farther away from the center.
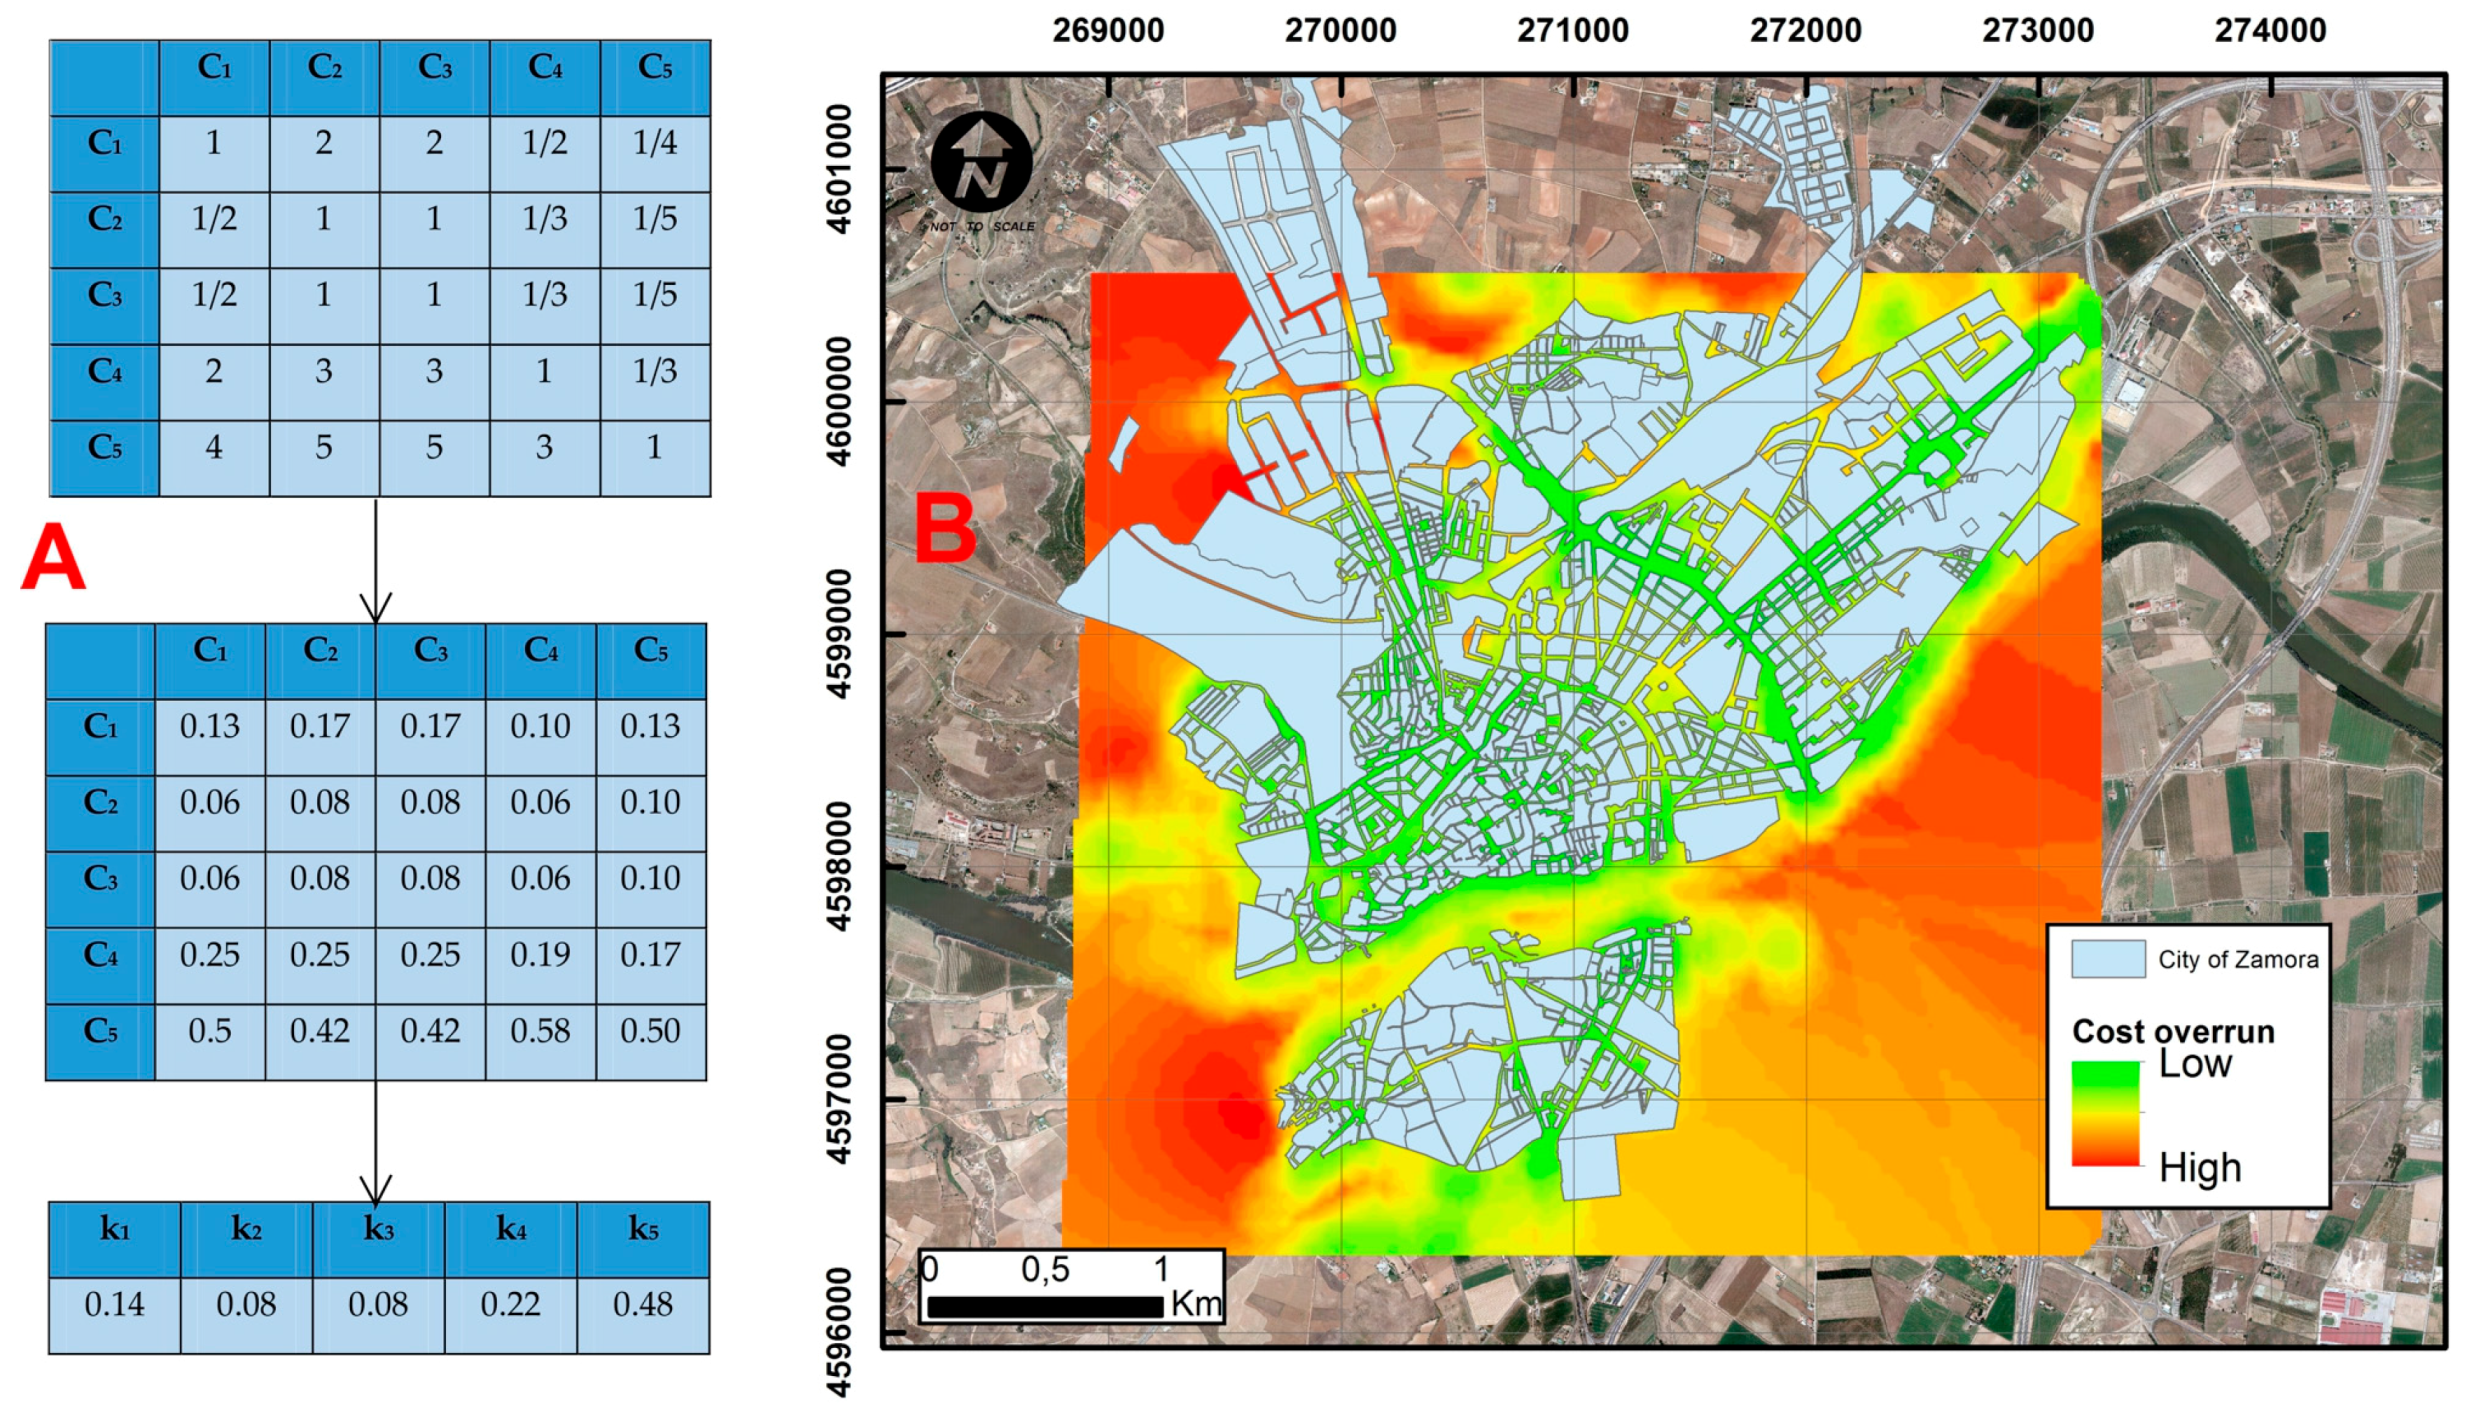
After analyzing the conditioning criteria individually, we proceeded to the multi-criteria analysis in which each of the criteria received a weighting coefficient calculated using the Saaty method. The result of this analysis was a new raster—a result of the combination of the previous ones: Raster = k1 × C1 + k2 × C2 + k3 × C3 + k4 × C4 + k5 × C5, where Ki is the weighting coefficients and Ci the different criteria analyzed.
2.3. Determination of the Favorable Sectors
After completion of MCA-1 and MCA-2, all sectors that received a positive evaluation would be able to accommodate the new buildings. However, the growth needs of the city are limited, so it was decided that four sectors of the periphery would be selected as areas to urbanize. These four sectors would need to be selected from those not eliminated during the multi-criteria analysis, for which a decision criterion is used.
2.4. Decision Criteria
According to the type of study and societal needs, the decision criteria might vary. In this case, only the close proximity of the different growth areas to schools with the largest number of vacant places were considered. The objective was that these schools would accept new students originating from the built-up area, avoiding the need to build new schools that would increase costs. After the public and private schools were identified using an address localizer, the city was divided in accordance with the area of influence of each school using the “Thiessen polygon method” [61], which labeled each polygon with the number of vacant places of each school.
2.5. Analysis of the Areas Selected for Urbanization
After the expansion areas of the city center were defined, the analysis of a series of factors that served to improve the execution of the process of urbanization was carried out.
2.5.1. Division of Land into Parcels
Once the areas to be urbanized were selected, they were defined as execution units (cadastral parcels) that facilitated urbanization. To do this, an image of the existing plots was obtained from the Electronic Land Registration Office, which was geo-referenced and served as a basis for digitalizing the different parcels that made up the growth areas.
2.5.2. Housing Typology Analysis
The type of building that was recommended for the growth area and the maximum number of floors recommended to build were determined based on an analysis of the characteristics of the houses of the surrounding area using Google Maps and Google Earth. The objective was to integrate the new buildings in the best way possible into the already urbanized environment to achieve a certain level of homogeneity in the urban structural framework.
2.5.3. Parcel Value Analysis
There were multiple variables that influenced parcel price: extension, visibility, location, etc. However, in the present study, only the value of each parcel in relation to its view of the industrial areas was analyzed. Using the cartography of the industrial areas obtained at the Land Use Information System of Spain, the calculation of viewsheds was carried out and a visibility map of the industrial areas was obtained from each parcel. Lastly, the magnitude of visual impact (null, low, medium, high, and very high) was determined using zonal statistics for each plot.
2.5.4. Establishment of the Transport Network
To guarantee a satisfactory connection between the city center and the new growth area, a transport route connecting both areas was designed. To do this, a geodatabase was created, generating a dataset of elements that included the structural framework of the city of Zamora. Using the Utility Network Analyst software, a new transport route was then designed.
3. Results
Firstly, the individual analysis of each of the restrictive criteria established in the MCA-1 was carried out. The slopes of more than 24% can be seen in the slope map of Zamora (Figure 4A). It was noted that there were no slopes in the peripheral area of Zamora that were greater than 24%, and this factor therefore did not present any restriction on the process of urbanization.
In the protected land map (Figure 4B), different protected areas could be observed together with unprotected areas, highlighting spaces that could be used for livestock farming (combining a large portion of non-irrigated crops, grassland areas, and areas for raising livestock) and industrial areas that contained sand and gravel quarries, tree plantations, etc. The undeveloped protected areas within the urban part of the city included the southwest part of the city where highly productive irrigated crops were grown within the Duero Valley (area of agro-environmental value), and the ecosystems connected to the Duero and Valderaduey rivers, which contained an interesting riverbank flora and associated diverse fauna (environmentally fragile areas).
Land capability for agriculture is shown in the land class map of Zamora (Figure 4C). The most productive and valuable soils were observed to be situated over flat soils and soils of the river valley (Fluvisols) capable of being irrigated (Class II). Additionally, deep soil with good characteristics (Cambisols and especially Luvisols), situated over flat soil or with a slight slope, were assigned to Class III. These soils corresponded to the areas designated for non-irrigated crops in the north and southeast parts of the city and were also distributed throughout the western section of the town. In rocky areas with a high slope, close to river escarpments, the soils, such as Regosols, were less developed; however, this did not inflict any limitation on the cultivation of rained crops (Class IV). Finally, the rest of the soils were included within Class VI, being less developed and of poorer quality. This soil was greatly limited and impeded agricultural exploitation, but was adequate enough for the cultivation of dry grasslands and dry pastures (oak trees) in flat areas, and shrubs in escarpment areas.
In the geotechnical map of Zamora (Figure 4D), it was observed that the territory was divided into zones with favorable, acceptable, or unfavorable conditions. The worst conditions were found in the western part of the town, which contained material that was easily capable of breaking into slabs—such as quartzite and slate—and was attached to steep terrain, conditions that might have led to problems with landslides. In the eastern part of the town, and generally within the city center of Zamora (except for the areas linked to waterways), favorable building conditions were observed. This was due to the flat and stable morphology of the area and to the presence of stable and resistant materials (sand, gravel, and alluvial clay deposits in the vicinity of the Duero River, and the sandstones and conglomerates in the north part of the city).
As a result of the analysis within multiple rings to determine the areas with risk of low quality of life, two areas of restrictive influence were identified that would make urbanization of the area impossible. One included a 200 m radius affected by noise and odors, and the other a 400 m radius affected by bad odors. After carrying out the analysis, it was observed that none of the peripheral areas suffered from these effects; therefore, the factor of proximity to the purification system would not be considered as an issue from then on.
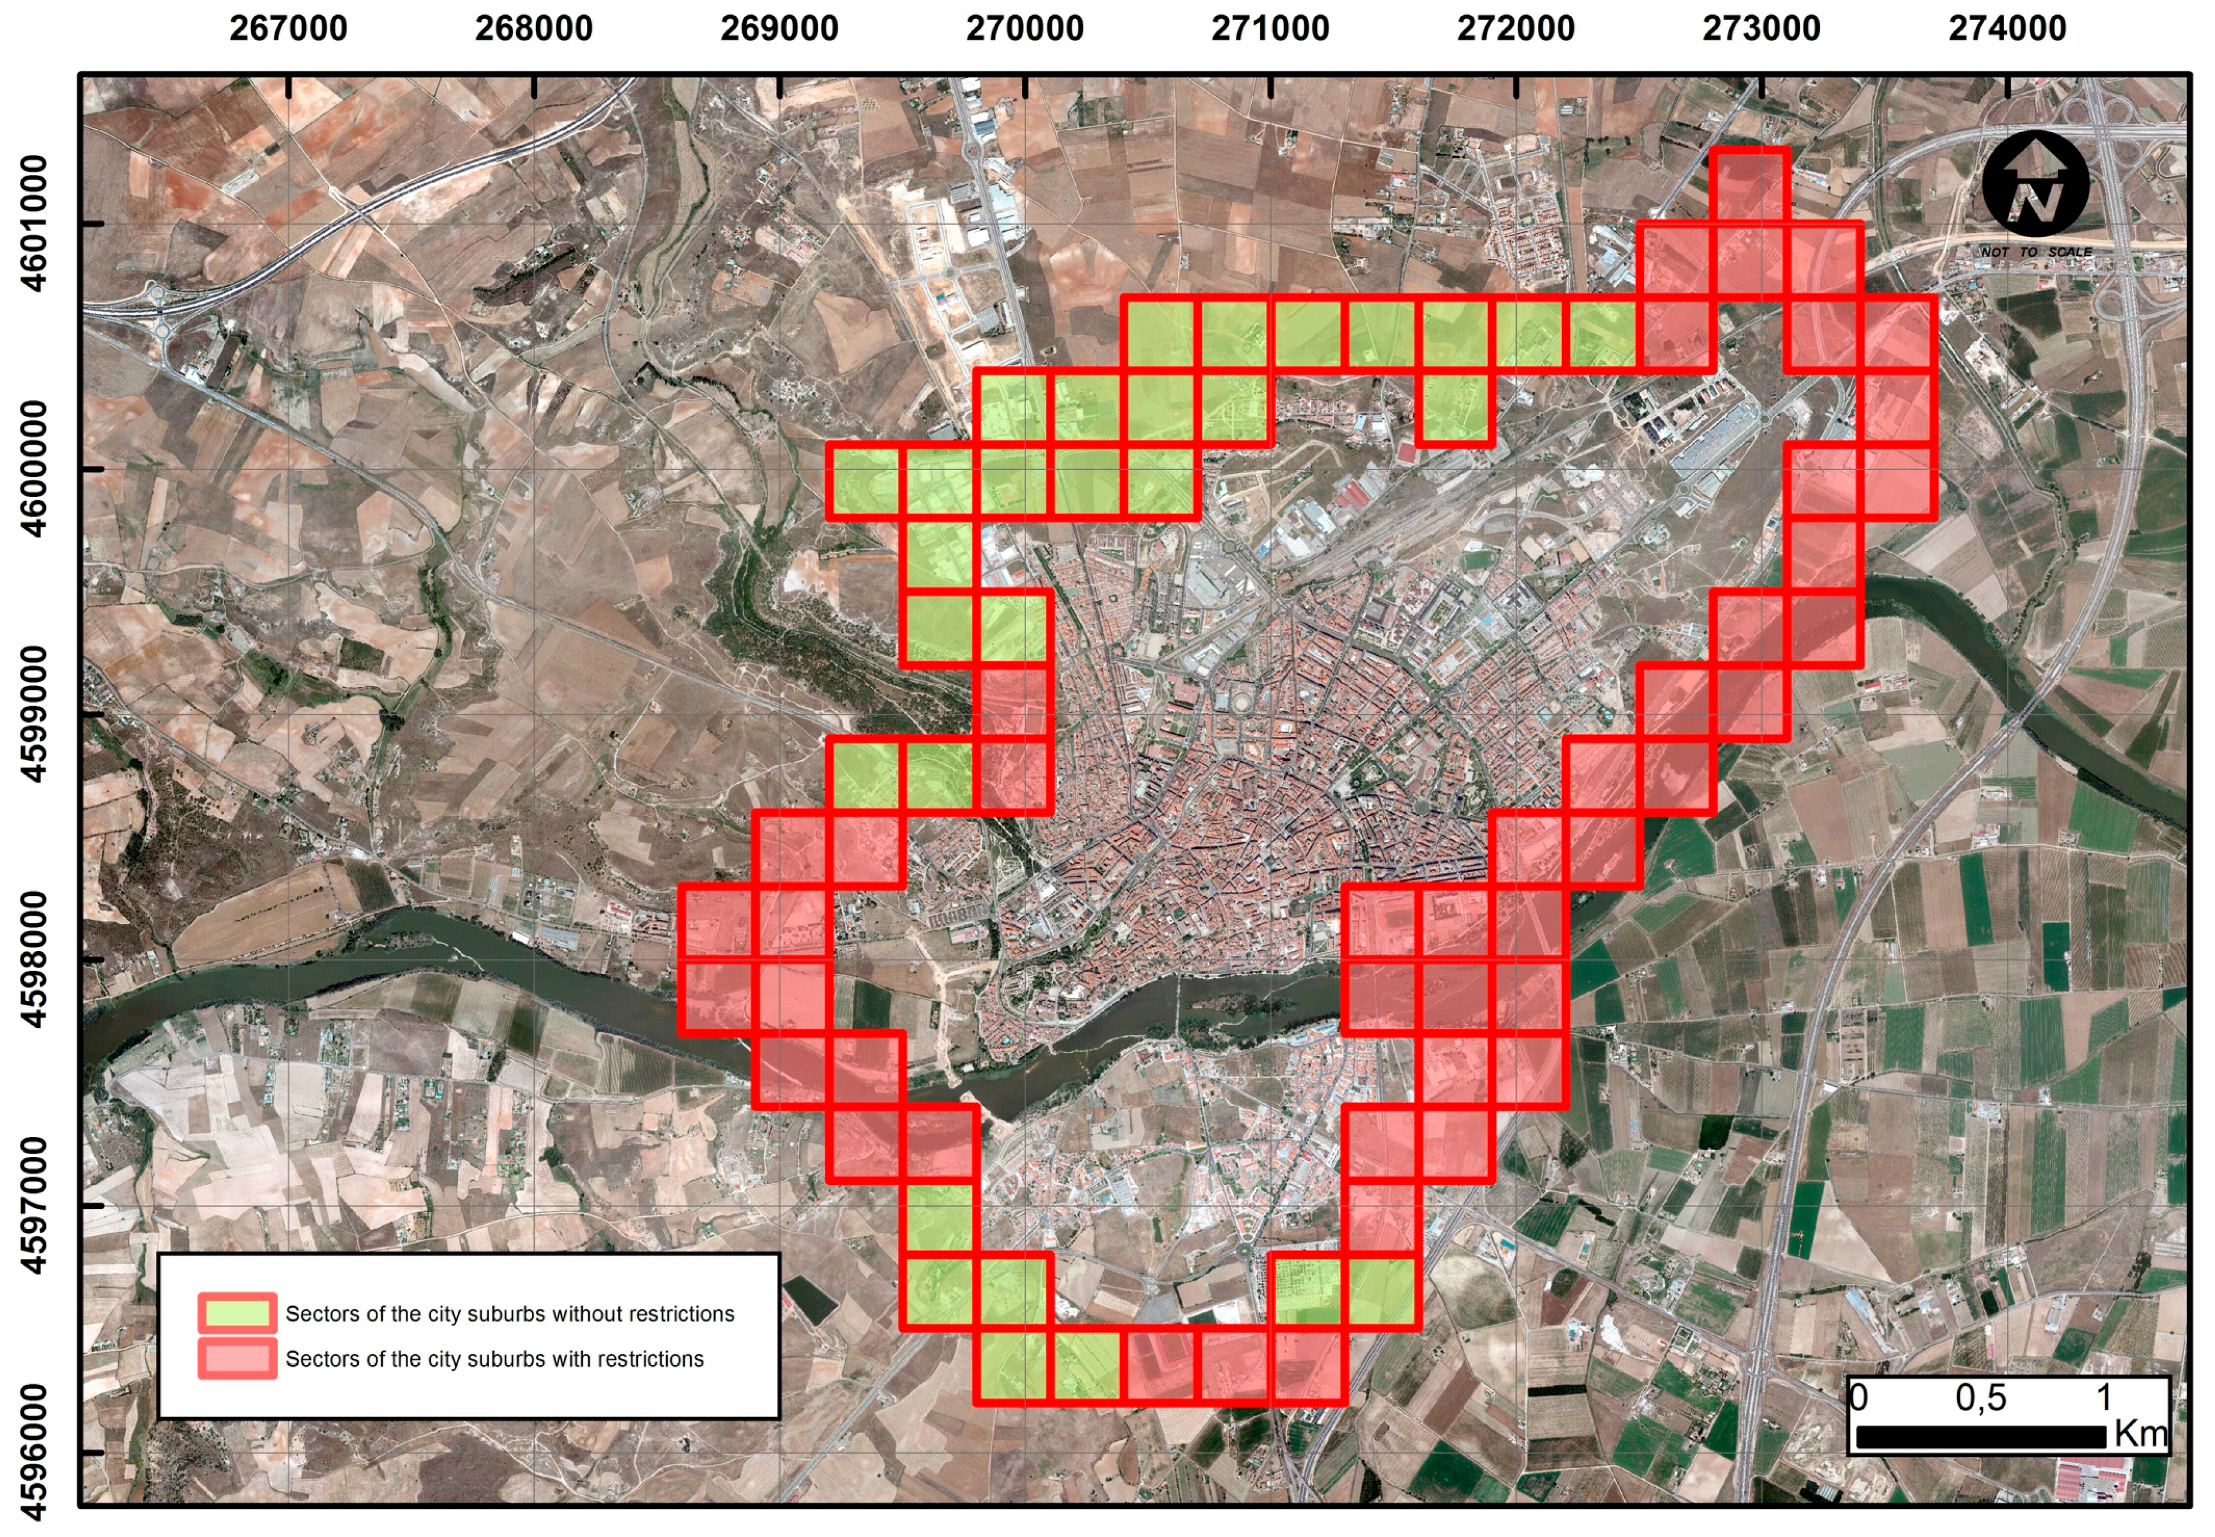
From the mapping of flooded areas, the sectors of the periphery affected by the floods were selected using GISs for periods of return of 10, 100, and 500 years. For the analysis of the affected sectors, the period of return of 500 years was used because it is the most restrictive (Figure 5).
After analyzing individually each of the restrictive factors imposed for the MCA-1, the sectors in which they were manifested were necessarily eliminated from the urbanization process. The zones of the periphery of Zamora where these criteria did not appear (Figure 6) were then to be submitted to a new MCA. In total, the periphery of Zamora was divided into 74 sectors, all of which were studied. After carrying out the MCA-1, it was observed that, in 45 of these sectors, at least one restrictive criterion was manifested, these sectors were excluded from the process. The remaining 29 sectors were submitted to MCA-2 (Figure 7A). The restrictive factors that appeared were as follows (Figure 7B): flood risks (in 22 of the sectors); flood risk and agro-environmental value (in 5 sectors); flood risk and environmentally fragile areas (in 15 sectors); and agro–environmental value (in 3 sectors).
After performing the MCA-1, the conditioning criteria were evaluated individually for those areas that were evaluated positively in MCA-1. To analyze the distance between the different sectors and the infrastructures, three basic services were taken into account. Regarding the distance of the electrical supply (Figure 8A), the north and south periphery areas of Zamora were found to be closer than those situated in the east. Additionally, in the distance map, it was observed that all the areas were quite close to the supply network except for some areas in the far north and south. Furthermore, it was observed that the distances to the sewerage system (Figure 8B) were generally greater with respect to the rest of the infrastructures, being less so in the northeast sector.
The analysis of the road density indicated that the greatest road density was located in the northeast and northwest; the rest of the areas had an intermediate road density (Figure 8C).
According to the distance map of proximity to the administrative zone (city center), the areas of growth farthest away from the center were located in the northern part, while the distance was less for areas located in the western and southwestern parts of the city (Figure 8D).
After evaluating the conditioning criteria individually, the MCA-2 was performed based on the Saaty method (Figure 9A), from which a new raster as obtained in which the sectors were differentiated according to the extra costs of their urbanization (Figure 9B), discarding those sectors that would require greater expenditure. Of the 29 sectors without restrictions, 15 of them satisfied the conditioning criteria, and were thus able to accommodate future buildings. The remaining 14 were discarded and could not be built upon because of the economic costs it would entail (Figure 10).
It can be seen that both the north and southwest sectors were able to accommodate new buildings that would expand the city of Zamora (Figure 11A). The decision criterion would indicate which of these two areas is the best option for urbanization. After the areas were divided into zones and the number of vacant places was studied, it was observed that the schools located in the outskirts of the city were the ones that had the most available places, especially within the eastern part of the city. For this reason, it was decided that the areas that would be urbanized were close to this area (Figure 11B), which had enough free land capable of being developed (northern parts of the city).
Study of the Proposed Sectors
Finally, an analysis of the proposed sectors for urbanization was carried out. The sectors were first divided according to the cadastral parcels they comprised, and the dimensions of each were established (Figure 12A). Afterwards, the factors that could cause price variation of the plots, consequently affecting future construction, were estimated. As previously mentioned, price variation could vary in relation to the visual impact of each parcel (Figure 12B).
The sectors chosen for expansion of the city center of Zamora were found within the neighborhood of Villalobos, an area where two main types of housing were distinguished: older floor houses (some in a bad state of conservation) and newer houses that largely had two floors. It was advised that the new buildings should not contain more than two floors, so as not to alter the homogeneity of the city’s structural framework. The selected parcels, which included an extension of 356,039 m2, were mostly used for livestock farming with largely non-irrigated crops. The rest of the land was unused, with the exception of an area that was used to house old cars that caused a great visual impact. It was advised that this car scrap yard be removed to minimize the visual impact, and any other problems that it could possibly cause for the future residents, and to maintain urbanistic uniformity. It was suggested that, if this were impossible, the area be developed into a green area that would lessen the impact. Additionally, it was recommended that green areas be included within the new growth sector in accordance with the already existing green areas in the city, acting as transition zones between green areas and the field crops attached to the proposed growth sector.
Finally, a public transport network was designed (Figure 12C) that could be added to the local road network, which created an adequate connection between the new growth sectors and the urban nucleus.
4. Conclusions
In a society that increasingly tends to aggregate into large urban centers, the expansion of cities—as a consequence of the housing demand created by the population that moves to these areas—can cause territorial imbalances if adequate measures are not taken. For this reason, urban growth should be regulated via a series of planning instruments that guarantee a balanced territory and an equal distribution of different facilities and services. Additionally, a global sustainability of the process must be pursued, with adequate protection of the environment, optimum well-being of the population, and effective economic control.
Today, geographic information systems (GIS) are a convenient, quick, and very economical tool for analyzing the different problems that may arise in territorial planning and management, as it allows for the capture, management, handling, analysis, modeling, and representation of the geo-referenced data. This technology is particularly interesting when used in the initial stages of planning. The present study is an example of the applicability of GIS in the analysis and characterization of the physical environment and for resolving planning and building ordinance problems, as implicated in the expansion of a city center. Using a simple methodology, and by addressing the established factors, the different sectors initially proposed for the urban expansion were either selected for, or discarded from, the process in relation to their compatibility with the aforementioned factors. The use of a GIS methodology, which uses mostly cartography already performed, makes the economic outlay of the procedure very low, constituting a low-cost planning alternative.
Therefore, in a planning and building ordinance study, it is essential to analyze the physical environment and its reception capacity, with the ultimate goal of selecting those sectors that provide adequate environmental protection. It is also necessary to include the geotechnical requirements needed to accommodate the new buildings in a satisfactory and safe manner, in order to ensure proper protection against risks and the good quality of life of future communities. The analysis of these aspects, studied here in MCA-1, are of vital importance to planning processes, since a good diagnosis of the physical environment can subsequently avoid the implementation of extra corrective type interventions (it is a preventive methodology), which are usually very expensive. Therefore, it can be affirmed that, in a territorial planning action, a portion of the economic factors are linked to the environmental ones, in such a way that a correct evaluation of the environment will later confer an important economic saving, an aspect to take into account in the current times of austerity. Additionally, intelligent intervention in the physical environment will result in a better quality of life for the future population, as it will avoid outbreaks of nearby discomfort, as well as risks associated with geological phenomena, and the most valuable landscapes will be conserved.
On the other hand, the remaining financial outlay in a planning action is related to the provision of services to new growth sectors. This is discussed in MCA-2, which demonstrates that a correct assessment of the location of pre-existing infrastructures can help to control the economic costs. We believe that the economic criterion should be used to determine the final growth sectors, so that the most economically profitable sectors will be those closest to pre-existing infrastructures. In this way, the duplication of roads and the construction of long distribution networks of water or electricity, among other things, are avoided.
In conclusion, this paper establishes a simple methodology that can be quickly applied and easily reproduced thanks to the use of a GIS, which also makes it cheap. Its basic pillars revolve around the correct diagnosis of the physical environment, which guarantees adequate protection of the most valuable areas, and which will have a positive impact on the other two pillars of the method, since it will guarantee a good quality of life for the population, and lower subsequent economic costs, as it is a preventive method. Finally, the economic viability of the process is also analyzed, taking into account the location of pre-existing infrastructures.
Acknowledgments
This work has been supported by the USAL research projects CGL2012-37281-C02.01, CGL2015-67169-P and CGL2015-69919-R (MINECO-FEDER).
Author Contributions
All authors are responsible for the design of the research. Marco Criado, Antonio Martínez-Graña, and Caridad Zazo developed the GIS data and analyzed the digitals maps; Fernando Santos and Sergio Veleda were responsible for the planning and management of land use. All authors contributed to the writing of the paper and to the discussion of the analysis.
Conflicts of Interest
The authors declare no conflict of interest.
References
- Seto, K.C.; Fragkias, M. Quantifying spatiotemporal patterns of urban land-use change in four cities of China with time series landscape metrics. Landsc. Ecol. 2005, 20, 871–888. [Google Scholar] [CrossRef]
- Luck, M.; Wu, J. A gradient analysis of the landscape pattern of urbanization in the Phoenix metropolitan area of USA. Landsc. Ecol. 2002, 17, 327–339. [Google Scholar] [CrossRef]
- Westervelt, J.; BenDor, T.; Sexton, J. A technique for rapidly assessing regional scale urban growth. Environ. Plan. 2011, 38, 61–81. [Google Scholar] [CrossRef]
- Martínez-Graña, A.M.; Goy, J.L.; Zazo, C. Dominant soil map in “Las Batuecas-Sierra de Francia” and “Quilamas” nature parks (Central System, Salamanca, Spain). J. Maps 2014, 11, 371–379. [Google Scholar] [CrossRef]
- Irwin, E.G.; Bockstael, N.E. Interacting agents, spatial externalities and the evolution of residential land use patterns. J. Econ. Geogr. 2002, 2, 31–54. [Google Scholar] [CrossRef]
- Poelmans, L.; Van Rompaey, A. Detecting and modelling spatial patterns of urban sprawl in highly fragmented areas: A case study in the Flanders–Brussels region. Landsc. Urban Plan. 2009, 93, 10–19. [Google Scholar] [CrossRef]
- Bendor, T.; Westervelt, J.; Song, Y.; Sexton, J.O. Modeling park development throught regional land use change simulation. Land Use Policy 2013, 30, 1–12. [Google Scholar] [CrossRef]
- Martínez-Graña, A.M.; Goy, J.L.; De Bustamante, I.; Zazo, C. Characterisation of environmental impact on resources, using strategic assessment of environmental impact and management of natural spaces of “Las Batuecas-Sierra de Francia” and “Quilamas” (Salamanca, Spain). Environ. Earth Sci. 2014, 71, 39–51. [Google Scholar] [CrossRef]
- Romero-Lankao, P.; Gnatz, D.M.; Wilhelmi, O.; Hayden, M. Urban Sustainability and Resilience: From Theory to Practice. Sustainability 2016, 8, 1224. [Google Scholar] [CrossRef]
- Grădinaru, S.R.; Iojă, C.I.; Pătru-Stupariu, I.; Hersperger, A.M. Are spatial planning objectives reflected in the evolution of urban landscape patterns? A framework for the evaluation of spatial planning outcomes. Sustainability 2017, 9, 1279. [Google Scholar]
- Berry, B.J.L.; Garrison, W.L. The Functional Bases of the Central Place Hierarchy. Econ. Geogr. 1958, 34, 145–154. [Google Scholar] [CrossRef]
- Berry, B.J.L.; Barnum, H.G. Aggregate relations and elemental components of Central Place Systems. J. Reg. Sci. 1962, 4, 35–68. [Google Scholar] [CrossRef]
- White, R.W. Dynamic Central Place Theory: Results of a Simulation Approach. Geogr. Anal. 1977, 9, 226–243. [Google Scholar] [CrossRef]
- Allen, P.M.; Sanglier, M. A Dynamic Model of a Central Place System—II. Geogr. Anal. 1981, 13, 149–164. [Google Scholar] [CrossRef]
- White, R.; Engelen, G. Cellular Automata and Fractal Urban Form: A Cellular Modelling Approach to the Evolution of Urban Land-Use Patterns. Environ. Plan. A 1993, 25, 1175–1199. [Google Scholar] [CrossRef]
- Batty, M.; Longley, P.; Fotheringham, S. Urban Growth and Form: Scaling, Fractal Geometry, and Diffusion-Limited Aggregation. Environ. Plan. A 1989, 21, 1447–1472. [Google Scholar] [CrossRef]
- Batty, M. Cities as fractals: Simulating growth and form. In Fractals and Chaos; Springer: New York, NY, USA, 1991; pp. 43–69. [Google Scholar]
- Batty, M. Generating Urban forms from Diffusive Growth. Environ. Plan. A 1991, 23, 511–544. [Google Scholar] [CrossRef]
- Witten, T.A.; Sander, L.M. Diffusion-limited aggregation, a kinetic critical phenomenon. Phys. Rev. Lett. 1981, 47, 1400–1403. [Google Scholar] [CrossRef]
- Witten, T.A.; Sander, L.M. Diffusion-limited aggregation. Phys. Rev. B 1983, 27, 5686–5697. [Google Scholar] [CrossRef]
- Munasinghe, M. Environmental Economics and Sustainable Development; Paper Presented at the UN Earth Summit, Rio de Janeiro, Brazil, and Reproduced as Environment Paper No. 3; World Bank: Washington, DC, USA, 1992. [Google Scholar]
- Campbell, S. Green Cities, Growing Cities, Just Cities? Urban Planning and the contradictions of sustainable development. J. Am. Plan. Assoc. 1996, 62, 296–312. [Google Scholar] [CrossRef]
- Scholz, M.; Hedmark, A.; Hartley, W. Recent advances in sustainable multifunctional land and urban management in Europe: A review. J. Environ. Plan. Manag. 2012, 55, 833–854. [Google Scholar] [CrossRef]
- Mage, D.; Ozolins, G.; Peterson, P.; Webster, A.; Orthofer, R.; Vandeweerd, V. Urban air pollution in megacities of the world. Atmos. Environ. 1996, 30, 681–686. [Google Scholar] [CrossRef]
- Romero, H.; Ihl, M.; Rivera, A.; Zalazar, P.; Azocar, P. Rapid urban growth, land-use changes and air pollution in Santiago, Chile. Atmos. Environ. 1999, 33, 4039–4047. [Google Scholar] [CrossRef]
- Gurjar, B.R.; Jain, A.; Sharma, A.; Agarwal, A.; Gupta, P.; Nagpure, A.S.; Lelieve, J. Human health risks in megacities due to air pollution. Atmos. Environ. 2010, 44, 4606–4613. [Google Scholar] [CrossRef]
- Peptenatu, D.; Pintilii, R.D.; Draghici, C.; Stoian, D. Environmental pollution in functionally restructured urban areas: Case study—The city of Bucharest. Iran. J. Environ. Health Sci. Eng. 2010, 7, 87–96. [Google Scholar]
- Liu, X.; Zhu, H.; Hu, Y.; Feng, S.; Chu, Y.; Wu, Y.; Wang, C.; Zhang, Y.; Yuan, Z.; Lu, Y. Public’s Health Risk Awareness on Urban Air Pollution in Chinese Megacities: The Cases of Shanghai, Wuhan and Nanchang. Int. J. Environ. Res. Public Health 2016, 13, 845. [Google Scholar] [CrossRef] [PubMed]
- Burrough, P.; Mcdonnel, R. Principles of Geographical Information Systems, 2nd ed.; Oxford University Press: Cary, NC, USA, 1998. [Google Scholar]
- Lee, D.B. Retrospective on large-scale urban models. J. Am. Plan. Assoc. 1994, 60, 35–40. [Google Scholar] [CrossRef]
- Arentze, T.; Borgers, A.; Timmermans, H. A Multiobjective Model for Developing Retail Location Strategies in a DSS Environment; Urban Planning Group, Eindhoven University of Technology: Eindhoven, The Netherlands, 1996. [Google Scholar]
- Ribeiro Palacios, M.; Huber-Sannwald, E.; García Barrios, L.; Peña De Paz, F.; Carrera Hernández, J.; Galindo Mendoza, M.G. Landscape diversity in a rural territory: Emerging land use mosaics coupled to livelihood diversification. Land Use Policy 2013, 30, 814–824. [Google Scholar] [CrossRef]
- Martínez-Graña, A.M.; Goy, J.L.; Zazo, C. Water and wind erosion risk in natural parks. A case study in “Las Batuecas-Sierra de Francia” and “Quilamas” protected parks (Central System, Spain). Int. J. Environ. Res. 2014, 8, 61–68. [Google Scholar]
- Li, X.; Hijazi, I.; Koening, R.; Lv, Z.; Zhong, C.; Schmitt, G. Assessing Essential Qualities of Urban Space with Emotional and Visual Data Based on GIS Technique. ISPRS Int. J. Geo Inf. 2016, 5, 218. [Google Scholar] [CrossRef]
- Sung, D.-G.; Lim, S.-H.; Ko, J.-W.; Cho, G.S. Scenic evaluation of landscape for urban design purposes using GIS and ANN. Landsc. Urban Plan. 2001, 56, 75–85. [Google Scholar] [CrossRef]
- Oh, K. LandScape Information Systems: A GIS approach to managing urban development. Landsc. Urban Plan. 2001, 54, 79–89. [Google Scholar] [CrossRef]
- Li, X. Emergence of bottom-up models as a tool for landscape simulation and planning. Landsc. Urban Plan. 2011, 100, 393–395. [Google Scholar] [CrossRef]
- Aguilera, F.; Valenzuela, L.M.; Botequilha-Leitao, A. Landscape metrics in the analysis of urban land use patterns: A case study in a Spanish metropolitan area. Landsc. Urban Plan. 2011, 99, 226–238. [Google Scholar] [CrossRef]
- He, C.; Tian, J.; Shi, P.; Hu, D. Simulation of the spatial stress due to urban expansion on the wetlans in Beijing, China using a GIS-based assessment model. Landsc. Urban Plan. 2011, 101, 269–277. [Google Scholar] [CrossRef]
- Xie, Z.; Liu, J.; Ma, Z.; Duan, X.; Cui, Y. Effect of surrounding land-use change on the wetland landscape pattern of a natural protected area in Tianjin, China. Int. J. Sustain. Dev. World Ecol. 2012, 19, 16–24. [Google Scholar] [CrossRef]
- Carver, S.J. Integrating multi-criteria evaluation with geographical information systems. Int. J. Geogr. Inf. Syst. 1991, 5, 321–339. [Google Scholar] [CrossRef]
- Grabaum, R.; Meyer, B.C. Multicriteria optimization of landscapes using GIS-based functional assessments. Landsc. Urban Plan. 1998, 43, 21–34. [Google Scholar] [CrossRef]
- Dai, F.C.; Lee, C.F.; Zhang, X.H. GIS-based geo-environmental evaluation for urban land-use planning: A case study. Eng. Geol. 2001, 61, 257–271. [Google Scholar] [CrossRef]
- Joerin, F.; Thériault, M.; Musy, A. Using GIS and outranking multicriteria analysis for land-use suitability assessment. Int. J. Geogr. Inf. Sci. 2001, 15, 153–174. [Google Scholar] [CrossRef]
- Silva, E.A.; Clarke, K.C. Calibration of the SLEUTH urban growth model for Lisbon and Porto, Portugal. Comput. Environ. Urban Syst. 2002, 26, 525–552. [Google Scholar] [CrossRef]
- Robu, B.; Macoveanu, M. Strategic environmental assessment for plans, programs, policies in Romania: Multi-Criterial Method. Environ. Eng. Manag. J. 2009, 8, 1451–1456. [Google Scholar]
- Iojă, C.I.; Niţă, M.R.; Vânău, G.O.; Onose, D.A.; Gavrilidis, A.A. Using multi-criteria analysis for the identification of spatial land-use conflicts in the Bucharest Metropolitan Area. Ecol. Indic. 2014, 42, 112–121. [Google Scholar] [CrossRef]
- Kriebel, D.; Tickner, J.; Epstein, P.; Lemons, J.; Levins, R.; Loechler, E.L.; Quinn, M.; Rudel, R.; Schettler, T.; Stoto, M. The precautionary principle in environmental science. Environ. Health Perspect. 2001, 109, 871–876. [Google Scholar] [CrossRef] [PubMed]
- Hewitt, K. Environmental disasters in social context: Toward a preventive and precautionary approach. Nat. Hazards 2013, 66, 3–14. [Google Scholar] [CrossRef]
- Saaty, T.L. The Analytic Hierarchy Process; McGraw-Hill: New York, NY, USA, 1980. [Google Scholar]
- Saaty, T.L.; Vargas, L.G. Models, Methods, Concepts and Applications of the Analytic Hierarchy Process; Springer: Berlin, Germany, 2012. [Google Scholar]
- Saaty, T.L. The Modern Science of Multicriteria Decision Making and Its Practical Applications: The AHP/ANP Approach. Oper. Res. 2013, 61, 1101–1118. [Google Scholar] [CrossRef]
- IUSS Grupo de Trabajo WRB. Base Referencial Mundial del Recurso Suelo. Primera Actualización 2007; Informes Sobre Recursos Mundiales de Suelos No. 103; FAO: Roma, Italy, 2007. [Google Scholar]
- Stellmes, M.; Röder, A.; Udelhoven, T.; Hill, J. Mapping syndromes of land change in Spain with remote sensing time series, demographic and climatic data. Land Use Policy 2013, 30, 685–702. [Google Scholar] [CrossRef]
- Sheelanere, P.; Noble, B.F.; Patrick, R.J. Institutional requirements for watershed cumulative effects assessment and management: Lessons from a Canadian transboundary watershed. Land Use Policy 2013, 30, 67–75. [Google Scholar] [CrossRef]
- Vidal Montes, R.; Martínez-Graña, A.M.; Martínez Catalán, J.R.; Ayarza, P.; Sánchez-San Román, F.J. Vulnerability to groundwater contamination, (SW Salamanca, Spain). J. Maps 2016, 12, 147–155. [Google Scholar] [CrossRef]
- Martínez-Graña, A.M.; Goy, J.L.; Zazo, C. Geomorphological applications for susceptibility mapping of landslides in natural parks. Environ. Eng. Manag. J. 2016, 15, 1–12. [Google Scholar]
- Dewi, S.; Van Noordwijk, M.; Ekadinata, A.; Pfund, J.L. Protected areas within multifunctional landscapes: Squeezing out intermediate land use intensities in the tropics? Land Use Policy 2013, 30, 38–56. [Google Scholar] [CrossRef]
- Martínez-Graña, A.M.; Goy, J.L.; Zazo, C.; Yenes, M. Engineering Geology Maps for Planning and Management of Natural Parks: “Las Batuecas-Sierra de Francia” and “Quilamas” (Central Spanish System, Salamanca, Spain). Geosciences 2013, 3, 46–62. [Google Scholar] [CrossRef]
- Martínez-Graña, A.M.; Silva, P.G.; Goy, J.L.; Elez, J.; Valdés, V.; Zazo, C. Geomorphology applied to landscape analysis for planning and management of natural spaces. Case study: Las Batuecas-S. De Francia and Quilamas natural parks, (Salamanca, Spain). Sci. Total Environ. 2017, 584, 175–188. [Google Scholar] [CrossRef] [PubMed]
- Thiessen, A.H. Precipitation averages for large areas. Mon. Weather Rev. 1911, 39, 1082–1089. [Google Scholar] [CrossRef]
Figure 1.
Localization map of the municipality of Zamora.

Figure 2.
Schematic diagram with the proposed methodology to determinate urban expansion areas.

Figure 3.
Cartography of the physical environment of the municipality of Zamora: (A) Land use map; (B) geological map; (C) edaphological map; (D) hydrological map.
Figure 3.
Cartography of the physical environment of the municipality of Zamora: (A) Land use map; (B) geological map; (C) edaphological map; (D) hydrological map.

Figure 4.
Thematic cartography of the municipality of Zamora: (A) slope map; (B) protected land map; (C) land capability classification map; (D) geotechnical map.
Figure 4.
Thematic cartography of the municipality of Zamora: (A) slope map; (B) protected land map; (C) land capability classification map; (D) geotechnical map.

Figure 5.
Flood risk maps of the city of Zamora: (A) (t = 10); (B) (t = 100); (C) (t = 500); (D) Sectors of the city suburbs with hydrological restrictions.
Figure 5.
Flood risk maps of the city of Zamora: (A) (t = 10); (B) (t = 100); (C) (t = 500); (D) Sectors of the city suburbs with hydrological restrictions.

Figure 6.
Periphery areas of Zamora without/with urbanization restrictions.

Figure 7.
Zamora’s statistics of (A) sectors studied with/without restrictions and (B) restrictive criteria identified.
Figure 7.
Zamora’s statistics of (A) sectors studied with/without restrictions and (B) restrictive criteria identified.

Figure 8.
Thematic cartography of the municipality of Zamora: (A) distance map to the electrical supply; (B) distance map to the sewerage system; (C) road density map; (D) distance map to the city center.
Figure 8.
Thematic cartography of the municipality of Zamora: (A) distance map to the electrical supply; (B) distance map to the sewerage system; (C) road density map; (D) distance map to the city center.

Figure 9.
(A) Calculation of the coefficients to weighting by the Saaty method; (B) raster of the city of Zamora resulting from MCA-2.
Figure 9.
(A) Calculation of the coefficients to weighting by the Saaty method; (B) raster of the city of Zamora resulting from MCA-2.

Figure 10.
Graphic showing the statistics of Zamora’s sectors that satisfy the MCA-2 and those that do not.
Figure 10.
Graphic showing the statistics of Zamora’s sectors that satisfy the MCA-2 and those that do not.

Figure 11.
Cartography of the city of Zamora: (A) periphery sectors with positive evaluation; (B) periphery sectors chosen for the expansion of the city center of Zamora.
Figure 11.
Cartography of the city of Zamora: (A) periphery sectors with positive evaluation; (B) periphery sectors chosen for the expansion of the city center of Zamora.

Figure 12.
Thematic cartography of the selected sectors of Zamora: (A) cadastral parcels proposed for urbanization; (B) visual impact map of the selected parcels; (C) proposed transport network.
Figure 12.
Thematic cartography of the selected sectors of Zamora: (A) cadastral parcels proposed for urbanization; (B) visual impact map of the selected parcels; (C) proposed transport network.

© 2017 by the authors. Licensee MDPI, Basel, Switzerland. This article is an open access article distributed under the terms and conditions of the Creative Commons Attribution (CC BY) license (http://creativecommons.org/licenses/by/4.0/).
Share and Cite
MDPI and ACS Style
Criado, M.; Martínez-Graña, A.; Santos-Francés, F.; Veleda, S.; Zazo, C. Multi-Criteria Analyses of Urban Planning for City Expansion: A Case Study of Zamora, Spain. Sustainability 2017, 9, 1850. https://doi.org/10.3390/su9101850
AMA Style
Criado M, Martínez-Graña A, Santos-Francés F, Veleda S, Zazo C. Multi-Criteria Analyses of Urban Planning for City Expansion: A Case Study of Zamora, Spain. Sustainability. 2017; 9(10):1850. https://doi.org/10.3390/su9101850
Chicago/Turabian StyleCriado, Marco, Antonio Martínez-Graña, Fernando Santos-Francés, Sergio Veleda, and Caridad Zazo. 2017. "Multi-Criteria Analyses of Urban Planning for City Expansion: A Case Study of Zamora, Spain" Sustainability 9, no. 10: 1850. https://doi.org/10.3390/su9101850
Note that from the first issue of 2016, this journal uses article numbers instead of page numbers. See further details here.