Environmental Impact and Nutritional Improvement of Elevated CO2 Treatment: A Case Study of Spinach Production


Department of Industrial Administration, Tokyo University of Science, Noda 278-8510, Japan
*
Author to whom correspondence should be addressed.
Sustainability 2017, 9(10), 1854; https://doi.org/10.3390/su9101854
Submission received: 30 August 2017
/
Revised: 30 September 2017
/
Accepted: 11 October 2017
/
Published: 16 October 2017
(This article belongs to the Special Issue Responsible Value Chains for Sustainability: Practices and Challenges from EcoBalance)
Abstract
:The agriculture sector is known to be the one of the major contributors to global greenhouse gas (GHG) emissions. At the same time, global climate changes have affected the agriculture sector. In order to strengthen the sustainable development of agriculture, it is important to promote environmentally friendly farming and simultaneously increase the economic value. To improve the productivity of agriculture, technical advancements have occurred. Among those, we have focused on CO2 treatment in cultivation. We aimed to clarify the effectiveness of the elevated CO2 treatment of spinach based on GHG emission and the economic value using the eco-efficiency score. We assumed that nutrition could represent the value of the vegetable. We measured weights, vitamin C, and CO2 emissions of elevated CO2 treatment and conventional production. We used life cycle assessment (LCA) to estimate CO2 emissions. CO2 emissions of a 100-g bouquet of spinach were estimated from agricultural inputs, farming, transport, and distribution center processes at a model spinach farm in Japan. CO2 emission of elevated CO2 treatment was 29.0 g-CO2, and was 49.0 g-CO2 for conventional production. The net weight of a bouquet of elevated CO2-treated spinach was 1.69-fold greater than that of conventional production. Vitamin C per 100 g spinach produced via elevated CO2 treatment was 15.1 mg, and that of conventional production was 13.5 mg on average. Finally, based on the above results, we assessed the eco-efficiency scores of the elevated CO2 treatment and conventional production of spinach, enabling integration of the nutritional value and the environmental impact. The score showed that elevated CO2 treatment (0.76) was 2.9-fold more efficient than conventional production (0.26). This study suggested that elevated CO2 treatment could enhance growth and nutritional value of spinach, and further contribute to CO2 reduction.
1. Introduction
Our concerns about global warming have stimulated the development of environmental assessment of agriculture sectors using life cycle assessment (LCA) analysis. LCA has been used since the end of the 1990s to assess the environmental impact of single crop cultivation, and has shifted to various agriculture sectors: animal production, horticulture, organic farming, etc. [1,2,3]. In Europe, it is promoted to certify environmentally-assessed products, and EPD (Environmental Product Declaration) was introduced to reduce the environmental burden of production. EPD is an independently verified and registered document that communicates comparable information about the life-cycle environmental impact of products [4,5]. It contains more than 700 products’ documents.
In order to strengthen the sustainability of agriculture, it is very important to increase both the prevalence of environmentally friendly farming the economic value of the sector. Towards this concern, ISO 14045 determined the eco-efficiency protocol in 2012. Eco-efficiency is meant to support sustainable development. It is a quantitative management tool which enables the consideration of the life cycle environmental impacts of an agricultural system alongside its product system value to a stakeholder [6,7,8]. The value of a vegetable could be enhanced by the production of the product in a manner that enlarges values such as productivity, nutrition, taste, etc. Productivity and nutrition are especially important in Japan under the recent shrinking agriculture sector and changing dietary patterns. Agriculture in Japan has been resistant to change, where small-plot holdings still dominate, the average farmer is over 66 years old, and the sector’s contribution to the economy has fallen by 25 percent since its peak in 1984. To address these factors, technological advances have been introduced to increase the productivity. For example, elevated CO2 treatment—in which CO2 is input higher than ambient (400 ppm)—has been recorded to yield three-to-four-fold production quantity compared to conventional farming. CO2 is a raw material for photosynthesis, and its application to plants has been proven to improve productivity [9,10,11,12,13,14,15]. It has been introduced as a standard technique in protected horticulture, especially in the Netherlands. It is expected that CO2—one of the major greenhouse gases—could become a useful resource in agriculture. In Japan, it has been tested in a few agricultural sectors: tomato, strawberry, rose, etc. [16,17,18]. However, it is not yet broadly applied at farms, but in 1448 ha of protected horticulture facilities, which accounts about 3.1% of the total in 2015 [19].
Regarding the changing dietary habits of Japanese people, we assumed that nutrition could be a value to attract consumers, followed by increasing economic value. The consumption of meat and excessive fats has been expanding, and the dietary eccentricity has advanced rapidly. Poor diet is more prone to disease, infection, fatigue, and poor performance. Hence, health-conscious consumers are driving demand for strains of vegetables with enhanced nutritional qualities. So-called “functional vegetables” in Japan—for example, broccoli containing three times the amount of antidotal and antioxidant elements, carrots containing a balanced content of the antioxidants lycopene and carotene, etc.—command higher prices than ordinary. Farmers are eager to comply with the above value-added vegetables.
Concerned with environmental issues in the agriculture sector, the Ministry of Agriculture, Forestry and Fisheries (MAFF) of Japan formulated a “Competitive Agriculture” policy, promoting the use of renewable energy on farms [20]. It was deemed that agriculture and fishing villages have plentiful abundance of renewable energy resources such as biomass, sunlight, and water. Our interest was the CO2 waste exhausted from some renewable energy plants. We assumed that waste CO2 could be a source of elevated CO2 treatment.
From the above backgrounds, we aimed to prove the effectiveness of elevated CO2 treatment on leafy vegetables in a protected horticulture system, where it was assumed that CO2 would be supplied from the waste of a renewable energy plant. We estimated the eco-efficiency, which was determined per ISO 14045 [21]. We integrated the environmental impact and the nutritional quality. We chose spinach as a model leafy vegetable. First, we performed a growth experiment of spinach under different CO2 concentrations: elevated CO2 treatment (eCO2 system) and conventional production (Conv system). We measured the weights and vitamin C contents of those two systems, respectively. Secondly, we conducted LCA analysis to estimate CO2 emissions of those systems, respectively. Finally, we calculated eco-efficiency score using vitamin C contents and CO2 emissions. The scores of those systems were compared.
2. Materials and Method
2.1. Incubator-Scale Cultivation of Spinacia oleracea
We performed the growth experiment using Spinacia oleracea as model leafy vegetable. Germinated Spinacia oleracea pots were moved into a plant incubator (Biotorn, NKsystem Co., Ltd. Tokyo, Japan) which is able to automatically control the environment of the plant. It can control the temperature, moisture, and lighting. We prepared the two different CO2 concentration systems: ambient conventional system (Conv system, 400 ppm), and elevated CO2 treatment (eCO2 system, 1000 ppm). We cultivated each system three times including four samples, respectively. They were produced for 20 days. CO2 was continuously flowed in. Incubator was set to 16 h lighting time, 22 °C temperature, 50% humidity, and 60% illumination (Table 1). Culture soil was mildly acidic with 170 mg/L nitrogen (N), 140 mg/L phosphorous (P), and 120 mg/L potassium (K). These conditions were kept throughout the growth experiment.
2.2. Measurement of Weight and Vitamin C
A bouquet of spinach was washed and weighted using an electronic balance (A&D Co., Ltd., Tokyo, Japan) after 20 days of cultivation. Vitamin C was measured according to the manufacturer’s procedure using a vitamin C assay kit (Shima Laboratories Co., Ltd., Tokyo, Japan). Briefly, we used a standard solution of ascorbic acid to clarify a calibration curve, showing the relationship between absorbance and vitamin C concentration due to the difference in dilution ratio. Additionally, 100 g of edible portion of spinach was homogenized with a five-fold amount of a 5.4% metaphosphoric acid aqueous solution, and centrifuged at 15,000 rpm, 10 min, 4 °C. Supernatant was measured using a spectrophotometer. The measurement was performed three times for each system. Vitamin C concentration was calculated using a calibration curve.
2.3. Life Cycle Assessment (LCA)
LCA in this study was conducted by inventory analysis. CO2 emissions of the Conv system were calculated at the model protected horticulture system of spinach in Asakura City, Fukuoka prefecture. The model farm ranged 3 a in area and produced 720 kg spinach for 24 days.
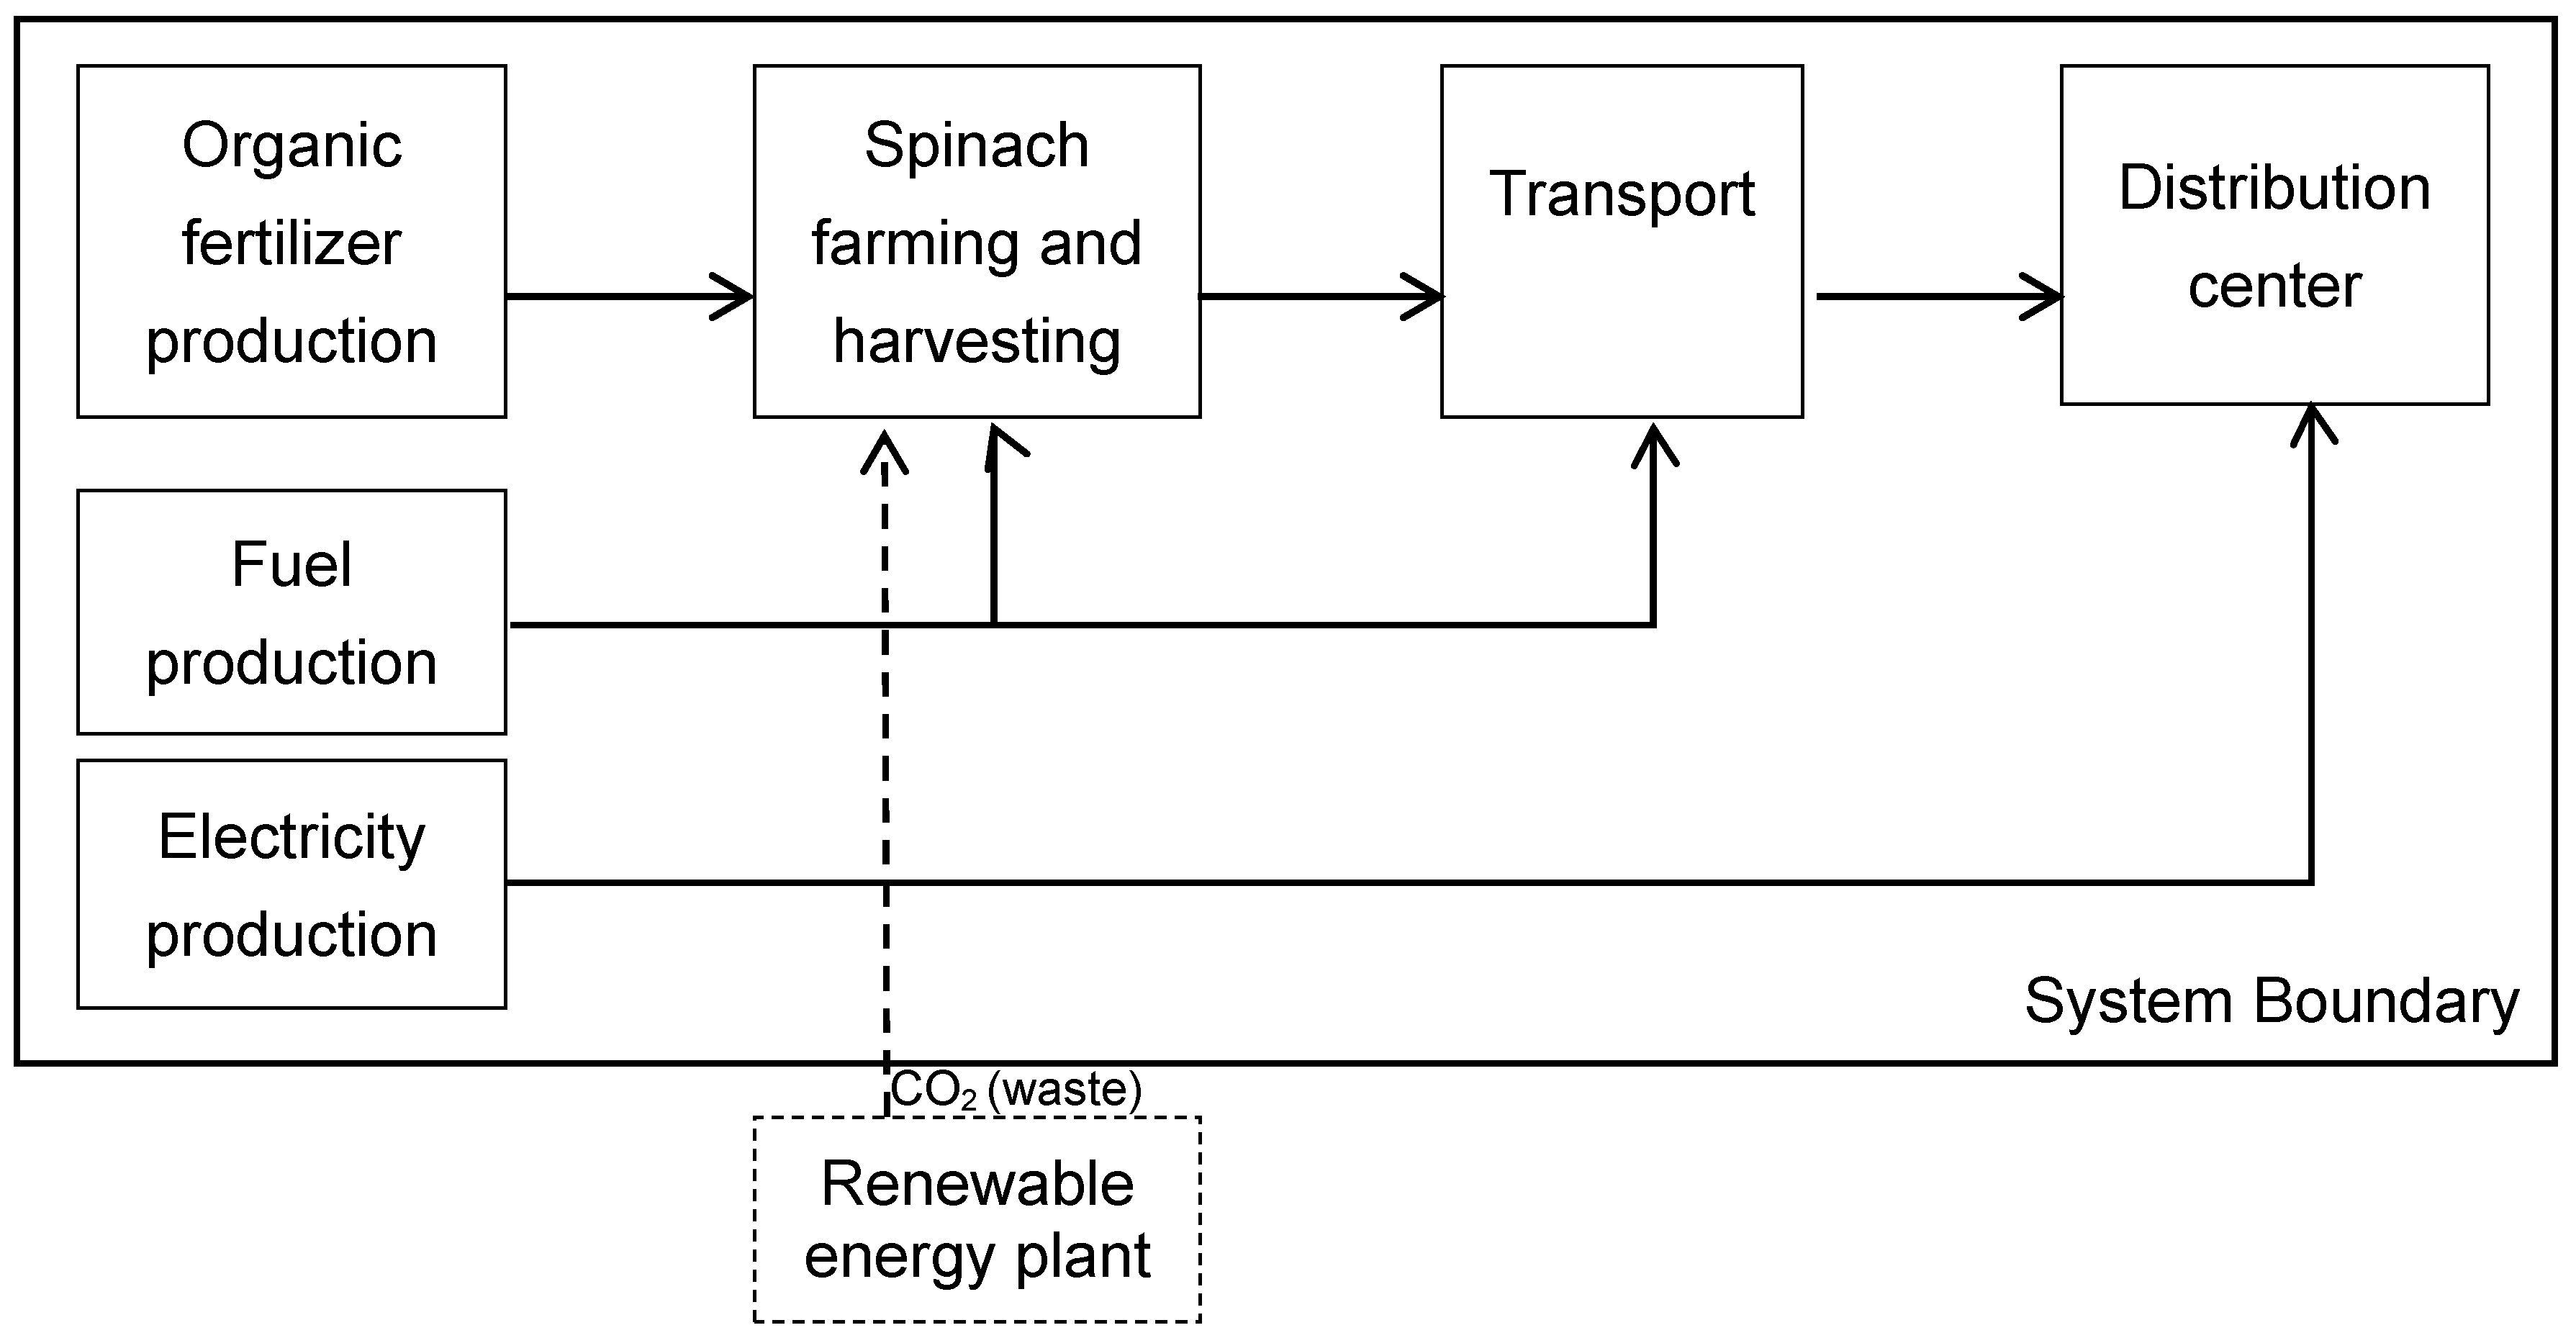
The functional unit was 100 g of harvested spinach. The system boundary of the Conv system includes agricultural inputs, farming, transport, and distribution center processes, as shown in Figure 1. That of the eCO2 system includes the same as the Conv system and CO2 production. However, CO2 emissions of CO2 production were ignored in this study, because we set that CO2 was supplied from the waste CO2 of renewable energy plants.
Inventory data were acquired by interviewing the farm, and unavailable data such as transport to the central wholesale market, fuel input during farming, and electricity use at distribution center were collected from previous reports [22,23,24,25,26] (Table 2). CO2 emissions per 100 g of harvested spinach were calculated by multiplying inventories by CO2 emission intensity units, as shown in Table 1. CO2 emission intensity units were adapted from a government report [26]. For organic fertilizer and fuel use at the farm, CO2 emissions per 10 a were converted to those per 100 g-spinach, by dividing those by the area and the production of the model farm. Fuel was used in agricultural machines. For transport, CO2 emissions for a one-way trip were calculated using fuel-efficiency, 10.3 km/L, and average speed, 30.2 km/h [22,23]. Transport occurred 24 times. For the distribution center, CO2 emissions per day was converted to 24 days. Residence time in the distribution center varied, and we assumed one day on average.
CO2 emissions of the eCO2 system was estimated by dividing the CO2 emissions of the Conv system by the spinach weight ratio of eCO2 system. Weight ratio was calculated by dividing the average weight of the eCO2 system by that of the Conv system, which was measured as 2.2.
2.4. Eco-Efficiency Score
The eco-efficiency score was calculated by dividing vitamin C content by CO2 emissions, which were measured in Section 2.1 and Section 2.3, respectively. We assumed that nutritional quality would represent the value of vegetable, which would possibly enhance the economic value. Among nutrients, vitamin C was chosen due to its high content in spinach and the result of questionnaire survey [27,28].
3. Results
The effectiveness of the elevated CO2 treatment in improving the growth, nutritional quality, and environmental impact has been clarified. We compared weight, vitamin C content, and CO2 emissions of the Conv system (400 ppm CO2) to the eCO2 system (1000 ppm CO2). Additionally, the eco-efficiency score, integrating nutritional value and environmental impact, was compared between the two systems.
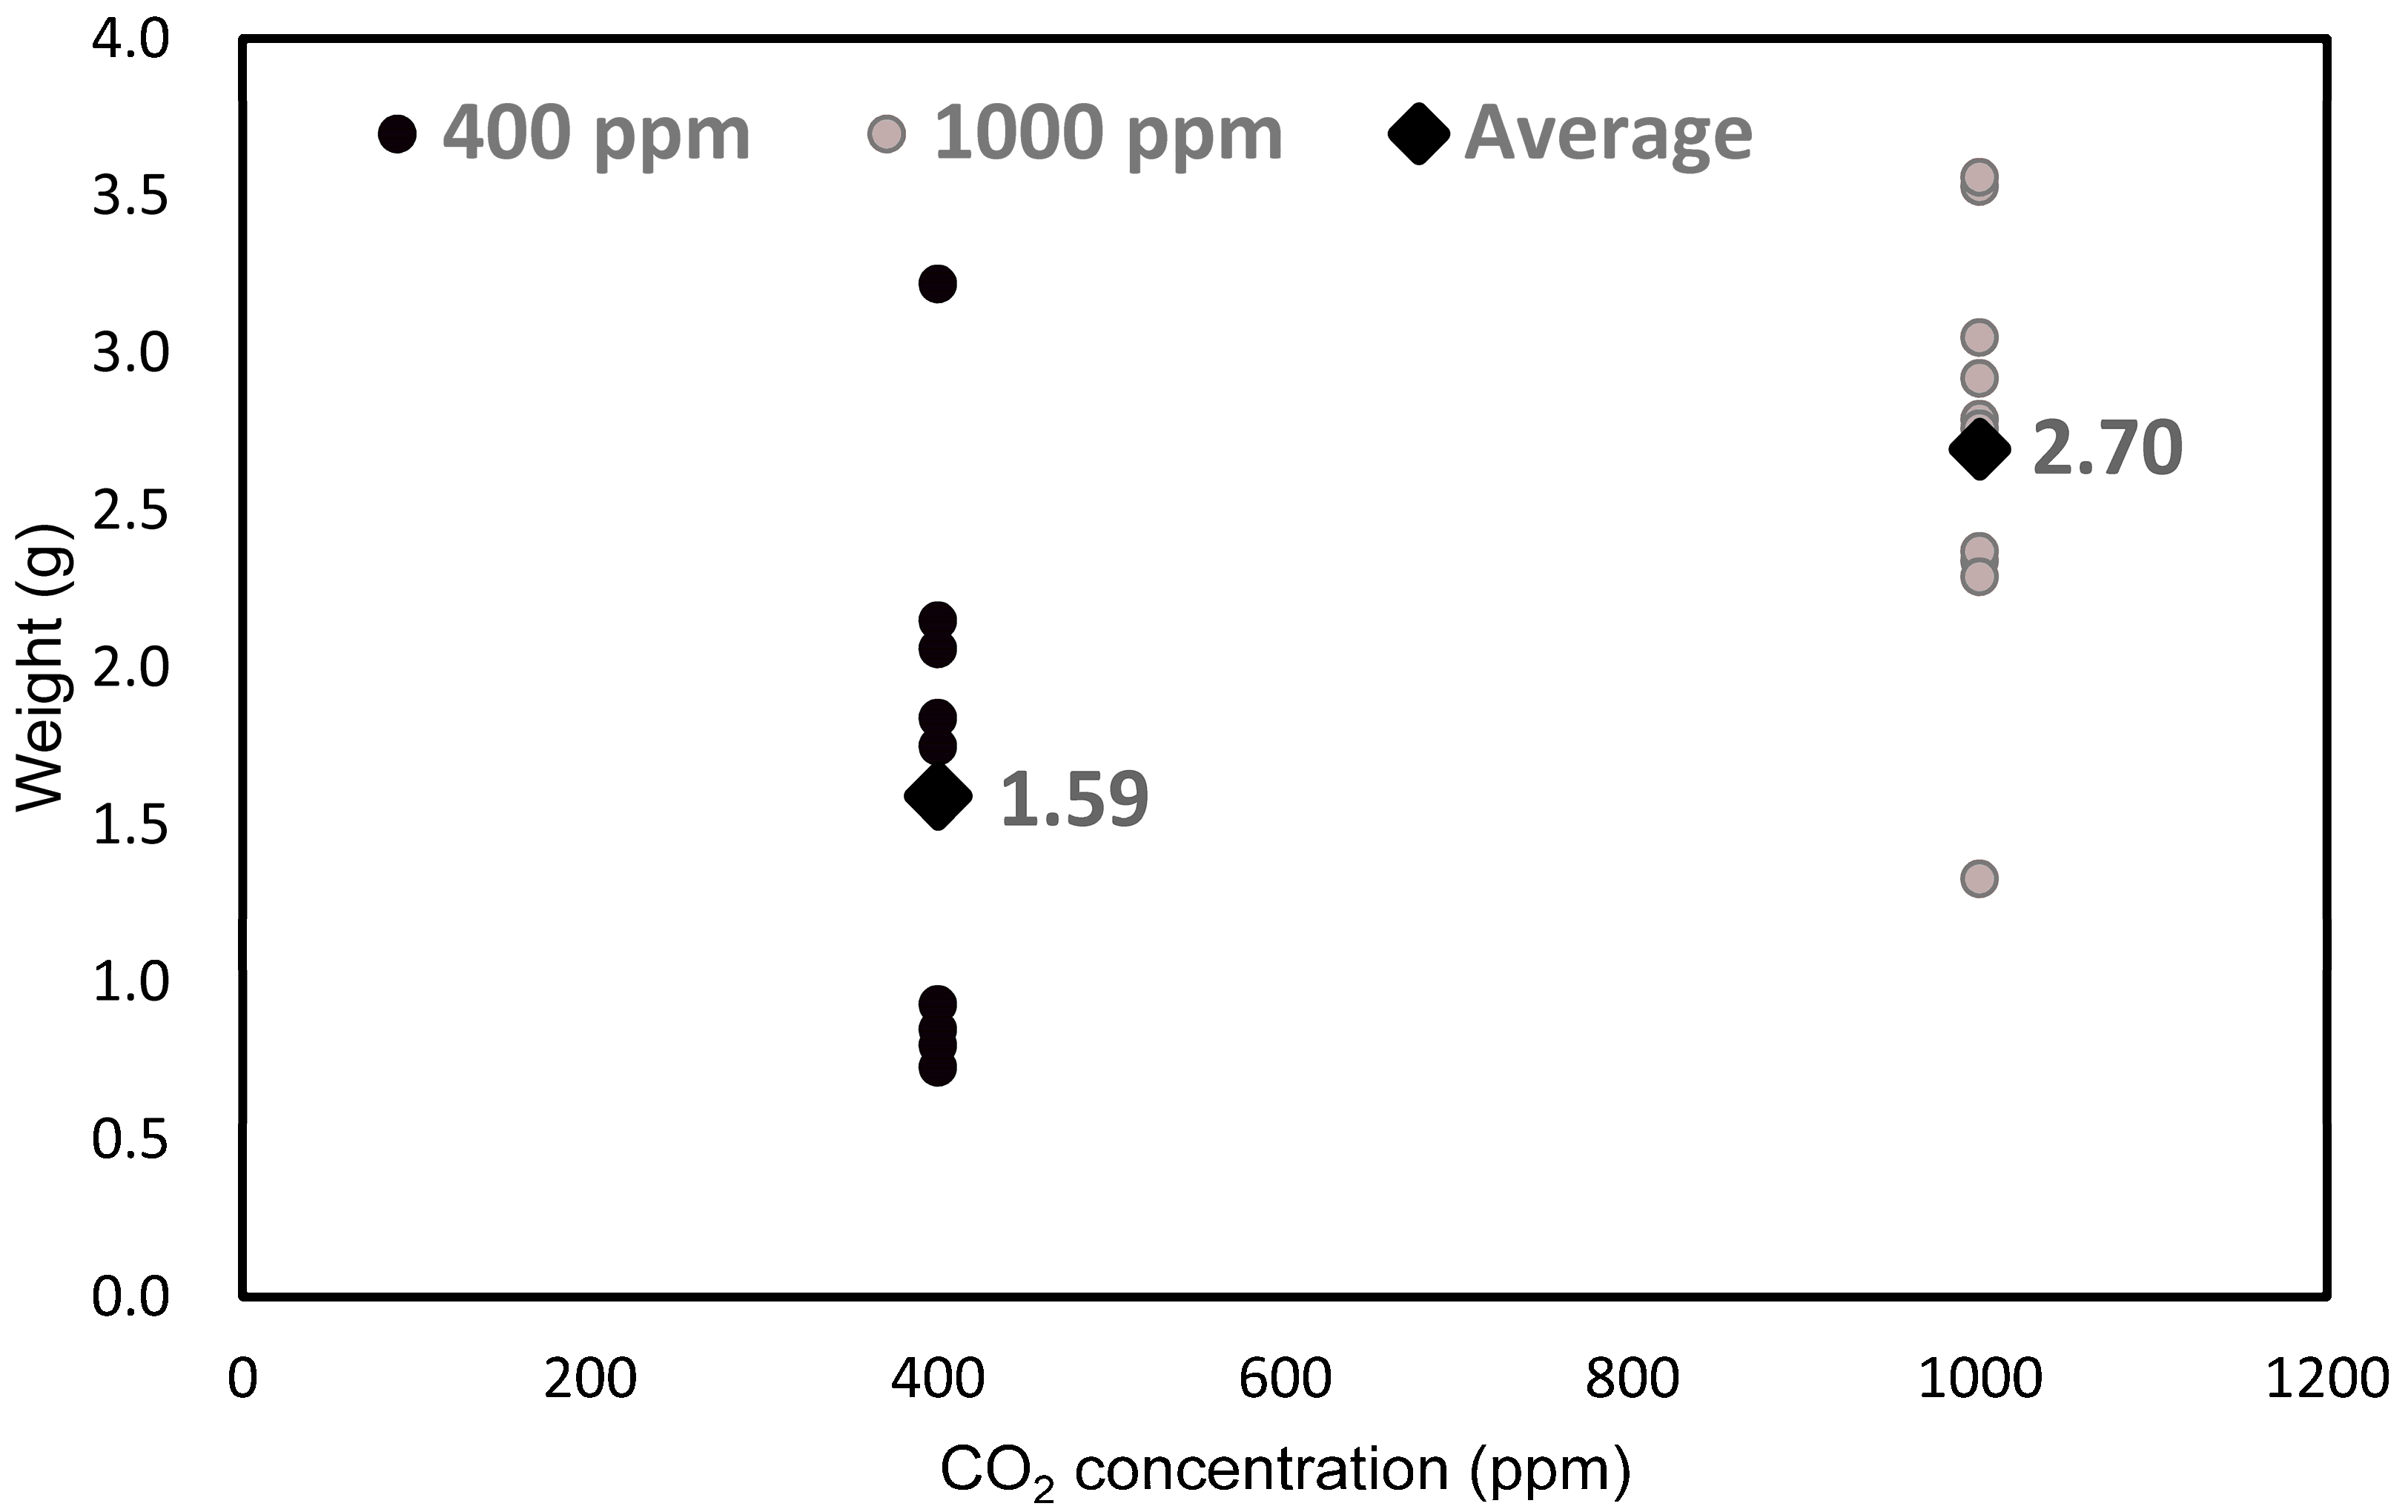
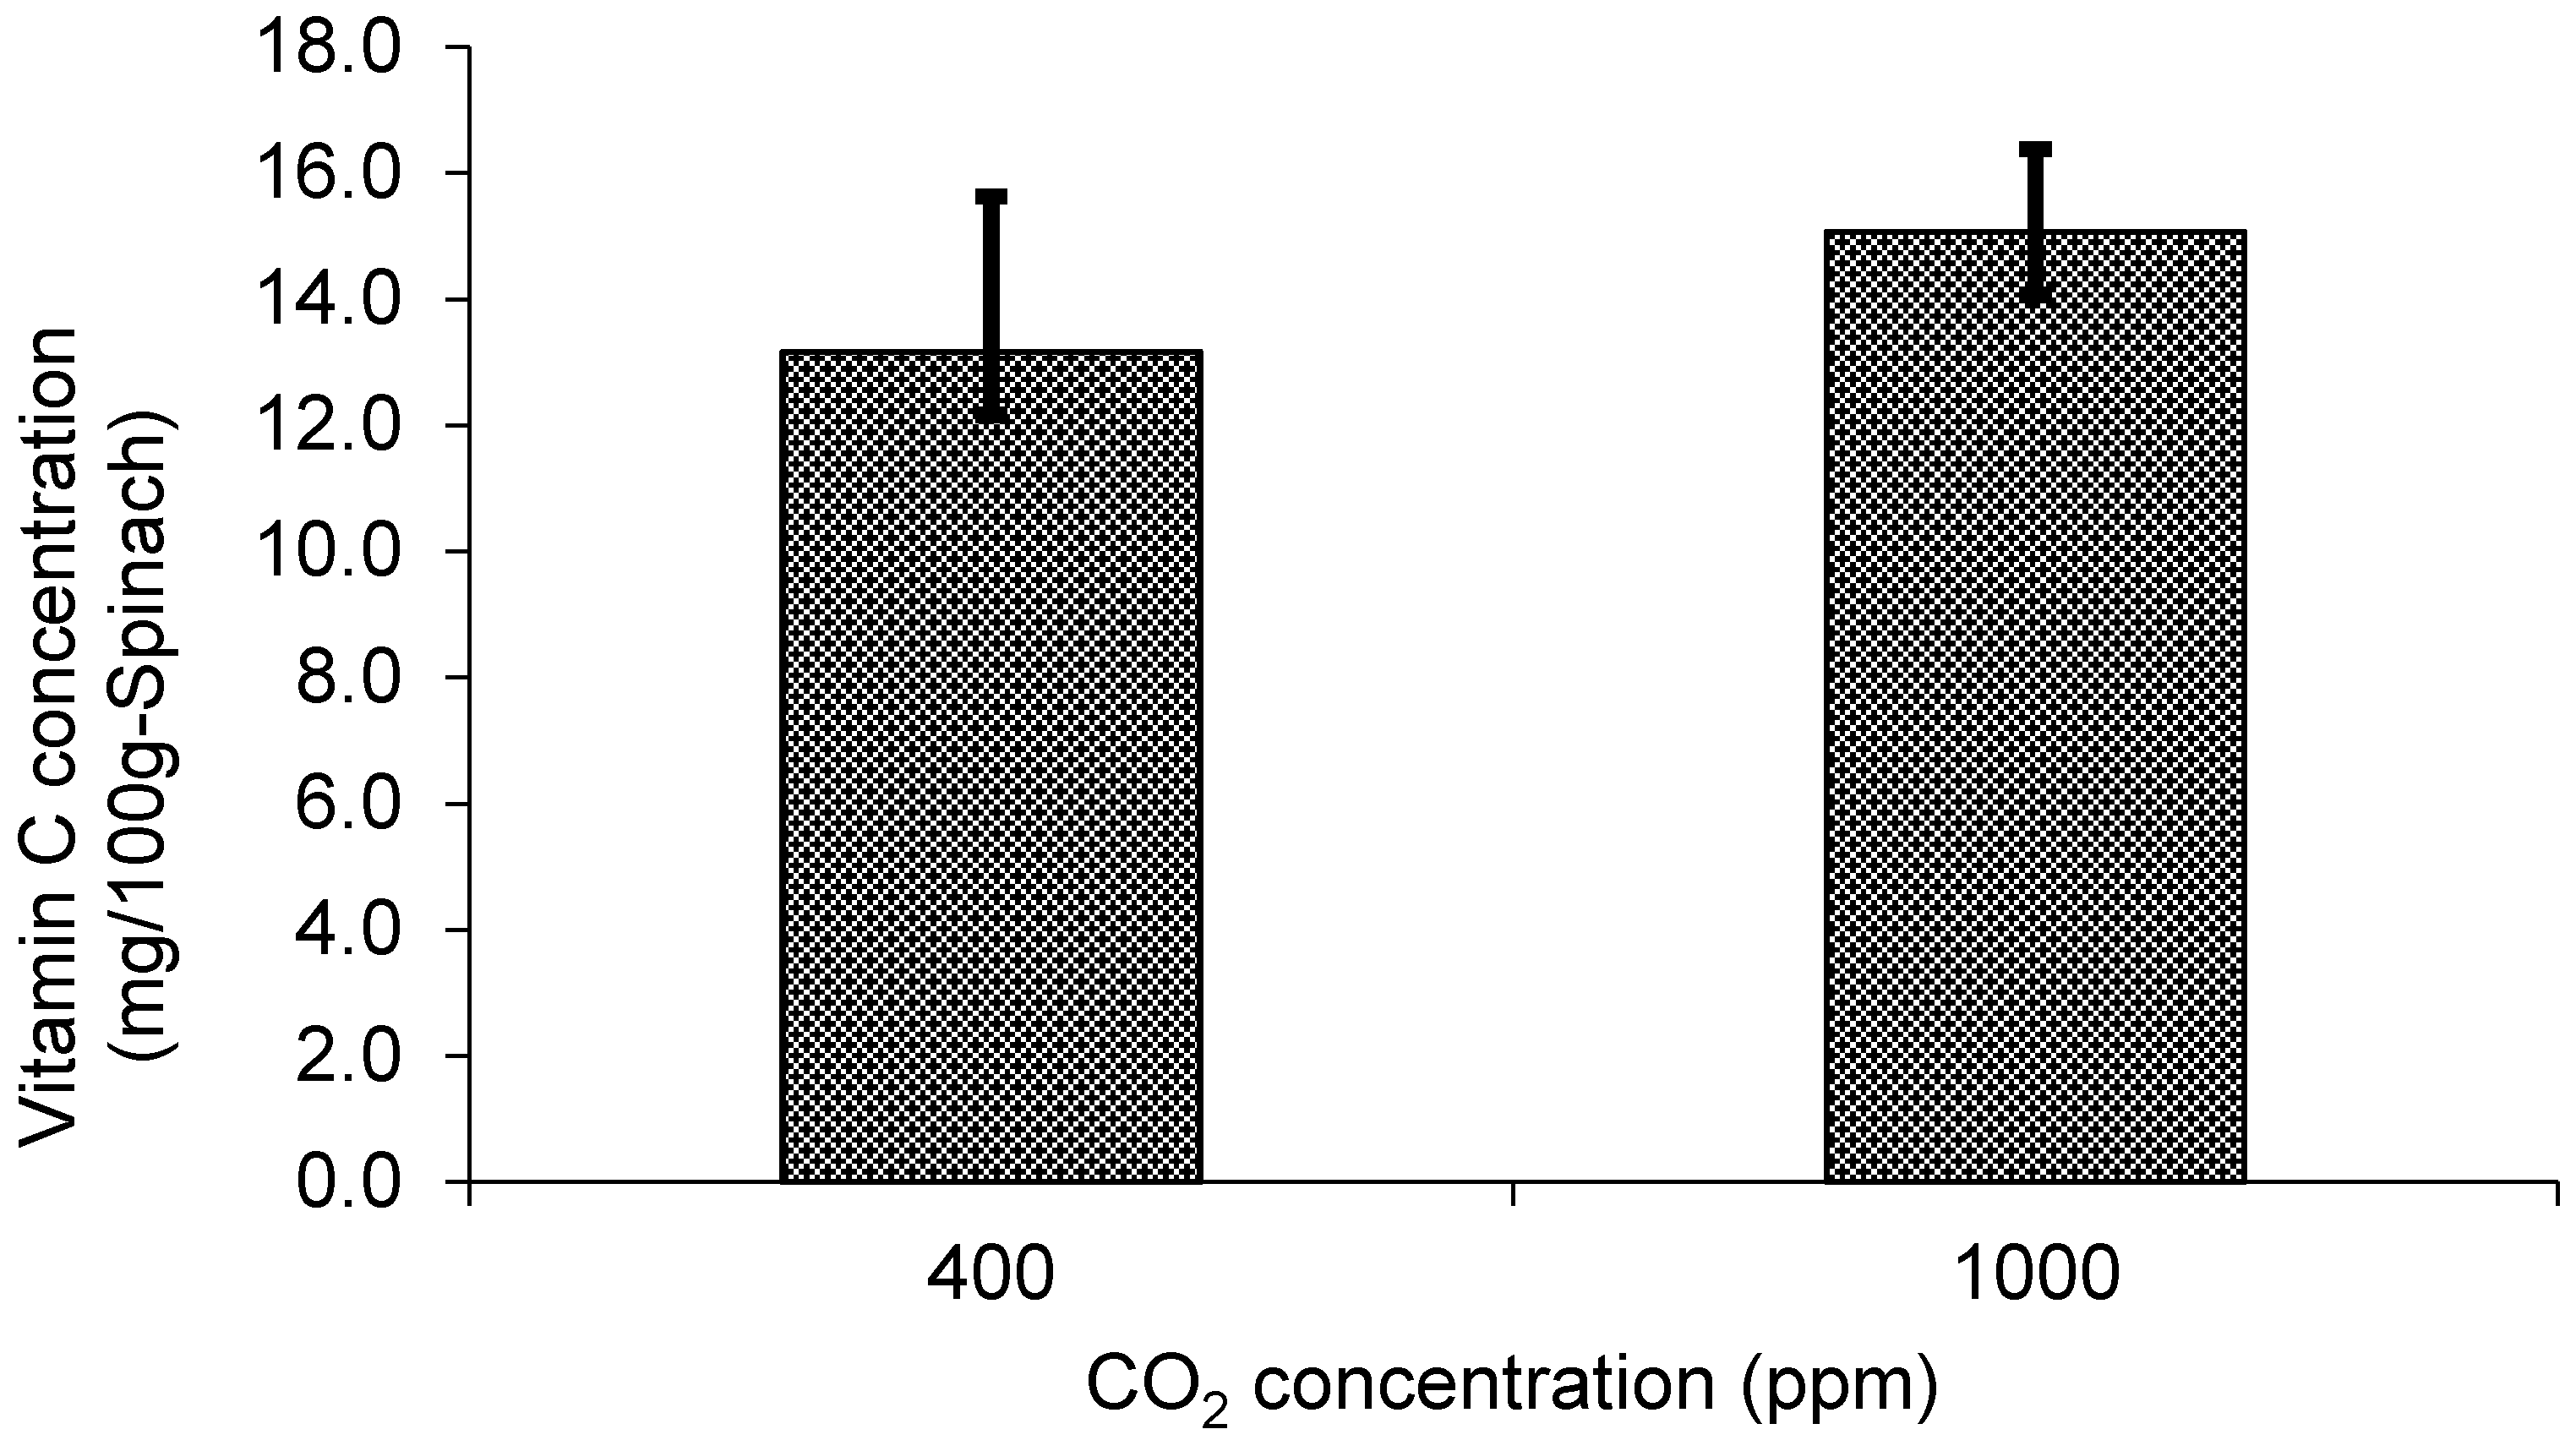
Figure 2 shows spinach weights at 20 days of growth under different CO2 treatments. Weights were measured per bouquet of spinach. The averages of the Conv system and the eCO2 system were 1.59 g and 2.70 g, respectively, showing 1.69 times higher weight in the eCO2 system. t-test proved that there was a significant difference between the treatments (p = 0.005). Vitamin C concentration was estimated by the absorbance of a spectrophotometer, followed by calculation using a calibration curve (Figure 3). The average concentration of the Conv system was 13.2 mg/100 g spinach (standard deviation 4.27), and it was 15.1 mg/100 g in the eCO2 system (standard deviation 2.27).
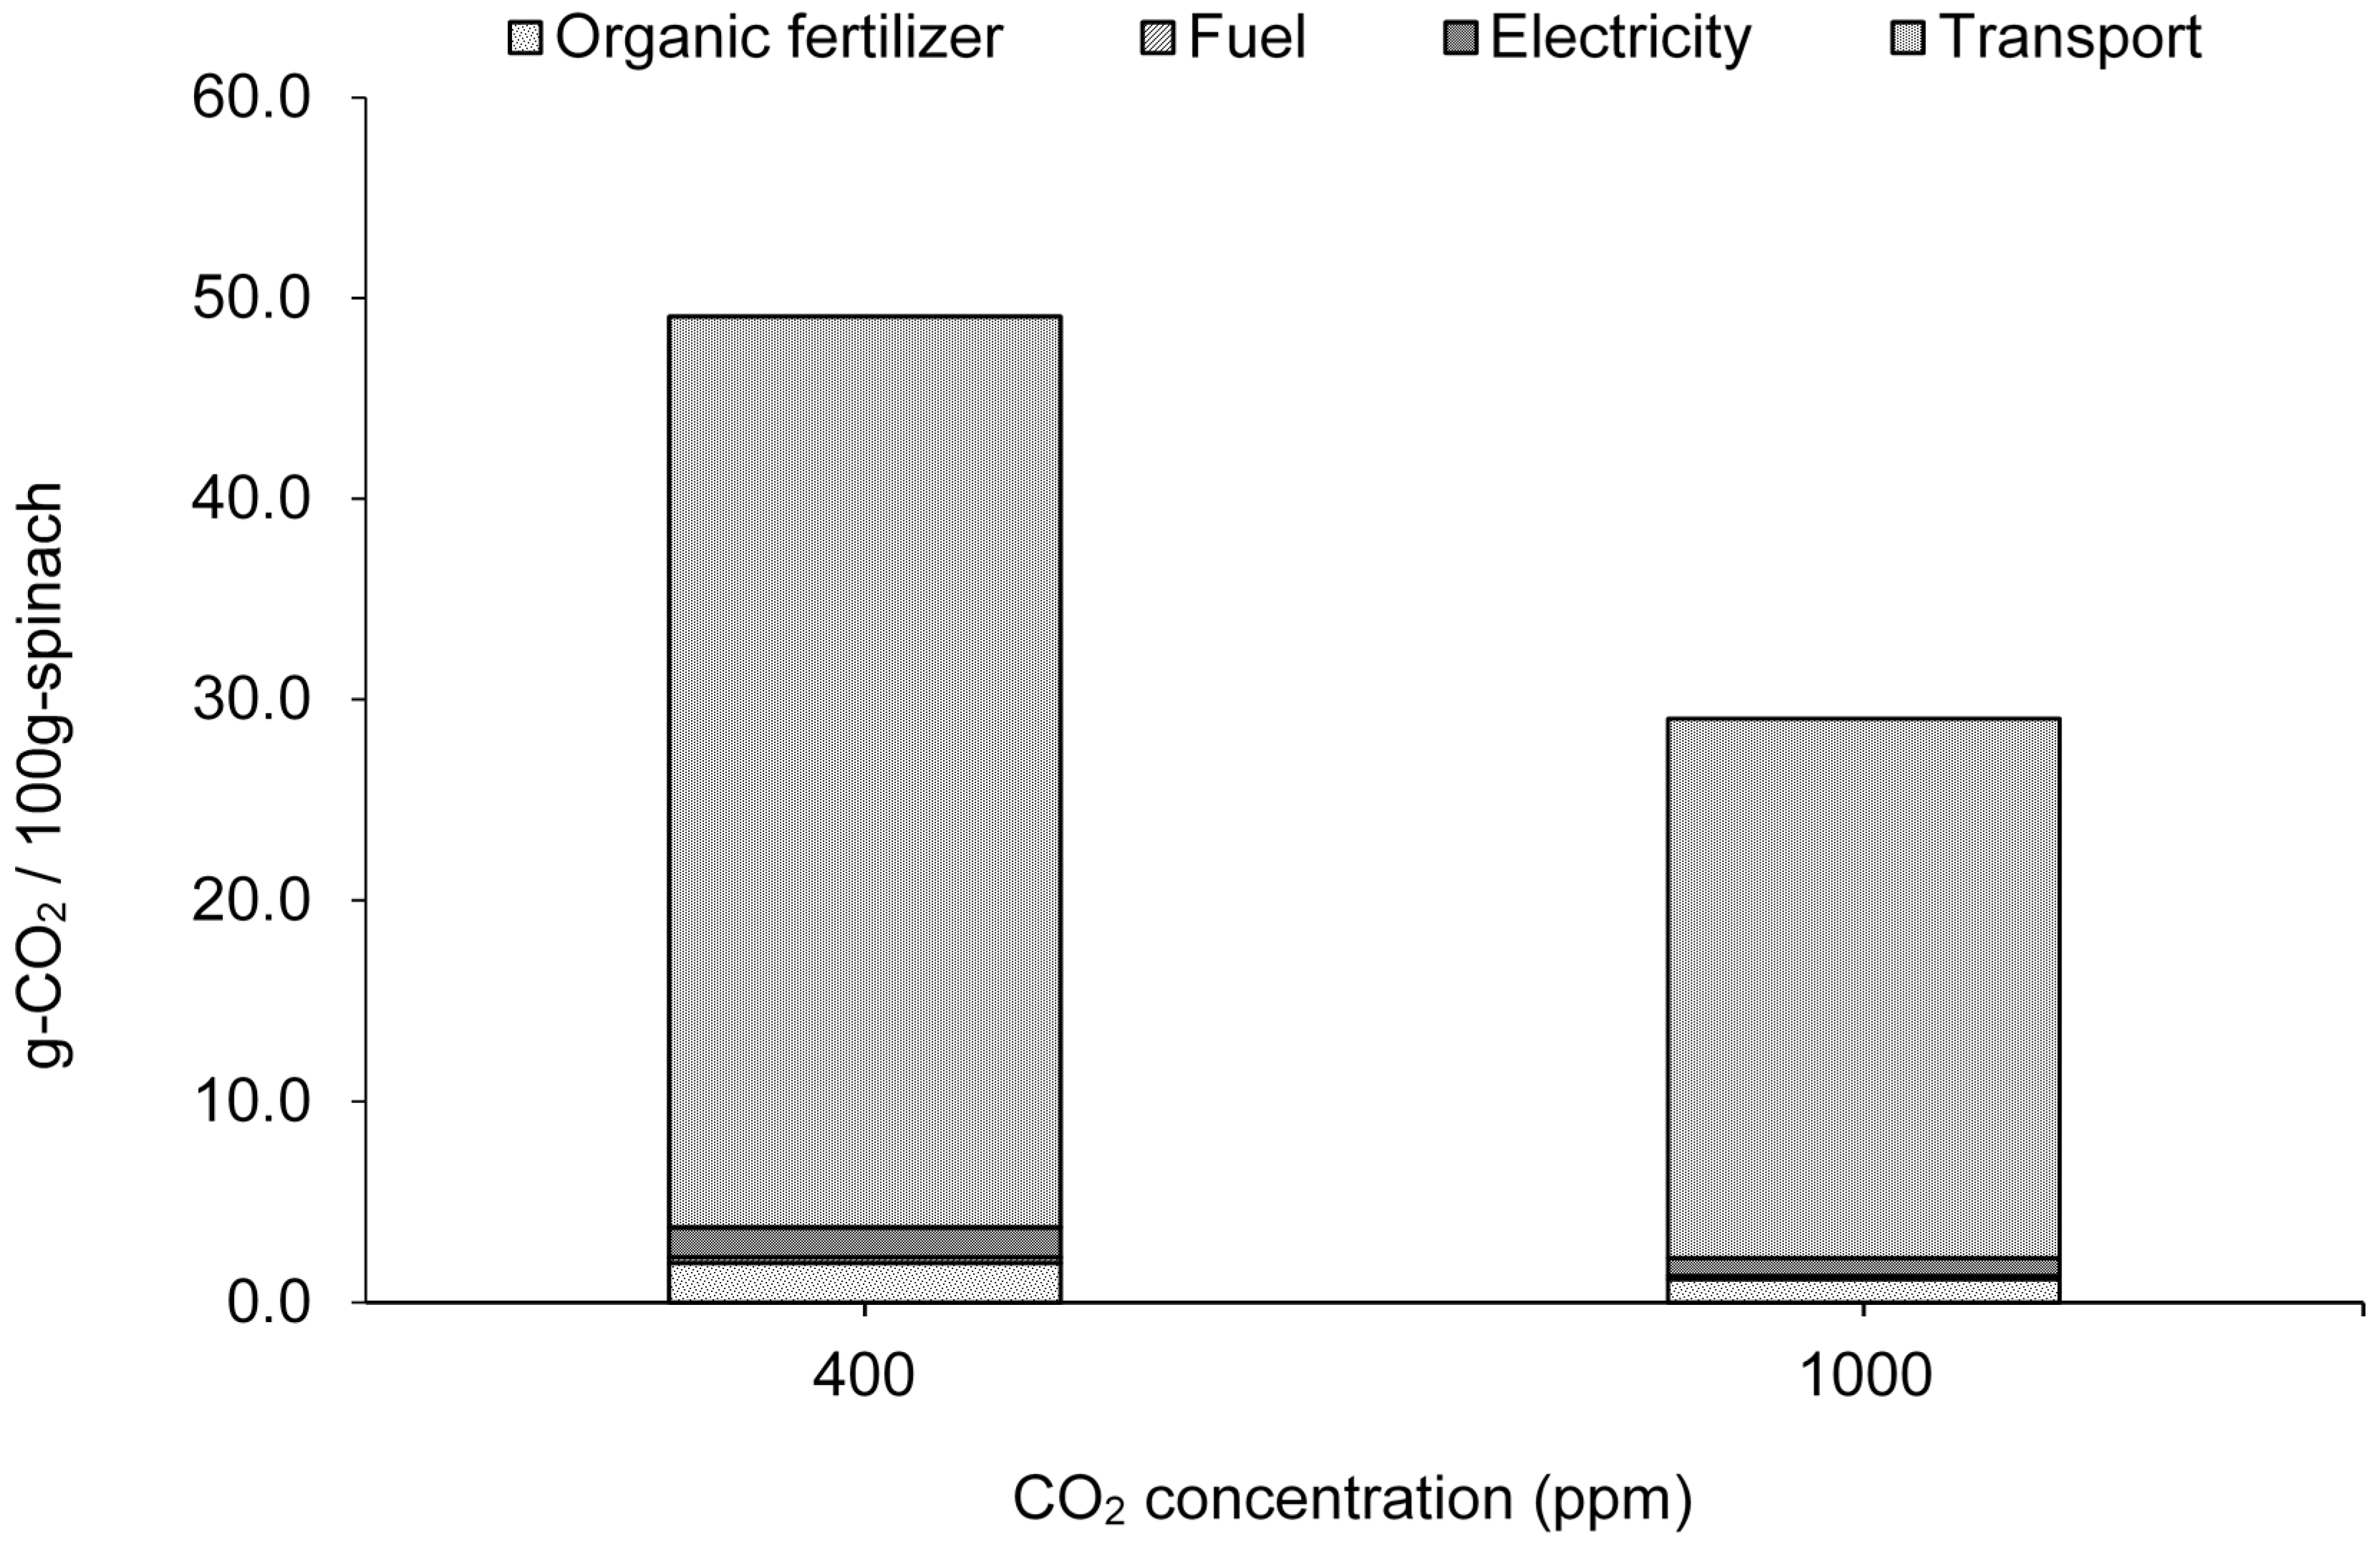
CO2 emissions were estimated by the inventory calculation result of the Conv system, the model spinach farm (Figure 4). Emissions of 49.0 g-CO2/100 g-spinach of Conv system and 29.0 g-CO2/100 g-spinach of eCO2 system were obtained. The CO2 emissions of the Conv system were 1.69-fold greater than the eCO2 system. Closely looking into the Conv system, 2 g-CO2/100 g-spinach for organic fertilizer, 0.3 g-CO2/100 g-spinach for fuel, 1.5 g-CO2/100 g-spinach for distribution center, and 45.3 g-CO2/100 g-spinach for transport were shown to be emitted. CO2 emission during transport of spinach from the farm to the central wholesale market accounted for about 90% of the total. The reason for this is that the model farmer conducted organic farming, and they are doing pesticide-free cultivation. Agricultural chemicals are known as one of hot spots of CO2 emission during cultivation [29,30].
The eco-efficiency of the eCO2 system was scored as 0.76, and that of the Conv system was 0.26. This demonstrates that the eCO2 system was 2.9-fold more efficient than the Conv system.
4. Discussion
Elevated CO2 treatment could improve the growth and environmental impact for spinach production in a protected horticulture system by using waste CO2 from other systems as a source. It was found that the weight of elevated CO2 treatment for 20 days was 1.69-fold greater than ambient CO2 system. Additionally, vitamin C was relatively higher in the elevated CO2-treated spinach, showing 14% higher than conventional production. A previous report showed similar results to this study, which compared weights and vitamin C between elevated CO2 treatment (900 ppm) and conventional production (350 ppm). It indicated 1.65-fold heavier bouquets and 1.08-fold more vitamin C for the elevated CO2 treatment [29]. This tendency was also reported in other vegetables. They investigated the physiological effect of elevated CO2 treatment on vegetables, although it differed according to species [31,32,33,34]. Ripening tomatoes and bananas showed a respiratory reduction with high CO2 treatment [35]. Eggplants, cucumbers, podded peas, spinach, and lettuce showed C2H4 production and respiration increase by high CO2 [32]. Especially, plants of C3, to which spinach (Spinacea oleracea) belongs, showed relatively high photosynthetic rate under elevated CO2 [13,35]. These physiological enhancements due to elevated CO2 could possibly induce the growth and high concentration of vitamin C as shown in this study. It is expected that productivity will be improved by developing new control methods and species in the future [36,37,38].
Elevated CO2 treatment facilities often adopt natural gas to produce CO2 or use CO2 exhausted from other industries. In order to further abate the environmental burden of elevated CO2 treatment, the source of CO2 is important. Combined heat and power (CHP) systems use natural gas as a fuel, generate electricity with a gas engine, and use exhaust heat and exhaust gas, CO2. The electricity produced at the facility is mainly used for supplementary lighting, heat is applied to heating, and CO2 is applied to the facility to promote growth [38]. Another example is the use of CO2 from composting facilities. Nakano et al. showed that about 1000 ppm of CO2 was exhausted every hour during composing tomato farm waste [39].
We would propose to use waste CO2 from renewable energy plants. It was suggested that environmental impact could be reduced by elevated CO2 treatment due to the growth increase, assuming that CO2 emission to produce waste CO2 could be ignored. It is recommended to combine a protected horticulture system with the Blue Tower process [40,41]. The Blue Tower process is a renewable energy production systems which uses biomass, and its main product is hydrogen. Nagaishi et al. estimated the CO2 emissions of the Blue Tower process in consideration of CO2 fertilization [42]. Results showed CO2 emission was reduced as 36.37 g-CO2/MJ. It was suggested that the use of CO2 in vegetable production could reduce the total CO2 emissions of a biomass hydrogen plant. However, the cost often hampers the use of waste CO2 from other systems. For example, some regions in the Netherlands are using CO2 from the oil industry, but this is not widespread due to the high cost—it costs more than natural gas [38]. In order to promote the use of waste CO2 from renewable energy plants in protected horticulture systems, it is necessary to investigate the cost of installing and operating the plants.
Toward the sustainable development of agriculture, it is important to increase the value of vegetables while reducing environmental impact. We focused on nutrition to evaluate the value of vegetables in this study. We assumed that enhanced nutritional quality could trigger an increase in economic value. We chose to study nutritional quality as it related to CO2 emissions. We assumed that nutrition should be an important factor, which is comparable to economic value. We assessed the eco-efficiency score, integrating nutritional value, vitamin C content, and environmental impact (CO2 emission). Results showed that elevated CO2 treatment was 2.9-fold more efficient than conventional production. It was deemed that elevated CO2 treatment could be an effective production system to enhance the vegetable nutritional quality and reduce environmental burden. However, there are still challenges. The growth and vitamin C increase should be verified at the field scale, because the growth experiment in this study was performed at the laboratory scale using a plant incubator. By integrating nutritional quality and environmental burden, eco-efficiency could be a useful environmental communication tool. It is expected that it should give incentives to producers and customers to raise the environmental awareness, and further produce value-added vegetables.
5. Conclusions
It is suggested that elevated CO2 treatment could promote the growth and nutritional quality of spinach. Further, it could contribute to CO2 abatement in the agriculture sector due to the use of waste CO2 and enhanced growth. The eco-efficiency score indicated that elevated CO2 treatment of spinach could increase nutritional quality while reducing environmental burden. We believe that eco-efficiency, integrating nutrition and environmental impact, could be useful to give incentive to customers and farmers, raising environmental awareness for customers and inspiring farmers to produce value-added vegetables. This study offers important preliminary data to further strengthen the long-term sustainability of the agriculture sector, integrating environmental impact and the nutritional quality of vegetables.
Author Contributions
Yuna Seo designed the study, and wrote the initial draft of the manuscript. Keisuke Ide, Nobutaka Kitahata, Kazuyuki Kuchitsu and Kiyoshi Dowaki contributed to analysis and interpretation of data, and assisted in the preparation of the manuscript. All other authors have contributed to data collection and interpretation, and critically reviewed the manuscript. All authors approved the final version of the manuscript, and agree to be accountable for all aspects of the work in ensuring that questions related to the accuracy or integrity of any part of the work are appropriately investigated and resolved.
Conflicts of Interest
The authors have no conflicts of interest directly relevant to the content of this article.
References
- Notarnicola, B.; Salomone, R.; Petti, L.; Renzulli, P.A.; Roma, R.; Cerutti, A.K. Life cycle assessment in the agri-food sector. In Life Cycle Assessment in the Agri-food Sector: System Studies, Methodological Issues and Best Practices; Springer: New York, NY, USA, 2015; pp. 10–68. [Google Scholar]
- Dalgaard, R.; Schmidt, J.; Halberg, N.; Christensen, P.; Thrane, M.; Pengue, W.A. LCA of soybean meal. Int. J. Life Cycle Assess. 2008, 13, 240. [Google Scholar] [CrossRef]
- De Backer, E.; Aertsens, J.; Vergucht, S.; Steurbaut, W. Assessing the ecological soundness of organic and conventional agriculture by means of life cycle assessment (LCA) A system study of leek production. Br. Food J. 2009, 111, 1028–1061. [Google Scholar] [CrossRef] [Green Version]
- Hunsager, E.A.; Bach, M.; Breuer, L. An institutional analysis of EPD programs and a global PCR registry. Int. J. Life Cycle Assess. 2014, 19, 786–795. [Google Scholar] [CrossRef]
- Bergman, R.; Taylor, A. EPD-Environmental Product Declarations for Wood Products—An Application of Life Cycle Information about Forest Products. For. Prod. J. 2011, 61, 192–201. [Google Scholar] [CrossRef]
- Pelletier, N.; Arsenault, N.; Tyedmers, P. Scenario modeling potential eco-efficiency gains from a transition to organic agriculture: Life cycle perspectives on Canadian canola, corn, soy, and wheat production. Environ. Manag. 2008, 42, 989–1001. [Google Scholar] [CrossRef] [PubMed]
- Basset-Mens, C.; Ledgard, S.; Boyes, M. Eco-efficiency of intensification scenarios for milk production in New Zealand. Ecol. Econ. 2009, 68, 1615–1625. [Google Scholar] [CrossRef]
- Keating, B.A.; Carberry, P.S.; Bindraban, P.S.; Asseng, S.; Meinke, H.; Dixon, J. Eco-efficient agriculture: Concepts, challenges, and opportunities. Crop Sci. 2010, 50 (Suppl. 1), S-109–S-119. [Google Scholar] [CrossRef]
- Ministry of Agriculture, Forestry and Fisheries (MAFF), Changing Horticulture, August 2017. Available online: http://www.maff.go.jp/j/seisan/ryutu/engei/sisetsu/pdf/jyousei_all.pdf (accessed on 15 September 2017).
- Reich, P.B.; Knops, J.; Tilman, D.; Craine, J. Plant diversity enhances ecosystem responses to elevated CO2 and nitrogen deposition. Nature 2001, 410, 809. [Google Scholar] [CrossRef] [PubMed]
- Tissue, D.T.; Thomas, R.B.; Strain, B.R. Long-term effects of elevated CO2 and nutrients on photosynthesis and rubisco in loblolly pine seedlings. Plant Cell Environ. 1993, 16, 859–865. [Google Scholar] [CrossRef]
- Arp, W.J. Effects of source-sink relations on photosynthetic acclimation to elevated CO2. Plant Cell Environ. 1991, 14, 869–875. [Google Scholar] [CrossRef]
- Sage, R.F.; Sharkey, T.D.; Seemann, J.R. Acclimation of photosynthesis to elevated CO2 in five C3 species. Plant Physiol. 1989, 89, 590–596. [Google Scholar] [CrossRef] [PubMed]
- Bowes, G. Growth at elevated CO2: Photosynthetic responses mediated through Rubisco. Plant Cell Environ. 1991, 14, 795–806. [Google Scholar] [CrossRef]
- Poorter, H. Interspecific variation in the growth response of plants to an elevated ambient CO2 concentration. In CO2 and Biosphere; Springer: Houten, The Netherlands, 1993; pp. 77–98. [Google Scholar]
- Osuga, T. Carbon dioxide control. In Protected Horticulture Handbook; Japan Greenhouse Horticulture Association: Tokyo, Japan, 2003; pp. 170–181. [Google Scholar]
- Ibaraki Prefectural Agricultural Research Center. Effect of Carbon Dioxide Application on Low Concentration Control in Tomato Cultivation in Winter. 2010. Available online: https://www.pref.ibaraki.jp/nourinsuisan/enken/seika/yasai/tomato/documents/s2223.pdf (accessed on 21 August 2017).
- Aichi Prefecture Agricultural Comprehensive Experiment Station. CO2 Application Technology of Rose Cultivation by Environment Control; New Technology of Agriculture: Aichi, Japan, 2015; p. 107. [Google Scholar]
- Zen-Noh. Effectiveness of Carbon Dioxide Application in Facility Gardening; Green Report; Zen-Noh: Tokyo, Japan, 2016; p. 568. [Google Scholar]
- Ministry of Agriculture, Forestry and Fisheries (MAFF). Outline of New Policy toward Realization of Offensive Agriculture, Forestry and Fishery Industry: 2nd ed. 2008. Available online: http://www.maff.go.jp/j/pr/annual/pdf/semep_kaitei2.pdf (accessed on 11 August 2017).
- Klöpffer, W. The critical review of life cycle assessment studies according to ISO 14040 and 14044. Int. J. Life Cycle Assess. 2012, 17, 1087–1093. [Google Scholar] [CrossRef]
- Ministry of Economy, Trade and Industry (METI) Guidelines for Calculating CO2 Emissions in the Field of Logistics. 2007. Available online: http://www.greenpartnership.jp/pdf/CO2/CO2brochure.pdf (accessed on 8 January 2016).
- Ministry of Land, Infrastructure, Transport and Tourism (MLIT) Road-Traffic Census—General Traffic Calculation Result Summary Table. 2010. Available online: http://www.mlit.go.jp/road/census/h22–1/ (accessed on 8 January 2016).
- Nishizono, H.; Motegi, Y. Study of environment evaluation by LCA method on production and distribution of vegetables. Ann. Rep. Faculty Educ. Gunma Univ. 2007, 42, 145–157. [Google Scholar]
- HOSHIZAKI Corporation. HR-63ZT Product Information. 2010. Available online: http://www.hoshizaki.co.jp/p/f-refrigerator/z-series/refrigerator/hr-63zt.html (accessed on 8 January 2016).
- Ministry of Agriculture, Forestry and Fisheries (MAFF). Minister’s Office Environmental Policy Division General Accounting; Database Maintenance. Available online: http://www.maff.go.jp/j/budget/yosan_kansi/sikkou/tokutei_keihi/seika_h23/kanbou_kankyou_ippan/pdf/60100227_03.pdf (accessed on 10 January 2016).
- Watanabe, Y.; Dowaki, K. Proposal of the index of environmental burden and health information. In Proceedings of the 12th Conference on Institute of Life Cycle Assessment, Tokyo, Japan, 7–9 March 2018. [Google Scholar]
- Ide, K.; Dowaki, K.; Kitahata, N. Improvement of vegetable productivity and LCA analysis using carbon-carbon CO2 for low carbon agriculture method. In Proceedings of the 12th Conference on Institute of Life Cycle Assessment, Tokyo, Japan, 7–9 March 2018. [Google Scholar]
- Berthoud, A.; Maupu, P.; Huet, C.; Poupart, A. Assessing freshwater ecotoxicity of agricultural products in life cycle assessment (LCA): A system study of wheat using French agricultural practices databases and USEtox model. Int. J. Life Cycle Assess. 2011, 16, 841. [Google Scholar] [CrossRef]
- Margni, M.; Rossier, D.; Crettaz, P.; Jolliet, O. Life cycle impact assessment of pesticides on human health and ecosystems. Agric. Ecosyst. Environ. 2002, 93, 379–392. [Google Scholar] [CrossRef]
- Hoshi, T.; Okano, T.; Kosakai, K.; Terazoe, S. Development of high productive technology for vegetables. (3). Cultivation on some vegetables in a test plant. Ann. Rep. Abiko Res. Inst. Electr. Power Ind. 1988, U88008, 44. [Google Scholar]
- Kubo, Y.; Inaba, A.; Nakamura, R. Respiration and C2H4 production in various harvested crops held in CO2-enriched atmospheres. J. Am. Soc. Hortic. Sci. 1990, 115, 975–978. [Google Scholar]
- Kubo, Y.; Inaba, A.; Nakamura, R. Effects of high CO2 on respiration in various horticultural crops. J. Jpn. Soc. Hortic. Sci. 1989, 58, 731–736. [Google Scholar] [CrossRef]
- Wang, C.Y. Effect of short-term high CO2 treatment on the market quality of stored broccoli. J. Food Sci. 1979, 44, 1478–1482. [Google Scholar] [CrossRef]
- Harley, P.C.; Thomas, R.B.; Reynolds, J.F.; Strain, B.R. Modelling photosynthesis of cotton grown in elevated CO2. Plant Cell Environ. 1992, 15, 271–282. [Google Scholar] [CrossRef]
- Kawashima, N. Present Situation and Problems of CO2 Enrichment in a Greenhouse. J. Agrc. Met. 1991, 47, 177–182. [Google Scholar] [CrossRef]
- Nakagawa, I.; Yoshioka, H.; Kawada, M.; Nishimura, K. 1991: CO2 application on the growth of spinach, cub, and cinnamon. Misc. Publ. NARO West. Region Agric. Res. Cent. 1991, 81, 30–34. [Google Scholar]
- Nakano, A.; Ahn, D. CO2 application technology for facility production adapted to low-carbon society. Agric. Hortic. 2010, 85, 1071–1079. [Google Scholar]
- Nakano, A.; Yasuba, K.; Sasaki, H.; Johkan, M.; Suzuki, K.; Takaichi, M. Estimation of the amount of residual toxic residue from large-scale tomato plant production and various properties of the compost. Bull. Natl. Inst. Veg. Tea Res. 2010, 9, 197–204. [Google Scholar]
- Dowaki, K.; Ohta, T.; Kasahara, Y.; Kameyama, M.; Sakawaki, K.; Mori, S. An economic and energy analysis on bio-hydrogen fuel using a gasification process. Renew. Energy 2007, 32, 80–90. [Google Scholar] [CrossRef]
- Kameyama, M.; Ogura, S.; Kamiuchi, H.; Dowaki, K. Performance evaluation of 1t/d scale plant through Blue Tower gasification process. J. Jpn. Soc. Energy Resour. 2010, 31, 43–50. [Google Scholar]
- Nagaishi, T.; Ide, K.; Kameyama, M.; Dowaki, K. Life cycle assessment of hydrogen purification by pressure swing adsorption in consideration of CO2 fertilization. In Proceedings of the 12th Conference on Institute of Life Cycle Assessment, Tokyo, Japan, 7–9 March 2018. [Google Scholar]
Figure 1.
System boundary of life cycle assessment (LCA) approach at the model spinach farm. Because it was assumed to be from the waste of a renewable energy plant, CO2 production for the elevated CO2 system was not included.
Figure 1.
System boundary of life cycle assessment (LCA) approach at the model spinach farm. Because it was assumed to be from the waste of a renewable energy plant, CO2 production for the elevated CO2 system was not included.

Figure 2.
Weights of spinach of conventional production (400 ppm) and elevated CO2 treatment (1000 ppm). Average of the treatments are marked with a black diamond shape.
Figure 2.
Weights of spinach of conventional production (400 ppm) and elevated CO2 treatment (1000 ppm). Average of the treatments are marked with a black diamond shape.

Figure 3.
Average vitamin C concentration of conventional production (400 ppm CO2) and elevated CO2 treatment (1000 ppm CO2). Bars indicate the standard deviation.
Figure 3.
Average vitamin C concentration of conventional production (400 ppm CO2) and elevated CO2 treatment (1000 ppm CO2). Bars indicate the standard deviation.

Figure 4.
CO2 emissions of conventional production system (400 ppm CO2) and elevated CO2 system (1000 ppm CO2).
Figure 4.
CO2 emissions of conventional production system (400 ppm CO2) and elevated CO2 system (1000 ppm CO2).


Table 1.
Incubator-scale cultivation of Spinacia oleracea of the conventional system and the elevated CO2 treatment system.
Table 1.
Incubator-scale cultivation of Spinacia oleracea of the conventional system and the elevated CO2 treatment system.
| Conventional System | Elevated CO2 Treatment System | |
|---|---|---|
| Temperature (°C) | 22 | 22 |
| Humidity (%) | 50 | 50 |
| Lighting (%) | 60 | 60 |
| CO2 concentration (ppm) | 400 | 1000 |
| Lighting time (h) | 16 | 16 |
Table 2.
Inventories from production of spinach at 10 a farm to distribution center. N: nitrogen; P: phosphorous; K: potassium.
Table 2.
Inventories from production of spinach at 10 a farm to distribution center. N: nitrogen; P: phosphorous; K: potassium.
| Spinach Life Cycle Inputs | ||||||||
| Unit | Use (per 10 a) | CO2 emissions (kg CO2 per unit) | ||||||
| Organic fertilizer | kg | N | P | K | N | P | K | |
| 24.0 | 19.8 | 16.9 | 1.15 | 0.86 | 0.15 | Adapted from [24] | ||
| Fuel | L | 2.5 | 2.7 | Fuel use adapted from [22] | ||||
| Transport | ||||||||
| Unit | Use (per one way) | CO2 emissions (kg CO2 per unit) | ||||||
| Truck transport | L | 5.86 | 2.32 | Fuel efficiency [20]; Average speed adapted from [21] | ||||
| Distribution Center | ||||||||
| Unit | Use (per day) | CO2 emissions (kg CO2 per unit) | ||||||
| Electricity | kWh | 0.9 | 0.5 | Electricity use adapted from [23] | ||||
© 2017 by the authors. Licensee MDPI, Basel, Switzerland. This article is an open access article distributed under the terms and conditions of the Creative Commons Attribution (CC BY) license (http://creativecommons.org/licenses/by/4.0/).
Share and Cite
MDPI and ACS Style
Seo, Y.; Ide, K.; Kitahata, N.; Kuchitsu, K.; Dowaki, K. Environmental Impact and Nutritional Improvement of Elevated CO2 Treatment: A Case Study of Spinach Production. Sustainability 2017, 9, 1854. https://doi.org/10.3390/su9101854
AMA Style
Seo Y, Ide K, Kitahata N, Kuchitsu K, Dowaki K. Environmental Impact and Nutritional Improvement of Elevated CO2 Treatment: A Case Study of Spinach Production. Sustainability. 2017; 9(10):1854. https://doi.org/10.3390/su9101854
Chicago/Turabian StyleSeo, Yuna, Keisuke Ide, Nobutaka Kitahata, Kazuyuki Kuchitsu, and Kiyoshi Dowaki. 2017. "Environmental Impact and Nutritional Improvement of Elevated CO2 Treatment: A Case Study of Spinach Production" Sustainability 9, no. 10: 1854. https://doi.org/10.3390/su9101854
Note that from the first issue of 2016, this journal uses article numbers instead of page numbers. See further details here.