Article

The Emissions of Carbon Dioxide, Methane, and Nitrous Oxide during Winter without Cultivation in Local Saline-Alkali Rice and Maize Fields in Northeast China

1
Key Laboratory of Groundwater Resources and Environment, Ministry of Education, Jilin University, Changchun 130012, China
2
College of Environment and Resources, Jilin University, Changchun 130012, China
3
Key Laboratory of Songliao Aquatic Environment, Ministry of Education, Jilin Jianzhu University, Changchun 130118, China
*
Authors to whom correspondence should be addressed.
Sustainability 2017, 9(10), 1916; https://doi.org/10.3390/su9101916
Submission received: 28 August 2017 / Revised: 19 October 2017 / Accepted: 19 October 2017 / Published: 23 October 2017

Abstract

:
Agricultural ecosystems are important contributors to atmospheric greenhouse gasses (GHGs); however, in situ winter emission data in saline-alkali fields are scarce. Gas samples were collected during different periods, from three rice (R1–R3) and three maize (M1–M3) fields with different soil pH levels and salinity conditions. Carbon dioxide (CO2) emissions in the rice and maize fields decreased with decreasing temperature during the freezing period and increased with the rising temperature during the thawing period, with the majority of winter CO2 emissions occurring during these two periods. Peaks in methane (CH4) emissions were observed during the freezing period in the rice fields and during the snow-melting period in the rice and maize fields. CH4 emissions in the rice fields and CH4 uptake rates in the maize fields were significantly (P < 0.05) related to surface soil temperature. Nitrous oxide (N2O) emissions remained relatively low, except for during the peaks observed during the snow-melting period in both the rice and maize fields, leading to the high GHG contribution of the snow-melting period throughout the winter. Higher pH and salinity conditions consistently resulted in lower CO2, CH4, and N2O emissions, CH4 uptake, and lower global warming potential (GWP). These results can contribute to the assessment of the GWP during winter in saline-alkali regions.

1. Introduction

Global warming could alter the earth’s ecosystems by rising sea levels caused by glacier melting, changes in biome distribution, and food production, and an elevated minimum temperature in winter, and it influences the survival and development of humans. Global temperatures have increased by 0.85 °C in the past 130 years, and are predicted to continue to increase by 1.2 °C to 4.8 °C by the end of the 21st century [1]. According to the 2013 Intergovernmental Panel on Climate Change (IPCC), the increased atmospheric concentration of greenhouse gases (GHGs), including carbon dioxide (CO2), methane (CH4), and nitrous oxide (N2O), are responsible for past, current, and predicted future global warming by substantially increasing the greenhouse effect [1]. As a result, GHG emissions are receiving increased attention by the international community.
CO2, CH4, and N2O are the main gases affecting global warming [2], contributing to approximately 60%, 20%, and 6% of the greenhouse effect, respectively [3]. Although increasing atmospheric CO2 concentrations account for most the GHGs (IPCC, 2013) [1], N2O and CH4 are equally as important because of their unique radiative properties and long residence time in the atmosphere result in their global warming potential (GWP) being 298 and 25 times that of CO2 over a period of 100 years, respectively (IPCC, 2007) [3]. Consequently, considering the emissions of these three gasses when assessing the greenhouse effect is important.
Terrestrial ecosystems are important sources of atmospheric CO2, CH4, and N2O [1,4], and agricultural lands, which occupy 37% of the earth’s land surface [5], release large amounts of these GHGs into the atmosphere [5,6]. The most recent studies focusing on CO2, CH4, and N2O emissions from agricultural ecosystems examined the effects of management practices, such as different tillage [6,7,8,9] or fertilization practices [7,10,11,12,13], environmental changes including changes in temperature [14] and moisture [7,12,15,16], soil depth [17], and soil physicochemical properties [18] on GHG emissions. Studies regarding GHG fluxes on seasonally frozen soil in alkali-saline soil regions are lacking.
Seasonal freeze-thaw is an important meteorological event in boreal areas. GHG emissions during the freeze-thaw period likely lead to variations in the atmospheric GHG concentrations [19,20,21] and influence the greenhouse effect [22]. Some studies have shown that CO2 emissions are inhibited, to a large degree, by freezing, and are activated by thawing [23,24]. However, other studies have shown that freezing enhances CO2 emissions [25]. Similarly, it has been reported that freezing significantly inhibits CH4 emissions, whereas thawing activates CH4 emissions [24,26]. Other studies have found that the freeze-thaw cycles has inconsistent effects on CH4 emissions [27]. Although some studies have shown that freezing [25] or freeze-thaw cycles [28,29] enhance N2O emissions, other studies suggest that N2O emissions decrease due to freezing and increase due to thawing [24,30,31].
In addition, most previous freeze-thaw experiments investigated areas with soils with pH values below 7.0, with a limited focus on saline-alkali soil. Saline-alkali stress inhibits microbial biomass and affects the microbial community and structure [32,33]. High salinity inhibits microbial activities and the availability of substrate [34], and prevents the production of enzymes [35]. Therefore, the pH and salinity conditions may impact CO2, CH4, and N2O emissions, but more research is required in this area.
The Western Jilin Province in Northeast China is one of the largest soda saline-alkaline areas on earth. The area is an important agricultural production base in China, predominantly consisting of rice paddies and maize lands. Although winter impacts the soil for over six months of the year, from the end of October until the end of April of the following year, continuous field monitoring data of CO2, CH4, and N2O emissions throughout the winter in the area remain scarce. Three rice fields and three maize fields of different pH and salinity values were examined for this study. The overall objective was to (1) determine the CO2, CH4, and N2O emissions in rice and maize fields during winter and to assess their contribution to the GWP; and (2) to analyze their emissions under different pH and salinity values. The results of the current study supplement existing basal data on CO2, CH4, and N2O emissions of saline-alkali rice and maize fields during winter and provide a scientific basis for the accurate assessment of the GWP.

2. Materials and Methods

2.1. Study Site

The sampling sites were in Songyuan City of the Western Jilin Province (123°091′E–124°221′E, 44°571′N–45°461′N), Northeast China. The local climate is characterized by long, cold winters, with large amounts of snow, with the lowest air temperature reaching −21 °C (Figure 1). The average minimum air temperature during winter of the recent five years (2011–2015) was −12.0 °C with a lowest air temperature −35.6 °C in 2011. The local rice and maize fields experience four periods throughout the winter: freezing, hard frost, snow-melting, and thawing (Figure 1). The freezing period begins when the minimum air temperature drops to approximately 0 °C and ends when the surface soil freezes completely. Subsequently, the soil experiences hard frost under colder temperatures. The snow-melting period begins when the snow starts to melt due to increasing temperatures. The thawing period begins when snow disappears and the soil has thawed completely.

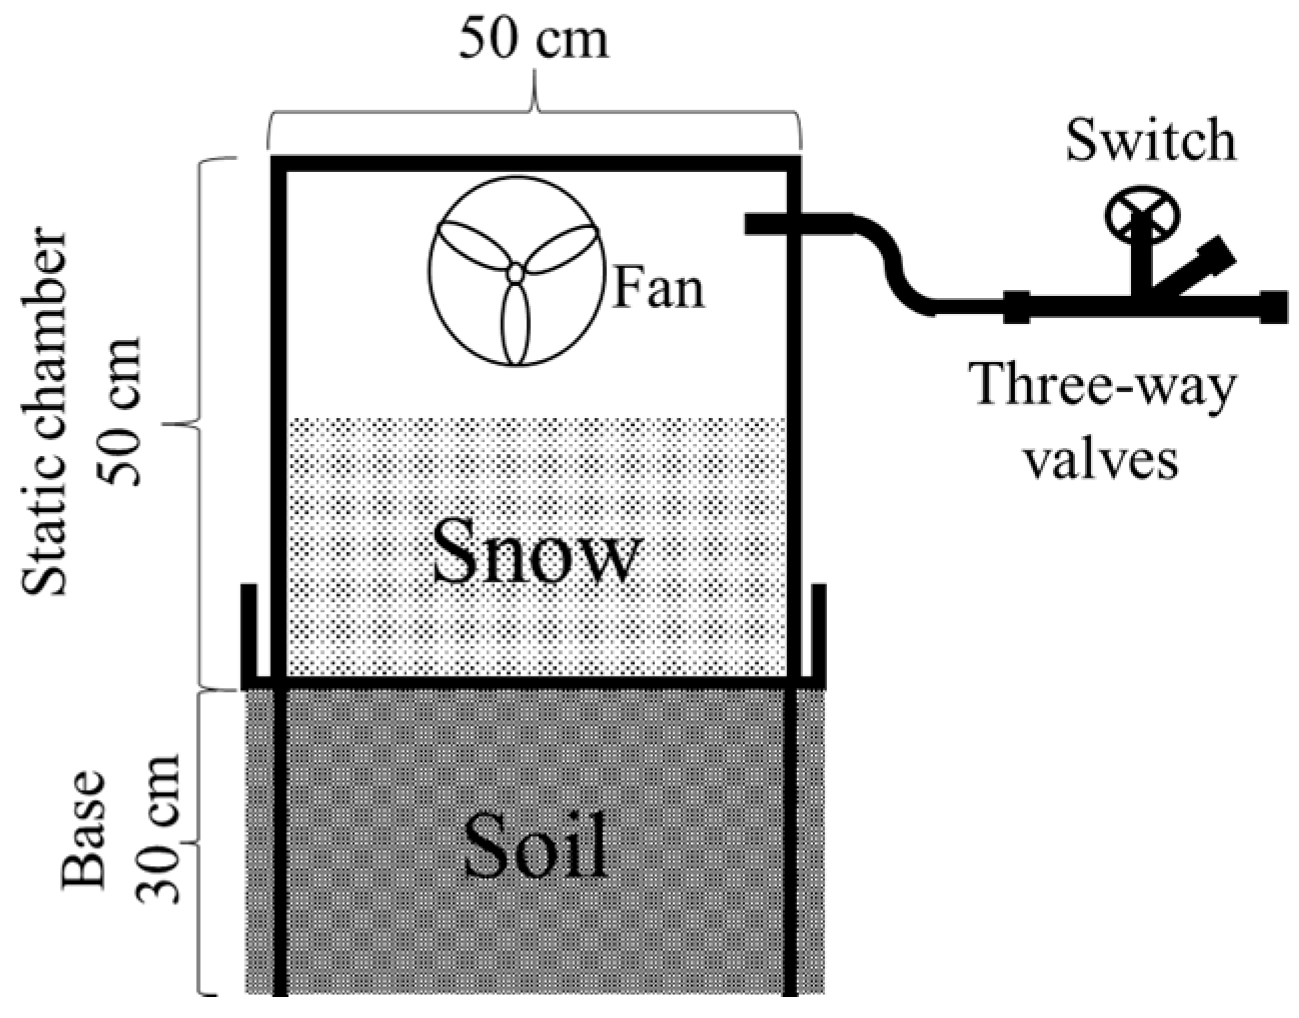
2.2. Sampling and Measurement of CO2, CH4, and N2O Fluxes

Three rice fields (R1: 20.4 m × 30.7 m; R2: 22.6 m × 36.8 m; R3: 15.5 m × 30.3 m; rice type: Tonghe 837) and three maize fields (M1: 10.0 m × 44.8 m; M2: 12.3 m × 46.2 m; M3: 13.7 m × 46.8 m; maize type: Tongyu 9585) with different pH and salinity values (Table 1) were selected.
All of the surface litter and stubble were removed after harvest to avoid their uneven distribution and participation in microbial respiration, which might affect GHG emission rates. Gas sampling was conducted from 16 October 2014 to 30 April 2015 using static chambers. Soil samples from a depth of 0–20 cm were collected before the first gas sampling from the sampling plots, to determine the soil properties, such as pH, salinity, soil organic carbon, et al. The pH, salinity, moisture (gravimetric water content), and soil organic carbon (C) were determined by the methods described by Tang et al. [36]. Nitrate-N was measured by the methods described by Bissett et al. [37].
Gas samples were collected every 10 days during the hard frost period and every two days during other periods. Each static chamber (bottomless, 50 cm × 50 cm × 50 cm) was composed of transparent plexiglass wrapped in silver paper to reflect sunshine, thereby avoiding rising temperatures. Each static chamber was equipped with an internal circulating fan to ensure complete gas mixing. A base (without a top or bottom, 50 cm × 50 cm × 30 cm) with a seal groove was buried 30 cm into the soil in each plot. There were three plots in each field. Each plot was marked by a stick and equipped with a static chamber combined with a base (Figure 2). The static chamber was embedded into the groove, and a saturated NaCl solution was added to the groove to seal the chamber while gas sampling. The samples of all of the fields were collected between 9:00 a.m. and 11:00 a.m., representing 1-day average flux [38]. The samples of three plots in one field were collected at the same time. Gas samples were collected into vacuum bags using a 50-mL airtight syringe. In 30 min, four samples from a single field were collected every 10 min. The soil temperatures at the surface (0 cm depth) and at a depth of 15 cm were recorded by an electronic geothermometer (Type: TP101, Shenzhen Riters Instrumentation Co., Ltd, Shenzhen, China), which has a temperature range of −50 °C to 300 °C and a testing length of 15 cm. Soil temperatures and snow cover thickness were from one of the six fields because the six fields were close in one plain.
Concentrations of CO2, CH4, and N2O in the gas samples were analysed by gas chromatograph (GC, Agilent 7820A, Santa Clara, CA, USA) within 24 h following gas sampling. The gas chromatograph configurations for analysing concentrations of CO2, CH4, and N2O were as described by Zhang et al. [39]. The GHG flux was calculated based on the rate of change in gas concentration within the chamber, which was estimated as the slope of the linear regression between concentration and time. The flux was calculated per the equation described by Zhang et al. [39].

2.3. Statistical Methods

The mean flux was calculated as:
F ¯ = 1 n i = 1 n F i
where F ¯ (CO2 g·m−2·h−1; CH4, N2O μg·m−2·h−1) is the mean flux of one period; Fi is the flux of CO2, CH4, or N2O during the ith sampling time during one period; and n is the total number of samples during one period.
The cumulative GHG flux was calculated as follows:
F j = m F j ¯ × 24 × 10000
where F j (CO2 kg·ha−1; CH4, N2O g·ha−1) is the cumulative flux of CO2, CH4, or N2O during the jth period; F j ¯ is the mean flux of CO2, CH4, or N2O during the jth period; and m is the total number of days during the jth period.
F T = j = 1 4 F j
where FT (CO2 kg·ha−1; CH4, N2O g·ha−1) is the cumulative flux of CO2, CH4, or N2O across the entire winter.
GWP (kg CO2 eq·ha1) was calculated as follows:
G W P = F T C O 2 + 25 F T C H 4 + 298 F T N 2 O
The statistical analyses were performed using SPSS 22.0 software (International Business Machines Corporation, New York, NY, USA). All figures were drawn using Sigmaplot 12.5 (Systat Software, Inc., San Jose, CA, USA).

3. Results

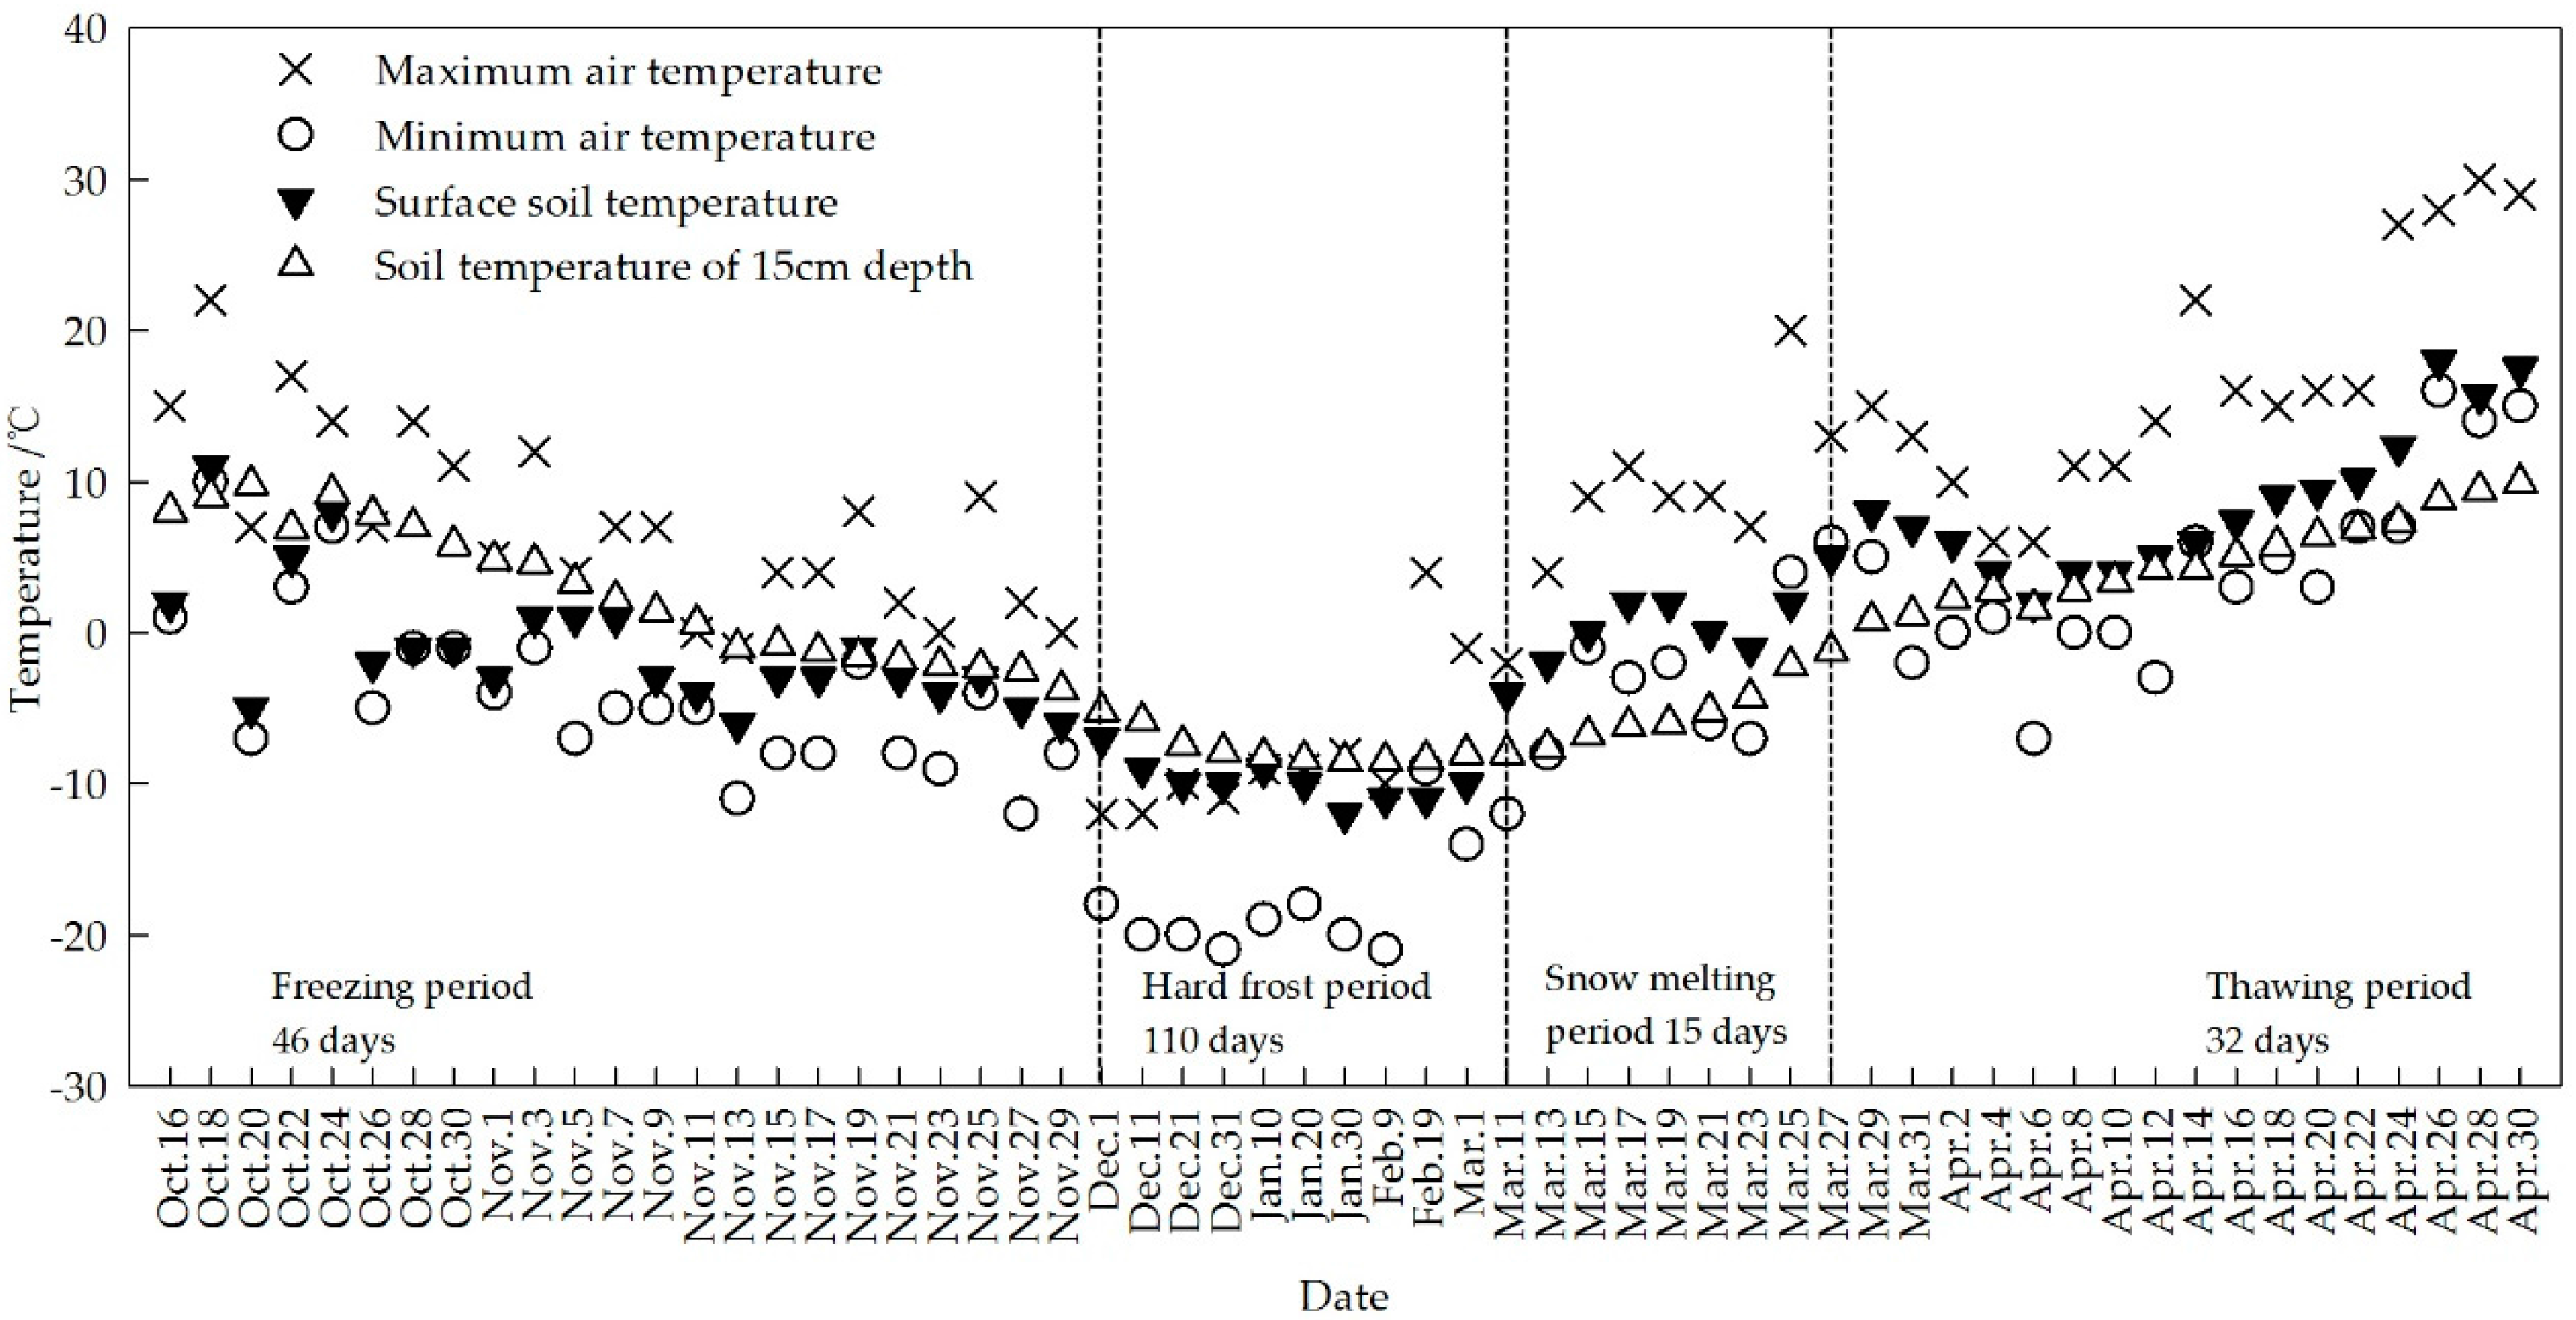
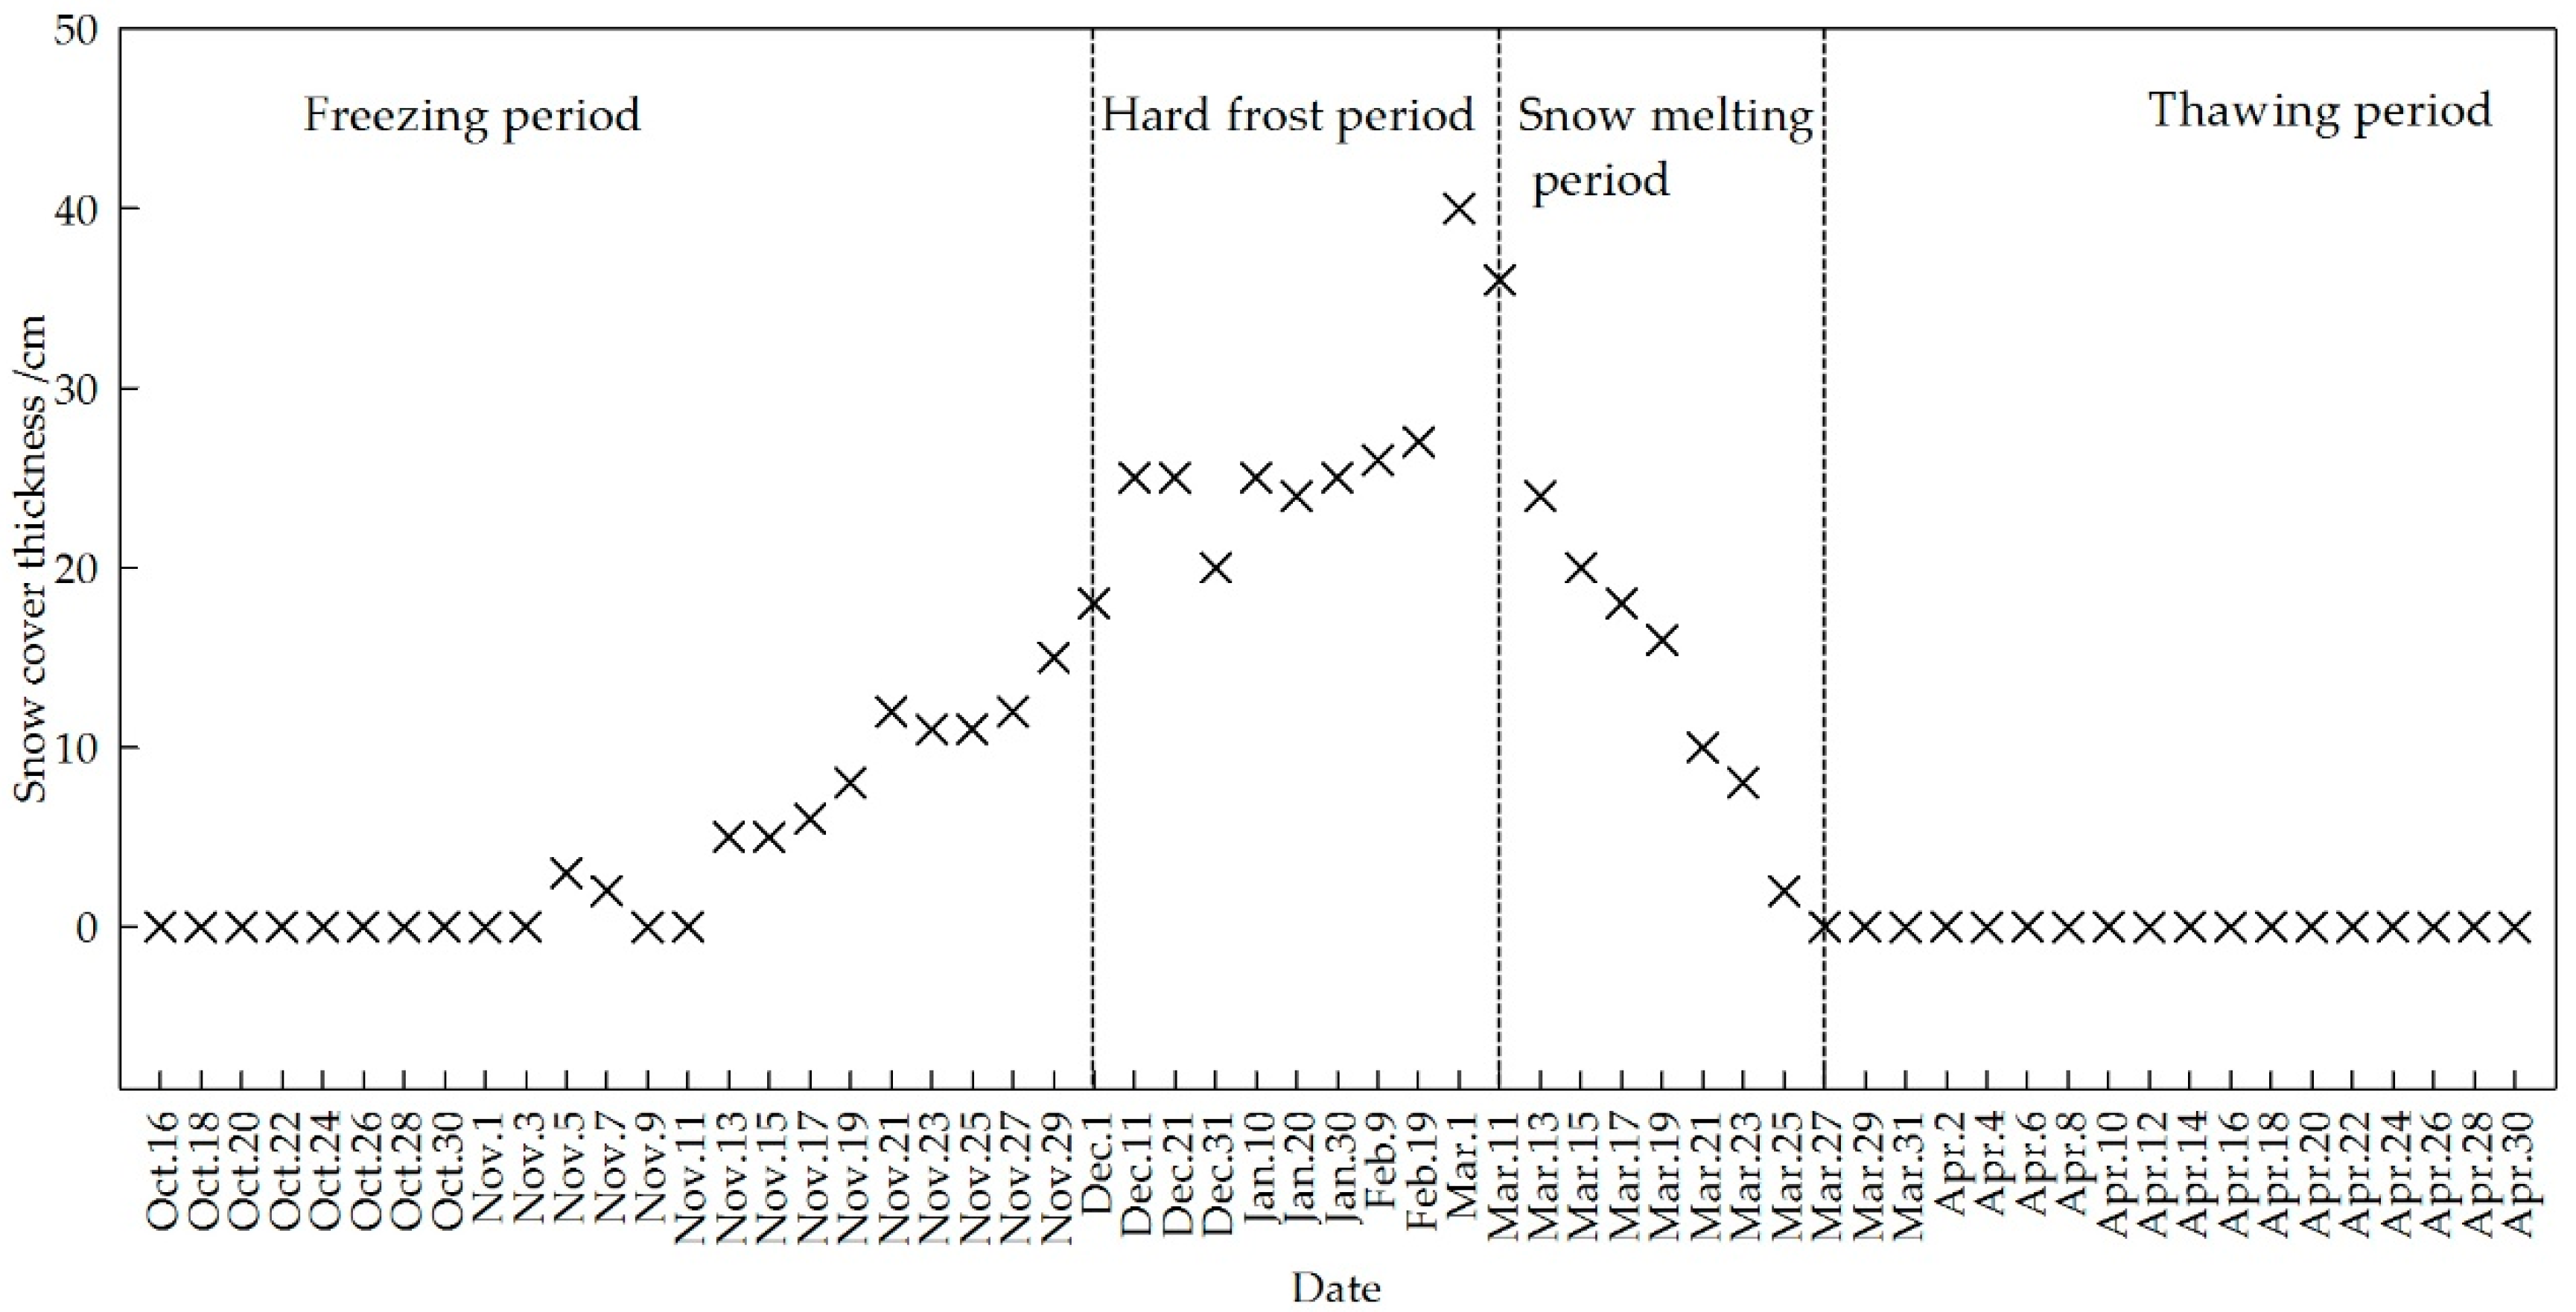
3.1. Variations in Snow and Temperatures

Temperatures fluctuated widely during winter (Figure 2). Surface soil temperature directly reflected the variations in air temperature. The soil temperature at a depth of 15 cm dropped with decreasing air temperature, and the lowest recorded temperature was −8.5 °C during the hard frost period. From 16 October 2014 to 1 December 2014 was the freezing period. The surface soil temperature was above zero from 15 March 2015 during the snow-melting period. The soil temperature at 15 cm depth was above zero from 27 March 2015 during the thawing period. The minimum air temperature sometimes was below zero during the snow-melting, and thawing periods. These differences in temperature resulted in the freeze-thaw cycles occurring during these periods.
Snow began on 5 November 2014 (Figure 3). The maximum snow cover thickness was 40.0 cm on 1 March 2015, after which the snow melted rapidly and disappeared completely by 27 March 2015. Snowpack insulated the soil from the air and acted to keep the soil warm.

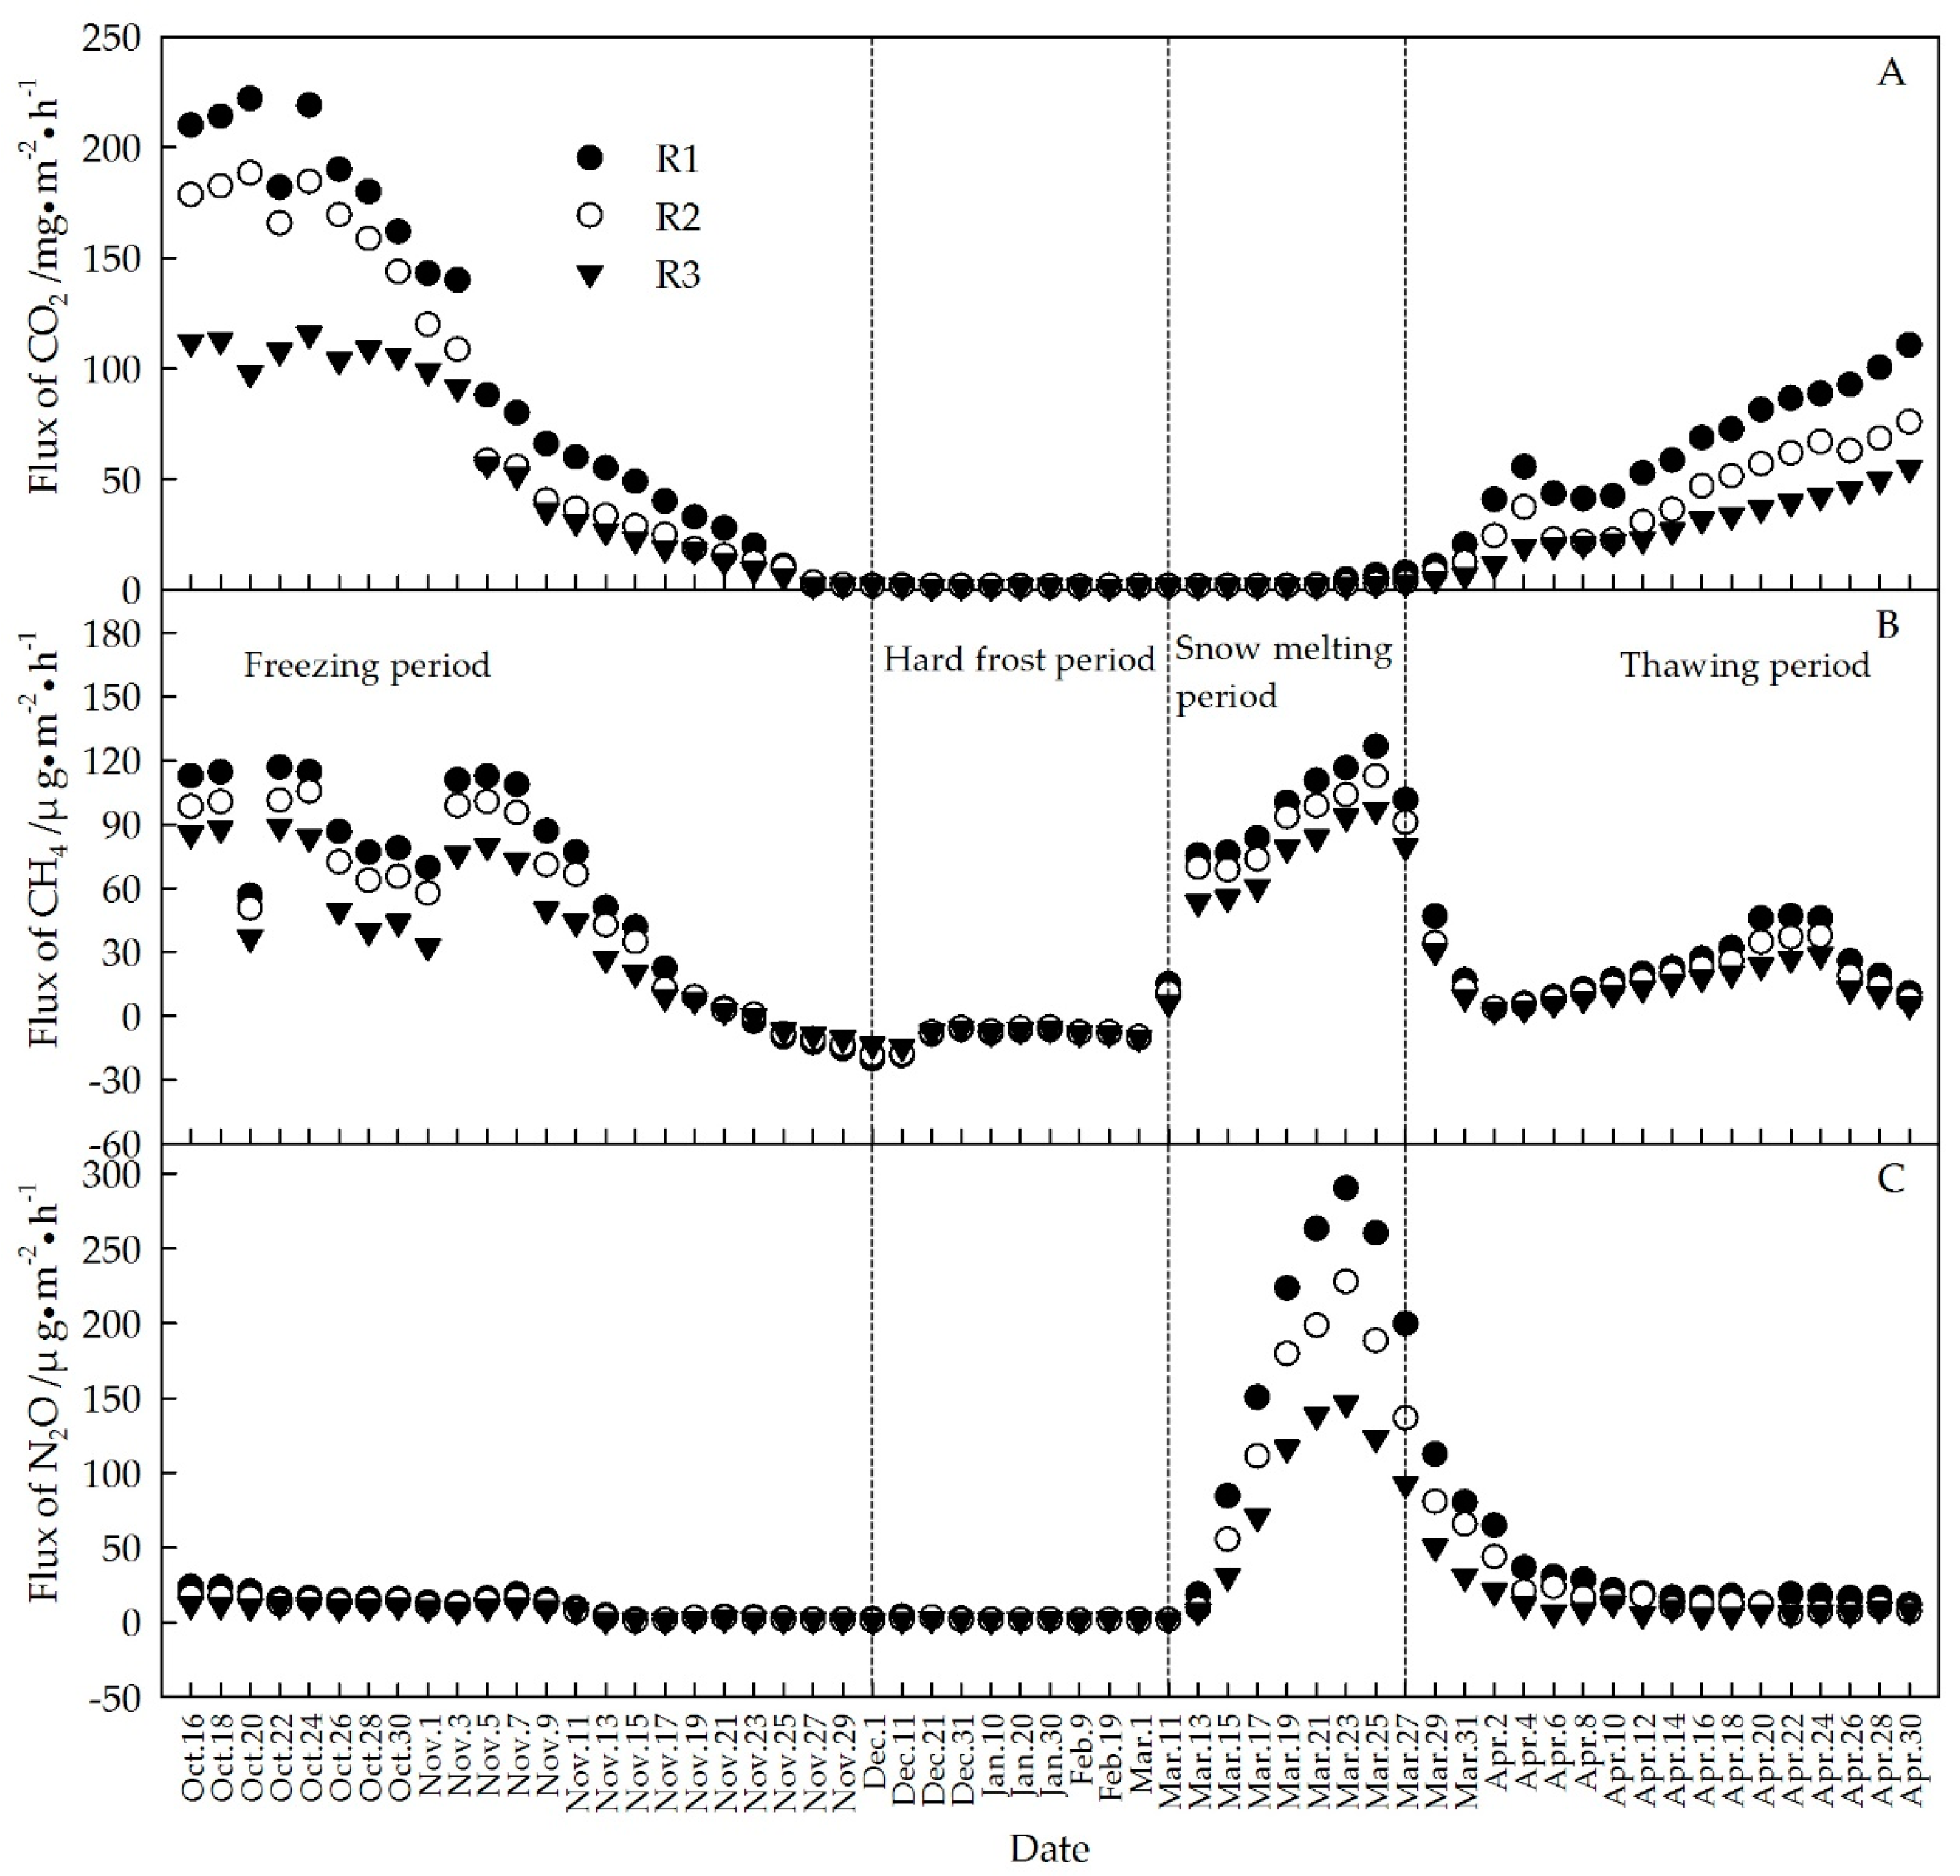
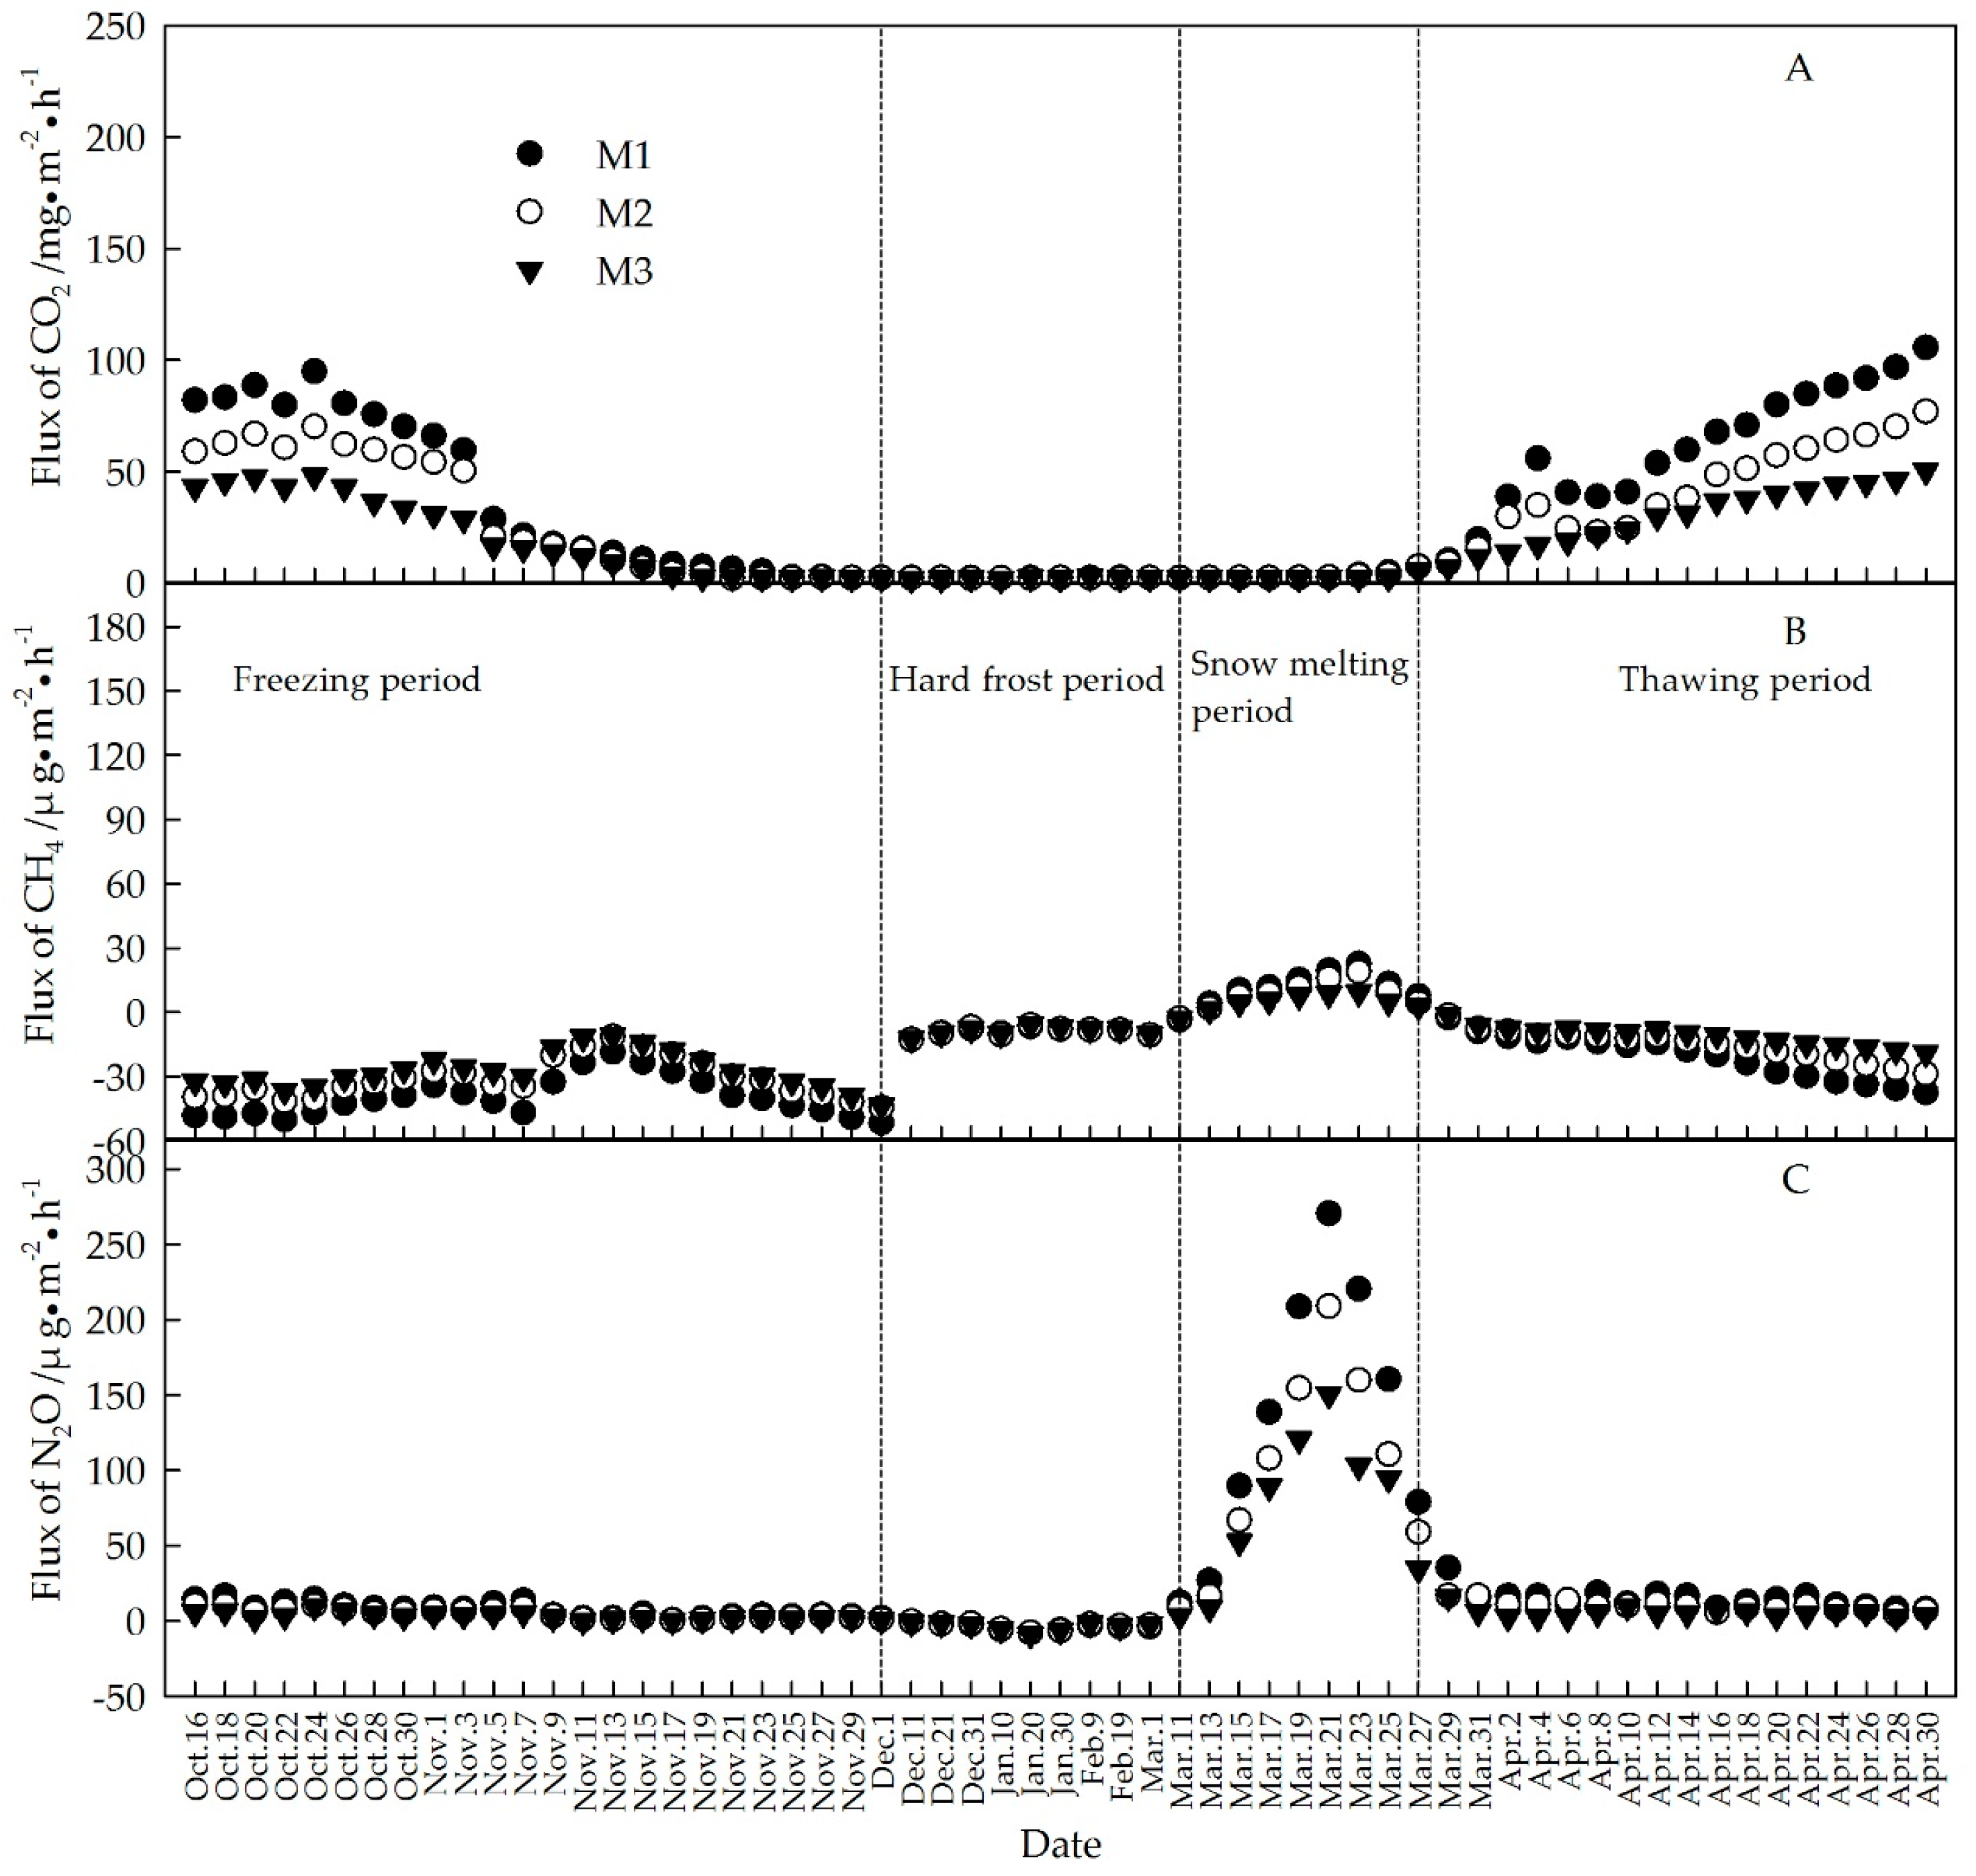
3.2. Variations in the Flux of CO2, CH4, and N2O

For the flux in CO2, the rice fields showed similar trends as the maize fields (Figure 4A and Figure 5A). The flux in CO2 to the atmosphere decreased with decreasing soil temperature during the freezing period, and remained at the lowest level during the hard frost period in the six fields. The maximum CO2 emission rate during the freezing period was higher than during other periods in the three rice fields. The CO2 emission rates began to increase after the snow melted and subsequently reached a peak during the early thawing period in the six fields. Thereafter, continuously rising CO2 emission rates were observed in the six fields. R1 had higher fluxes of CO2 than R2 and R3, and M1 had higher fluxes of CO2 than M2 and M3 during both the freezing and thawing periods.
CH4 was assimilated by the maize fields during the freezing, hard frost, and thawing periods. During the freezing period, CH4 fluctuated widely in the six fields, and two CH4 emission peaks in the three rice fields and a CH4 uptake peak in the three maize fields were observed. Significant CH4 emission peaks occurred during the snow-melting period in each of the six fields. The peak values in the six fields followed the order: R1 (126.5 μg·m−2·h−1) > R2 (112.6 μg·m−2·h−1) > R3 (96.8 μg·m−2·h−1) > M1 (22.6 μg·m−2·h−1) > M2 (18.9 μg·m−2·h−1) > M3 (9.2 μg·m−2·h−1). The CH4 emission peaks in the maize fields during the snow-melting period occurred before those in the rice fields. The CH4 emissions rates followed the order: R1 > R2 > R3 during the freezing, snowmelting, and thawing periods in the three rice fields. The CH4 uptake rates followed the order: M1 > M2 > M3 during the freezing and thawing periods in the three maize fields. Gradually increasing CH4 uptake rates in the three maize fields and CH4 emission rates in the three rice fields were observed during the thawing period; however, the CH4 emission rates experienced a decrease after 24 April 2015.
A single significant peak in N2O emissions was observed in each of the six fields. The N2O emission rates of the three rice fields stayed at the lowest level during the hard frost period. Explosive N2O emissions occurred during the snow-melting period, extending into the initial several days of the thawing period in the six fields. The peak N2O emission values followed the order: R1 (290.2 μg·m−2·h−1) > M1 (270.5 μg·m−2·h−1) > R2 (227.8 μg·m−2·h−1) > M2 (208.9 μg·m−2·h−1) > M3 (150.4 μg·m−2·h−1) > R3 (146.5 μg·m−2·h−1). However, the duration of high-level N2O emissions in the rice fields was longer than that in maize fields.

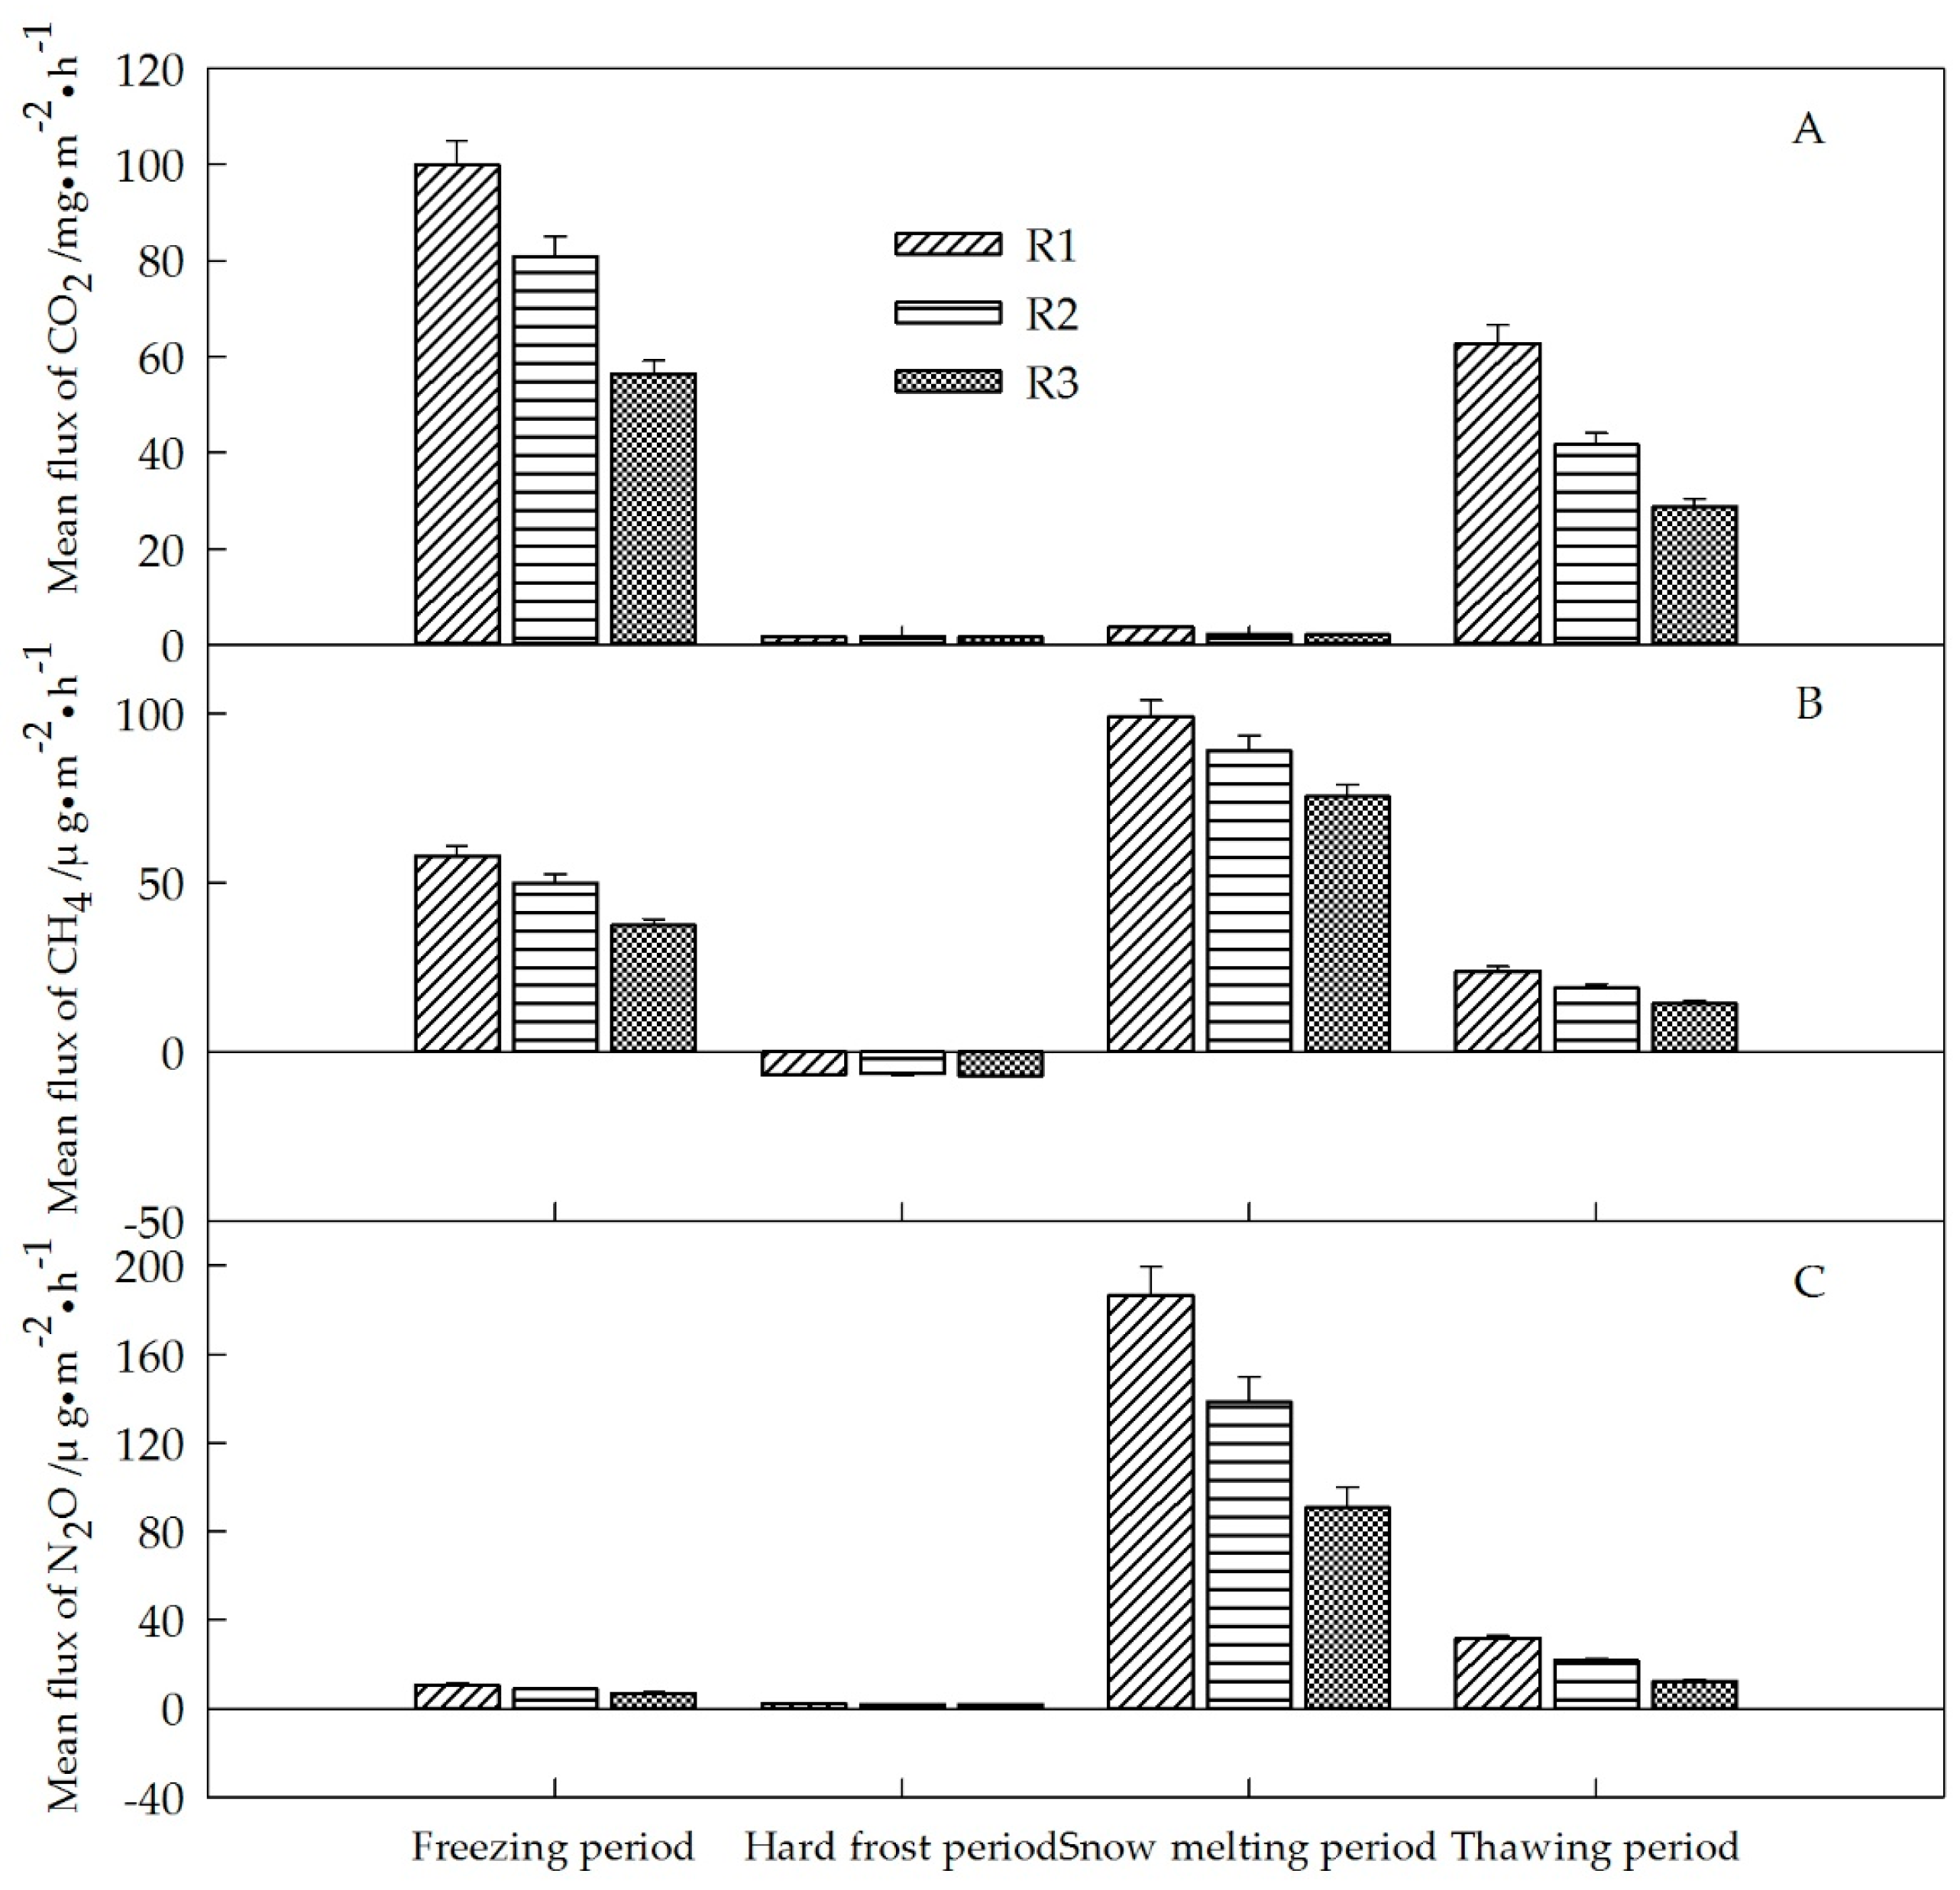
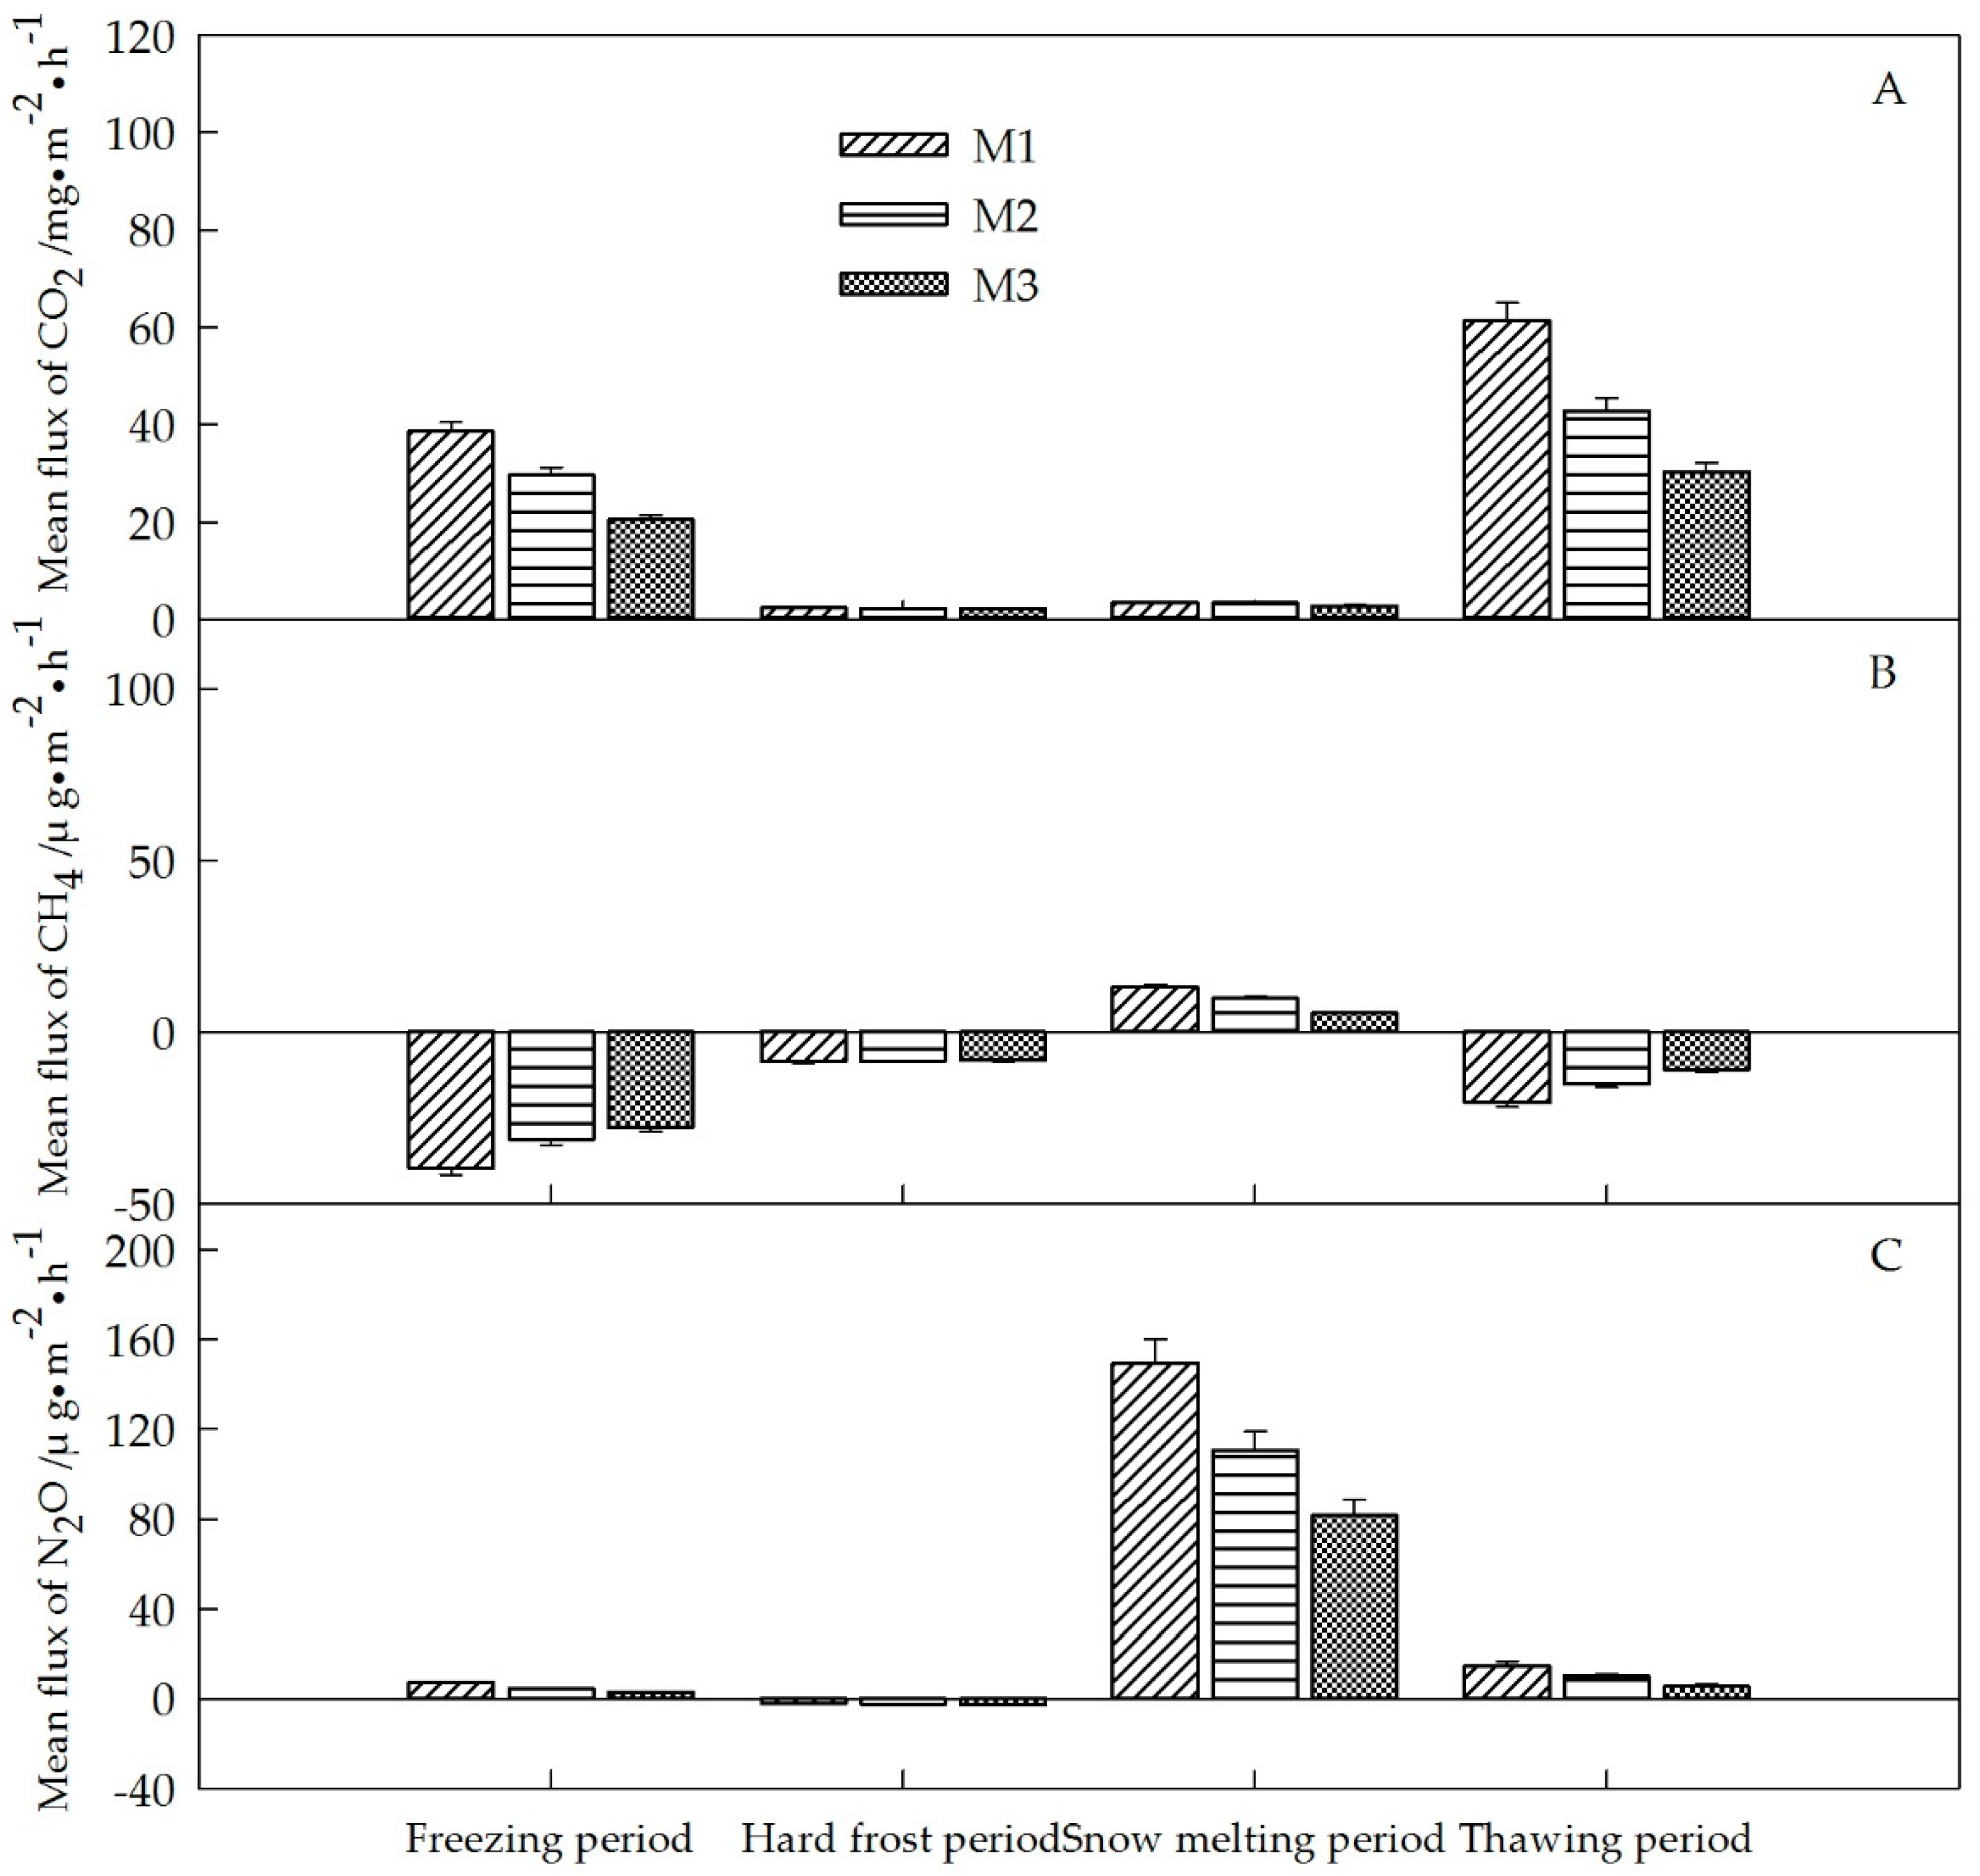
3.3. Mean Flux of CO2, CH4, and N2O during the Different Periods

The mean flux of CO2, CH4, and N2O during the different periods fluctuated widely in the six fields (Figure 6 and Figure 7). The mean fluxes of CO2, CH4, and N2O during the same period followed the order R1 > R2 > R3 in the rice fields, and generally followed the order M1 > M2 > M3 in the maize fields.
All of the rice and maize fields acted as CO2 sources during winter. The mean emission fluxes of CO2 during the different periods followed the order of freezing period > thawing period > snow-melting period > hard frost period in the three rice fields (Figure 6A) and followed the order of thawing period > freezing period > snow-melting period > hard frost period in the maize fields (Figure 7A).
Rice fields acted as important CH4 sources during the freezing, snow-melting, and thawing periods, and as CH4 sinks during the hard frost period (Figure 6B). The snow-melting period exhibited a higher flux of CH4 as compared to the other periods in the rice fields. Maize fields were important CH4 sinks in winter, except for a period of CH4 release during the snow-melting period, and the freezing period showed the highest mean flux of CH4 (Figure 7B).
Rice and maize fields acted as N2O sources in winter, except for a relatively minor uptake of N2O by the maize fields during the hard frost period (Figure 6C and Figure 7C). The mean N2O emission fluxes during the snow-melting period in all six fields were notably higher than those during other periods.

3.4. Cumulative Emissions, Contribution Rates, and GWPs of CO2, CH4, and N2O

In general, the cumulative flux of CO2, CH4, and N2O in winter followed the order: R1 > R2 > R3 and M1 > M2 > M3 (Table 2).
The total cumulative CO2 emissions during winter in rice fields reached 1644.5 kg·ha−1, 1267.5 kg·ha−1, and 892.3 kg·ha−1 in R1, R2, and R3, respectively (Table 2). The freezing period contributed 67.1%, 70.5%, and 69.7%, and the thawing period contributed 29.3%, 25.2%, and 24.8% of the total cumulative CO2 emissions in R1, R2, and R3, respectively. The total cumulative CO2 emission during winter in M1 was 970.8 kg·ha−1, which was 243.3 kg·ha−1 and 442.1 kg·ha−1 higher than in M2 and M3, respectively. The freezing period associated with the thawing period contributed 92.4%, 90.3%, and 86.8% of the total cumulative CO2 emissions in M1, M2, and M3, respectively.
The net cumulative CH4 emissions during winter were 1003.7 g·ha−1, 844.9 g·ha−1, and 610.4 g·ha−1 and the cumulative CH4 uptake during the hard frost period were 174.8 g·ha−1, 170.8 g·ha−1, and 182.2 g·ha−1 in R1, R2, and R3, respectively. The CH4 emissions were concentrated during the freezing and snow-melting periods in the three rice fields. Cumulative CH4 rates of 818.6 g·ha−1, 682.1 g·ha−1, and 604.2 g·ha−1 were assimilated, and 47.0 g·ha−1, 35.2 g·ha−1, and 20.1 g·ha−1 were released by M1, M2, and M3, respectively. Approximately 80.7%, 82.9%, and 86.0% of the CH4 uptake rates were observed during the freezing and hard frost periods in M1, M2, and M3, respectively.
The net cumulative N2O emissions during winter were 1096.1 g·ha−1, 812.5 g·ha−1, and 545.1 g·ha−1 in R1, R2, and R3, respectively. The snow-melting period contributed 61.2%, 61.3%, and 60.0%, and the thawing period contributed 22.3%, 20.5%, and 17.2% of the total cumulative N2O emissions in R1, R2, and R3, respectively. M1, M2, and M3 released a total of 727.5 g·ha−1, 525.3 g·ha−1, and 368.2 g·ha−1 N2O during winter, and assimilated 62.3 g·ha−1, 62.9 g·ha−1, and 78.4 g·ha−1, N2O during the hard frost period, respectively. The snow-melting period dominated the N2O emissions in winter in the maize fields.
The GWP values were 1996.2 kg CO2 eq·ha−1, 1530.8 kg CO2 eq·ha−1, 1070.0 kg CO2 eq·ha−1, 1149.8 kg CO2 eq·ha−1, 849.2 kg CO2 eq·ha−1, and 600.5 kg CO2 eq·ha−1 in R1, R2, R3, M1, M2, and M3, respectively (Table 3).

3.5. Pearson Correlation Analysis between CO2, CH4, and N2O Flux and Temperatures during Winter

The CH4 emission flux in rice fields was significantly related to the temperatures of the soil at the surface and at a depth of 15 cm (P < 0.05; Table 4). The CH4 emission flux in rice fields was significantly related to the temperatures of the soil at the surface and at a depth of 15 cm. CH4 uptake rate was notably (P < 0.01) related to the soil surface temperature, whereas it was not related to the soil temperature at a 15-cm depth. The N2O flux showed no significant correlation with the temperature of soil either at the surface or at a 15-cm depth (Table 4).

4. Discussion

4.1. CO2 Flux

Temperature is one of the key factors affecting the production and emission of CO2 [40]. The soil temperature, both at the surface and at a depth of 15 cm, was significantly (P < 0.01) related to CO2 emission in the six fields. Microbial biomass decreased with decreasing temperatures [41,42], and freezing soil insulated O2 from the air, restraining aerobic respiration and the release of CO2. Furthermore, increasing solubility and adsorption of CO2 with the decrease in temperature led to its retention [43]. Therefore, CO2 flux decreased gradually during the freezing period and remained at the lowest level during the hard frost period. Although soil temperatures at the surface and a depth of 15 cm (<0 °C) during the snow-melting period increased somewhat, they both remained around 0 °C. As the subsurface soil was frozen, little CO2 was released during the snow-melting period. Previous studies showed that dissolved organic matter was released from the broken aggregates [44,45,46] during freeze-thaw cycles and freezing [46], as well as from the lyzed microbial cells at low temperature [42]. The readily available sources of dissolved organic matter supplied a massive carbon source for recovering microbes and stimulated microbial respiration [42], until the sources were exhausted. Therefore, CO2 emission peaks occurred during the early thawing period in M1, M2, R1, R2, whereas R3, and M3 did not exhibit obvious CO2 emission peaks during the early thawing period, possibly because of the high salinity conditions in R3 and M3 restrained microbial activities [33], reduced microbial biomass [47], and decelerated the consumption of readily available dissolved organic matter. Thereafter, microbial activities increased and soil thawed with the rising temperatures in the six fields, leading to an increased CO2 emission flux.
Soil organic carbon is the substrate used for microbial respiration and is therefore vital to the process. Low soil organic carbon content is an indicator of low microbial activity and of low CO2 emissions [48]. Furthermore, a higher salinity resulted in a smaller microbial biomass [48] and inhibited the decomposition [49] and transformation [50] of organic matter. The high pH in alkaline soil facilitated CO2 absorption intensity and reduced the CO2 emission flux [51]. Results showed that CO2 fluxes with pH 7.6–7.8 were significantly lower than with soil with a pH of below 7.0 [52]. Annual CO2 fluxes decreased with increasing pH in the range of 7.37–8.72 and were negative with a pH greater than 9 [53]. Consequently, the emission flux and cumulative emissions of CO2 followed the decreasing order of R1, R2, then R3 and M1, M2, then M3.

4.2. CH4 Flux

CH4 is produced by methanogen under strict anaerobic conditions [54]. The anoxic conditions caused by high moisture resulted in the rice fields becoming CH4 sources.
The CH4 emission flux in rice fields was significantly related to the soil temperature, both at the surface and at 15-cm depth, which is consistent with the conclusion that the release of CH4 is temperature-sensitive and that lower temperatures result in lower CH4 emissions [55,56].
The two CH4 emission peaks occurred during the early freezing period (22 October 2014 to 5 November 2014) in every rice field, perhaps because the surface soil temperature dropped below 0 °C before every peak. The freezing of the soil surface caused by the low air temperature strengthened the anoxic condition and promoted the production of CH4, which was emitted when the temperature increased to above zero. Furthermore, freeze-thaw cycles occurring around the second peak had a positive effect on CH4 emissions. Thereafter, CH4 production and emissions were inhibited by the lower temperatures and frozen soil.
The CH4 accumulated under extremely anoxic conditions in the frozen soil during the hard frost period, and was emitted when the soil thawed during the snow-melting period. In addition, the topsoil thawed first, but the deeper soil remained frozen and was not permeable to water. So, fresh melt water fully saturated a small top layer of soil of several centimeters, creating anaerobic conditions favorable to produce of CH4. Thereby, CH4 emission peaks were observed in the three rice fields during the snow-melting period. Song et al. similarly noted explosive CH4 emissions during the freeze-thaw period [39]. After the complete release of accumulated CH4 in the three rice fields, the CH4 emission flux decreased and then increased with the rising temperature. The CH4 fluxes in the three rice fields declined after the 24 April 2015, possibly because the aerobic condition that increased with the evaporation of water restrained the production of CH4.
The CH4 uptake rates in the maize fields began to decline from the early freezing period. CH4 uptake rates were notably (P < 0.01) related to the surface soil temperature, whereas they were not related to the soil temperature at a depth of 15 cm. This corresponds to methane oxidation being sensitive to air temperature [57] as methane oxidation occurs mainly in the surface soil. The observed CH4 emission peaks in the maize fields during the snow-melting period occurred for the same reason as those in the rice fields. CH4 uptake rates in the three maize fields increased with the increasing soil surface temperature during the thawing period, which was consistent with the previous observed results in the saline-alkali soil in arid and semi-arid regions [58,59].
The higher moisture in the rice fields might result in deeper frost depths and harder frost than in maize fields, and the rice fields required more time to thaw, taking more time to release accumulated CH4 as compared to the maize fields at the same soil depth. Therefore, CH4 emission peaks in the rice fields during the snow-melting period occurred later than those in the maize fields.
The CH4 uptake peak in maize fields (5 November 2014) during the early freezing period, the increase in CH4 uptake rates in the maize fields, the period of CH4 uptake in the rice fields during the late freezing period, and the period of CH4 uptake during the hard frost period in the six fields, might all be related to the living methane-oxidizing bacteria and methane adsorption by the snow layer [60,61]. However, the physicochemical mechanisms responsible remain unclear. A sudden jump in CH4 uptake in the maize fields in early December was likely because of the inhibition caused by lower temperatures in the CH4 uptake by the living methane-oxidizing bacteria and the approximately saturated CH4 in the snow.
Previous studies have shown that the optimum pH of methanogen is 6.9–7.2 [62]; a higher pH (>7.2) would result in stronger inhibition of CH4 production. In addition, studies have shown that CH4 emissions are negatively related to salinity [63,64]. CH4 is the final product of soil organic carbon under anaerobic decomposition. Higher soil organic carbon content positively affected CH4 emissions [65,66]. Therefore, the emission flux and the accumulated CH4 emission in the rice fields followed the decreasing order of R1, R2, and then R3.
The optimum pH for methane oxidation has been reported to be 7.0–7.5 [67]. A rise in pH above the optimal level would result in a decline in methane oxidation. Furthermore, high salinity levels inhibited the activity of methane-oxidizing bacteria [68,69], inhibiting the CH4 uptake [70]. Hence, M1 exhibited higher CH4 uptake rates and a higher cumulative CH4 uptake than those of M2 and M3.

4.3. N2O Flux

N2O emissions showed no significant correlation with the soil temperatures either at the surface or at a 15-cm depth, which was consistent with the findings of Koponen et al. who found that N2O emissions were not related to soil temperature [71]. The flux of N2O is driven by its rates of production and consumption. The soil acted as a N2O sink when the N2O consumption rate exceeded that of its production [72]. Goldberg et al. similarly found that soil acted as a N2O sink under arid and aerobic conditions [73]. The maize fields maintained relatively arid and aerobic conditions as compared to the rice fields, which likely explains why the maize fields acted as weak N2O sinks, whereas the rice fields were sources of N2O during the hard frost period.
N2O is mainly derived from nitrification under aerobic conditions and denitrification under anaerobic conditions. The anaerobic and aerobic conditions occurred consecutively in the soil under the freeze-thaw cycles, thereby promoting concurrent nitrification and denitrification. However, the results of the current study suggest that denitrification mainly contributed to the N2O emissions during freeze-thaw cycles [74]. The large amount of NO3- that accumulated during the lengthy winter [75] stimulated denitrification. In addition, the topsoil thawed first, but the deeper soil remained frozen and was not permeable to water. So, fresh melt water fully saturated a small top layer of soil, creating anaerobic conditions favorable for denitrification. Hence, N2O emission peaks were observed in the six fields during the snow-melting period and the initial few days of the thawing period. The higher moisture in rice fields led to longer anaerobic condition than in the maize fields that contained lower moisture, thus facilitating denitrification [74] and the longer duration of explosive N2O emissions in rice fields. Thereafter, aerobic conditions in the six fields were promoted with the evaporation of water, which decreased N2O emission rates [76].
High soil organic carbon content and low pH favors N2O production [77]. High NO NO 3 content also stimulates denitrification and N2O production [78]. High salinity inhibits nitrification [79]. Hence, accumulated N2O emissions during winter followed the decreasing order of R1, R2, then R3 and M1, M2, then M3.

5. Conclusions

The rice and maize fields acted as CO2 sources in winter, and the freezing period combined with the thawing period dominated the cumulative CO2 emissions. Rice fields were CH4 sources in winter, and the freezing and snow-melting periods dominated the CH4 emissions. However, maize fields were CH4 sinks during winter, with 85.6–89.0% of the CH4 emissions occurring in the freezing and hard frost periods. Both rice and maize fields acted as N2O sources, and the snow-melting period dominated the N2O emissions. Rice fields contributed 1070.0–1996.2 kg CO2 eq ha−1 to the GWP in the winter. Maize fields contributed 600.5–1149.8 kg CO2 eq ha−1 to the GWP in the winter. High pH and salinity negatively affected CO2, CH4, and N2O emissions, CH4 uptake, and GWP during winter.

Acknowledgments

We gratefully acknowledge the Foundation of National Natural Science Foundation of China under Grant (51179073, 41471152).

Author Contributions

Hao Zhang, Jie Tang and Shuang Liang drafted the manuscript and tested the samples, Zhaoyang Li designed the research. The others analyzed the data and collected the samples.

Conflicts of Interest

The authors declare no conflict of interest.

References

  1. IPCC. Climate Change 2013: The Physical Science Basis. Contribution of Working Group I to the Fifth Assessment Report of the Intergovernmental Panel on Climate Change; Cambridge University Press: Cambridge, UK; New York, NY, USA, 2013; p. 1535. [Google Scholar]
  2. Kong, Y.; Nagano, H.; Kátai, J.; Vágó, I.; Oláh, Á.Z.; Yashima, M.; Inubushi, K. CO2, N2O and CH4 production/consumption potentials of soils under different land-use types in central Japan and eastern Hungary. Soil Sci. Plant Nutr. 2013, 59, 455–462. [Google Scholar] [CrossRef]
  3. Solomon, S.; Qin, D.; Manning, M.; Chen, Z.; Marquis, M.; Averyt, K.B.; Tignor, M.; Miller, H.L. Climate Change 2007: The Physical Science Basis, Contribution of Working Group I to the Fourth Assessment Report of the Intergovernmental Panel on Climate Change, 1st ed.; Cambridge University Press: Cambridge, UK; New York, NY, USA, 2007; pp. 2–18. [Google Scholar]
  4. Friedlingstein, P.; Cox, P.; Betts, R.; Bopp, L.; Von Bloh, W.; Brovkin, V.; Cadule, P.; Doney, S.; Eby, M.; Fung, I.; et al. Climate-carbon cycle feedback analysis, results from the C4MIP model intercomparison. J. Clim. 2006, 19, 3337–3353. [Google Scholar] [CrossRef]
  5. Smith, P.; Martino, D.; Cai, Z.; Gwary, D.; Janzen, H.; Kumar, P.; McCarl, B.; Ogle, S.; O’Mara, F.; Rice, C.; et al. Greenhouse gas mitigation in agriculture. Philos. Trans. R. Soc. Lond. B Biol. Sci. 2008, 363, 789–813. [Google Scholar] [CrossRef] [PubMed]
  6. Ussiri, D.A.N.; Lal, R.; Jarecki, M.K. Nitrous oxide and methane emissions from long-term tillage under a continuous corn cropping system in Ohio. Soil Tillage Res. 2009, 104, 247–255. [Google Scholar] [CrossRef]
  7. Liu, X.J.; Mosier, A.R.; Halvorson, A.D.; Reule, C.A.; Zhang, F.S. Dinitrogen and N2O emissions in arable soils: Effect of tillage, N source and soil moisture. Soil Biol. Biochem. 2007, 39, 2362–2370. [Google Scholar] [CrossRef]
  8. Omonode, R.A.; Vyn, T.J.; Smith, D.R.; Hegymegi, P.; Gál, A. Soil carbon dioxide and methane fluxes from long-term tillage systems in continuous corn and corn-soybean rotations. Soil Tillage Res. 2007, 95, 182–195. [Google Scholar] [CrossRef]
  9. Hwang, H.Y.; Kim, G.W.; Kim, S.Y.; Mozammel Haque, M.; Khan, M.I.; Kim, P.J. Effect of cover cropping on the net global warming potential of rice paddy soil. Geoderma 2017, 292, 49–58. [Google Scholar] [CrossRef]
  10. Bhattacharyya, P.; Nayak, A.K.; Mohanty, S.; Tripathi, R.; Shahid, M.; Kumar, A.; Raja, R.; Panda, B.B.; Roy, K.S.; Neogi, S.; et al. Greenhouse gas emission in relation to labile soil C, N pools and functional microbial diversity as influenced by 39 years long-term fertilizer management in tropical rice. Soil Tillage Res. 2013, 129, 93–105. [Google Scholar] [CrossRef]
  11. Zhang, X.X.; Yin, S.; Li, Y.S.; Zhuang, H.L.; Li, C.H.; Liu, C.J. Comparison of greenhouse gas emissions from rice paddy fields under different nitrogen fertilization loads in Chongming Island, Eastern China. Sci. Total Environ. 2014, 472, 381–388. [Google Scholar] [CrossRef] [PubMed]
  12. Maris, S.C.; Teira-Esmatges, M.R.; Arbonés, A.; Rufat, J. Effect of irrigation, nitrogen application, and a nitrification inhibitor on nitrous oxide, carbon dioxide and methane emissions from an olive (Olea europaea L.) orchard. Sci. Total Environ. 2015, 538, 966–978. [Google Scholar] [CrossRef] [PubMed]
  13. Shah, A.; Lamers, M.; Streck, T. N2O and CO2 emissions from South German arable soil after amendment of manures and composts. Environ. Earth Sci. 2016, 75, 1–12. [Google Scholar] [CrossRef]
  14. Bhattacharyya, P.; Roy, K.S.; Neogi, S.; Dash, P.K.; Nayak, A.K.; Mohanty, S.; Baig, M.J.; Sarkar, R.K.; Rao, K.S. Impact of elevated CO2 and temperature on soil C and N dynamics in relation to CH4 and N2O emissions from tropical flooded rice (Oryza sativa L.). Sci. Total Environ. 2013, 461–462, 601–611. [Google Scholar] [CrossRef] [PubMed]
  15. Jiang, B.; Yang, S.Y.; Yang, X.B.; Ma, Y.H.; Chen, X.L.; Zuo, H.F.; Fan, D.F.; Gao, L.; Yu, Q.; Yang, W. Effect of controlled drainage in the wheat season on soil CH4 and N2O emissions during the rice season. Int. J. Plant Prod. 2015, 9, 273–290. [Google Scholar]
  16. Wang, G.S.; Liang, Y.P.; Zhang, Q.; Jha, S.K.; Gao, Y.; Shen, X.J.; Sun, J.S.; Duan, A.W. Mitigated CH4 and N2O emissions and improved irrigation water use efficiency in winter wheat field with surface drip irrigation in the North China Plain. Agric. Water Manag. 2016, 163, 403–407. [Google Scholar] [CrossRef]
  17. Wang, Y.Y.; Hu, C.S.; Ming, H.; Oenema, O.; Schaefer, D.A.; Dong, W.X.; Zhang, Y.M.; Li, X.X. Methane, carbon dioxide and nitrous oxide fluxes in soil profile under a winter wheat-summer maize rotation in the North China Plain. PLoS ONE 2014, 9, e98445. [Google Scholar] [CrossRef] [PubMed]
  18. Tang, J.; Liang, S.; Li, Z.Y.; Zhang, H.; Wang, S.N.; Zhang, N. Emission laws and influence factors of greenhouse gases in Saline-Alkali paddy fields. Sustainability 2016, 8, 163. [Google Scholar] [CrossRef]
  19. Song, C.C.; Wang, Y.S.; Wang, Y.Y.; Zhao, Z.C. Emission of CO2, CH4 and N2O from freshwater marsh during freeze-thaw period in Northeast of China. Atmos. Environ. 2006, 40, 6879–6885. [Google Scholar] [CrossRef]
  20. Tang, H.; Xiao, X.; Tang, W.; Wang, K.; Sun, J.; Li, W.; Yang, G. Effects of winter covering crop residue incorporation on CH4 and N2O emission from double-cropped paddy fields in southern China. Environ. Sci. Pollut. Res. 2015, 22, 12689–12698. [Google Scholar] [CrossRef] [PubMed]
  21. Merbold, L.; Steinlin, C.; Hagedorn, F. Winter greenhouse gas fluxes (CO2, CH4 and N2O) from a subalpine grassland. Biogeosciences 2013, 10, 3185–3203. [Google Scholar] [CrossRef]
  22. Hao, Q.J.; Wang, Y.S.; Song, C.C.; Huang, Y. Contribution of winter fluxes to the annual CH4, CO2 and N2O emissions from freshwater marshes in the Sanjiang Plain. J. Environ. Sci. 2006, 18, 270–275. [Google Scholar]
  23. Kurganova, I.N.; Lopes de Gerenyu, V.O. Contribution of abiotic factors to CO2 emission from soils in the freeze–thaw cycles. Eurasian Soil Sci. 2015, 48, 1009–1015. [Google Scholar] [CrossRef]
  24. Liang, W.; Shu, Y.; Zhang, H.; Yue, J.; Huang, G.H. Greenhouse Gas Emissions from Northeast China Rice Fields in Fallow Season. Pedosphere 2007, 17, 630–638. [Google Scholar] [CrossRef]
  25. Sehy, U.; Dyckmans, J.; Ruser, R.; Munch, J.C. Adding dissolved organic carbon to simulate freeze–thaw related N2O emissions from soil. J. Plant Nutr. Soil Sci. 2004, 167, 471–478. [Google Scholar] [CrossRef]
  26. Mastepanov, M.; Sigsgaard, C.; Dlugokencky, E.J.; Houweling, S.; Ström, L.; Tamstorf, M.P.; Christensen, T.R. Large tundra methane burst during onset of freezing. Nature 2008, 456, 628–630. [Google Scholar] [CrossRef] [PubMed]
  27. Liu, X.; Qi, Z.M.; Wang, Q.; Ma, Z.W.; Li, L.H. Effects of biochar addition on CO2 and CH4 emissions from a cultivated sandy loam soil during freeze–thaw cycles. Plant Soil Environ. 2017, 63, 243–249. [Google Scholar]
  28. Kurganova, I.N.; Lopes de Gerenyu, V.O. Effect of the temperature and moisture on the N2O emission from some arable soils. Eurasian Soil Sci. 2010, 43, 919–928. [Google Scholar] [CrossRef]
  29. Pelster, D.E.; Chantigny, M.H.; Rochette, P.; Angers, D.A.; Laganiere, J.; Zebarth, B.J.; Goyer, C. Crop residue incorporation alters soil nitrous oxide emissions during freeze–thaw cycles. Can. J. Soil Sci. 2013, 93, 415–425. [Google Scholar] [CrossRef]
  30. Bandibas, J.; Vermoesen, A.; Degroot, C.J.; Vancleemput, O. The effect of different moisture regimes and soil characteristics on nitrous oxide emission and consumption by different soils. Soil Sci. 1994, 158, 106–114. [Google Scholar] [CrossRef]
  31. Nyborg, M.; Laidlaw, J.W.; Solberg, E.D.; Malhi, S.S. Denitrification and nitrous oxide emissions from a Black Chernozemic soil during spring thaw in Alberta. Can. J. Soil Sci. 1997, 77, 153–160. [Google Scholar] [CrossRef]
  32. Pankhurst, C.E.; Yu, S.; Hawke, B.G.; Harch, B.D. Capacity of fatty acid profiles and substrate utilization patterns to describe differences in soil microbial communities associated with increased salinity or alkalinity at three locations in South Australia. Biol. Fertil. Soils 2001, 33, 204–217. [Google Scholar] [CrossRef]
  33. Sardinha, M.; Müller, T.; Schmeisky, H.; Joergensen, R.G. Microbial performance in soils along a salinity gradient under acidic conditions. Appl. Soil Ecol. 2003, 23, 237–244. [Google Scholar] [CrossRef]
  34. Pathak, H.; Rao, D.L.N. Carbon and nitrogen mineralization from added organic matter in saline and alkali soils. Soil Biol. Biochem. 1998, 30, 695–702. [Google Scholar] [CrossRef]
  35. Batra, L.; Manna, M.C. Dehydrogenase activity and microbial biomass carbon in salt-affected soils of semiarid and arid regions. Arid Soil Res. Rehabil. 1997, 11, 295–303. [Google Scholar] [CrossRef]
  36. Tang, J.; Liang, S.; Li, Z.; Zhang, H.; Lou, Y.; Wang, J. Effect of freeze–thaw cycles on carbon stocks of saline–alkali paddy soil. Arch. Agron. Soil Sci. 2016, 62, 1640–1653. [Google Scholar] [CrossRef]
  37. Bissett, A.; Abell, G.C.J.; Bodrossy, L.; Richardson, A.E.; Thrall, P.H. Methanotrophic communities in Australian woodland soils of varying salinity. FEMS Microbiol. Ecol. 2012, 80, 685–695. [Google Scholar] [CrossRef] [PubMed]
  38. Lin, X.W.; Wang, S.P.; Ma, X.Z.; Xu, G.P.; Luo, C.Y.; Li, Y.N.; Jiang, G.M.; Xie, Z.B. Fluxes of CO2, CH4, and N2O in an alpine meadow affected by yak excreta on the Qinghai-Tibetan plateau during summer grazing periods. Soil Biol. Biochem. 2009, 41, 718–725. [Google Scholar] [CrossRef]
  39. Zhang, J.B.; Song, C.C.; Yang, W.Y. Cold season CH4, CO2 and N2O fluxes from freshwater marshes in northeast China. Chemosphere 2005, 59, 1703–1705. [Google Scholar] [CrossRef] [PubMed]
  40. Li, H.J.; Yan, J.X.; Yue, X.F.; Wang, M.B. Significance of soil temperature and moisture for soil respiration in a Chinese mountain area. Agric. For. Meteorol. 2008, 148, 490–503. [Google Scholar] [CrossRef]
  41. Zhang, H.; Tang, J.; Liang, S. Effects of snow cover plus straw mulching on microorganisms in paddy soil during winter. Appl. Soil Ecol. 2017, 119, 339–344. [Google Scholar] [CrossRef]
  42. Larsen, K.S.; Jonasson, S.; Michelsen, A. Repeated freeze-thaw cycles and their effects on biological processes in two arctic ecosystem types. Appl. Soil Ecol. 2002, 21, 187–195. [Google Scholar] [CrossRef]
  43. Certini, G.; Scalenghe, R. Soils: Basic Concepts and Future Challenges; Cambridge University Press: Cambridge, UK; New York, NY, USA, 2006; pp. 75–85. [Google Scholar]
  44. Groffman, P.M.; Driscoll, C.T.; Fahey, T.J.; Hardy, J.P.; Fitzhugh, R.D.; Tierney, G.L. Effects of mild winter freezing on soil nitrogen and carbon dynamics in a northern hardwood forest. Biogeochemistry 2001, 56, 191–213. [Google Scholar] [CrossRef]
  45. Bechmann, M.E.; Kleinman, P.J.A.; Sharpley, A.N.; Saporito, L.S. Freeze–Thaw Effects on Phosphorus Loss in Runoff from Manured and Catch-Cropped Soils. J. Environ. Qual. 2005, 34, 2301–2309. [Google Scholar] [CrossRef] [PubMed]
  46. Fuss, C.B.; Driscoll, C.T.; Groffman, P.M.; Campbell, J.L.; Christenson, L.M.; Fahey, T.J.; Fisk, M.C.; Mitchell, M.J.; Templer, P.H.; Durán, J.; et al. Nitrate and dissolved organic carbon mobilization in response to soil freezing variability. Biogeochemistry 2016, 131, 35–47. [Google Scholar] [CrossRef]
  47. Tripathi, S.; Kumari, S.; Chakraborty, A.; Gupta, A.; Chakrabarti, K.; Bandyapadhyay, B.K. Microbial biomass and its activities in salt-affected coastal soils. Biol. Fertil. Soils 2006, 42, 273–277. [Google Scholar] [CrossRef]
  48. Yuan, B.C.; Li, Z.Z.; Liu, H.; Gao, M.; Zhang, Y.Y. Microbial biomass and activity in salt affected soils under arid conditions. Appl. Soil Ecol. 2007, 35, 319–328. [Google Scholar] [CrossRef]
  49. Wichern, J.; Wichern, F.; Joergensen, R.G. Impact of salinity on soil microbial communities and the decomposition of maize in acidic soils. Geoderma 2006, 137, 100–108. [Google Scholar] [CrossRef]
  50. Mamilov, A.; Dilly, O.M.; Mamilov, S.; Inubushi, K. Microbial eco-physiology of degrading Aral Sea wetlands: Consequences for C-cycling. Soil Sci. Plant Nutr. 2004, 50, 839–842. [Google Scholar] [CrossRef]
  51. Xie, J.X.; Li, Y.; Zhai, C.X.; Li, C.H.; Lan, Z.D. CO2 absorption by alkaline soils and its implication to the global carbon cycle. Environ. Geol. 2009, 56, 953–961. [Google Scholar] [CrossRef]
  52. Brummell, M.E.; Farrell, R.E.; Siciliano, S.D. Greenhouse gas soil production and surface fluxes at a high arctic polar oasis. Soil Biol. Biochem. 2012, 52, 1–12. [Google Scholar] [CrossRef]
  53. Wang, W.F.; Chen, X.; Pu, Z.; Yuan, X.L.; Ma, J.L. Negative soil respiration fluxes in unneglectable arid regions. Polish J. Environ. Stud. 2016, 24, 905–908. [Google Scholar] [CrossRef]
  54. Houghton, J.T.; Ding, Y.; Griggs, D.J.; Noguer, M.; van der Linden, P.J.; Dai, X.; Maskell, M.; Johnson, C.A. Climate Change 2001: The Scientific Basis; Cambridge University Press: Cambridge, UK, 2001. [Google Scholar]
  55. Keppler, F.; Hamilton, J.T.; Brass, M.; Rockmann, T. Methane emissions from terrestrial plants under aerobic conditions. Nature 2006, 439, 187–191. [Google Scholar] [CrossRef] [PubMed]
  56. Fey, A.; Conrad, R. Effect of temperature on carbon and electron flow and on the archaeal community in methanogenic rice field soil. Appl. Environ. Microbiol. 2000, 66, 4790–4797. [Google Scholar] [CrossRef] [PubMed]
  57. Zhuang, Q.L.; Chen, M.; Xu, K.; Tang, J.Y.; Saikawa, E.; Lu, Y.Y.; Melillo, J.M.; Prinn, R.G.; McGuire, A.D. Response of global soil consumption of atmospheric methane to changes in atmospheric climate and nitrogen deposition. Glob. Biogeochem. Cycles 2013, 27, 650–663. [Google Scholar] [CrossRef]
  58. Sjogersten, S.; Wookey, P.A. Spatio-temporal variability and environmental controls of methane fluxes at the forest-tundra ecotone in the Fennoscandian Mountains. Glob. Chang. Biol. 2002, 8, 885–894. [Google Scholar] [CrossRef]
  59. Hart, S.C. Potential impacts of climate change on nitrogen transformations and greenhouse gas fluxes in forests: A soil transfer study. Glob. Chang. Biol. 2006, 12, 1032–1046. [Google Scholar] [CrossRef]
  60. Kerbrat, M.; Pinzer, B.; Huthwelker, T.; Gäggeler, H.W.; Ammann, M.; Schneebeli, M. Measuring the specific surface area of snow with X-ray tomography and gas adsorption: Comparison and implications for surface smoothness. Atmos. Chem. Phys. Discuss. 2007, 7, 10287–10322. [Google Scholar] [CrossRef]
  61. Smagin, A.V.; Shnyrev, N.A. Methane fluxes during the cold season: Distribution and mass transfer in the snow cover of bogs. Eurasian Soil Sci. 2015, 48, 823–830. [Google Scholar] [CrossRef]
  62. Wang, Z.P.; Lindau, C.W.; Delaune, R.D.; Patrick, W.H.J. Methane emission and entrapment in flooded rice soils as affected by soil properties. Biol. Fertil. Soils 1993, 16, 163–168. [Google Scholar] [CrossRef]
  63. Denier van der Gon, H.A.C.; Neue, H.U. Methane emission from a wetland rice field as affected by salinity. Plant Soil 1995, 170, 307–313. [Google Scholar] [CrossRef]
  64. Magenheimer, J.F.; Moore, T.R.; Chmura, G.L.; Daoust, R.J. Methane and carbon dioxide flux from a macrotidal salt marsh, Bay of Fundy, New Brunswick. Estuaries 1996, 19, 139–145. [Google Scholar] [CrossRef]
  65. Menéndez, S.; Barrena, I.; Setien, I.; González-Murua, C.; Estavillo, J.M. Efficiency of nitrification inhibitor DMPP to reduce nitrous oxide emissions under different temperature and moisture conditions. Soil Biol. Biochem. 2012, 53, 82–89. [Google Scholar] [CrossRef]
  66. Datta, A.; Santra, S.C.; Adhya, T.K. Effect of inorganic fertilizers (N, P, K) on methane emission from tropical rice field of India. Atmos. Environ. 2013, 66, 123–130. [Google Scholar] [CrossRef]
  67. Smith, N.R.; Kishchuk, B.E.; Mohn, W.W. Effects of wildfire and harvest disturbances on forest soil bacterial communities. Appl. Environ. Microbiol. 2008, 74, 216–224. [Google Scholar] [CrossRef] [PubMed]
  68. Osudar, R.; Matoušů, A.; Alawi, M.; Wagner, D.; Bussmann, I. Environmental factors affecting methane distribution and bacterial methane oxidation in the German Bight (North Sea). Estuar. Coast. Shelf Sci. 2015, 160, 10–21. [Google Scholar] [CrossRef]
  69. Serrano-Silva, N.; Valenzuela-Encinas, C.; Marsch, R.; Dendooven, L.; Alcántara-Hernández, R.J. Changes in methane oxidation activity and methanotrophic community composition in saline alkaline soils. Extremophiles 2014, 18, 561–571. [Google Scholar] [CrossRef] [PubMed]
  70. Chambers, L.G.; Reddy, K.R.; Osborne, T.Z. Short-Term Response of Carbon Cycling to Salinity Pulses in a Freshwater Wetland. Soil Sci. Soc. Am. J. 2011, 75, 2000–2007. [Google Scholar] [CrossRef]
  71. Koponen, H.T.; Flöjt, L.; Martikainen, P.J. Nitrous oxide emissions from agricultural soils at low temperatures: A laboratory microcosm study. Soil Biol. Biochem. 2004, 36, 757–766. [Google Scholar] [CrossRef]
  72. Chapuis-lardy, L.; Wrage, N.; Metay, A.; Chotte, J.L.; Bernoux, M. Soils, a sink for N2O? A review. Glob. Chang. Biol. 2007, 13, 1–17. [Google Scholar] [CrossRef]
  73. Goldberg, S.D.; Gebauer, G. N2O and NO fluxes between a Norway spruce forest soil and atmosphere as affected by prolonged summer drought. Soil Biol. Biochem. 2009, 41, 1986–1995. [Google Scholar] [CrossRef]
  74. Ludwig, B.; Wolf, I.; Teepe, R. Contribution of nitrification and denitrification to the emission of N2O in a freeze-thaw event in an agricultural soil. J. Plant Nutr. Soil Sci. 2004, 167, 678–684. [Google Scholar] [CrossRef]
  75. Zhang, X.R.; Bai, W.; Gilliam, F.S.; Wang, Q.D.; Han, X.; Li, L. Effects of in situ freezing on soil net nitrogen mineralization and net nitrification in fertilized grassland of northern China. Grass Forage Sci. 2011, 66, 391–401. [Google Scholar] [CrossRef]
  76. Khalil, K.; Renault, P.; Mary, B. Effects of transient anaerobic conditions in the presence of acetylene on subsequent aerobic respiration and N2O emission by soil aggregates. Soil Biol. Biochem. 2005, 37, 1333–1342. [Google Scholar] [CrossRef]
  77. Cai, Y.J.; Ding, W.X.; Zhang, X.L.; Yu, H.Y.; Wang, L.F. Contribution of Heterotrophic Nitrification to Nitrous Oxide Production in a Long-Term N-Fertilized Arable Black Soil. Commun. Soil Sci. Plant Anal. 2010, 41, 2264–2278. [Google Scholar] [CrossRef]
  78. Mulvaney, R.L.; Khan, S.A.; Mulvaney, C.S. Nitrogen fertilizers promote denitrification. Biol. Fertil. Soils 1997, 24, 211–220. [Google Scholar] [CrossRef]
  79. Badía, D. Potential nitrification rates of semiarid cropland soils from the Central Ebro Valley, Spain. Arid Soil Res. Rehabil. 2000, 14, 281–292. [Google Scholar] [CrossRef]
Figure 1. Temperatures of the air and soil during the field experiment.
Sustainability 09 01916 g001
Figure 2. The gas sampling equipment in each plot. The base was fixed in the soil. The snow was kept intact as much as possible when the static chamber was placed on the base each time prior to sampling.
Sustainability 09 01916 g002
Figure 3. Snow cover thickness during the field experiment in the four periods. The values were obtained from one of the six experimental fields.
Sustainability 09 01916 g003
Figure 4. Measured mean flux of (A) Carbon Dioxide (CO2); (B) Methane (CH4); and (C) Nitrous Oxide (N2O) in the three rice fields.
Sustainability 09 01916 g004
Figure 5. Measured mean flux of (A) CO2; (B) CH4; and (C) N2O in the three maize fields.
Sustainability 09 01916 g005
Figure 6. Mean flux of (A) CO2; (B) CH4; and (C) N2O during the different periods in the rice fields. Bars indicate standard errors of the means (n = 3).
Sustainability 09 01916 g006
Figure 7. Mean flux of CO2 (A); CH4 (B); and N2O (C) during different periods in maize fields. Bars indicate standard errors of the means (n = 3).
Sustainability 09 01916 g007
Table 1. The physicochemical properties of the soil at a depth of 0–20 cm before gas sampling.
pHSalinity (%)Moisture (%)Bulk Density (g·cm−3)Nitrate−N (mg·kg−1)Total N (g·kg−1)Soil Organic C (g·kg−1)
Rice Field (Silty Loam)R17.60.1628.681.283.872.1122.45
R28.60.2728.351.332.451.7917.58
R39.10.4127.981.341.860.7513.46
Maize Field (Silty Loam)M17.340.1015.931.368.651.8717.23
M27.760.1915.441.297.861.2412.24
M38.430.2515.161.373.360.898.65
Table 2. Cumulative emissions of carbon dioxide (CO2), methane (CH4), and nitrous oxide (N2O) in the rice and maize fields.
Freezing PeriodHard Frost PeriodSnow-Melting PeriodThawing PeriodTotal
CO2 (kg·ha−1)R11103.245.713.0482.61644.5
R2893.746.27.9319.71267.5
R3621.742.27.4220.9892.3
M1425.761.012.6471.6970.8
M2327.758.611.9329.3727.6
M3226.259.99.9232.7528.8
CH4 (g·ha−1)R1638.9−174.8356.0183.51003.7
R2550.7−170.8320.0144.9844.9
R3412.1−182.2270.9109.5610.4
M1−437.1−223.347.0−158.1−771.6
M2−344.4−221.235.2−116.5−646.9
M3−304.4−215.220.1−84.6−584.1
N2O (g·ha−1)R1119.661.8670.8244.01096.1
R296.451.0498.3166.9812.5
R374.949.1327.194.0545.1
M178.6−62.3537.2111.8665.2
M251.7−62.9397.875.8462.5
M332.8−78.4294.041.5289.8
Table 3. Global warming potentials of all fields during winter.
R1R2R3M1M2M3
GWP (kg CO2 eq·ha−1)1996.21530.81070.01149.8849.2600.5
Table 4. Pearson correlation analysis between CO2, CH4, and N2O flux and temperatures during winter.
Temperature LocationR1R2R3M1M2M3
CO2Surface Soil0.840 **0.784 **0.789 **0.927 **0.923 **0.929 **
15 cm Depth0.401 **0.336 **0.341 **0.708 **0.682 **0.693 **
CH4Surface Soil0.361 **0.339 **0.308 *−0.602 **−0.552 **−0.463 **
15 cm Depth0.309 *0.295 *0.313 *−0.151−0.1010.003
N2OSurface Soil−0.182−0.187−0.182−0.217−0.22−0.224
15 cm Depth0.1640.1440.1350.1180.1130.111
Note: * significant at the 0.05 level; ** significant at the 0.01 level.

