Article

The impact of Lighting on Vandalism in Hot Climates: The Case of the Abu Shagara Vandalised Corridor in Sharjah, United Arab Emirates

Department of Architectural Engineering, College of Engineering, University of Sharjah, P.O. Box 27272, Sharjah, UAE
*
Author to whom correspondence should be addressed.
Sustainability 2017, 9(11), 2040; https://doi.org/10.3390/su9112040
Submission received: 17 September 2017 / Revised: 30 October 2017 / Accepted: 30 October 2017 / Published: 7 November 2017
(This article belongs to the Special Issue Climate Change Mitigation and Adaptation - ZEMCH 2016)

Abstract

:
This study mainly discusses how the immature behaviour of a part of the society, resulting in vandalism, affects the building aesthetics and design features in the districts of the city of Sharjah, in the United Arab Emirates (UAE). Initially explaining the term “vandalism” in itself, this study goes on to debate on the reasons behind vandalism, its different types, and its effects on the environment. Throughout the discussion, studies of the relationship between vandalism and reflectivity are examined, considering how the characteristics and features of the buildings affect vandalism. Three methodology tools were used: a questionnaire, an Integrated Environmental Solution Virtual Environment (IESVE) software program, and illuminance measurements. Simulation scenarios of the current situation of Abu Shagara were performed, which took into account several options with respect to wall material, flooring material, and types of lighting. All in all, ten simulation cases were conducted and compared, which allowed the identification of the best simulation scenario. The type of lighting had a greater impact on the simulation scenario results than the type of wall and flooring materials. The type of lighting varied as per its polar grid and light distribution.

1. Introduction

Vandalism is generally defined as the wilful or malicious destruction, injury, disfigurement, or defacement of property [1]. Graffiti is included as a type of vandalism in a community, since it degrades the social status of the community and diminishes the value of the properties [2]. A study conducted by Mushtaha et al. [3] recognized three main factors for the enhancement of vandalism in different housing areas, namely, the housing ecology, the social features of the residential systems, and the management system. Different studies have focused on diverse determinants regarding the structure and design of the spaces in the housing societies, particularly the perspective of visibility via dwellings' windows and the accessibility by the habitants. The perspective of visibility and the perception of accessibility were also evaluated to enhance and strengthen the perception of property and ownership in youngsters involved in vandalism.
People engage in the crime of vandalism when they purposely damage the property of others without their permission. Even though, to some citizen’s view, graffiti is an artistic expression that can be seen through nature, it is still considered an illegal act that is punishable by law. Graffiti art, billboard emancipation, and crop circles are a few of the common examples of vandalism. Criminal vandalism comes in different forms. Many gang cultures use graffiti in the public properties of inner cities as a means of marking their territories. In the United States of America, the local governments have taken drastic legal measures to prevent it. However, according to research, such legal act has proven to be ineffective [4]. The products of vandalism are usually seen on building structures, street signs, billboards, tunnels, bus stops, cemeteries and other public spaces [5]. Vandalism that is left unpunished encourages people to persevere with it. In criminological research, it has been proved that vandalism is caused by different motives. According to the sociologist Stanley Cohen [6], there are six different types of vandalism, including the acquisitive vandalism, the peer pressure, and the vandalism motivated by the coolness of disobeying authority. Other types of vandalism are the tactical vandalism, the ideological vandalism, the vindictive vandalism, the pay vandalism, and the malicious vandalism [6].
The relationship between lighting and vandalism has not yet been highlighted by any research, though the topics of lighting and safety have been mentioned. Peña-García et al. [7] indicated that the main objective of public lighting is to ensure the safety of people, property, and goods. The impact of public lighting on pedestrians’ well-being and perceived safety was studied by focusing on two basic aspects: (i) the average illuminance on the ground; (ii) the colour of the lights. The goals were achieved by conducting a survey in the street while the lighting was working, as well as by using illuminance measurements. Lighting design guidelines were introduced at the end of the study for lighting designers, urban planners, and especially city administrators as a way to enhance the safety and well-being of the citizens.
Abd-Razak et al. [8] investigated safety and lighting within two Malaysian universities’ campuses by conducting a questionnaire without lux measurements. Based on the feedbacks received from the students, the study found that there were several unsecured locations in the campuses, like roads, walkways, and parking areas. These locations were considered as the most risky areas because they received less illumination compared to other locations in the campuses.
It seems clear that increased street lighting reduces the fear of vulnerability to criminal action in city residents, regardless of age or gender [9]. Peña-García et al. [7] indicated that this is an extremely complex problem that underscores the controversy regarding illuminance levels and safety.
In urban planning, lighting has become a topic of active debate with regard to safety, the vitality of social relations, and energy consumption. Urban lighting is defined as “the totality of all lighting in a city’s public realm”, and it includes street lighting as well as light from advertising, building interiors, or other artificial sources. A successful public realm allows interactions between people, enhances the economic vitality, and stimulates investments [10].
The function and role of urban lighting are based on the feelings of safety that a space provides at nighttime [11]. This study introduced new ways to improve community street lighting using the approach of Crime Prevention through Environmental Design (CPTED) in three Korean communities. It proposed design alternatives for community street lighting to enhance natural surveillance and the feelings of safety. To find ways for enhancing community safety at night, the study considered lighting standards and CPTED guidelines, using Relux Pro for a simulation analysis.
The authors of the present study believe that light not only enhances safety in a city, but also reduces vandalism because it allows a strong surveillance. As there has been no specific study so far to investigate the impact of lighting levels on vandalism, the present study intends to overcome this deficiency.
In order to enhance the lighting levels in a vandalised corridor and to analyse the resulting effects on vandalism, several space simulations corresponding to 10 alternatives, with different materials and lighting fittings, were performed in this study. This study was conducted in a vandalised corridor in the city of Sharjah (Figure 1). First, the study covers a theoretical discussion that links vandalism and lighting; next, in Section 2, it describes the study area, the written questionnaire that was used (Appendix A), the illuminance measurements, the measuring tape, and the IESVE as a simulation tool; later, in Section 3, titled “Investigated Area and Analysis”, it suggests several lighting alternatives to improve the lighting levels in the vandalised corridor, and presents the results of the simulations. Finally, the “Simulation Results” section analyses each case separately and compares it with the baseline of the study and with previously described cases.

1.1. Local Standards for Street Lighting

National codes were considered as a reference and guidance for lighting alternatives, using the IESVE software package, 2017 version, for simulation. National codes stated that urban centres and public amenity areas are used by pedestrians, cyclists, and drivers. In such places, the lighting of the road surface for traffic movement is neither the main consideration, nor the only consideration, because the functions of lighting in urban centres and public amenity areas are concerned with the improvement of public safety and security, as well as with the attractiveness of the night-time environment. To fulfil these functions, a master plan should be produced to realize some or all of the objectives, which include: providing safety for pedestrians between the moving vehicles, deterring anti-social behaviour, ensuring a safe movement of vehicles and cyclists, matching the lighting design and equipment to the architecture and environment, controlling illuminated advertisements and integrated floodlighting (both permanent and temporary), illuminating the roads and the directional signs, blending light from private and public sources, limiting light pollution, and protecting lighting installations from vandalism. This list of objectives and the individual nature of each site ensure that there is no standard method of lighting urban centres and public amenity areas, nor any universally applicable recommendations. What can be given are some general recommendations for the illuminance to use in cities and town centres, although even these may need to be adjusted for a particular site, depending on the ambient environment, street parking, etc. The lighting recommended for crosswalks, pedestrians, or cyclists is greater than 15 lux [12]. In accordance with lighting installation regulations [13], and Peña-García et al. [7] stated that the average illuminances for the five streets examined in their studies should all be above 15 lux. Therefore, in this study, the authors will provide alternatives based on these references.

1.2. Significance of the Study

All elements of a lighting installation contribute to the architecture or the exterior design of a space, area, street, and/or facility. When deciding what sort of lighting to employ, the understanding of the use of space is important. The dimensions, finishes, textures, and colours of the luminaires, lit and unlit, should be considered if the desired atmosphere is to be achieved [12]. Farrington et al. [14] stated that improved street lighting could reduce crime by up to 20% and, thus, it is an important factor in safety. Blöbaum et al. [15] published results showing that low lighting conditions may reduce the feelings of safety and provide opportunities for vandals. Providing enough light in cities’ corridors relaxes the communities and improves surveillance, which in turn reduces vandalism. Herein, the main aim of this study is to explore alternatives of lighting fittings, taking into consideration different wall and flooring materials, in order to achieve acceptable lighting levels for the studied case, which would aid in avoiding any possible vandalism.

1.3. Objectives of the Study

The aim of this study is to discuss how the immature behaviour of a part of the society, resulting in vandalism, affects the building aesthetics and design features in the districts of Abu Shagara, in the Emirate of Sharjah, UAE. The main objectives of this study are:
  • To investigate the main effects of vandalism in the Abu Shagara corridor in relation to lighting.
  • To investigate the effect of lighting and surface materials on the vandalised areas.
  • To investigate the impact of different lightings and different wall and flooring materials on the corridor.
Accomplishing these studies would assist in the development of decisions regarding the methods of improving built environments, especially in the Abu Shagara corridor.

2. Approach and Methodology

The choice of vandalism as a problem to investigate was due to the reason that vandalism is currently common, especially in the areas inhabited by the younger generations. Vandalism plays an important role in the destruction of properties and in street crimes.

2.1. Research Design

Both quantitative and qualitative research approaches were used to evaluate the study outcomes. Various methodology tools were used to collect crucial information for the study. It is important to gain insight into what the public thinks about such an act, and, therefore, surveying people would benefit the study. The methodology tools used were: (1) a questionnaire-based survey, (2) an integrated building performance analysis using the Integrated Environmental Solutions Virtual Environment (IESVE) software package, (3) illuminance measurements. Figure 1 and Figure 2 show the locations of the two sites where the study was conducted.
The vandalised corridor A (Figure 2a) was compared to the non-vandalised corridor B (Figure 2b); in addition, IESVE simulations were run in order to identify solutions to prevent acts of vandalism in corridor A. In these examples, lighting would prevent vandalism, as suggested by the absence of lighting in corridor A, as can be seen in Figure 2. In this case, a lit-up space was not a comfortable space to perform the act of vandalism.

2.2. Participants in the Questionnaire

In the study, a questionnaire-based survey was conducted aiming to collect crucial information from residents of Abu Shagara, in Sharjah city. The survey included seven questions (Appendix A) that were answered by 44 randomly chosen pedestrians who were roaming around corridor A in Abu Shagara. The objective of the questionnaire was to directly understand the relationship between the respondents’ satisfaction with the illuminance levels and their sense of safety. The survey is shown in Appendix A. In November, for a period of two days from Tuesday to Wednesday, two female students collected data around 6:30 p.m., after the lighting was turned on in the corridor. Data collection ended around 8:00 p.m., i.e., when the number of male pedestrians increases for the daily prayer, and before the number of female pedestrians is reduced. The choice of the two corridors A and B in this study was based on their similarity in social aspects and in their layout. The selected corridors A and B are located beside Abu Shagara Park, which is located within a residential area of Sharjah city.
The majority of the respondents were females, with an approximate percentage of 68%. Lorenc et al. [9] stated that increased lighting plays a role in minimizing the fear of criminal actions among pedestrians in residential areas, regardless of their gender and age. The majority of respondents agreed to increase the number of luminaires and the light levels in the corridor to avoid vandalism (score of 4.8) and to facilitate manoeuvres through the corridor (score of 3.43), but reported that they still felt stressed when walking through the corridor (score of 2.89). Also, they showed their dissatisfaction on the present lighting levels, as well as on the visibility in this corridor (scores of 1.57 and 2.25, respectively). Table 1 shows the average response scores for each question of the survey.

2.3. Integrated Building Performance Analysis

The IESVE, Integrated Environmental Solutions Virtual Environment, is a program to evaluate and improve buildings in terms of energy, light, ventilation, shade, carbon, lifecycle costs, occupant safety, and economics. We started by drawing the 3D geometry of the existing buildings and corridors and by selecting the city location in the database of IESVE, which takes also climate into consideration when running the software. Second, we selected alternatives for corridors’ flooring and wall materials, as well as for electric lamps to achieve better lighting levels in the corridors. The simulation considered the illuminance levels, in lux, as an indicator of the lighting levels. Thirdly, we compared the simulation results for the proposed alternatives among each other and always with the baseline case. Finally, the simulation identified several cases with different inputs that achieved better lighting.

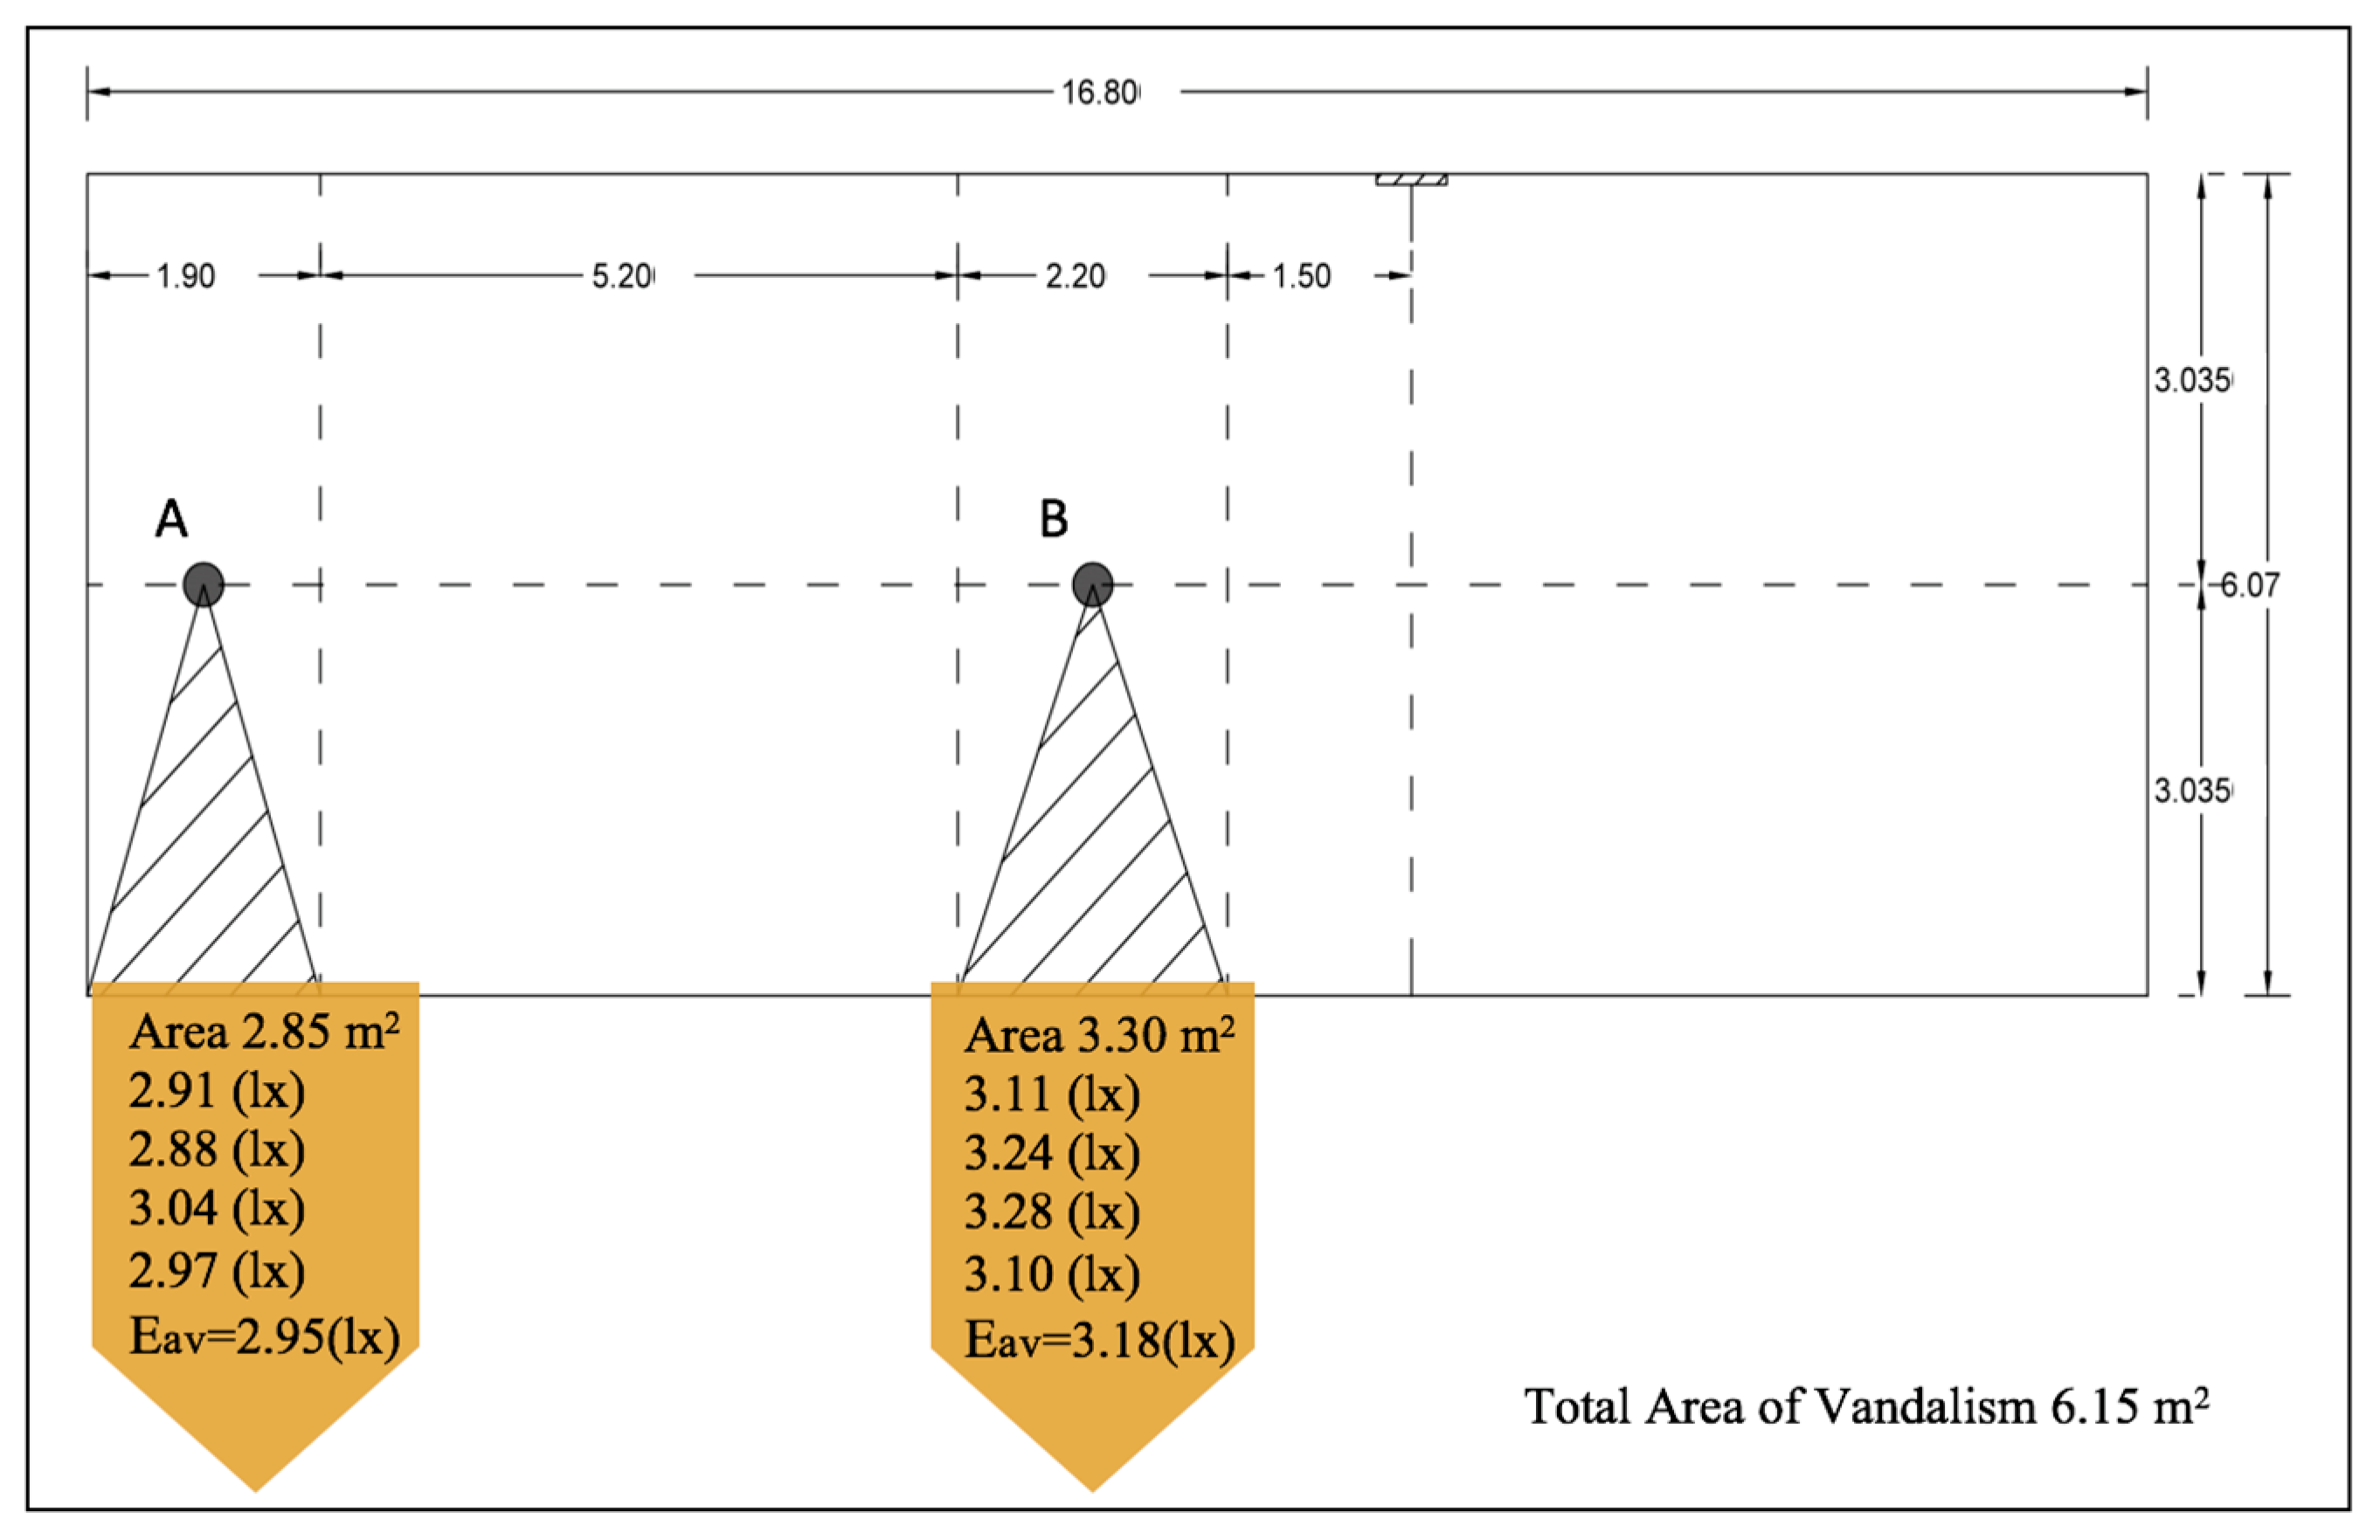
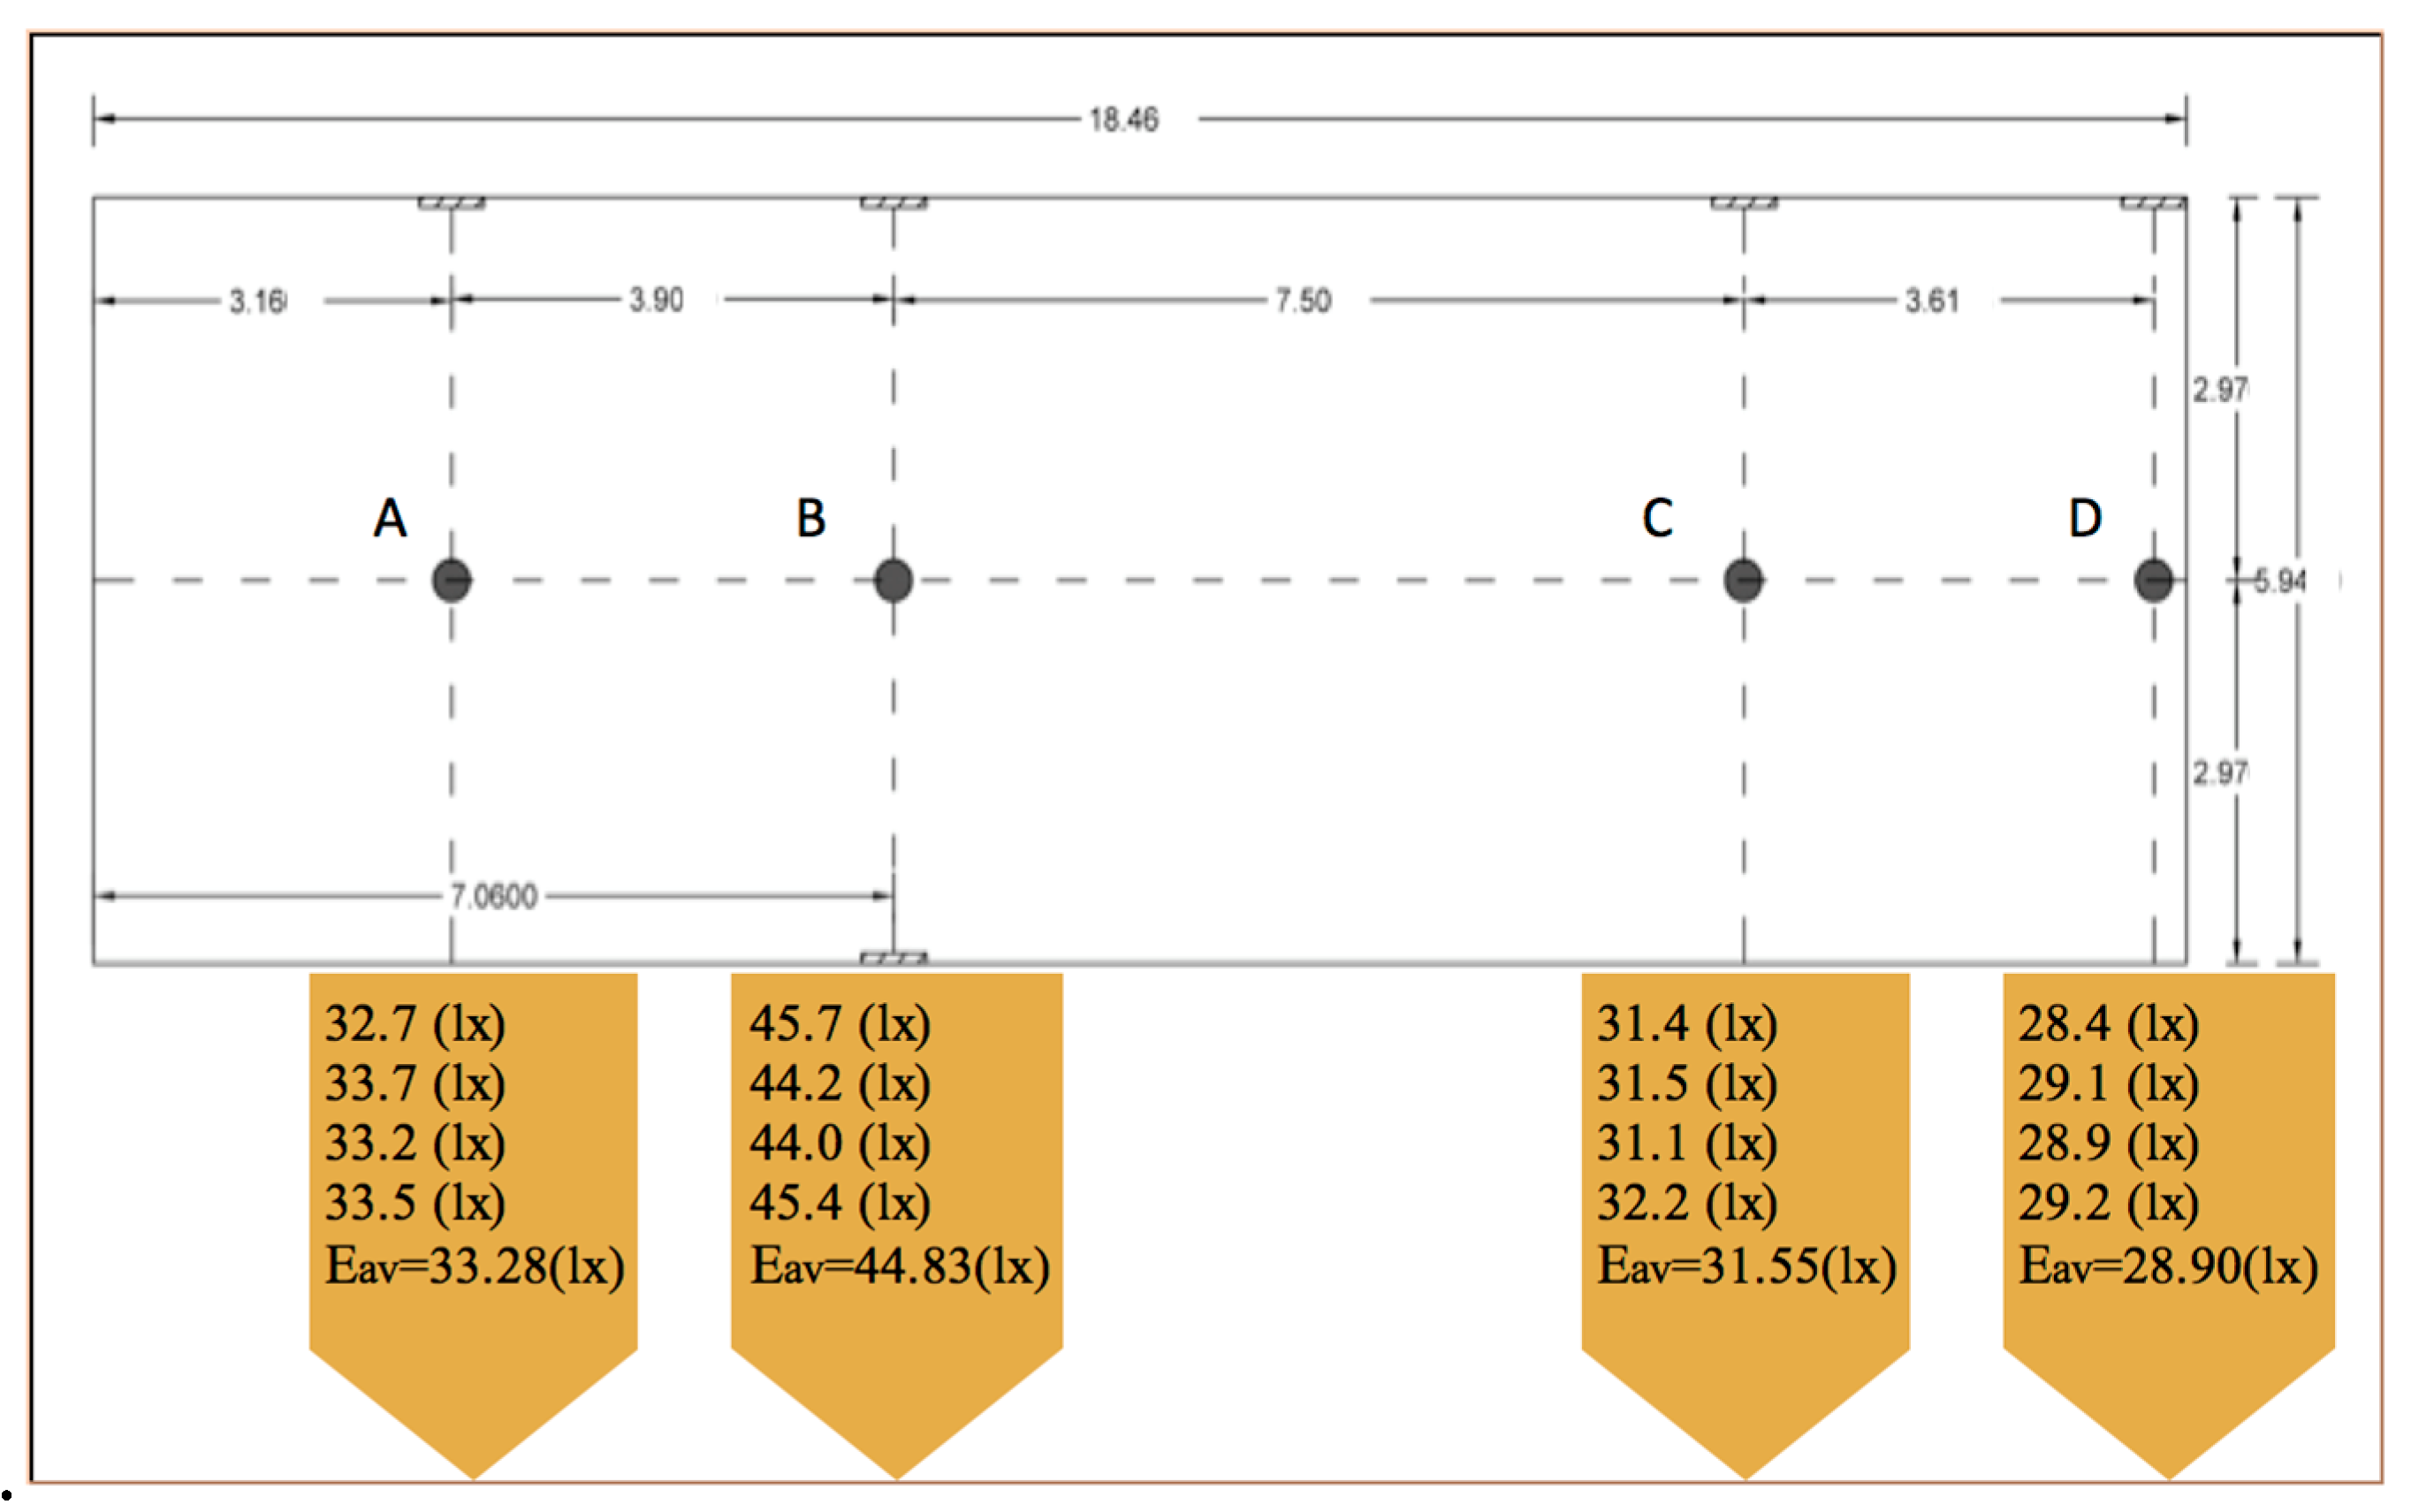
2.4. Illuminance Measurements and Measuring Tape

Illuminance measurements evaluate the illumination of a specific location resulting from the light hitting it, by performing lux measurements [16]. In this study, illuminance measurements were performed by measuring the lux levels in a designated area and by subsequently verifying the results of the IESVE software. The measurements of the lighting differences between the two corridors were our main focus. Further measurements for the vandalised areas in the examined corridor were also performed in this study. At the same time, the illuminance measurements were used to calculate the lux levels in the corridors in order to compare the differences in lux levels. Corridor A was vandalised in two wall areas (Figure 3). The points labelled in the corridor represent the maximum distance for a visitor to vandalise a wall and be seen by a passing visitor (Figure 4). The shaded area is the area vandalised in the corridor. Corridor A consists of two vandalised areas, one area of 2.85 m2 and the other of 3.3 m2. Therefore, the total area vandalised in the corridor is of 6.15 m2. The lux level of each vandalised area was measured in the middle using the illuminance measurements. Four reading trials were conducted for each area, and the average lux level of points A and B were approximated to 2.95 and 3.18 lux, respectively.
Corridor B is not affected by vandalism; points for measurements were established in the middle of the corridor based on the lamp positions. The lux level was calculated at each point in four readings to calculate the average lux values (Figure 5). Readings of A, B, C, and D were 33.28, 44.83, 31.55, and 28.9, respectively. Because this corridor receives light from the surrounding shops, no vandalised areas are seen in the corridor, differently from corridor A.

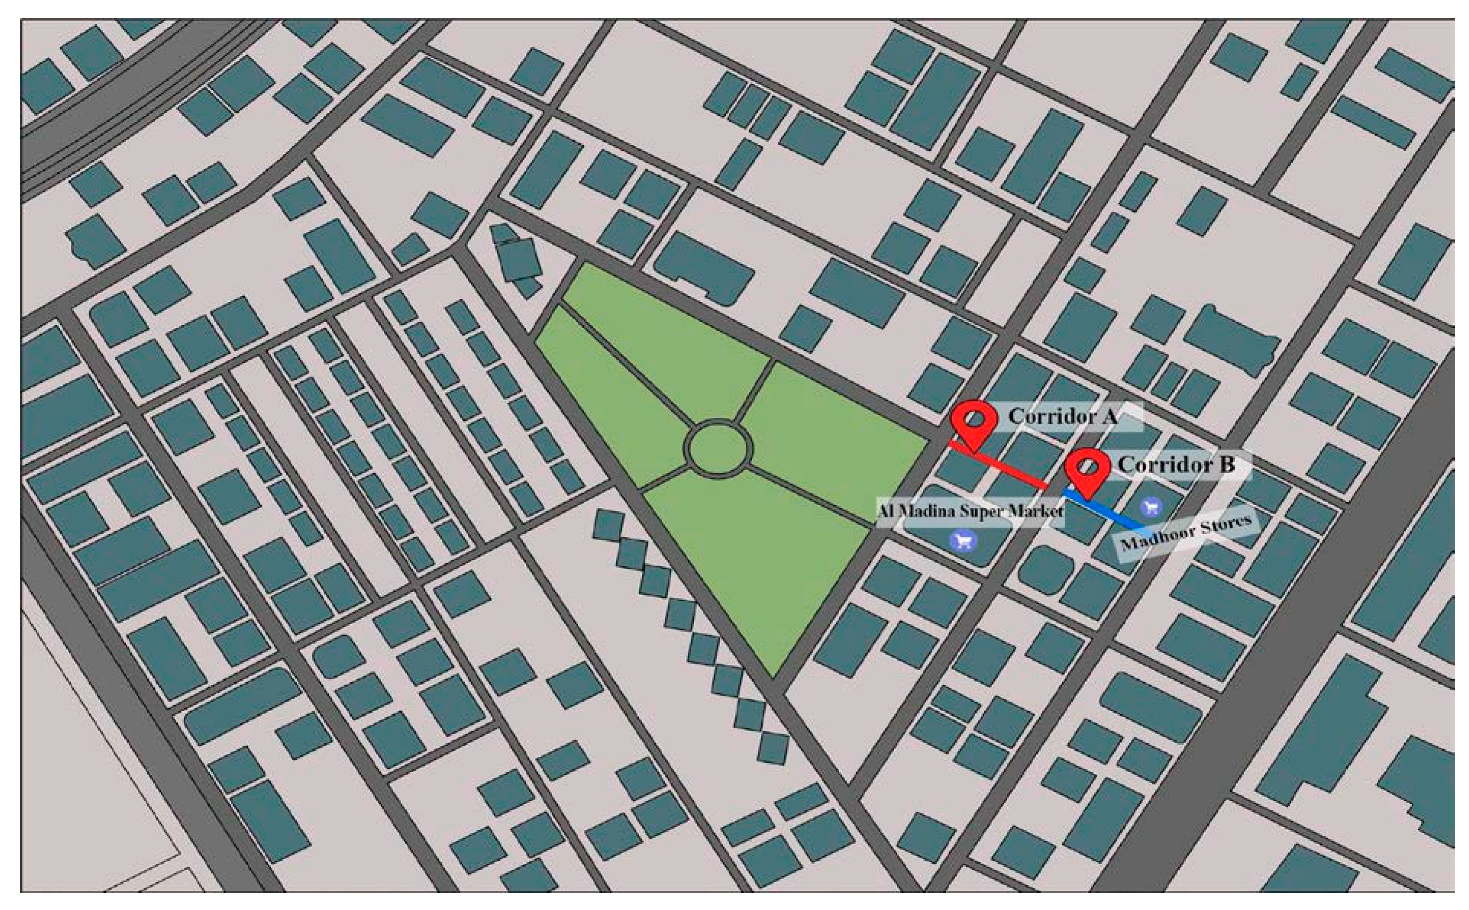
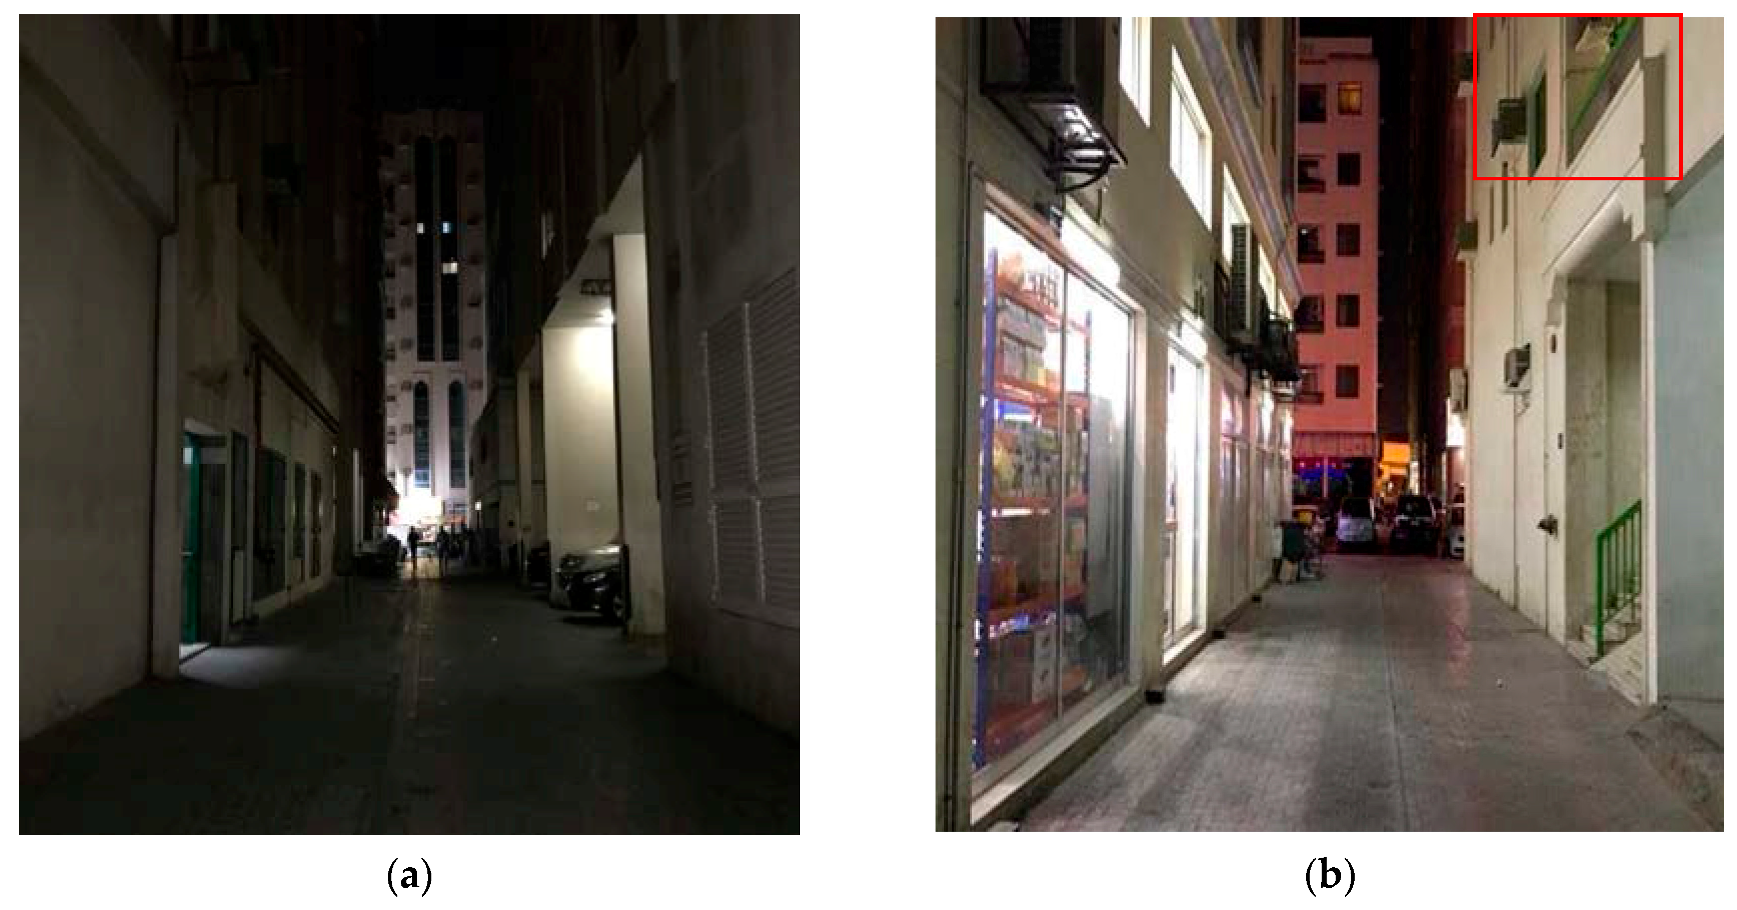
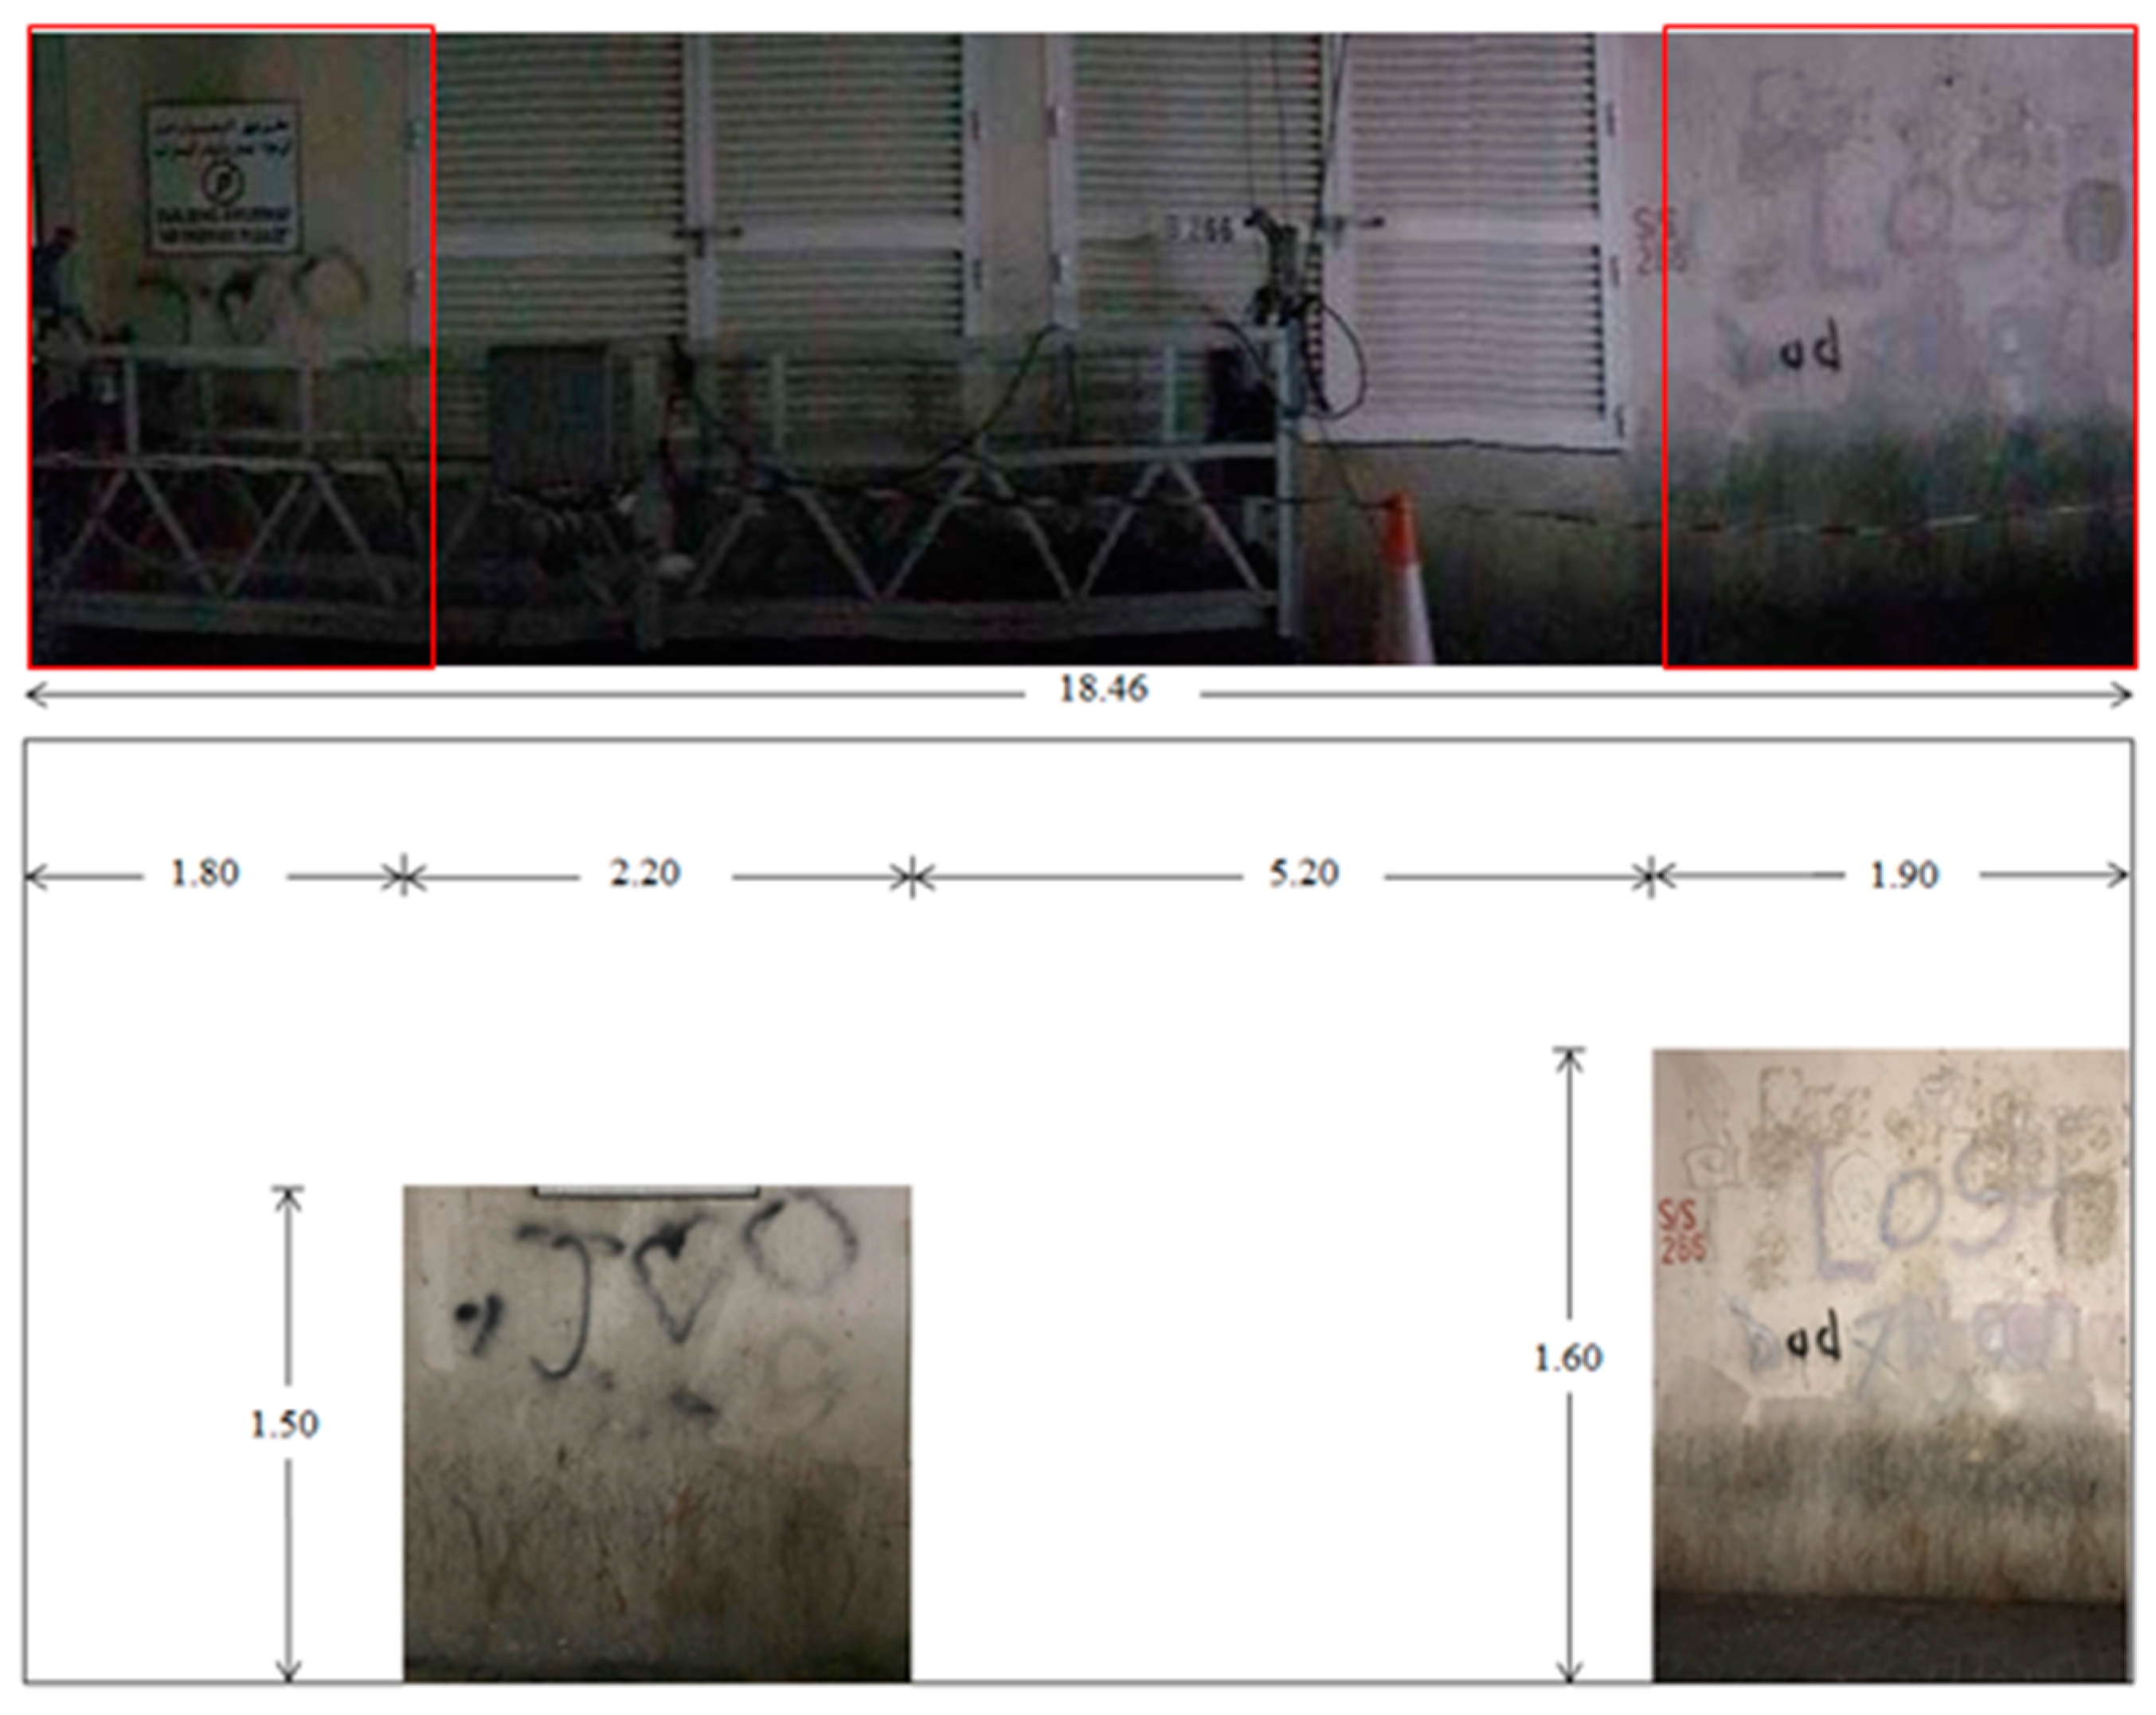
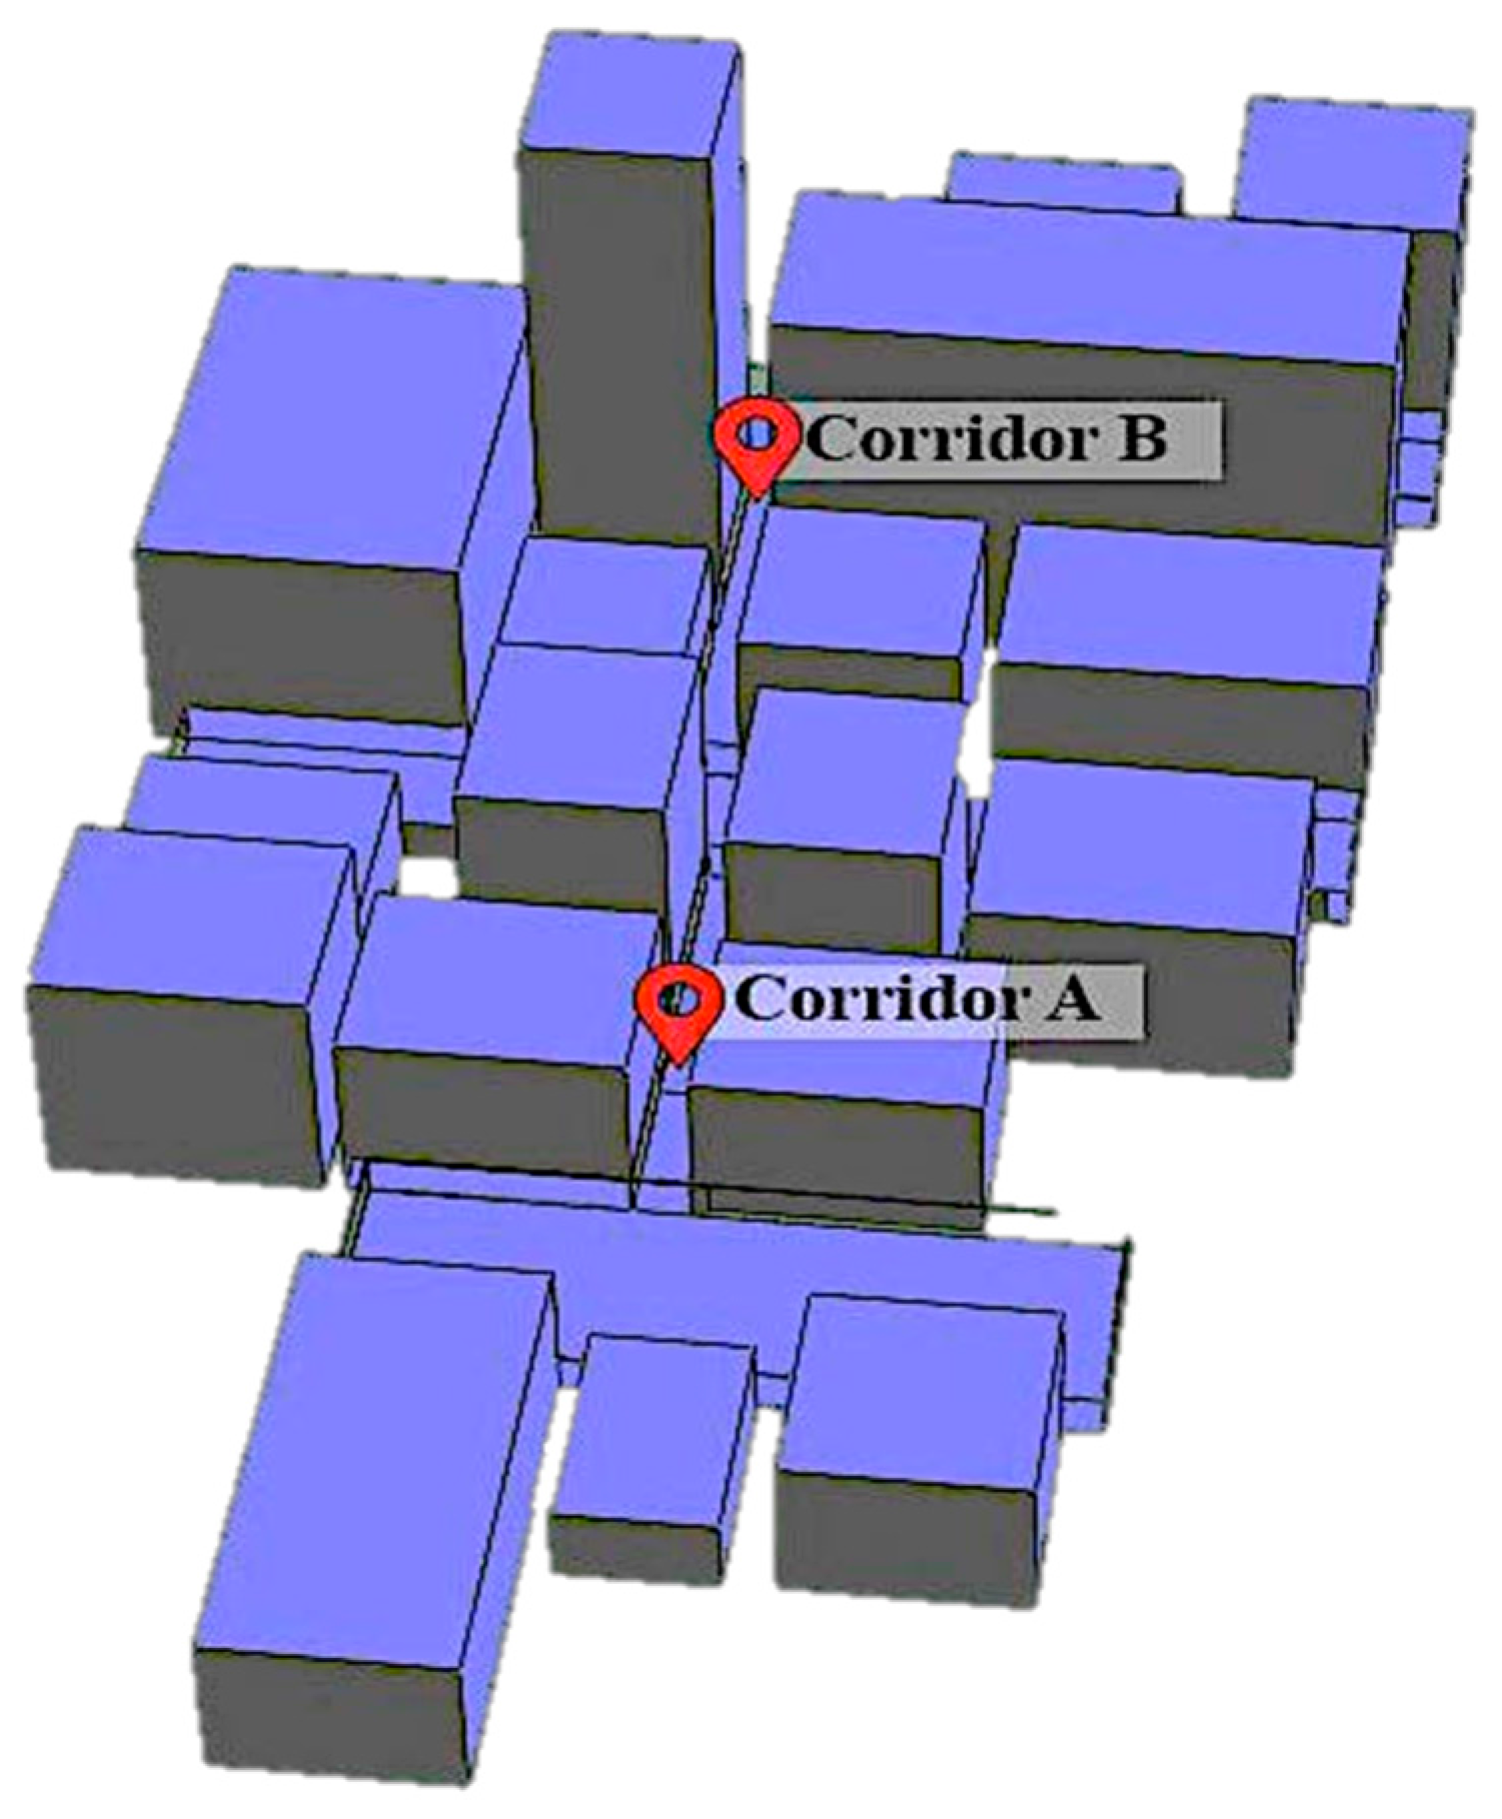
3. Investigated Area and Analysis

3D modelling of the investigated area of Abu Shagara, which considered the current conditions of the two corridors A and B, was created through the IESVE software (Figure 6). After running the simulation, the results showed the same lux levels measured on site using illuminance measurements (Figure 4). Moreover, the simulation showed lux levels lower than 3 lux (Figure 4), i.e., lower than the local standards explained in Section 1.1. This led to vandalism in corridor A, encouraged by the insufficient illuminance, as opposed to corridor B that is exposed to sufficient illuminance. The horizontal illuminance is the criterion determining the safety of movement for pedestrians on the road, and the vertical illuminance and semi-cylindrical illuminance are the criteria governing the ability of facial recognition [11]. Therefore, vandals can pass through a space lacking sufficient illuminance and vandalize community assets, for example with graffiti.

Corridor A—Vandalised

The current conditions of corridor A were recreated on the IESVE software. A simulation was conducted using the same lux levels measured on the site using illuminance measurements, as illustrated in Figure 4. The simulation showed lux levels lower than 3 lux (Figure 7). Likewise, the current conditions of corridor B were recreated on the IESVE software package following the same lamp design distribution as that on the site, as shown in Figure 5. The lux levels of corridor B, determined by the simulation, were similar those measured on the site, i.e., ranging between 25 to 45 lux (Figure 8).

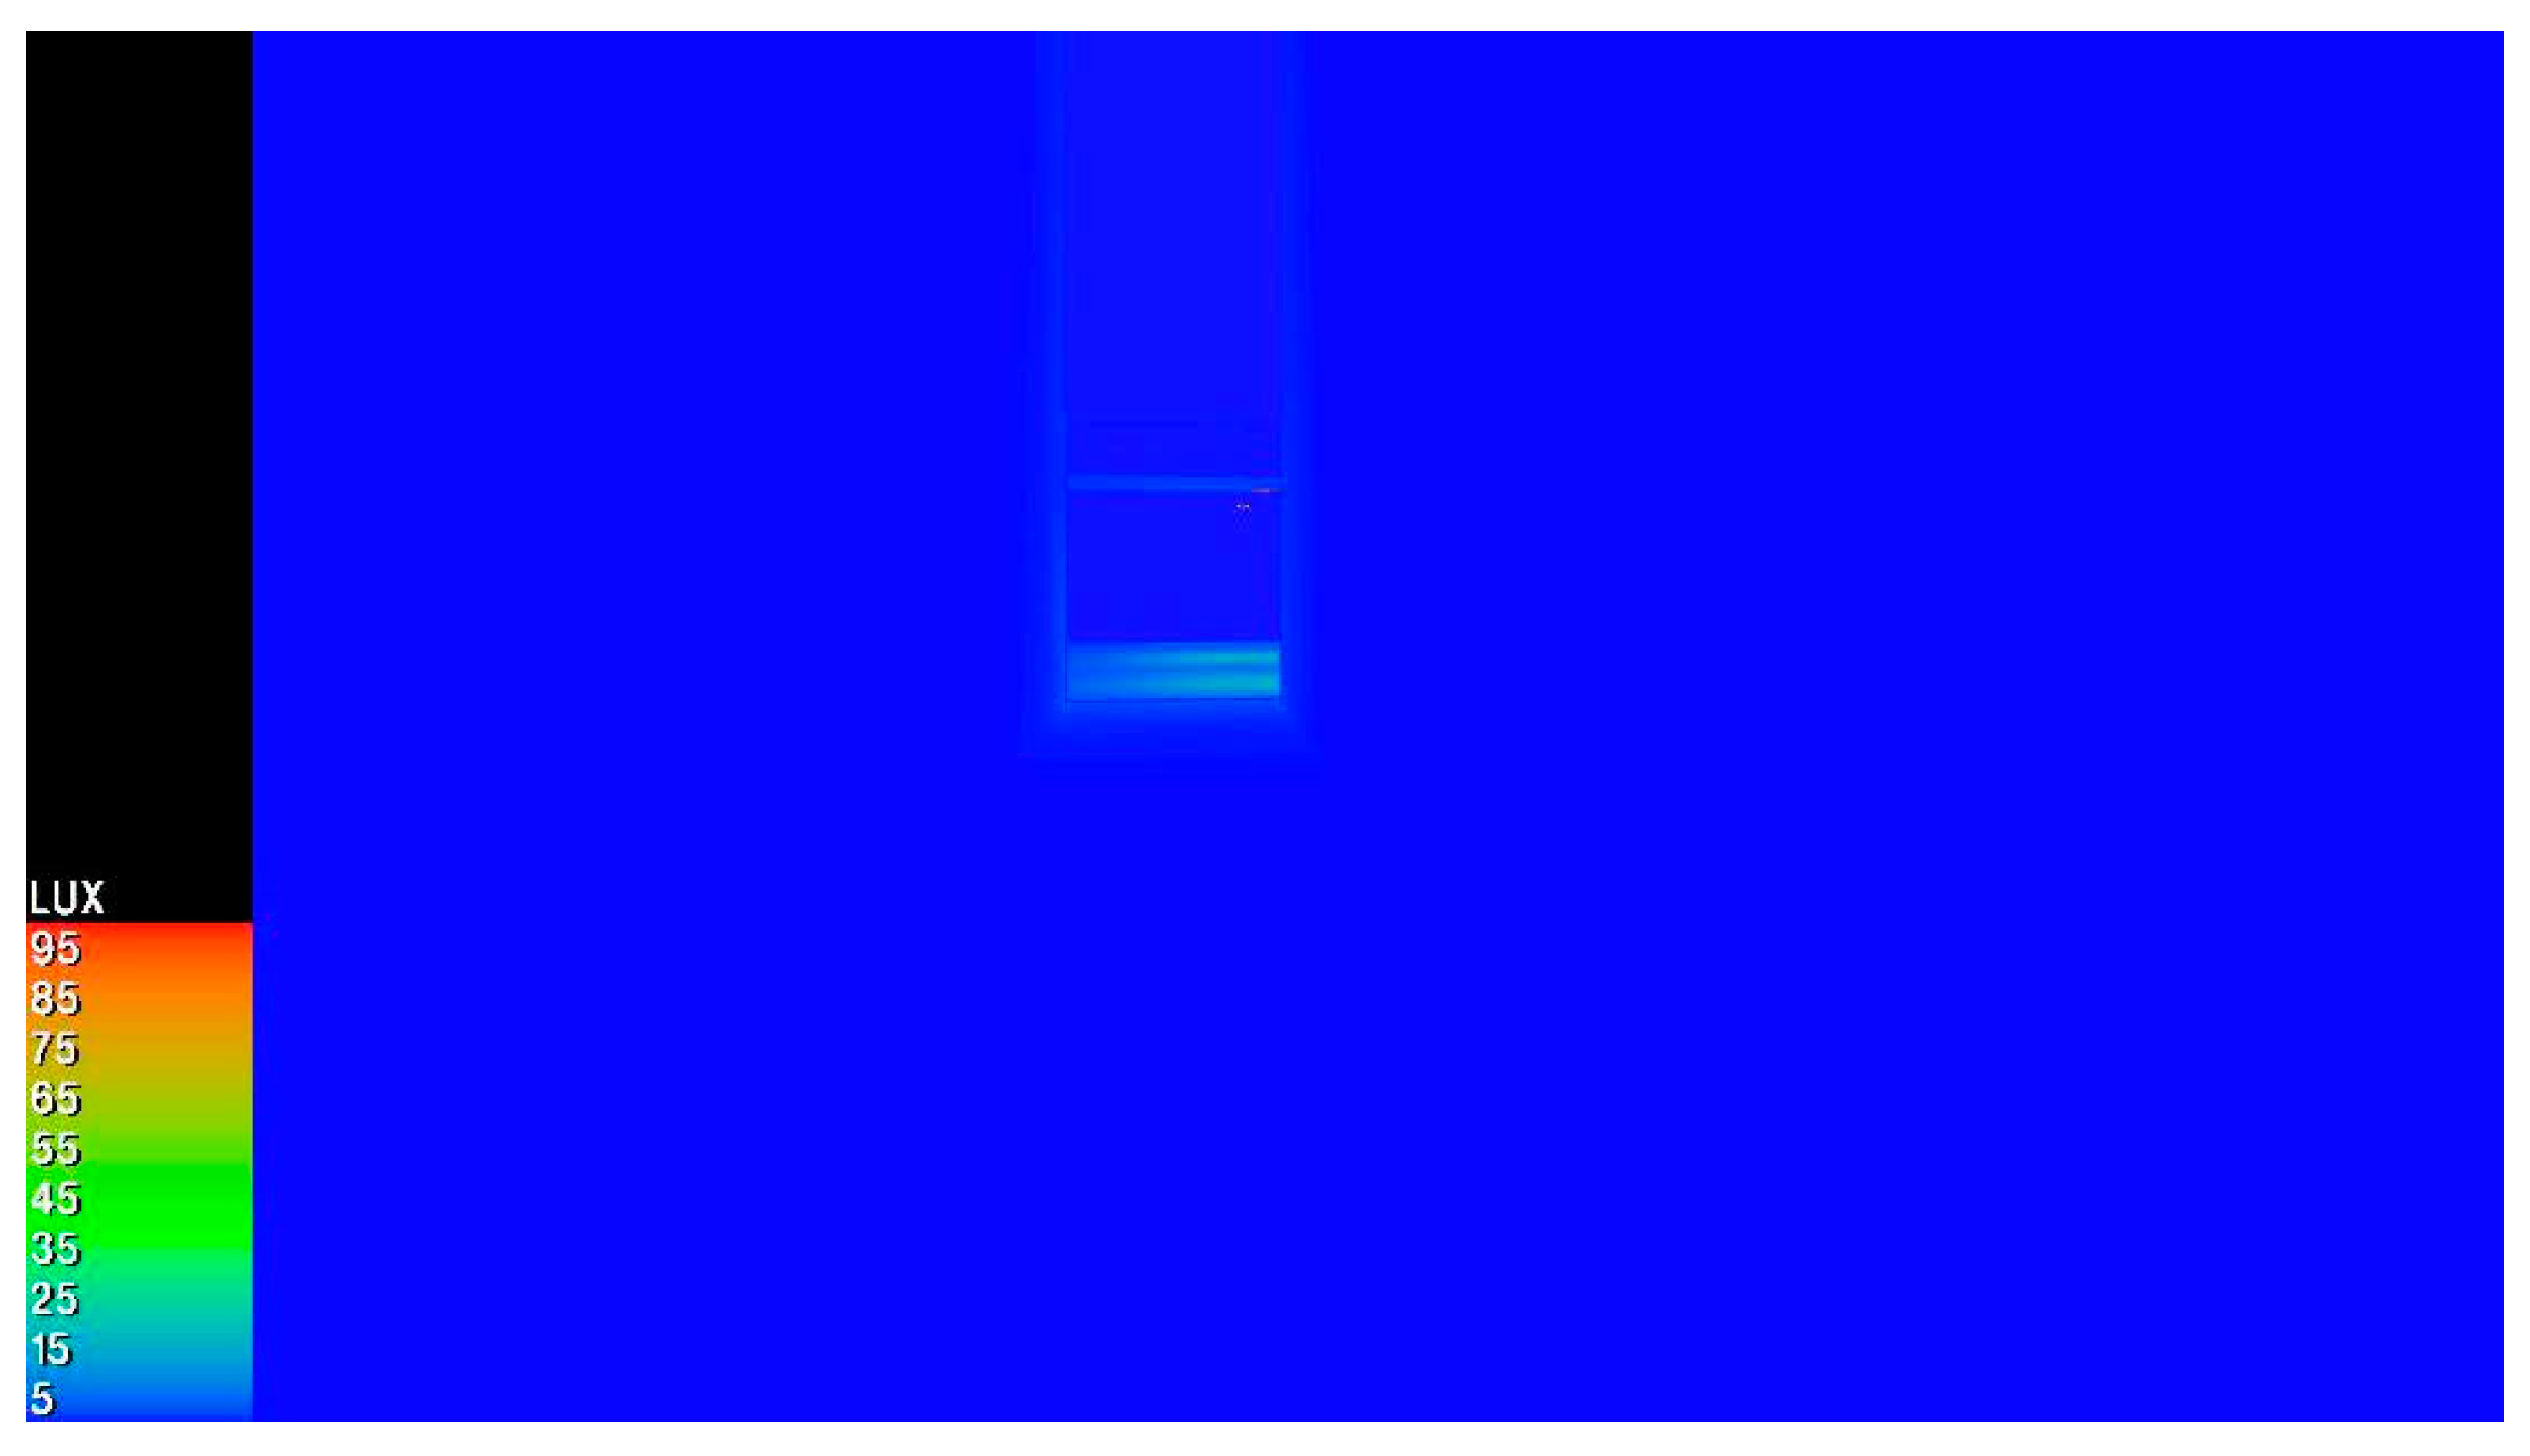
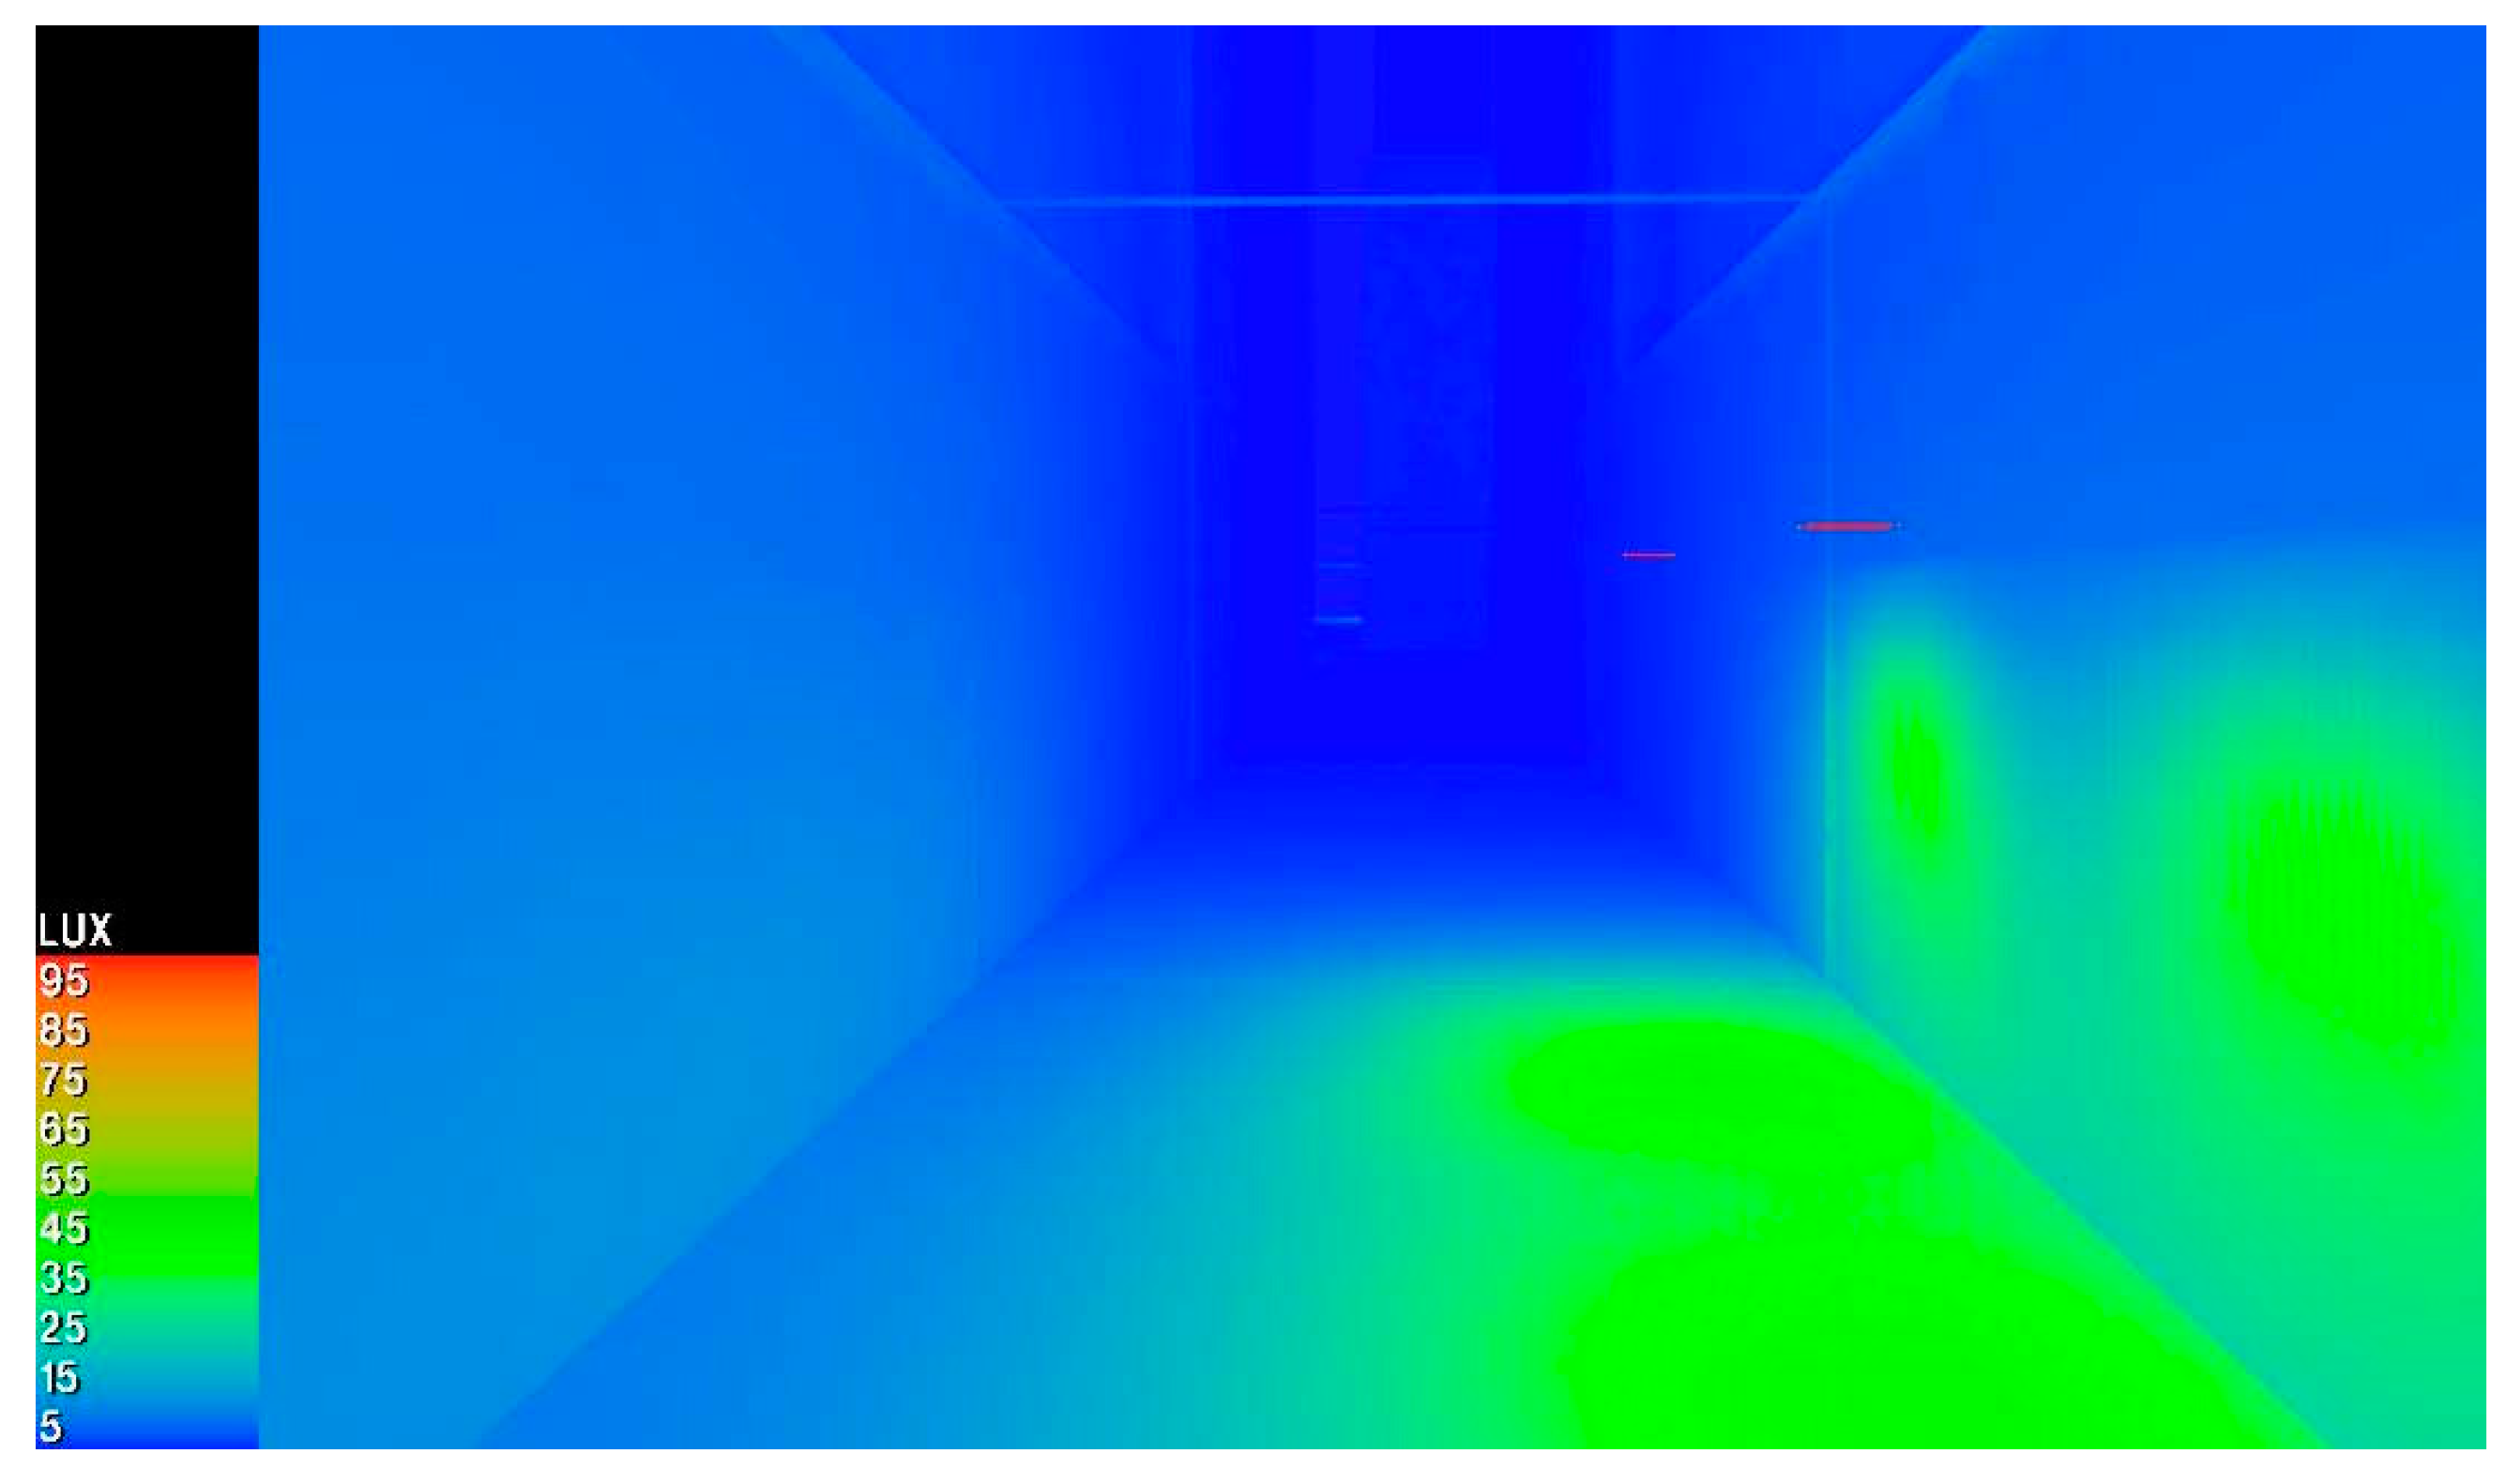
4. Simulation Cases and Results

Ten cases were analysed based on the comparison between the two corridors and the IESVE simulation of their current situation in terms of luminance. Table 2 illustrates the first four cases and the parameters covered in the simulation, as well as the materials used for parameters 2 and 3.

4.1. Case 1—Lighting Installation

This simulation consisted in installing lightings in corridor A based on the lightings used in corridor B and in analysing their impact on the corridor, the illuminance distribution, and the lux levels. The illuminance simulation showed that the resulting lux levels ranged from 25 to 45, differing from one wall of the corridor to the other, as illustrated in Figure 9 and Figure 10. This huge increase in corridor A lighting showed how corridor A is uninviting in its current illumination conditions. The exposure of corridor A to the street increased when the lux levels in it increased, which would aid in avoiding vandalism.

4.2. Case 2—Flooring Material and Lighting Installation

This simulation consisted in installing in corridor A flooring material and lightings similar to those used in corridor B and in testing the effects of the flooring material and the lighting type on illuminance. The illuminance simulation showed that the resulting lux level ranged from 35 to 55, varying from one wall to the other, as illustrated in Figure 11 and Figure 12.
These results showed that higher lux levels were achieved compared to case 1, which, therefore, indicate that changing the flooring material along with adding lighting fixtures enhance the corridor’s exposure to the street.

4.3. Case 3—Wall Material and Lighting Installation

This simulation consisted in installing in corridor A wall materials and fluorescent lightings similar to those present in corridor B. The analysis of the impact of the wall materials and the lighting on corridor A illuminance showed that the resulting lux level ranged from 35 to 55, varying from one wall to the other, as illustrated in Figure 13 and Figure 14.

4.4. Case 4—Wall Material, Flooring Material and Lighting Installation

This simulation consisted in installing in corridor A wall and flooring materials, as well as fluorescent lightings similar to those present in corridor B and in analysing their impact on corridor A illuminance. The illuminance simulation showed that the resulting lux levels ranged from 35 to 55, varying from one wall to the other, as illustrated in Figure 15 and Figure 16.
By comparing the results of the four simulations, it was found that the impact of the different parameters on the corridor illuminance differed slightly in lux levels. Therefore, when combining cases 1, 2, and 3, as it was done in case 4, the resulting impact on illuminance was slightly different compared to that measured in each of the single cases, as shown in Figure 15 and Figure 16 for case 4. It was shown that the lighting had a greater impact on the lux levels and lux distribution than the surface materials. For this reason, different IESVE illuminance simulation analyses on different lightings were conducted in order to determine the most convenient lighting type in terms of lux levels and lux distribution (Table 2). Figure 17, Figure 18, Figure 19, Figure 20, Figure 21 and Figure 22 illustrate the photometric polar diagrams of the lighting types L1, L2, L3, L4, L5, and L6, for which IESVE illuminance simulations were performed.

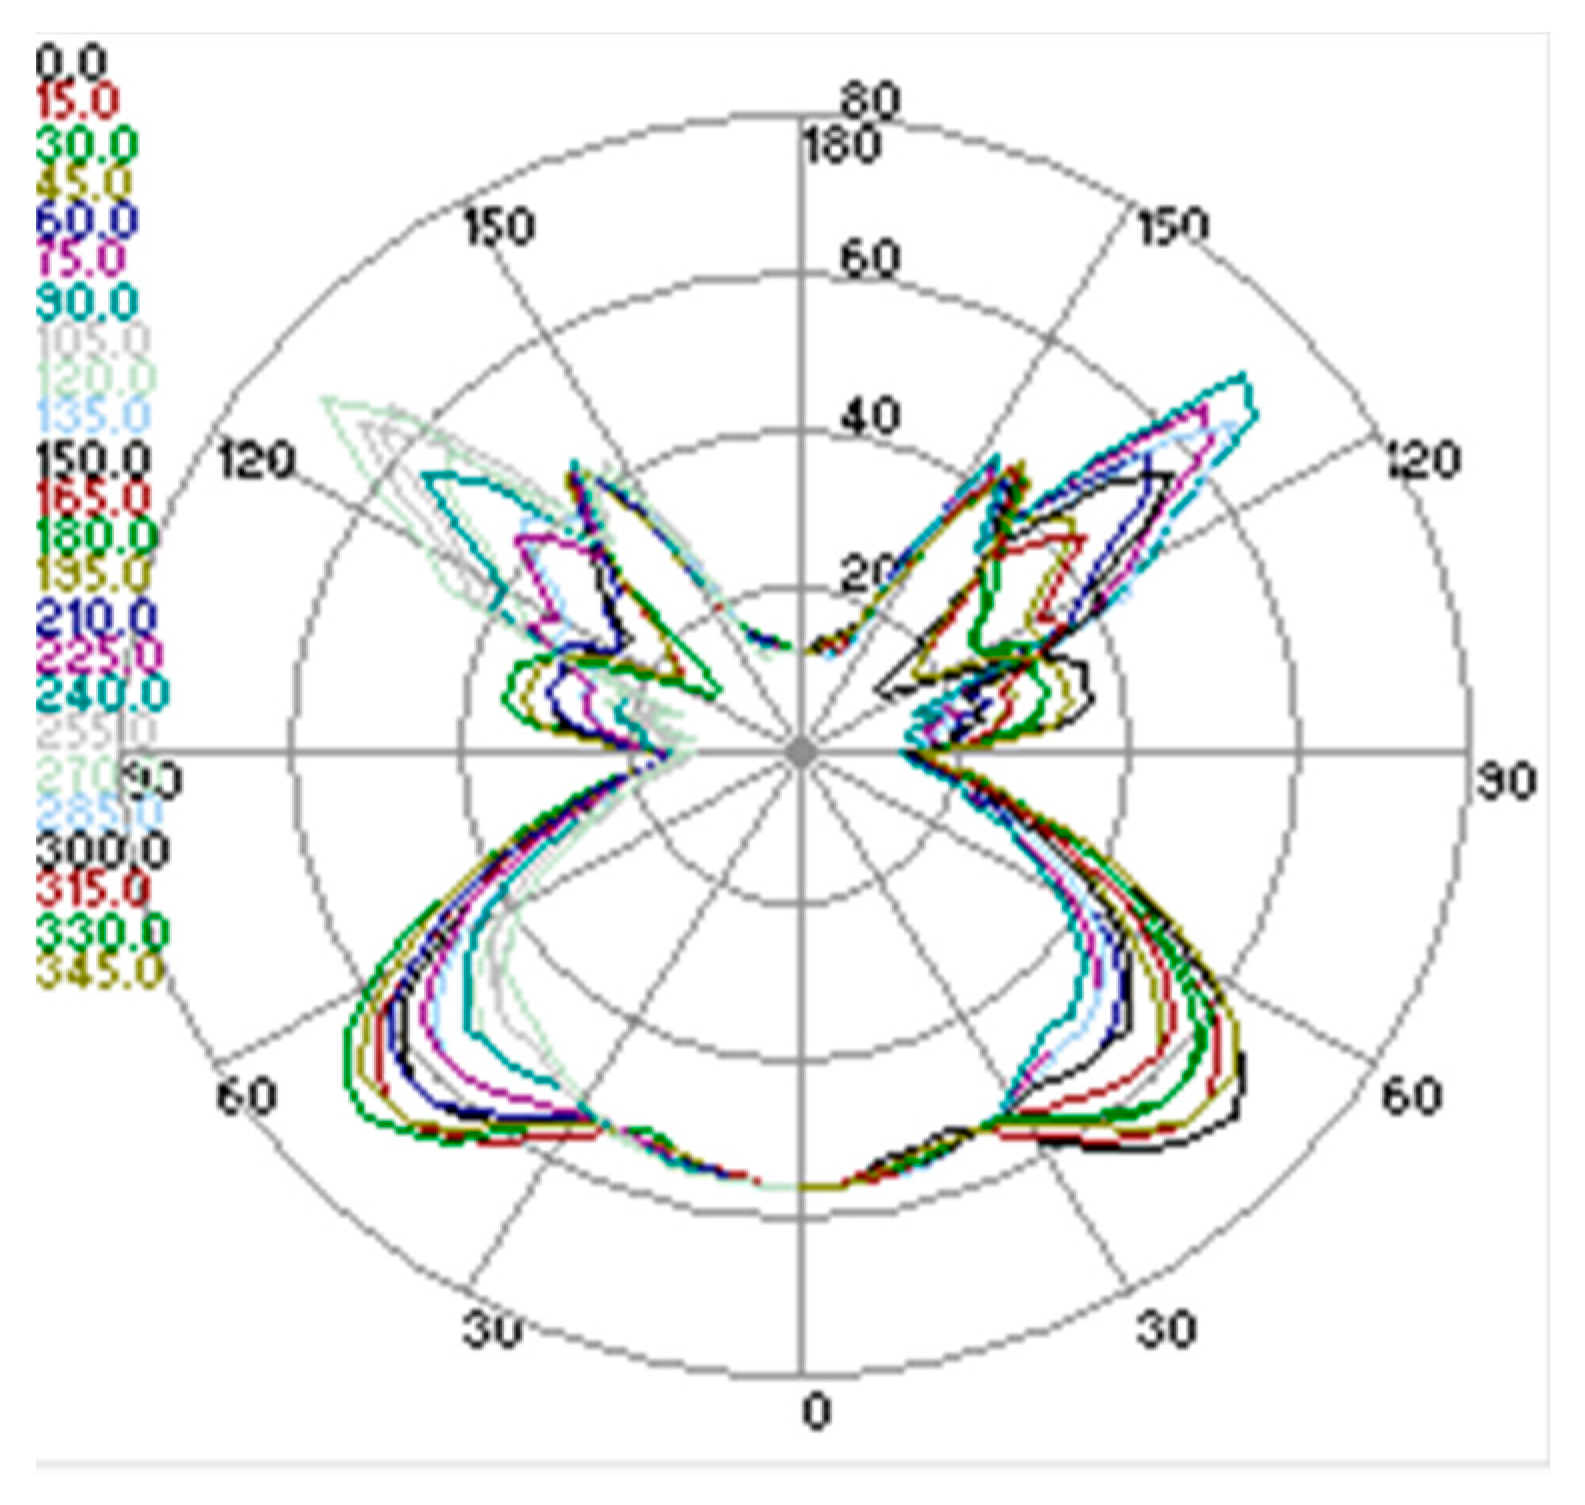
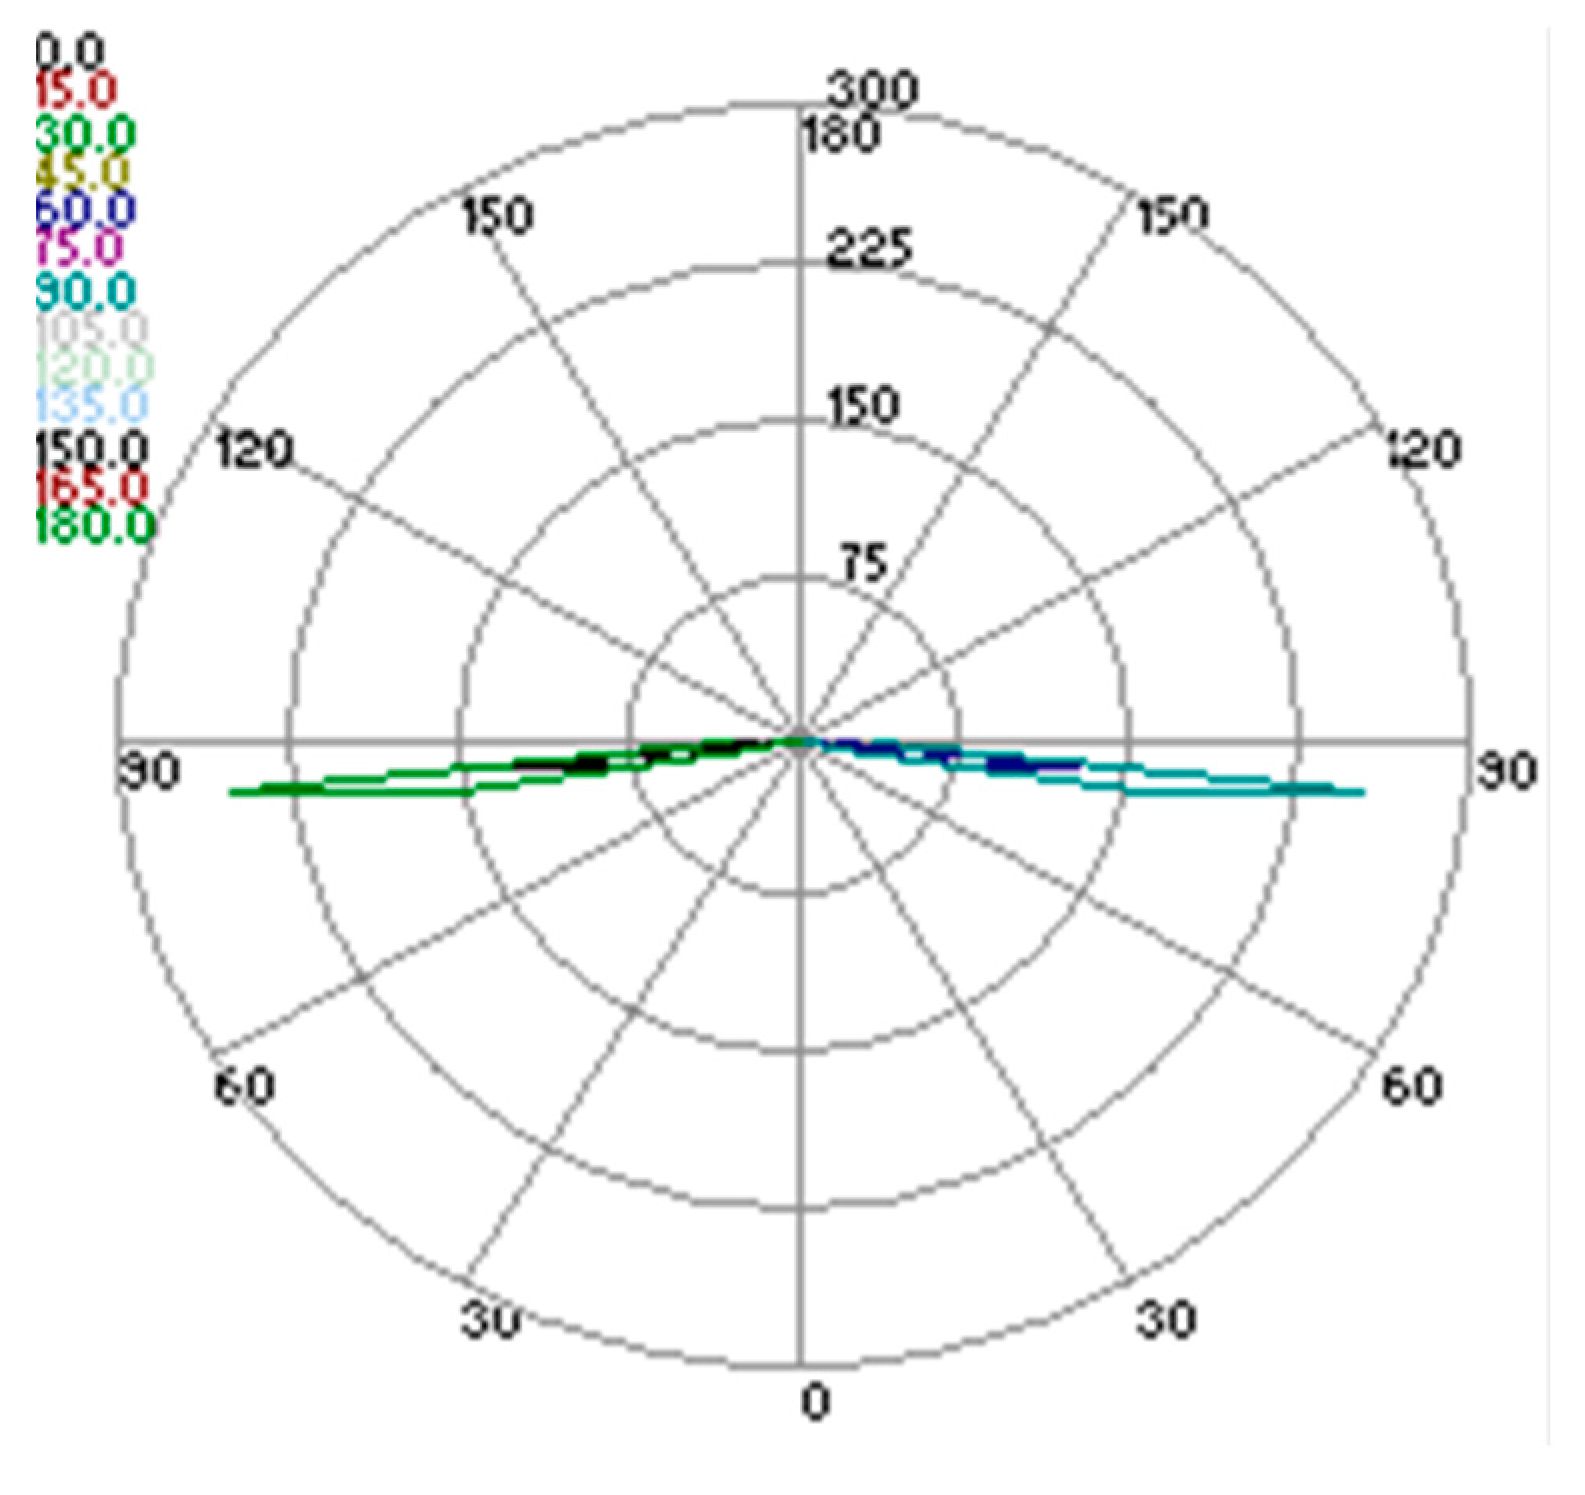
4.5. Case 5—Lighting Type L1: Linear ABS lighting

The illuminance simulation in the presence of the lighting type L1 showed that the lux levels reached values in the range from 75 to 90 lux. The light was mostly distributed on the ground and at the lower extremities of the walls, as illustrated in Figure 23 and Figure 24. Case 5 showed higher lux levels than those reached in cases 1 to 4, which, in addition, increased the street exposure of corridor A.

4.6. Case 6—Lighting Type L2: Point Fluora

The illuminance simulation in the presence of the lighting type L2 produced lux levels in the range from 45 to 55 lux, with levels ranging from 65 to 75 lux in the middle of the corridor. The light was distributed in a narrow area on the floor and along the lower extremities of the wall, as illustrated in Figure 25 and Figure 26. Case 5 showed higher lux levels than cases 1–4, whereas, when installing lighting type L2, as in case 6, the lux level were not as high as in case 5.

4.7. Case 7—Lighting Type L3: Linear Spectral

The illuminance simulation with the lighting type L3 showed that the lux level reached values ranging from 35 to 55 lux, distributing on the top and bottom of the wall surface, and values ranging from 85 to 90 lux in the middle area, as illustrated in Figure 27 and Figure 28. Case 7 showed a higher lux level than any of the previous six cases; therefore, the lighting type L3 resulted particularly effective in keeping the corridor A highly exposed to the street.

4.8. Case 8—Lighting Type L4: Point Hess

The illuminance simulation with the lighting type L4 showed that the lux levels reached values in the range from 35 to 55 lux, with the light distributed vertically over a large area of the wall, which plays well against vandalism because walls are usually vandalised. The lux levels were also within the same range observed for corridor B. In addition, the lux levels reached values ranging from 75 to 85 lux in a small area on the wall, as illustrated in Figure 29 and Figure 30. Case 8 showed similar lux levels as case 5, and the walls were lighted up to a certain height with high lux levels that were better distributed than case 7, which had higher lux levels than case 8, but the light was fragmented on the walls that are subject to vandalism.

4.9. Case 9—Lighting Type L5: Point iGuzzini

The illuminance simulation with the lighting type L5 showed that the lux levels reached values ranging from 5 to 25 lux, showing a weak distribution of light over the walls, as illustrated in Figure 31 and Figure 32. Case 9 showed the lowest lux levels among all cases; therefore, case 8 was the best choice.

4.10. Case 10—Lighting Type L6: Point Targetti-Exterieur Vert

The illuminance simulation with the lighting type L6 showed that the lux levels reached values ranging from 5 to 15 lux, with a small vertical area showing values ranging from 45 to 55 lux. As shown in Figure 33 and Figure 34, there was a weak distribution of light over a small area on the walls, and the lux levels were low compared to corridor B. Case 10 showed similar lux levels as case 9, thus both cases showed poor lux levels, whereas case 8 showed the highest lux levels.

5. Conclusions

In this study, the impact of lighting on vandalism in hot climates was examined by considering the case of the Abu Shagara vandalised corridor in Sharjah, UAE. After studying the cases 1 to 4, the simulation results led to the conclusions that the type of wall and flooring materials had a slight impact on the illuminance levels and distribution compared to the lighting fixtures. In all four cases, the lighting fixtures had a greater impact on the lux levels of corridor A, increasing the light intensity from, approximately, 2 to 3 lux to 25 to 45 lux. There is a correlation between the type of light fixture and vandalism activity, as observed through different comparisons. These results led to the study of the impact of six types of light lamps on corridor A. A study of the photometric polar diagrams of the lighting types L1, L2, L3, L4, L5, and L6, as well as of their light distribution was conducted. Based on the simulation analysis, case 8, with the lighting type L4, was found to provide the most suitable lighting type for corridor A, among all cases examined (case 5 to case 10). The illuminance simulation in case 8 showed that the lux levels reached values ranging from 35 to 85 lux, and the illuminance was distributed over a large vertical area on the wall around the light fixtures; in addition, lux levels ranging from 25 to 35 lux were observed covering vertical areas on the wall between the light fixtures. Thus, the lighting type L4 can illuminate the walls up to the point reached by vandalism and even beyond, which reduces the possibilities of vandalism. On the other hand, the lux levels reached values ranging from 25 to 55 lux in horizontal areas in the corridor. Herein, the national and international standards discussed earlier were successfully achieved. This study could assist architects and property owners in the prevention of vandalism.
Moreover, since this study was conducted in the hot climatic conditions of the UAE, the impact of lighting on vandalism could be also examined in other climatic conditions in different areas, to effectively evaluate the results in different situations. In general, this approach is distinctive and applicable to other countries and areas around the world.

Author Contributions

All authors contributed to this work. Emad Mushtaha generated the idea and designed the experiment as well as the simulation scenarios. Ranime Ayssar Nahlé and Maitha Bin Saifan prepared and analysed the questionnaire as well as performed the experiments and simulations. All authors, including Hasim Altan prepared, revised, and approved the final manuscript.

Conflicts of Interest

the authors declare no conflict of interest.

Appendix A

PERSONAL DATA
AGE:
GENDER: □ Male   □ Female
We would like to receive your input regarding the lighting in this vandalized corridor. Please fill in this anonymous survey where 1 is the minimum and 5 is the maximum.
12345
1. Is the number of Luminaires provided in the corridor sufficient and satisfying?
2. Do you think the corridor is welcoming in terms of visibility?
3. Rate the sense of ‘Safety’ when walking through the corridor at night.
4. Rate the sense of ‘Stress’ when walking through the corridor.
5. Rate the lighting level in this corridor
6. Do you think it is easy to maneuver through the corridor?
7. Would you agree to increase the number of luminaires and light levels in the corridor to avoid vandalism?
THANK YOU FOR YOUR COOPERATION

References

  1. Miller, A. Vandalism and the Architect; Ward, C., Ed.; Architectural Press: London, UK, 1973. [Google Scholar]
  2. Teng, H.; Puli, A.; Karakouzian, M.; Xu, X. Identification of Graffiti Countermeasures for Highway Facilities. Procedia Soc. Behav. Sci. 2012, 43, 681–691. [Google Scholar] [CrossRef]
  3. Mushtaha, E.; Hamid, F. The Effect on Vandalism of Perception Factors Related to Housing Design, Case of UAE Cities. J. Asian Archit. Build. Eng. 2016, 15, 247–254. [Google Scholar] [CrossRef]
  4. Ley, D.; Cybriwsky, R. Urban Graffiti as Territorial Markers. Ann. Assoc. Am. Geogr. 1974, 64, 491–505. [Google Scholar] [CrossRef]
  5. Christensen, H.H.; Johnson, D.R.; Brookes, M.H. Vandalism: Research, Prevention, and Social Policy; Gen. Tech. Rep. PNW-GTR-293; U.S. Department of Agriculture, Forest Service, Pacific Northwest Research Station: Portland, OR, USA, 1992.
  6. Cohen, S. Hooligans, Vandals and the Community: A Study of Social Reaction to Juvenile Delinquency. Ph.D. Dissertation, London School of Economics and Political Science (LSE), London, UK, 1969. [Google Scholar]
  7. Peña-García, A.; Hurtado, A.; Aguilar-Luzón, M. Impact of public lighting on pedestrians’ perception of safety and well-being. Saf. Sci. 2015, 78, 142–148. [Google Scholar] [CrossRef]
  8. Abd-Razak, M.; Mustafa, N.; Che-Ani, A.; Abdullah, N.; Mohd-Nor, M. Campus sustainability: Student’s Perception on Campus Physical Development Planning in Malaysia. Procedia Eng. 2011, 20, 230–237. [Google Scholar] [CrossRef]
  9. Lorenc, T.; Petticrew, M.; Whitehead, M.; Neary, D.; Clayton, S.; Wright, K.; Renton, A. Fear of crime and the environment: Systematic review of UK qualitative evidence. BMC Public Health 2013, 13, 496. [Google Scholar] [CrossRef] [PubMed]
  10. ARUP. The Value of Public Spaces: Economic or Social? ARUP, p. 1. Retrieved from Frederikssund Kommune. Available online: www.frederikssund.dk (accessed on 9 March 2015).
  11. Kim, D.; Park, S. Improving community street lighting using CPTED: A case study of three communities in Korea. Sustain. Cities Soc. 2017, 28, 233–241. [Google Scholar] [CrossRef]
  12. Department of Municipal Affairs Abu Dhabi. Abu Dhabi Public Realm & Street Lighting Handbook, 1st ed.; Department of Municipal Affairs Abu Dhabi: Abu Dhabi, UAE, 2014.
  13. CIE. Lighting of Roads for Motor and Pedestrian Traffic; International Commission of Illumination, CIE Public: Vienna, Austria, 2010; Volume 115. [Google Scholar]
  14. Farrington, D.; Welsh, B. Measuring the Effects of Improved Street Lighting on Crime: A reply to Dr. Marchant 1. Br. J. Criminol. 2004, 44, 448–467. [Google Scholar] [CrossRef]
  15. Blöbaum, A.; Hunecke, M. Perceived danger in urban public space: The impacts of physical features and personal factors. Environ. Behav. 2005, 37, 465–486. [Google Scholar] [CrossRef]
  16. Cheng, W.; Hsu, C.; Chao, C. Temporal vision-guided energy minimization for portable displays. In Proceedings of the 2006 International Symposium on Low Power Electronics and Design, Tegernsee, Germany, 4–6 October 2006; pp. 89–94. [Google Scholar]
Figure 1. The Plan of Abu Shagara indicating the two study sites, corridor A and corridor B.
Sustainability 09 02040 g001
Figure 2. (a) Vandalised corridor A showing neighbouring buildings with only windows overlooking the corridor, and (b) non-vandalised corridor B with one neighbouring building (labelled in red) having balconies overlooking the corridor.
Sustainability 09 02040 g002
Figure 3. Image illustrating the width and height in meters of the vandalised wall in corridor A.
Sustainability 09 02040 g003
Figure 4. Corridor A plan illustrating the vandalised area and the amount of lux (lx) available at each vandalised point, with the illuminance measured at a mid-distance in the corridor.
Sustainability 09 02040 g004
Figure 5. Corridor B plan illustrating the amount of lux (lx) at each point where the lamps are located, with the illuminance measured at a mid-distance in the corridor.
Sustainability 09 02040 g005
Figure 6. 3D view of the Abu Shagara site obtained with the IESVE software package, illustrating the locations of corridors A and B.
Sustainability 09 02040 g006
Figure 7. IESVE illuminance simulation for corridor A in the current situation, illustrating lux levels below 3 lx.
Sustainability 09 02040 g007
Figure 8. IESVEVE illuminance simulation for corridor B in the current situation, illustrating lux levels ranging between 25 and 45 lx.
Sustainability 09 02040 g008
Figure 9. Case 1: illuminance simulation and lux distribution.
Sustainability 09 02040 g009
Figure 10. Case 1: illuminance simulation and lux contour distribution.
Sustainability 09 02040 g010
Figure 11. Case 2: illuminance simulation and lux distribution.
Sustainability 09 02040 g011
Figure 12. Case 2: illuminance simulation and lux contour distribution.
Sustainability 09 02040 g012
Figure 13. Case 3: illuminance simulation and lux distribution.
Sustainability 09 02040 g013
Figure 14. Case 3: illuminance simulation and lux contour distribution.
Sustainability 09 02040 g014
Figure 15. Case 4: illuminance simulation and lux distribution.
Sustainability 09 02040 g015
Figure 16. Case 4: illuminance simulation and lux contour distribution.
Sustainability 09 02040 g016
Figure 17. L1: Linear ABS lighting.
Sustainability 09 02040 g017
Figure 18. L2: Point Fluora.
Sustainability 09 02040 g018
Figure 19. L3: Linear Spectral.
Sustainability 09 02040 g019
Figure 20. L4: Point Hess.
Sustainability 09 02040 g020
Figure 21. L5: Point iGuzzini.
Sustainability 09 02040 g021
Figure 22. L6: Point Targetti-exterieur vert.
Sustainability 09 02040 g022
Figure 23. Case 5: illuminance simulation and lux distribution.
Sustainability 09 02040 g023
Figure 24. Case 5: illuminance simulation and lux contour distribution.
Sustainability 09 02040 g024
Figure 25. Case 6: illuminance simulation and lux distribution.
Sustainability 09 02040 g025
Figure 26. Case 6: illuminance simulation and lux contour distribution.
Sustainability 09 02040 g026
Figure 27. Case 7: illuminance simulation and lux distribution.
Sustainability 09 02040 g027
Figure 28. Case 7: illuminance simulation and lux contour distribution.
Sustainability 09 02040 g028
Figure 29. Case 8: illuminance simulation and false colours in lux.
Sustainability 09 02040 g029
Figure 30. Case 8: illuminance simulation and false lines in lux.
Sustainability 09 02040 g030
Figure 31. Case 9: illuminance simulation and false colours in lux.
Sustainability 09 02040 g031
Figure 32. Case 9: illuminance simulation and false lines in lux.
Sustainability 09 02040 g032
Figure 33. Case 10: illuminance simulation and false colours.
Sustainability 09 02040 g033
Figure 34. Case 10: illuminance simulation and false lines.
Sustainability 09 02040 g034
Table 1. Average response scores for each question of the survey.
No.QuestionsAv. Score
1Is the number of Luminaires provided in the corridor sufficient and satisfying?1.59
2Do you think the corridor is welcoming in terms of visibility?2.25
3Rate the sense of ‘safety’ when walking through the corridor at night.3.01
4Rate the sense of ‘stress’ when walking through the corridor.2.89
5Rate the lighting level in this corridor.1.57
6Do you think it is easy to maneuver through the corridor?3.43
7Would you agree to increase the number of luminaires and light levels in the corridor to avoid vandalism?4.80
Table 2. Parameters (P) and types of lighting in the different simulation cases.
CasesP1: Corridor B—LightingP2: Flooring MaterialP3: Wall Material
Case 1
Case 2
Case 3
Case 4
Types of lighting
Light TypeManufacturerFlux (lm)Width (m)Height (m)
Case 5L1: LinearABS Lighting56000.190.01
Case 6L2: PointFluora12000.190.01
Case 7L3: LinearSpectral46500.130.03
Case 8L4: PointHess24000.260.5
Case 9L5: PointiGuzzini9500.180.08
Case 10L6: PointTargetti-exterieur vert9500.170.10
Material selection for walls and floorings
TypeMaterial
WallsShining painting wall
FloorsPolished concrete floor

