Energy Efficiency and Its Driving Factors in China’s Three Economic Regions

1
Department of Law and Politics, North China Electric Power University, Baoding 071003, China
2
Department of Economics and Management, North China Electric Power University, Baoding 071003, China
*
Author to whom correspondence should be addressed.
Sustainability 2017, 9(11), 2059; https://doi.org/10.3390/su9112059
Submission received: 16 October 2017
/
Revised: 6 November 2017
/
Accepted: 8 November 2017
/
Published: 9 November 2017
(This article belongs to the Special Issue Energy Security and Sustainability)
Abstract
:Energy efficiency improvement is essential for China’s sustainable development of its social economy. Based on the provincial panel data of China’s three economic regions from 1990 to 2013, this research uses the data envelopment analysis (DEA) model to measure the total-factor energy efficiency, and the Tobit regression model to explore the driving factors of efficiency changes. Empirical results show: (1) Energy efficiency, energy consumption structure, and government fiscal scale are significantly positively correlated. (2) Industrial structure and per capita income level have negative correlation to energy efficiency; the impact of industrial structure on energy efficiency is relatively small. (3) The increase of carbon dioxide emissions will decrease the energy efficiency. Furthermore, with people becoming less conscious of energy conservation and emission reduction, energy efficiency will also decrease. (4) Specific energy policies will improve energy efficiency, and greater openness in coastal areas will also have the similar effect.
1. Introduction
Sustainable development of energy is a prerequisite for sustainable economic development in China. At present, with China’s energy demand increasing, the contradiction between supply and demand has become obvious. To achieve sustainable development of energy, in the 12th Five-Year Plan of Energy Development, the general idea of “the transition of the current energy system to a sustainable modern system” is clearly put forward, and the requirement for reducing energy consumption per unit of the gross domestic product (GDP) by 16% is clearly stipulated [1]. As well as in the 13th Five-Year Plan of Energy Development, the government emphasizes that the coal consumption proportion should be reduced to less than 58%, while the non-fossil energy consumption should be increased to more than 15%, and the proportion of natural gas consumption should be up to 10%, and energy consumption per unit of GDP fall by 16.8% [2]. Therefore, in order to alleviate the contradiction between energy supply and demand, and reduce the pressure of environmental protection, we adopt an energy strategy of energy conservation and raising energy utilization efficiency. This is conducive to sustainable energy development.
As the most active region of China’s economy, the Pearl River delta economic circle was the front line of reform and opening up more than 30 years ago. Nowadays, under the new normal situation of economic development, the Pearl River Delta, Yangtze River Delta, and the Beijing-Tianjin-Hebei region should be in the forefront of the new round of reform and opening-up with the massive human resources, abundant intellectual resources, and broad land. As of 2014, the three economic regions accounted for 27.5% of the country’s population, achieving 40.8% of the national GDP, 42.1% of industrial added value, and 43.4% of the growth in the service industry, from which it can be seen that the three economic regions occupied a decisive position in China’s social and economic development. In 2014 the country’s total primary energy consumption was 4258.06 million tons of standard coal, in which the three economic regions accounted for 31.4%, namely 1336.63 million tons of standard coal [3]. Therefore, the energy efficiency of the three economic regions directly determines the level of China’s overall energy efficiency. Through the study on energy efficiency of the three economic regions, and the analysis of the energy efficiency driving factors, we provide a useful reference for energy conservation and raising energy efficiency in Central and Western China.
2. Literature Review
There are fruitful study results of China’s energy efficiency at home and abroad, and they can be summed up as the following aspects:
Firstly, the framework for studying energy efficiency has been explored. Early studies on energy efficiency basically started with single factor energy efficiency [4,5]. Since Hu et al. [6] proposed the method of using the total-factor productivity framework to measure the energy efficiency, most of the researchers have been using this analysis system to measure energy efficiency. The most representative of these is the paper of Wei et al. [7], which uses capital, labor, and energy as the input variables and GDP output as output variable to conduct the DEA analysis of 10 years’ data in 29 provinces in the country. It can be seen that the follow-up studies are on the basis of Hu’s total-factor framework, adding different input indices and output indices in order to obtain more realistic and reliable energy efficiency values [8,9,10].
Secondly, the research methods are being further enriched. In the period of single factor energy efficiency research, the target is energy productivity. These approaches, such as cluster analysis, Lorentz curve, Florentine coefficient, Gini coefficient, and factor decomposition, are utilized to measure the energy efficiency [5,11,12], while in the period of total-factor energy efficiency research, DEA is conducted to measure the energy efficiency [7,8,9,13]. The regional energy efficiency gap analysis framework, based on the stochastic frontier production function, is built and the variance decomposition method is used to measure the regional difference of energy efficiency in China [14]. When it comes to the driving force of energy efficiency, pooled analysis (POOLED), fixed effect regression (FIXED), random effect regression (RANDOM), and feasible generalized least squares regression (FGLS) are used to do the research [7,8]. In more papers the Tobit regression model is taken to conduct the analysis [13,15,16].
Thirdly, the factors being studied that affect energy efficiency are continuously enriched. The adjustment of the industrial structure will reduce the energy consumption intensity [7,17,18,19]. Technical efficiency is the main reason for the improvement of energy efficiency in industrial sectors. The function of technological progress is relatively inconspicuous, but it is gradually increasing, while the function of technical efficiency is gradually weakened [7,20,21,22]. Energy consumption structure is negatively correlated with total-factor energy efficiency [13] and the proportion of government expenditure has a negative impact on energy efficiency [7]. The ownership structure’s impact on energy efficiency has regional differences. Ran [10] believes that there is a negative correlation between the change of the proportion of state-owned enterprises and the overall total-factor energy efficiency in the whole country, while the impact of the proportion of foreign-funded enterprises and private enterprises on the national energy efficiency is significantly positive. The per capita income and energy efficiency have a negative correlation [23,24].
Based on the above literature, this paper attempts to conduct the study from the following two aspects: (1) to utilize the DEA analysis model to conduct energy efficiency calculations and specific analysis on the panel data (capital, labor force, energy consumption, and GDP) in 1990–2013 of seven provinces in the three regions under Hu’s total-factor energy efficiency framework; and (2) to establish the Tobit regression model of the influencing factors for energy efficiency, and utilize the panel data for measurement to find out the impact of various factors on energy efficiency and the direction of impact.
This paper is structured as follows: the first part studies the significance of energy efficiency in the three regions. The second part sorts out literature of the current energy efficiency. The third part introduces both the DEA model for measuring the total factors and the Tobit model to conduct the influencing factors analysis. The fourth part explores the data source and the selection of variables. The fifth part is the empirical analysis: the DEA model is used to calculate the energy efficiency values of each province and each region, and analyzes them in detail. Then the measurement model is established to estimate and discuss the influencing factors of energy efficiency. The final part offers the conclusions.
3. Research Models
3.1. DEA Model
DEA is a method of relative efficiency evaluation proposed by Charnes et al. in 1978. This method uses the mathematical programming model to evaluate the relative validity between decision making units (DMUs) with multiple inputs and multiple outputs.
Based on the input and output data, by measuring the distance between the production surface and the best frontier surface of the DMU, the efficiency value is calculated. Based on this, whether the DMU achieves the most effective input or output ratio is measured, essentially, it is to measure whether the DMU achieves Pareto optimality in economics [25].
Among all DEA models, the most representative is the CCR model (the model, created in 1978 by Charnes, Cooper, and Rhodes, was named after the first letter of the three authors’ surnames) and the BCC model (the model created by Banker, Charnes, and Cooper in 1984). The CCR model estimates the efficiency values of the overall effectiveness of the DMU, implying the constant returns to scale (CRS) assumptions. However, this assumption is quite strict, in that many DMUs cannot run under this assumption. Therefore, Banker et al. [26] modified the traditional CCR model to propose the BCC model, taking into account the variable return to scale (VRS) situation. For the reason that this study mainly explores the main factors influencing the energy efficiency of the three major economic areas, only the overall economic efficiency of the three major economic areas need to be calculated, while the technical efficiency and scale efficiency are not required. Therefore, the input-oriented CCR-DEA model is selected. The CCR-DEA model is as following:
In this model, is the jth DMU’s proportion in valid DMU combination reconstructed relative to DMUj0 (j0 represents an individual of an evaluation). The earnings of the model can be judged:
(1) If , the scale returns are decreasing; (2) if the scale returns are unchanged; and (3) If , the scale returns are increasing; ε is the infinitesimal of non-metamorphism, which is a number greater than 0 and less than any positive number, usually ε = 10−6; ; is for the input relaxation vector (input overrun), is for the remaining vector of the output (output loss). is the effective value of the decision-making unit DMUj0, and its economic meaning is: (1) If , the DMU is not valid for DEA, the combination can be reduced to the θ ratio of original input and maintain the original output unchanged; (2) If , and , the DMU is weakly valid for DEA, indicating that part of the DMU is over-invested or partially insufficient, which means that in the system of the n decision-making units, the input can be reduced and the original output is kept constant, or keeps the input unchanged, increasing of the output ; (3) If , and , the decision unit is valid for DEA, indicating that the DMU has both technical and scale efficiency. In the actual production process it has achieved Pareto optimality.
3.2. Tobit Model
Tobit regression analysis model was proposed by the famous American economist Tobin in 1958. When the dependent variable is the cut value or limit value, the use of ordinary least squares (OLS) may have the problem of asymmetry or inconsistency. This model is to solve this problem. The maximum likelihood estimation method (ML) is used to estimate the parameters in the Tobit model [27]:
where N is the number of observations, yt is the dependent variable, Xt is a vector of independent variables, β is a vector of unknown coefficients, and ut is an independently-distributed error assumed to be normal with zero mean and constant variance σ2 [28].
4. Data Source and Variables Selection
4.1. Data Source
In this paper, the time span is from 1990 to 2013, and the data are derived from “China’s Gross Domestic Product in 1952–1995”, “New China 60-year Statistical Compilation”, “China Statistical Yearbook”, local statistical yearbooks, and the National Bureau of Statistics website.
4.2. Variables in DEA Model
In the first stage of DEA analysis, the total-factor energy efficiency is analyzed by using GDP as the output factor, taking the capital stock, the quantity of labor input and the energy consumption as the input factor. (1) The total amount of GDP output. GDP is used as an indicator of energy efficiency analysis. For the uniformity of caliber, the actual GDP value is calculated by reducing the constant price in 1978, and the unit is 100 million yuan. (2) The capital stock. The “perpetual inventory method” of Goldsmith [29] is currently used in capital stock calculation, the formula is . In the formula, i represents the ith country; t represents the tth year. K represents the capital stock; δ represents the depreciation rate of capital, δ = 9.6%, which refers to Zhang et al.’s [30] research results. The capital stock is calculated at the constant price of 1978; I is the investment of the current year and, so far, it is the gross capital formation of the year, and the unit is 100 million yuan. (3) The amount of labor. The index is calculated according to the practice of Wei et al. [7], the number of employed persons in the year = (the number of employed persons at the end of the year + the number of employed persons at the end of the previous year)/2. The unit is 10,000 people. (4) Energy consumption. Total primary energy consumption is used as the energy input, the unit of which is 10,000 tons of standard coal.
4.3. Variables in the Tobit Model
In most of the research literature, the variables that influence energy efficiency are energy consumption structure, industrial structure, government expenditure scale, and per capita income level. In this study, in addition to the selection of these four indicators, the other three indicators are used, namely, energy saving emission reduction awareness, energy policy, and natural differences. (1) Energy consumption structure, which is represented by the proportion of raw coal consumption in total primary energy consumption. (2) Industrial structure, which is represented by the proportion of the added value of tertiary industry in GDP. (3) Scale of government expenditure, which is the proportion of provincial governments’ financial expenditure of GDP. (4) Energy saving and emission reduction awareness. The increase of energy saving awareness will have an impact on energy efficiency, so here the amount of carbon dioxide emissions is as a substitute for the variable, and the unit is 10,000 tons. (5) Energy policy. The People’s Republic of China Energy Conservation Law was promulgated in 2007, which makes the conservation of resources China’s basic national policy, further improving China’s energy-saving system and providing a series of basic systems for energy-saving management, such as the implementation of an energy-saving target responsibility system and energy-saving assessment and evaluation system, marking the real emphasis on energy saving in China. (6) Natural endowment difference. The majority of the Beijing-Tianjin-Hebei region is inland, while the Yangtze River Delta and most of the Pearl River Delta is the territorial sea. This difference of natural conditions may bring a discrepancy to economic development and energy utilization.
5. Results
5.1. DEA Efficiency Evaluation Results
Using capital stock, labor force, and the total amount of primary energy consumption as the input factors, and the actual GDP of the three regions as the output indicator, the investment-oriented CCR model is utilized to measure the data of the seven provinces in the Beijing-Tianjin-Hebei region, Yangtze River Delta, and Pearl River Delta and make analyses of the differences among corresponding energy efficiency values. When establishing the efficiency model, Charnes et al. [25] considered that the condition of “isotonicity” must be satisfied, that is, the value of each output variable of the decision unit should be increased along with the increase of each input variable value. In this paper, the method that Wang et al. [16] put forward is used to study the correlation between input variables and output variables, utilizing Pearson correlation coefficient.
From Table 1, it can be seen that the real GDP of all regional samples is significant in terms of capital input, labor input and energy input at the 1% level, and that all factor inputs are positively correlated with GDP output, which meets the condition of “isotonicity” for efficiency analysis.
As shown in Table 2, for the overall of the three major economic circles, the values of relative energy efficiency are lower than 1 with a minimum of 0.623 in 2012 and a maximum of 0.785 in 1998 and 1999. Within the sample years, the average energy efficiency of the Pearl River Delta is the highest, namely 0.908, and that of the Yangtze River Delta is 0.845, while the Beijing-Tianjin-Hebei region is the lowest, only 0.528, indicating the Beijing-Tianjin-Hebei economic circle has great potential in energy utilization.
Individually, the relative efficiency value of Shanghai is the highest in all sample years, all of which are 1 and valid for DEA; Tianjin has a relative efficiency value of 1 in 1990 to 2012, at the frontier curve. Only in 2013 the value declines to 0.977, but is still very high; Guangdong Province and Jiangsu Province, respectively, rank third and fourth. The two provinces’ energy efficiency values are also in the frontier curve in some years, valid for DEA. The average relative efficiency is, respectively, 0.908 and 0.856 in the sample years. Among the seven provinces in the three major economic circles, the relative efficiency of energy in Hebei Province is the lowest, only 0.558. Additionally, the efficiency value of Beijing is not high, namely 0.615. It can be concluded that in the perspective of energy utilization, there is still much room for development in the inland provinces (municipalities) compared with the coastal economically-developed provinces.
5.2. Tobit Regression Results
On the basis of the first stage analysis, this paper will further analyze the influencing factors of the total-factor energy efficiency of the three major economic regions, examining the influence of the energy consumption structure, the industrial structure, the scale of fiscal expenditure, the energy policy, the per capita income level, and the awareness of energy conservation on total-factor energy efficiency. The time span of the sample is from 1995 to 2012. Table 3 shows the description to the variables of the Tobit model.
The Tobit Restricted Regression Model is established as follows:
where β0–β7 are regression parameters, and ut is the random interference term.
As shown in Table 4, the conditional moment values of the four models are all small, indicating that the disturbances in a Tobit model have a normal distribution. In addition, a robust standard deviation regression analysis was conducted for the model, and the regression results were found to be close to the common standard deviation, which implies that there is no heteroscedasticity. In addition, we found that the individual effect of the region was not obvious in the panel data analysis, and the time effect was significant.
Table 4 also shows, from the overall view of the three major economic regions, the impact of all factors on energy efficiency is significant and the symbols are reasonable. From the point of view of the energy consumption structure, there is a significant positive correlation between energy consumption structure and energy efficiency, which indicates that in energy consumption, the proportion increase of coal consumption will increase the energy efficiency. It seems to contradict the findings of Wang [16] and Hu [9]. By making comparisons, it is found that the symbols of Beijing-Tianjin-Hebei are the same to the three regions as a whole, and they are very evident. Different from Beijing-Tianjin-Hebei, the other two regions have negative correlation to energy efficiency, and that is non-significant, indicating that the whole of the three major economic regions is more affected by Beijing-Tianjin-Hebei. Industrial structure is positively correlated to total-factor energy efficiency, as proposed by many previous studies. With the proportion increase of the tertiary industrial output in GDP, the energy efficiency will be higher in the future. The scale of financial expenditure has a distinct influence on energy efficiency, but the direction of the impact is different in the Beijing-Tianjin-Hebei region and the rest of the regions. The result is inconsistent with most of the literature, but consistent with Zeng’s opinion [32]. The reason may well be the later development of the Beijing-Tianjin-Hebei region. The impact of the per capita income level on energy efficiency is significantly negative, and that means an increase in per capita income would reduce energy efficiency. This result is inconsistent with common sense. However, it is not difficult to infer that with the improvement of the income level, consumers tend to use more energy-consuming appliances. Moreover, when consumer income increases, the saving consciousness may be weakened, which will cause an unnecessary waste of energy and then cause energy efficiency to decline. There is apparent negative correlation between energy saving and emission reduction awareness and energy efficiency, indicating that a decline in energy-saving awareness would lead to an increase in carbon dioxide emissions, thus reducing energy efficiency. The impact of energy policy on energy efficiency is positive, indicating that the country has formulated and promulgated more energy-saving policies, and consumers’ awareness of energy conservation has been further strengthened, leading to the improvement of energy efficiency. Natural endowment difference and energy efficiency are positively correlated, indicating that the energy efficiency of coastal areas is generally higher than that of non-coastal areas.
In terms of the three regions, the variable of energy consumption structure does not pass the significance test in the Yangtze River Delta and Pearl River Delta regions and, at the same time, the variable of industrial structure is not obvious to energy efficiency in the Beijing-Tianjin-Hebei region. However, it is not difficult to find that most of the variables’ symbols are reasonable. That is, the correlation between the variables and the total-factor energy efficiency is close to the actual situation. Meanwhile there are some differences among the three regions. The impact of the energy consumption structure to the energy efficiency is conspicuous and positive in the Beijing-Tianjin-Hebei, while that impact in the rest regions is minus and non-significant. The impact of the industrial structure on the energy efficiency is significantly positive except for the Beijing-Tianjin-Hebei region, where it is significantly negative. The scale of government expenditure has an outstanding positive effect on Beijing-Tianjin-Hebei region and an obvious negative effect on the Yangtze River Delta and the Pearl River Delta. The impact of income level on energy efficiency is all significantly negative. The impact of energy saving and emission reduction consciousness on the Beijing-Tianjin-Hebei region and Yangtze River Delta is negative, while for the Pearl River Delta it is positive.
6. Discussion of Results
6.1. Changing Trend of Energy Efficiency
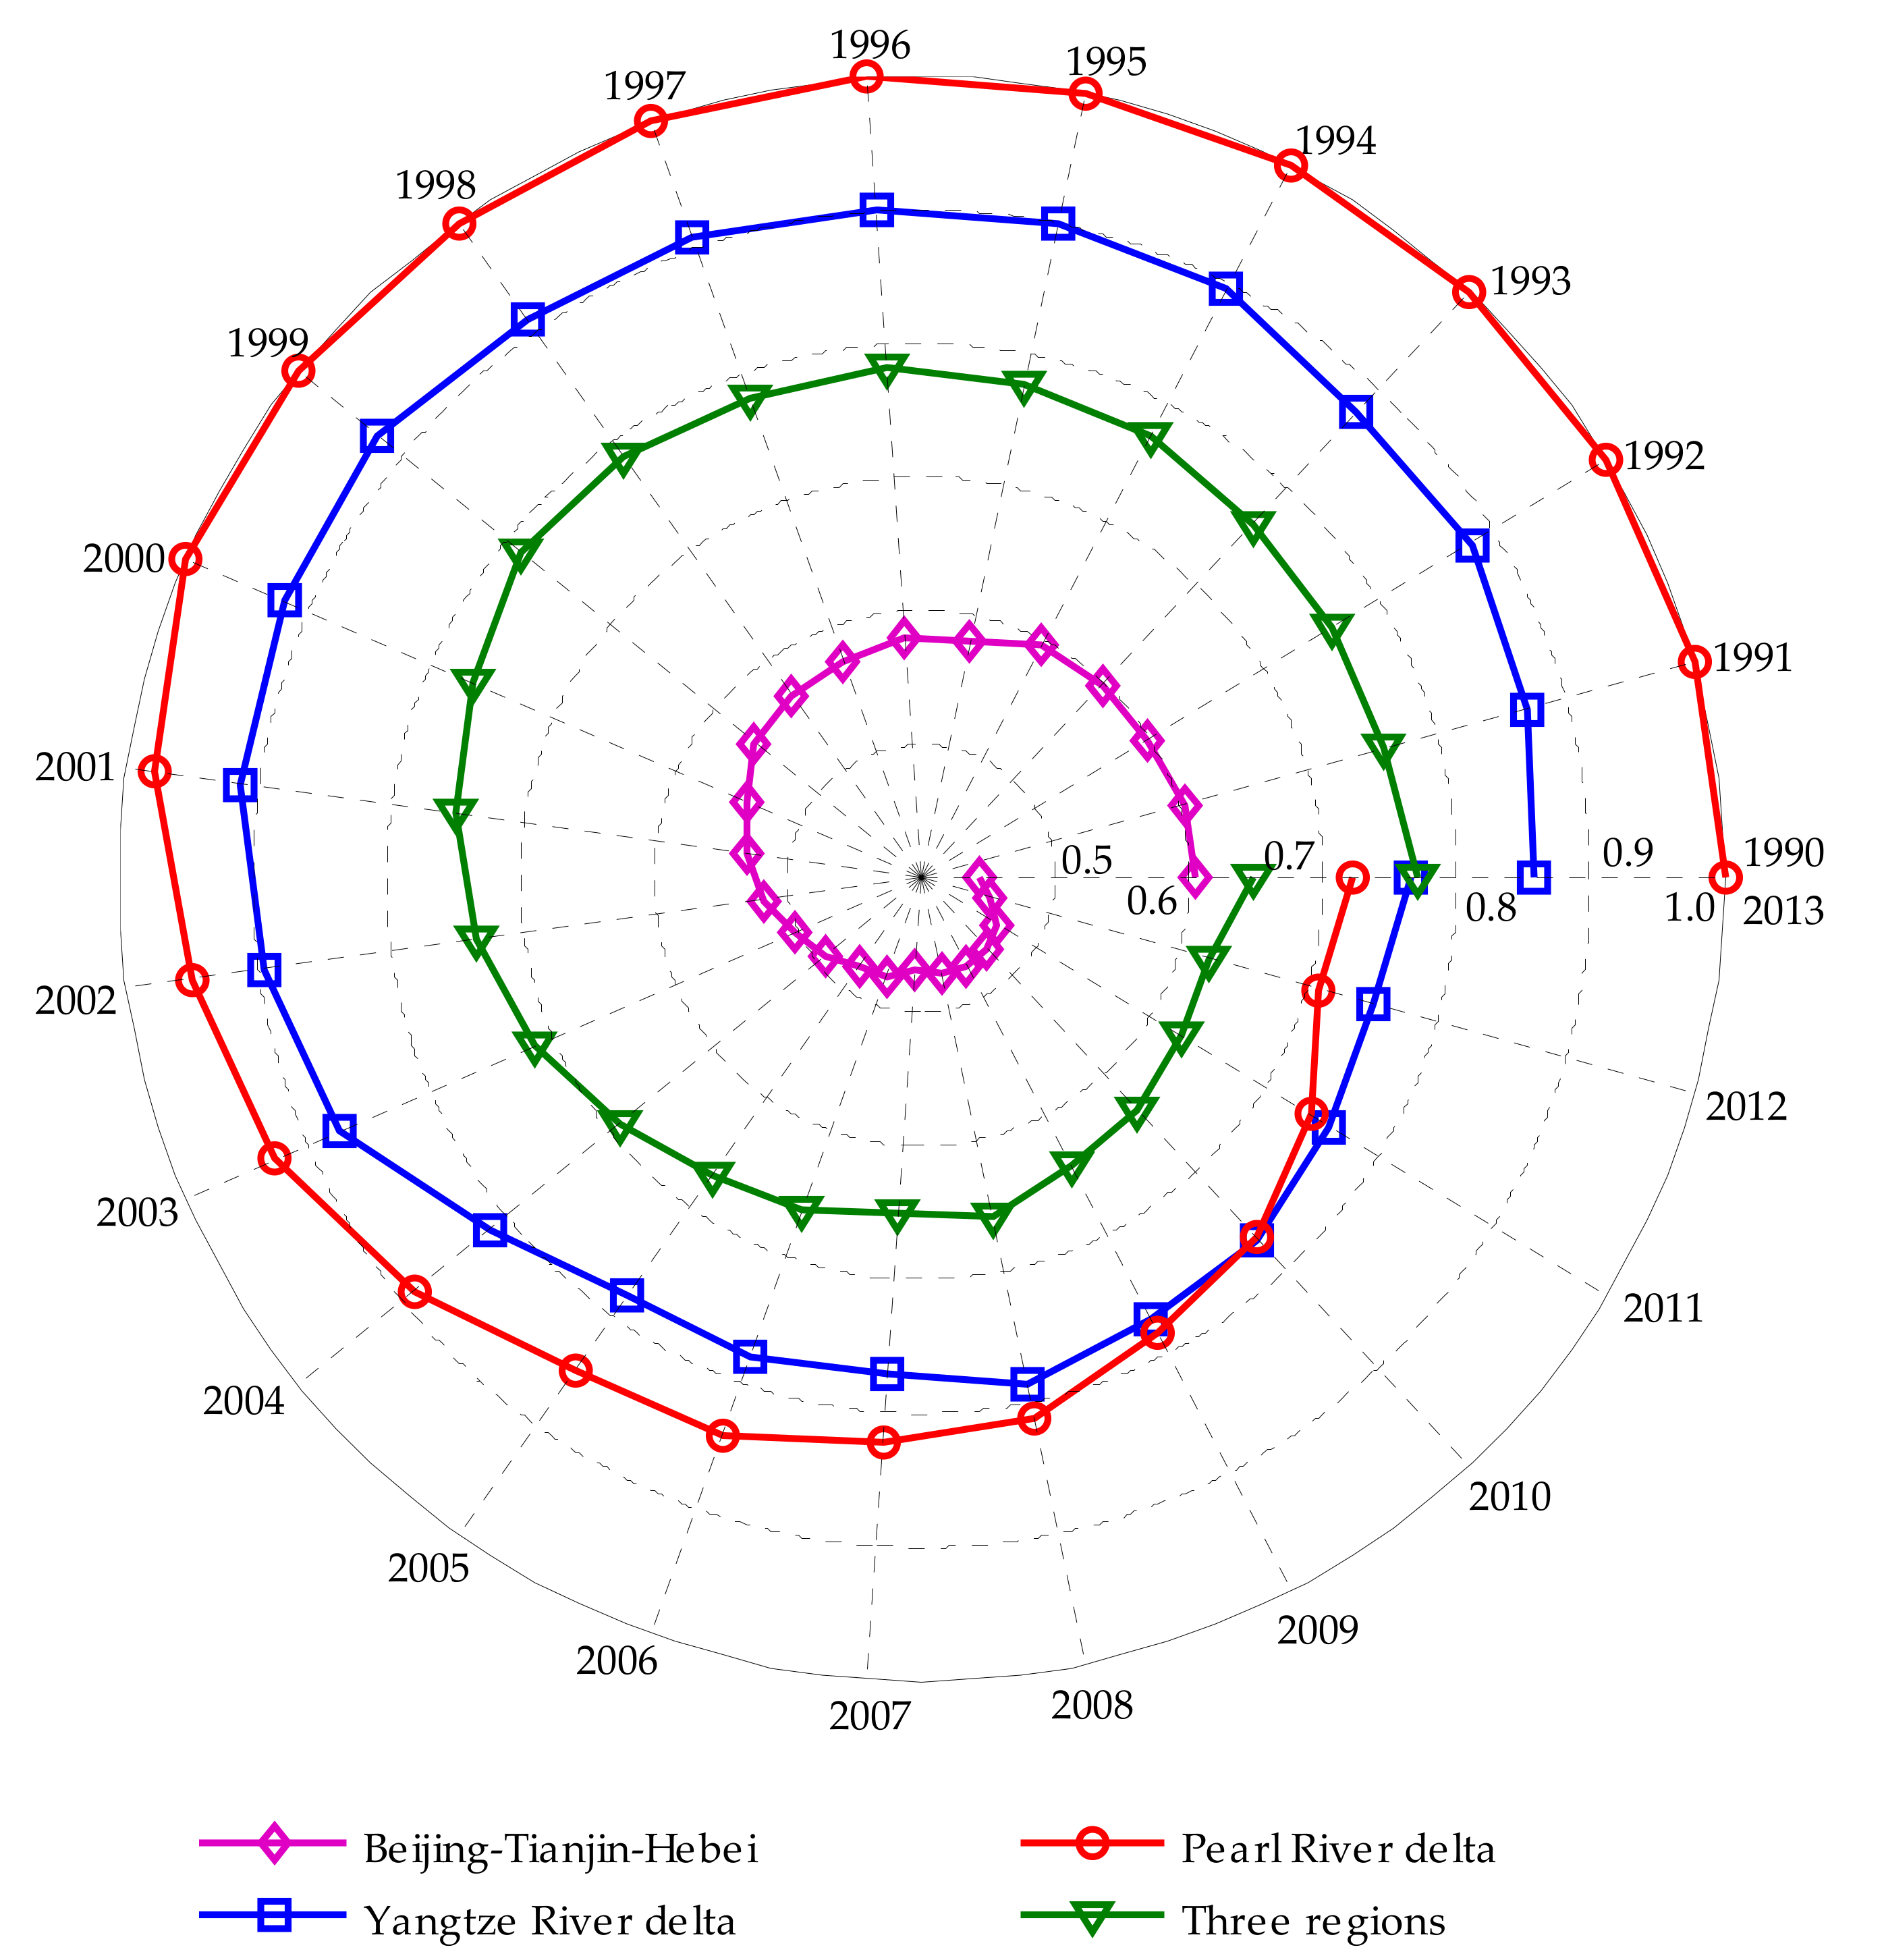
It can be seen from Figure 1 that the energy efficiency value of the Beijing-Tianjin-Hebei region is significantly lower than that of the Yangtze River Delta and the Pearl River Delta, at the bottom of the three curves. The overall trend is declining, with only a small fluctuation in 2009. The energy efficiency value of the Yangtze River Delta shows that it increases first and then decreases. However, in the several years after 2005, the efficiency value tends to be stable, little changed. The Pearl River Delta also showed a downward trend, effective for DEA from 1990 to 2000, but it began to decline in 2001 and it dropped to the lowest point 0.708 in 2012. Seen from the overall of three major economic circles, the energy efficiency value has the trend of increasing first and then decreasing. It reached the maximum in 1999 and then began to decline from 2000. This conclusion is in consonance with most studies [19,33,34]. This figure also shows signs of recovery of energy efficiency values in 2013.
6.2. Variation Analysis of Energy Efficiency
It can be seen from Figure 2 that the degree of energy efficiency difference between provinces is increasing year by year, which is consistent with Wei’s opinion [7] that there is no convergence of the energy efficiency gap between the national provinces. However, it should also be seen that from 2005 to 2012, the degree of change in energy efficiency difference is not large, tending to be stable. This indicates that, with the national Beijing-Tianjin-Hebei development strategy, the degree of difference is no longer increasing among the provinces in the three major economic areas. It shows a trend of narrowing of the gap. In terms of energy efficiency difference in the three major economic areas, there is also a trend of increasing first and then decreasing. In 2000–2003, the efficiency difference reached the maximum and then began to decline, which indicates that, compared with the developed coastal areas, Beijing-Tianjin-Hebei economic circle advantageously narrowed the regional energy efficiency gaps in these years. Specific to the three provinces in the Beijing-Tianjin-Hebei region, before 2008, the degree of efficiency difference was increasing year by year, and then it gradually declined, while the provinces in the Yangtze River Delta and the Pearl River Delta show a trend of decreasing first and then increasing. Around 2008 the upward trend gradually slowed down, and in 2013 it began to decline. It should be noted that although the energy efficiency difference of provinces in the Yangtze River Delta and the Pearl River Delta is increasing, it is still far below the energy efficiency difference among the provinces in the Beijing-Tianjin-Hebei region, which fully demonstrates the imbalance of the energy utilization efficiency in this region.
6.3. Specific Analysis of Energy Efficiency Driving Factors
Analyze Table 4 in the previous, definitely it can be found that in the perspective of the energy consumption structure, the industrial structure and the government expenditure scale, the impact direction is totally incompatible in the Beijing-Tianjin-Hebei Region, compared with in the Yangtze River Delta and the Pearl River Delta. Thus, in this part of the paper, the factors that influence energy efficiency are fully dissected from several major factors.
From the perspective of the energy consumption, in the Beijing-Tianjin-Hebei region, the increase of the proportion of coal consumption will significantly improve energy efficiency. What is the reason? In the Beijing-Tianjin-Hebei region, coal consumption accounts for 68% in energy consumption, while that in the Yangtze River Delta and Pearl River Delta accounts, relatively, for 62% and 44% [3]. The regional integration of Beijing, Tianjin, and Hebei is relatively late. This region’s economic development is relatively backward. In a certain period of time, the increase in coal consumption will have a positive impact on energy efficiency, and the impact of coal proportion on energy efficiency will be more significant than the other two major economic circles.
From the perspective of industrial structure, the increase of the proportion of the tertiary industry in GDP, has a negative influence on the Beijing-Tianjin-Hebei region’s energy efficiency and the influence is not significant. While the influence on the Yangtze River Delta and the Pearl River Delta is significantly positive. The main reason is that the secondary industry is mostly concentrated in the Beijing-Tianjin-Hebei region, especially in Hebei Province. The economic development model still belongs to the extensive growth style with strong dependence on energy consumption [35], which makes the energy efficiency level generally low. The development of the tertiary industry in the Beijing-Tianjin-Hebei region is also lagging behind the Yangtze River Delta and the Pearl River Delta region. Therefore, the impact of the increase of the tertiary industry proportion on energy efficiency is limited.
From the perspective of the scale of government expenditure, the impact of the index on Beijing-Tianjin-Hebei is opposite to that of the Yangtze River Delta and the Pearl River Delta. Government intervention in the market will bring energy efficiency improvement in the Beijing-Tianjin-Hebei region, and it is obvious. This is opposite to the opinion of Wei et al. [7]. The reason may be that the Beijing-Tianjin-Hebei economic circle develops relatively late, to some extent it is dependent on national policy and financial support. Therefore, in a period of time, the scale of government expenditure will effectively improve energy efficiency.
As for the per capita income level, the increase of it in the Beijing-Tianjin-Hebei region will significantly reduce energy efficiency. In addition to the factors mentioned in the previous analysis, Chen et al. [23] put it that per capita GDP has a significant negative impact on energy efficiency in the whole society. There are two reasons. Firstly, the improvement of people’s living standards will increase consumers’ demand for energy; secondly, the lower level of per capita GDP directly produces its higher growth rate. However, the higher growth rate is caused by the large-scale consumption of energy resources rather than the increase of the energy efficiency. The results show that the per capita GDP increases with a relatively high speed, which slows down the growth rate of energy efficiency, that is, sacrifice energy efficiency in exchange for per capita GDP growth.
From the perspective of energy conservation awareness, in Beijing-Tianjin-Hebei and Yangtze River Delta regions, the amount of carbon dioxide emissions reduces energy efficiency. Using carbon dioxide emissions as a substitute for energy saving emission reduction awareness, the non-awareness in consumer energy conservation and emission reduction leads to an increase in carbon dioxide emissions. Thus, we should vigorously orient energy saving and emission reduction and improve energy conservation awareness, reducing carbon dioxide emissions to effectively improve the energy efficiency of the Beijing-Tianjin-Hebei region.
7. Conclusions
Using the DEA model, Tobit model, and provincial panel data of China’s three economic regions from 1990 to 2013, this research evaluates the total-factor energy efficiency of each region and explores the driving factors of efficiency changes. The empirical analyses draw the following implications:
The overall energy efficiency level of the three economic regions is not high, with a mean value of 0.718. Among them, the lowest energy efficiency appears in the Beijing-Tianjin-Hebei region, which is 0.528, and the highest is 0.908 in the Pearl River Delta, which is 72% higher than the lowest. The energy efficiency value is 0.845 in the Yangtze River Delta, which is 60% higher than the lowest. This fully demonstrates that the energy efficiency should be enhanced in the background of the recent coordinated development of the Beijing-Tianjin-Hebei economic zone in China.
In terms of factors that affect energy efficiency, there is a significant positive correlation between energy consumption structure and energy efficiency for the three economic regions as a whole, and for the individual Beijing-Tianjin-Hebei region. The increase of coal consumption proportion improves energy efficiency. This conclusion is different from most of the previous studies, and can mainly be attributed to the later development of Beijing-Tianjin-Hebei region. The relationship between industrial structure upgrade and energy efficiency improvement presents a weak negative in the Beijing-Tianjin-Hebei region, and a strong positive in the rest of the regions. This implies that the increase in the output share of the tertiary industry in GDP will improve the energy efficiency. The impact of government expenditure on energy efficiency in the Beijing-Tianjin-Hebei region is significantly positive. The fiscal intervention of the government in Beijing-Tianjin-Hebei region will bring improvement of energy efficiency, indicating that this region, to a certain extent, needs the support of national policy and funds. The negative correlation exists between per capita income level and energy efficiency, indicating that the higher economic development level will reduce energy efficiency. The awareness of energy saving and emission reduction has significantly positive correlation to energy efficiency, indicating that the government should strongly promote the publicity of related ideas which has the ability to improve the total-factor energy efficiency. The impact of energy policy on energy efficiency is positive, which shows, that in the energy sector, to develop and promulgate complete and systematic energy-saving measures can further improve energy efficiency. Natural endowment difference shows a positive correlation to energy efficiency, indicating that energy efficiency of coastal areas is generally higher than non-coastal areas.
The shortcomings of this paper are that, due to the influence of the selected areas, the concrete impact of the energy policy on the Beijing-Tianjin-Hebei region cannot be analyzed. People’s energy consumption habits may also have a significant impact on the energy efficiency, which needs to be further studied.
Acknowledgments
This study was supported by the Beijing Social Science Foundation (grant Nos. 2016BD0061), and the Fundamental Research Funds for the Central Universities (grant Nos. 2015ZD32).
Author Contributions
Sheng-An Shi designed and wrote the paper, and Long Xia and Ming Meng provided some useful advice.
Conflicts of Interest
The authors declare no conflict of interest.
References
- National Energy Administration. Available online: http://www.nea.gov.cn/2013-01/28/c_132132808.htm (accessed on 16 March 2017).
- National Energy Administration. Available online: http://www.nea.gov.cn/2017-01/17/c_135989417.htm (accessed on 16 March 2017).
- National Data. Available online: http://data.stats.gov.cn/easyquery.htm?cn=C01 (accessed on 26 March 2017).
- Wang, Q.Y. China’s energy efficiency and international comparison. Energy Conserv. Environ. Prot. 2005, 6, 10–13. [Google Scholar]
- Shi, D. Analysis of regional differences and energy-saving potential of energy efficiency in China. China Ind. Econ. 2006, 10, 49–58. [Google Scholar]
- Hu, J.L.; Wang, S.C. Total-factor energy efficiency of regions in China. Energy Policy 2006, 34, 3206–3217. [Google Scholar] [CrossRef]
- Wei, C.; Shen, M.H. Energy efficiency and its influencing factors: Empirical analysis based on DEA. Manag. World 2007, 8, 66–76. [Google Scholar]
- Li, L.S.; Zhou, Y. Can technological progress improve energy efficiency?—Based on the empirical test of China’s industrial sector. Manag. World 2006, 10, 82–89. [Google Scholar]
- Hu, G.H.; Qin, S.Y. A comparative study on total energy efficiency of “BRIC countries”—Based on DEA-Tobit model. Res. Sci. 2012, 34, 533–540. [Google Scholar]
- Ran, Q.Y.; Chen, R.Y. The influence of ownership structure on total factor energy efficiency. Xinjiang Norm. Univ. (Philos. Soc. Sci. Ed.) 2015, 36, 112–117. [Google Scholar]
- Gao, Z.Y.; Wang, Y. China’s energy productivity in the regional division and influencing factors analysis. Quant. Econ. Technol. Econ. Res. 2006, 9, 46–57. [Google Scholar]
- Qi, Z.X.; Chen, W.Y. Structural adjustment or technological progress? Analysis on the Factors of China’s Energy Efficiency Improvement after Reform and Opening up. Shanghai Econ. Res. 2006, 6, 8–16. [Google Scholar]
- Shi, B.; Shen, K.R. China’s total factor energy efficiency under the market segmentation: Empirical analysis based on the super efficiency DEA method. World Econ. 2008, 9, 49–59. [Google Scholar]
- Shi, D. Regional differences and causes of energy efficiency in China—variance decomposition based on stochastic frontier production function. Manag. World 2008, 2, 35–43. [Google Scholar]
- Li, G.Z.; Huo, Z.J. China’s total factor energy efficiency and convergence and its influencing factors—An empirical analysis based on provincial panel data from 1995 to 2006. Econ. Rev. 2009, 6, 101–109. [Google Scholar]
- Wang, K.L.; Yang, B.C.; Yang, L. Study on inter-provincial total factor energy efficiency considering environmental effects. Manag. Sci. 2010, 23, 100–111. [Google Scholar]
- Samuels, G. Potential production of energy cane for fuel in the Caribbean. Energy Prog. 1984, 4, 249–251. [Google Scholar]
- Richard, G.; Adam, B. The induced innovation hypothesis and energy—Saving technological change. Quar. J. Econ. 1999, 114, 941–975. [Google Scholar]
- Shi, D. China’s economic growth in the process of improving the efficiency of energy use. Econ. Res. 2002, 9, 36–43. [Google Scholar]
- Fisher-Vanden, K.; Jefferson, G.H.; Ma, J.; Xu, J. Technology development and energy productivity in China. Energy Econ. 2006, 28, 690–705. [Google Scholar] [CrossRef]
- Naranjo, P.G.V.; Pooranian, Z.; Shojafar, M.; Conti, M.; Buyya, R. FOCAN: A Fog-supported Smart City Network Architecture for Management of Applications in the Internet of Everything Environments. arXiv 2017, arXiv:1710.01801. [Google Scholar]
- Baccarelli, E.; Cordeschi, N.; Mei, A.; Panella, M. Energy-efficient dynamic traffic offloading and reconfiguration of networked data centers for big data stream mobile computing: Review, challenges, and a case study. IEEE Netw. 2016, 30, 54–61. [Google Scholar] [CrossRef]
- Chen, X.H.; Li, C.Q.; Zhang, G.R. Is the quality of economic growth consistent with energy efficiency? Nat. Res. 2013, 11, 1858–1868. [Google Scholar]
- Zhou, S.J.; Feng, L. Research on the relationship between energy efficiency and economic growth in China—Based on PSTR model. J. Hunan Univ. (Soc. Sci.) 2016, 2, 81–86. [Google Scholar]
- Charnes, A.; Cooper, W.W.; Rhodes, E. Measuring the efficiency of decision making units. Eur. J. Opera Res. 1978, 2, 429–444. [Google Scholar] [CrossRef]
- Banker, R.D.; Charnes, A.; Cooper, W.W. Some models for estimating technical and scale inefficiencies in data envelopment analysis. Manag. Sci. 1984, 30, 1078–1092. [Google Scholar] [CrossRef]
- Tobin, J. Estimation of relationships for limited dependent variables. Econometrica 1958, 26, 24–36. [Google Scholar] [CrossRef]
- Mcdonald, J.F.; Moffitt, R.A. The Uses of Tobit Analysis. Rev. Econ. Stat. 1980, 62, 318–321. [Google Scholar] [CrossRef]
- Goldsmith, R.W. A perpetual inventory of national wealth. Stud. Income Wealth 1951, 14, 5–61. [Google Scholar]
- Zhang, J.; Wu, G.Y.; Zhang, J.P. China’s inter-provincial material capital stock estimates: 1952–2000. Econ. Res. 2004, 10, 35–44. [Google Scholar]
- National Data. Available online: http://data.stats.gov.cn/easyquery.htm?cn=E0103 (accessed on 26 March 2017).
- Zeng, X.G. China’s energy efficiency, CO2 emission reduction potential and influencing factors analysis. China Environ. Sci. 2010, 30, 1432–1440. [Google Scholar]
- Jin, S.L. The impact of energy constraints on China’s potential output growth and its countermeasures. Reform 2006, 10, 36–42. [Google Scholar]
- Sun, P.; Gu, X.W.; Liu, J.Z. China’s energy consumption decomposition analysis. Res. Sci. 2005, 5, 15–19. [Google Scholar]
- Pei, G.F.; Zheng, M.H. Hebei Province, energy consumption and energy saving countermeasures analysis. Hebei Univ. (J. Philos. Soc. Sci.) 2011, 36, 87–93. [Google Scholar]
Figure 1.
Changing trend of the total-factor energy efficiencies of the three major economic regions.
Figure 1.
Changing trend of the total-factor energy efficiencies of the three major economic regions.

Figure 2.
Changing trend of the coefficient of variation.


Table 1.
Pearson correlations.
| GDP—Capital Input | GDP—Labor Input | GDP—Energy Input | |
|---|---|---|---|
| Beijing | 0.999 *** | 0.971 *** | 0.973 *** |
| Tianjin | 0.992 *** | 0.980 *** | 0.990 *** |
| Hebei | 0.993 *** | 0.978 *** | 0.983 *** |
| Shanghai | 0.999 *** | 0.973 *** | 0.988 *** |
| Jiangsu | 0.998 *** | 0.879 *** | 0.988 *** |
| Zhejiang | 0.999 *** | 0.988 *** | 0.987 *** |
| Guangdong | 0.994 *** | 0.985 *** | 0.991 *** |
| Beijing-Tianjin-Hebei | 0.998 *** | 0.993 *** | 0.985 *** |
| Yangtze River Delta | 0.998 *** | 0.985 *** | 0.990 *** |
| Pearl River Delta | 0.994 *** | 0.985 *** | 0.991 *** |
Note: *** indicates the significance at 1% level (two tailed test).
Table 2.
Energy efficiencies (1990–2013).
| Year | Beijing | Tianjin | Hebei | Shanghai | Jiangsu | Zhejiang | Guangdong | Beijing-Tianjin-Hebei | Yangtze River Delta | Pearl River Delta | Three Economic Region |
|---|---|---|---|---|---|---|---|---|---|---|---|
| 1990 | 0.619 | 1.000 | 0.717 | 1.000 | 0.784 | 0.857 | 1.000 | 0.605 | 0.859 | 1.000 | 0.772 |
| 1991 | 0.621 | 1.000 | 0.726 | 1.000 | 0.802 | 0.864 | 1.000 | 0.604 | 0.871 | 1.000 | 0.759 |
| 1992 | 0.598 | 1.000 | 0.714 | 1.000 | 0.841 | 0.860 | 1.000 | 0.598 | 0.881 | 1.000 | 0.760 |
| 1993 | 0.583 | 1.000 | 0.710 | 1.000 | 0.867 | 0.870 | 1.000 | 0.598 | 0.877 | 1.000 | 0.763 |
| 1994 | 0.572 | 1.000 | 0.692 | 1.000 | 0.881 | 0.874 | 1.000 | 0.597 | 0.896 | 1.000 | 0.773 |
| 1995 | 0.565 | 1.000 | 0.673 | 1.000 | 0.874 | 0.874 | 1.000 | 0.582 | 0.899 | 1.000 | 0.778 |
| 1996 | 0.543 | 1.000 | 0.649 | 1.000 | 0.892 | 0.854 | 1.000 | 0.579 | 0.900 | 1.000 | 0.783 |
| 1997 | 0.551 | 1.000 | 0.628 | 1.000 | 0.931 | 0.831 | 1.000 | 0.573 | 0.909 | 1.000 | 0.781 |
| 1998 | 0.559 | 1.000 | 0.623 | 1.000 | 0.946 | 0.829 | 1.000 | 0.567 | 0.911 | 1.000 | 0.785 |
| 1999 | 0.566 | 1.000 | 0.607 | 1.000 | 0.983 | 0.821 | 1.000 | 0.561 | 0.924 | 1.000 | 0.785 |
| 2000 | 0.569 | 1.000 | 0.573 | 1.000 | 0.992 | 0.801 | 1.000 | 0.542 | 0.919 | 1.000 | 0.766 |
| 2001 | 0.597 | 1.000 | 0.549 | 1.000 | 1.000 | 0.769 | 0.978 | 0.533 | 0.915 | 0.978 | 0.752 |
| 2002 | 0.604 | 1.000 | 0.523 | 1.000 | 1.000 | 0.737 | 0.951 | 0.520 | 0.895 | 0.951 | 0.736 |
| 2003 | 0.621 | 1.000 | 0.493 | 1.000 | 0.971 | 0.708 | 0.926 | 0.504 | 0.873 | 0.926 | 0.716 |
| 2004 | 0.610 | 1.000 | 0.481 | 1.000 | 0.859 | 0.674 | 0.889 | 0.491 | 0.817 | 0.889 | 0.689 |
| 2005 | 0.624 | 1.000 | 0.459 | 1.000 | 0.781 | 0.659 | 0.850 | 0.481 | 0.782 | 0.850 | 0.671 |
| 2006 | 0.629 | 1.000 | 0.456 | 1.000 | 0.779 | 0.653 | 0.843 | 0.477 | 0.780 | 0.843 | 0.664 |
| 2007 | 0.640 | 1.000 | 0.452 | 1.000 | 0.770 | 0.641 | 0.823 | 0.469 | 0.772 | 0.823 | 0.652 |
| 2008 | 0.666 | 1.000 | 0.435 | 1.000 | 0.790 | 0.639 | 0.812 | 0.472 | 0.786 | 0.812 | 0.658 |
| 2009 | 0.665 | 1.000 | 0.437 | 1.000 | 0.766 | 0.638 | 0.782 | 0.475 | 0.772 | 0.782 | 0.642 |
| 2010 | 0.667 | 1.000 | 0.449 | 1.000 | 0.765 | 0.631 | 0.766 | 0.473 | 0.769 | 0.766 | 0.638 |
| 2011 | 0.679 | 1.000 | 0.452 | 1.000 | 0.750 | 0.616 | 0.741 | 0.466 | 0.756 | 0.741 | 0.627 |
| 2012 | 0.668 | 1.000 | 0.456 | 1.000 | 0.741 | 0.615 | 0.708 | 0.454 | 0.751 | 0.708 | 0.623 |
| 2013 | 0.734 | 0.977 | 0.449 | 1.000 | 0.767 | 0.617 | 0.722 | 0.444 | 0.765 | 0.722 | 0.648 |
| Mean | 0.615 | 0.999 | 0.558 | 1.000 | 0.856 | 0.747 | 0.908 | 0.528 | 0.845 | 0.908 | 0.718 |
Table 3.
Description to the efficiency-related factors.
| Variable | Mean | Std. Dev. | Min | Max | Variable Interpretation |
|---|---|---|---|---|---|
| EnergyEffi | 0.743 | 0.185 | 0.444 | 1.000 | Energy efficiency, that is the efficiency of the first phase |
| ConsuStru | 0.581 | 0.110 | 0.395 | 0.772 | Structure of energy consumption |
| IndusStru | 0.440 | 0.043 | 0.334 | 0.520 | Industrial structure |
| FinanExpen | 0.112 | 0.026 | 0.063 | 0.178 | Scale of financial expenditure |
| GDPper | 3.798 | 0.248 | 3.335 | 4.285 | Per capita income level, take the log value |
| CO2 | 6.630 | 0.756 | 5.340 | 7.746 | Energy conservation and emission reduction consciousness, take the carbon dioxide emission log a |
| EnergyPoli | 0.368 | 0.487 | 0.000 | 1.000 | Energy policy b |
| CoastAre | 0.667 | 0.476 | 0.000 | 1.000 | Coastal areas instead of the Natural endowment difference c |
Note: a Using the carbon dioxide emission coefficient of the IPCC in 2006, we calculated the carbon dioxide emissions based on raw coal, coke, crude oil, gasoline, kerosene, diesel oil, fuel oil, and natural gas. Raw data were selected from the web site of National Bureau of Statistics [31] b The energy policy variable was issued as a cut-off point in the “2007 energy conservation law of the People’s Republic of China”, which was set as 0 before 2007 and 1 after 2007; c The natural endowment difference, the Beijing-Tianjin-Hebei region is 0, the Yangtze River Delta and the Pearl River Delta are all 1.
Table 4.
Tobit regression results.
| Three Economic Region | Beijing-Tianjin-Hebei | Yangtze River Delta | Pearl River Delta | |
|---|---|---|---|---|
| ConsuStru | 0.177 *** | 0.143 *** | −0.085 | −0.006 |
| −0.052 | −0.098 | −0.143 | −0.159 | |
| IndusStru | 0.378 ** | −0.094 | 1.415 *** | 1.025 *** |
| −0.188 | −0.132 | −0.207 | −0.184 | |
| FinanExpen | 1.385 *** | 1.262 *** | −1.259 * | −1.062 * |
| −0.314 | −0.287 | −0.621 | −0.404 | |
| GDPper | −0.335 *** | −0.194 *** | −0.213* | −0.539 *** |
| −0.046 | −0.048 | −0.106 | −0.035 | |
| CO2 | −0.057 *** | −0.062 *** | −0.049 ** | 0.007 |
| −0.011 | −0.012 | −0.019 | −0.008 | |
| EnergyPoli | 0.021 * | |||
| −0.011 | ||||
| CoastAre | 0.430 *** | |||
| −0.023 | ||||
| CM | 0.223 | 0.154 | 0.398 | 0.214 |
| Individual effect | No | |||
| Time effect | Yes |
Note: (1) * indicates the significance at 10% level, ** indicates the significance at 5% level, and *** indicates the significance at 1% level. (2) The data in brackets is the Std. Dev. estimated by the maximum likelihood estimation method. (3) CM is the acronym of the conditional moment, which is used to test the ut normality of the Tobit model.
© 2017 by the authors. Licensee MDPI, Basel, Switzerland. This article is an open access article distributed under the terms and conditions of the Creative Commons Attribution (CC BY) license (http://creativecommons.org/licenses/by/4.0/).
Share and Cite
MDPI and ACS Style
Shi, S.-A.; Xia, L.; Meng, M. Energy Efficiency and Its Driving Factors in China’s Three Economic Regions. Sustainability 2017, 9, 2059. https://doi.org/10.3390/su9112059
AMA Style
Shi S-A, Xia L, Meng M. Energy Efficiency and Its Driving Factors in China’s Three Economic Regions. Sustainability. 2017; 9(11):2059. https://doi.org/10.3390/su9112059
Chicago/Turabian StyleShi, Sheng-An, Long Xia, and Ming Meng. 2017. "Energy Efficiency and Its Driving Factors in China’s Three Economic Regions" Sustainability 9, no. 11: 2059. https://doi.org/10.3390/su9112059
Note that from the first issue of 2016, this journal uses article numbers instead of page numbers. See further details here.