Article

System Dynamics of Polysilicon for Solar Photovoltaics: A Framework for Investigating the Energy Security of Renewable Energy Supply Chains

1
National Renewable Energy Laboratory, Golden, CO 80401, USA
2
Lexidyne, LLC, Colorado Springs, CO 80903, USA
3
Thayer School of Engineering at Dartmouth, Hanover, NH 03755, USA
*
Author to whom correspondence should be addressed.
Sustainability 2018, 10(1), 160; https://doi.org/10.3390/su10010160
Submission received: 31 October 2017 / Revised: 5 January 2018 / Accepted: 8 January 2018 / Published: 11 January 2018
(This article belongs to the Special Issue Energy Security and Sustainability)

Abstract

:
Renewable energy, produced with widely available low-cost energy resources, is often included as a component of national strategies to address energy security and sustainability. Market and political forces cannot disrupt the sun or wind, unlike oil and gas supplies. However, the cost of renewable energy is highly dependent on technologies manufactured through global supply chains in leading manufacturing countries. The countries that contribute to the global supply chains may take actions that, directly or indirectly, influence global access to materials and components. For example, high-purity polysilicon, a key material in solar photovoltaics, has experienced significant price fluctuations, affecting the manufacturing capacity and cost of both polysilicon and solar panels. This study developed and validated an initial system dynamics framework to gain insights into global trade in polysilicon. The model represents an initial framework for exploration. Three regions were modeled—China, the United States, and the rest of the world—for a range of trade scenarios to understand the impacts of import duties and non-price drivers on the relative volumes of imports and domestic supply. The model was validated with the historical case of China imposing an import duty on polysilicon from the United States, the European Union, and South Korea, which altered the regional flows of polysilicon—in terms of imports, exports, and domestic production—to varying degrees. As expected, the model tracked how regional demand shares and influx volumes decrease as a duty on a region increases. Using 2016 as a reference point, in the scenarios examined for U.S. exports to China, each 10% increase in the import duty results in a 40% decrease in import volume. The model also indicates that, under the scenarios investigated, once a duty has been imposed on a region, the demand share from that region declines and does not achieve pre-duty levels, even as global demand increases. Adding additional countries and other components in the photovoltaic supply chain (panels, cells, wafers) to this model could enable policymakers to better understand the relative impact of trade measures across the entire photovoltaic module manufacturing supply chain and the conditions that encourage industry evolution and competitiveness.

1. Introduction

Energy security is generally defined as the availability of sufficient affordable energy resources that are resilient to significant price disruptions [1,2]. However, the meaning of energy security differs depending on individual and geopolitical perspectives. For example, Yergin [3] defines four key principles to achieve energy security: diversification of energy sources, resilience of supply chain to disruptions, integration into stable global markets, and information about markets and prospects. Similarly, Kruyt et al. [4] measures energy security in terms of geographic availability, geopolitical accessibility, economic affordability, and environmental and social acceptability.
In the last century, energy security has predominantly meant the access to, production of, and trade in hydrocarbons (including oil and natural gas) and derivative products [3,4]. Oil and natural gas production and distribution—for transportation, industrial processes, heating, and the production of electricity—has been essential for functioning economies and human systems. This dependency on such a narrow set of energy sources increases the potential for economic and societal disruption if supplies of these fundamental materials are limited or manipulated by petroleum-exporting countries. Even when access is not limited, fluctuations in oil prices over the past decades add uncertainties to markets dependent on these unequally distributed resources [5].
Renewable energy has been proposed as one means to improve energy security [1,6,7]. The principles behind these recommendations are that renewable energy sources are inherently locally generated and, if considered as a portfolio, more broadly distributed than petroleum resources. Additionally, operational costs are low and, for solar, wind, and most renewable energy sources, the marginal fuel cost is equal to or close to zero, thus not subject to the same degree of cost fluctuations from geopolitical influences as are fossil fuels. While solar and wind resource availability is variable, this variability is based on natural forces that can largely be predicted and accommodated [8,9]. The cost of renewable energy is primarily dependent on the capital and installation costs, with low fixed operation costs and low to nonexistent variable costs, including fuel costs [10].
While superficially this may lead to the conclusion that renewable energy sources have low risk for energy security, this conclusion may not hold during all stages of its development, notably its buildout and expansion. Two factors identified by Yergin [3] for hydrocarbon-based energy are also relevant to renewable energy technologies: the globalization and protection of the entire supply chain. Specifically, the distributed nature of two of the dominant renewable energy technologies, solar and wind energy, requires the deployment of millions of solar panels and wind turbines, each of which are manufactured and traded in global markets, as finished products and along each link of their supply chain back to the raw materials [11]. While it is not easy for market forces to disrupt the power of the sun or wind, it is possible to have variability in the price of the technology itself or the components and materials in its supply chain. For example, the current dominant solar energy technology is crystalline silicon (c-Si) photovoltaics (PV) that depend on the supply of polysilicon, a highly processed, high-purity silicon-based material. Figure 1 illustrates the observed variability in historical polysilicon prices, which adds uncertainty to the c-Si PV markets, in a manner similar to the fluctuations of oil prices, except on the technology buildout cost instead of the marginal fuel cost.
Over the last decade, as demand for renewable energy technologies—particularly solar PV modules and wind turbines—has rapidly increased and more countries are deploying solar and wind at multi-GW scale, global manufacturing supply chain networks have evolved to support increased international trade of intermediates and products along these supply chains. The emergence of global supply chains has been key to reducing the cost of PV modules by enabling specialization in manufacturing one or more intermediates within the supply chain and the scaling up of global solar PV production capacity [13]. However, as the industry has become more competitive, and governments have taken trade actions and worked to promote domestic PV manufacturing—through local content requirements and domestic incentives like preferential access to financing—challenges associated with maintaining global supply chains have emerged. These types of actions can have a significant impact on global trade and can constrain renewable energy sector expansion globally by jeopardizing the overall efficiency (and security) of global supply chains and increasing prices for intermediate inputs and products paid by downstream manufacturers and consumers [14].
Deeper understanding of domestic clean energy industry responses to evolving global markets could increase the awareness of disruption potential and the role of domestic policy strategies. Disruptions could include: the overbuilding of PV technology production capacity worldwide resulting in extremely low pricing for PV cells and modules; legitimate use of anti-dumping (AD) (AD: “An anti-dumping duty (AD) is an additional duty levied on imported goods to offset the injurious effects the dumped imports might cause to the domestic industry.” [15]) and countervailing duty (CVD) (CVD: “A countervailing duty (CVD) is an additional levy imposed on imported goods to offset the injurious effect to the domestic industry of subsidies provided to producers or exporters by the government of the exporting country.” [15]) actions to address dumping and/or countervailable subsidization that has caused injury to a domestic industry; retaliatory trade actions that are potentially incompatible with the multilateral trading rules; restricted trade in raw and processed natural resources important to the PV panel supply chain; or early termination of clean energy production tax credits or feed-in tariffs.
This analysis establishes a system dynamics (SD) framework to explore global clean energy manufacturing supply chains in terms of internal interactions, as well as feedback and responses to external influences. The objective is to develop insights into the dynamics and leverage points that can be used to guide the types and timing of policies and actions that can mitigate disruptions, improve efficiencies in international trade and investment, and enhance security of supply chains. Specifically, this study reports on the development and use of a basic structural model to investigate the dynamics of solar-grade polysilicon manufacturing and trade, as influenced by historical regional trade policy, and provides a foundation for further analysis into more complex supply chain issues. Polysilicon was selected as the focus for this study particularly due to the documented impact of targeted tariffs on global trade flows.

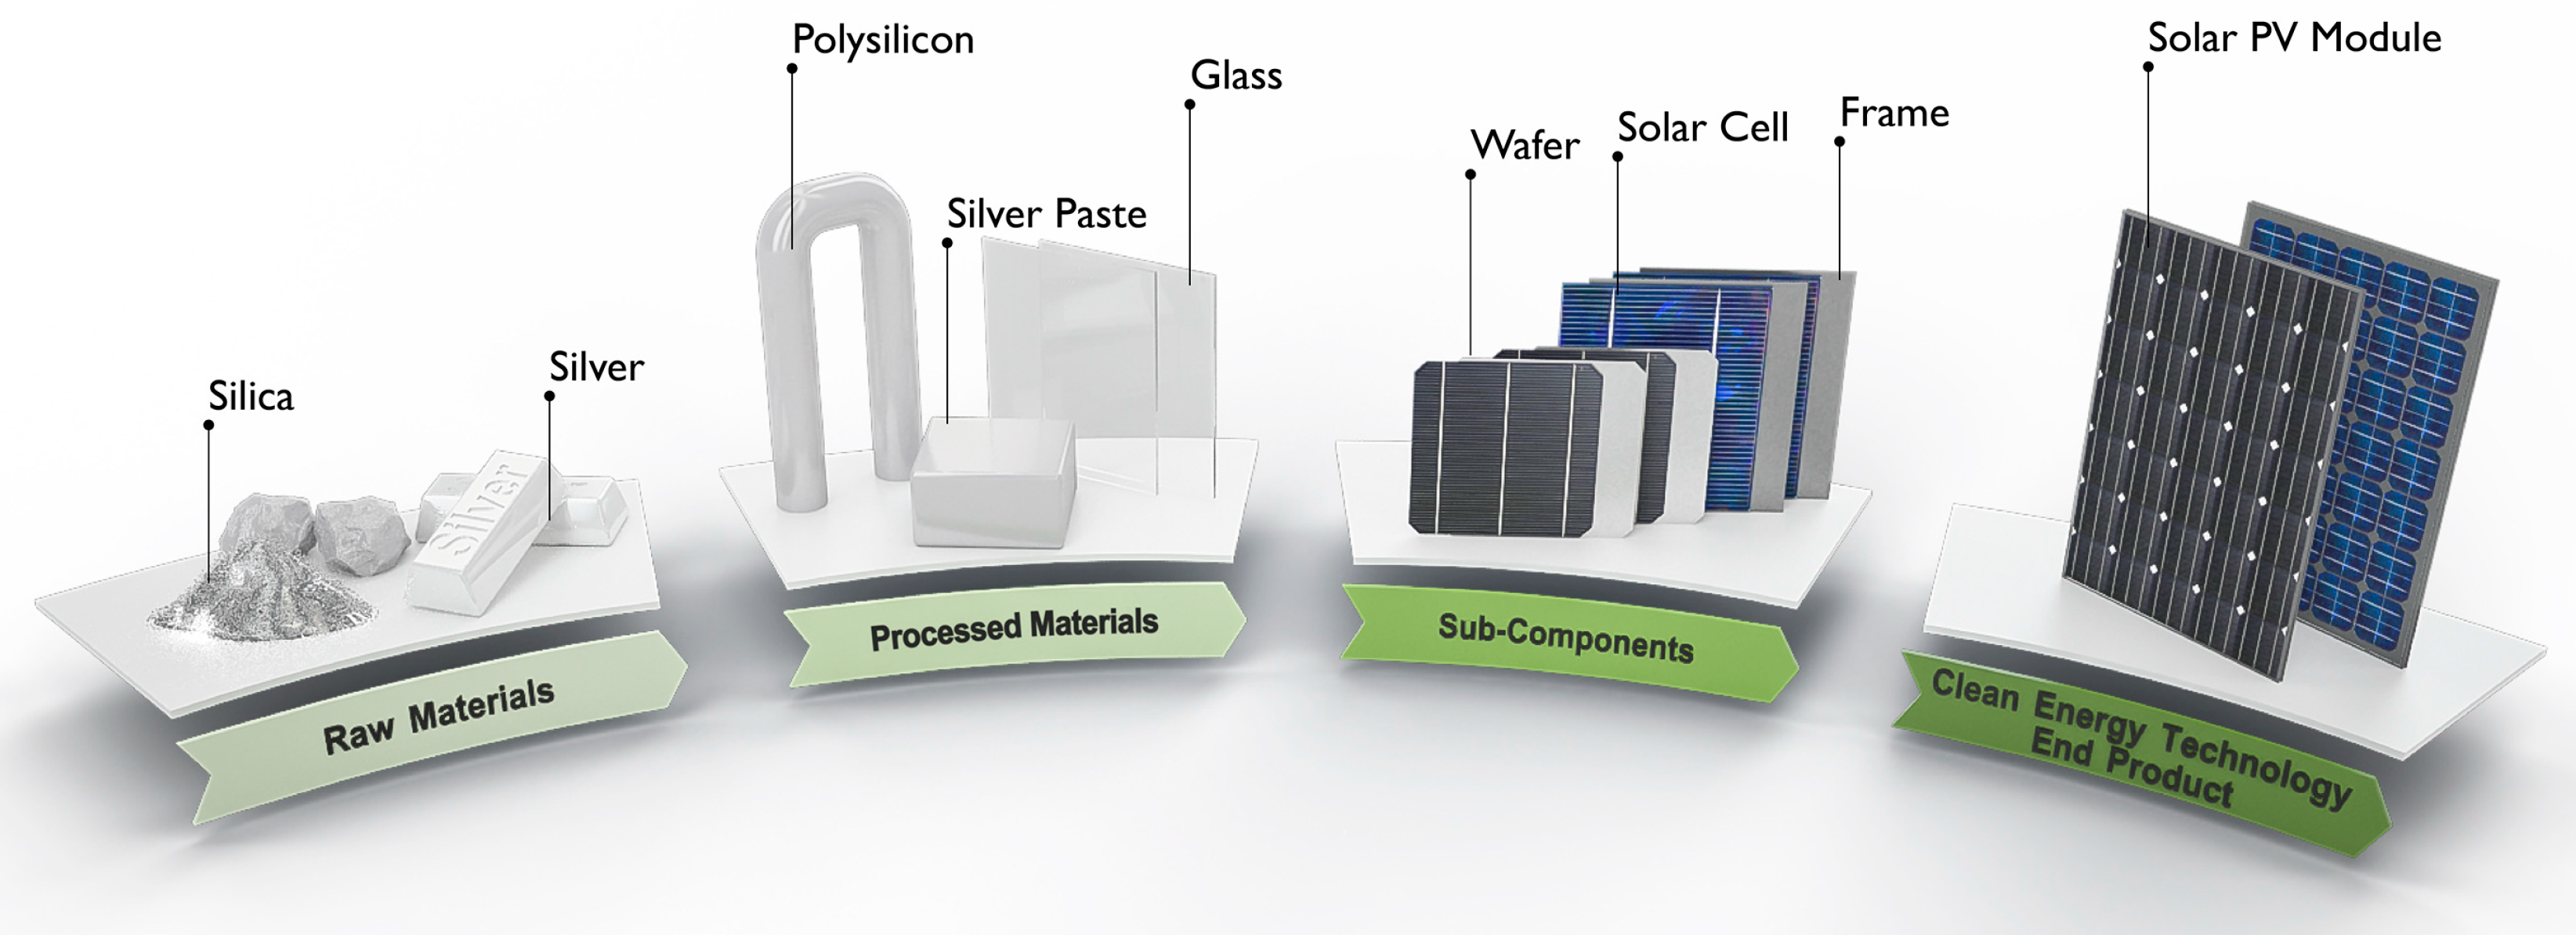
1.1. PV Module Manufacturing Supply Chain

c-Si-based PV modules are considered a mature technology, accounting for over 90% of the PV market [16]. Figure 2 highlights the key intermediates of the c-Si PV module manufacturing supply chain, with production of solar-grade polysilicon from silica included in the second “processed materials” step. For today’s PV module manufacturing processes, polysilicon utilization is about 5 g per watt [17].
In 2016 the exports of PV modules, cells, and polysilicon among the top 12 PV module-producing countries totaled $31.0 billion and the imports totaled $29.2 billion (This analysis will be included in an updated version of Benchmarks of Global Clean Energy Manufacturing, published by Clean Energy Manufacturing Analysis Center, Golden, CO, USA) [18]. China was the largest exporter of cells and modules, exporting $11.9 billion. Upstream, the United States and South Korea were the largest exporters of polysilicon at $1.6 billion and $1.3 billion, respectively [18]. The trade flows and balance of trade for the PV module manufacturing supply chain—PV modules, cells, and polysilicon—are shown in Figure 3. This figure shows that regions that may be net importers of end products may be net exporters of upstream materials and subcomponents, highlighting the complexity of global supply chain networks.

1.2. Polysilicon Manufacturing

The polysilicon required for PV modules is high purity from 5N (five nines, 99.999%) to 10N, somewhat less than electronic grade of 11N or higher [19]. Relative to other intermediates along the PV module manufacturing supply chain, polysilicon manufacturing plants are capital-intensive, with plant costs ranging from $35/kg to $100/kg of annual production capacity depending upon manufacturing location, technology, and plant size [17]. New polysilicon plants are typically designed to produce on the order of 10 million kg annually, requiring an investment of $350 million to $1 billion [17,20]. The large scale and design complexity of polysilicon production plants result in relatively long lead times of two to five years to move from planning through engineering and construction to operation, with an additional six to 12 months needed to ramp up to full production [17]. Given the high capital costs and relative lack of modularity of polysilicon plants, they are generally operated at a high utilization rate (>80% typically) or shut down [17].
Polysilicon manufacturing costs dropped by about 25% between 2012 and 2014 [17]. In addition to downward price pressures from the overcapacity of solar-grade polysilicon, process improvements—including increased productivity and polysilicon yields from larger, better performing reactors and higher energy efficiency for chemical vapor deposition processes—along with increasing economies of scale were key drivers of cost reductions [17]. Solar-grade polysilicon production costs (for 2014) were in the range of $23–$25/kg for U.S. production facilities and $11–$23/kg for Chinese production facilities [19].

1.3. The Polysilicon Market Today

Global solar-grade polysilicon demand is driven by PV module demand, which continues to grow rapidly, increasing 33% between 2015 and 2016 to a total capacity of 303 GW in 2016. China accounted for 47% of this growth [21].
In 2016 global solar-grade polysilicon demand reached 391 million kg, up from 88.4 million kg in 2010. The 2016 demand split among the top four countries shifted relatively little since 2010 as global demand has increased [22], as shown in Table 1. In contrast, as global polysilicon production has grown from 159 million kg in 2010 to 356 million kg of polysilicon in 2016, the top producers have shifted significantly (see Table 1). In 2010 the United States was the top producer (31.9% of total global production), with China a close second (25.2% of total global production); by 2016 China’s production doubled from 2010, producing almost 50% of the world’s polysilicon, while the United States dropped to the fourth largest producer, accounting for 11% of total global production [22]. Global polysilicon manufacturing capacity stood at 414 million kg in 2016, representing an excess relative to production and demand [22]. The distribution of manufacturing capacity across the top countries follows the production distribution trends.

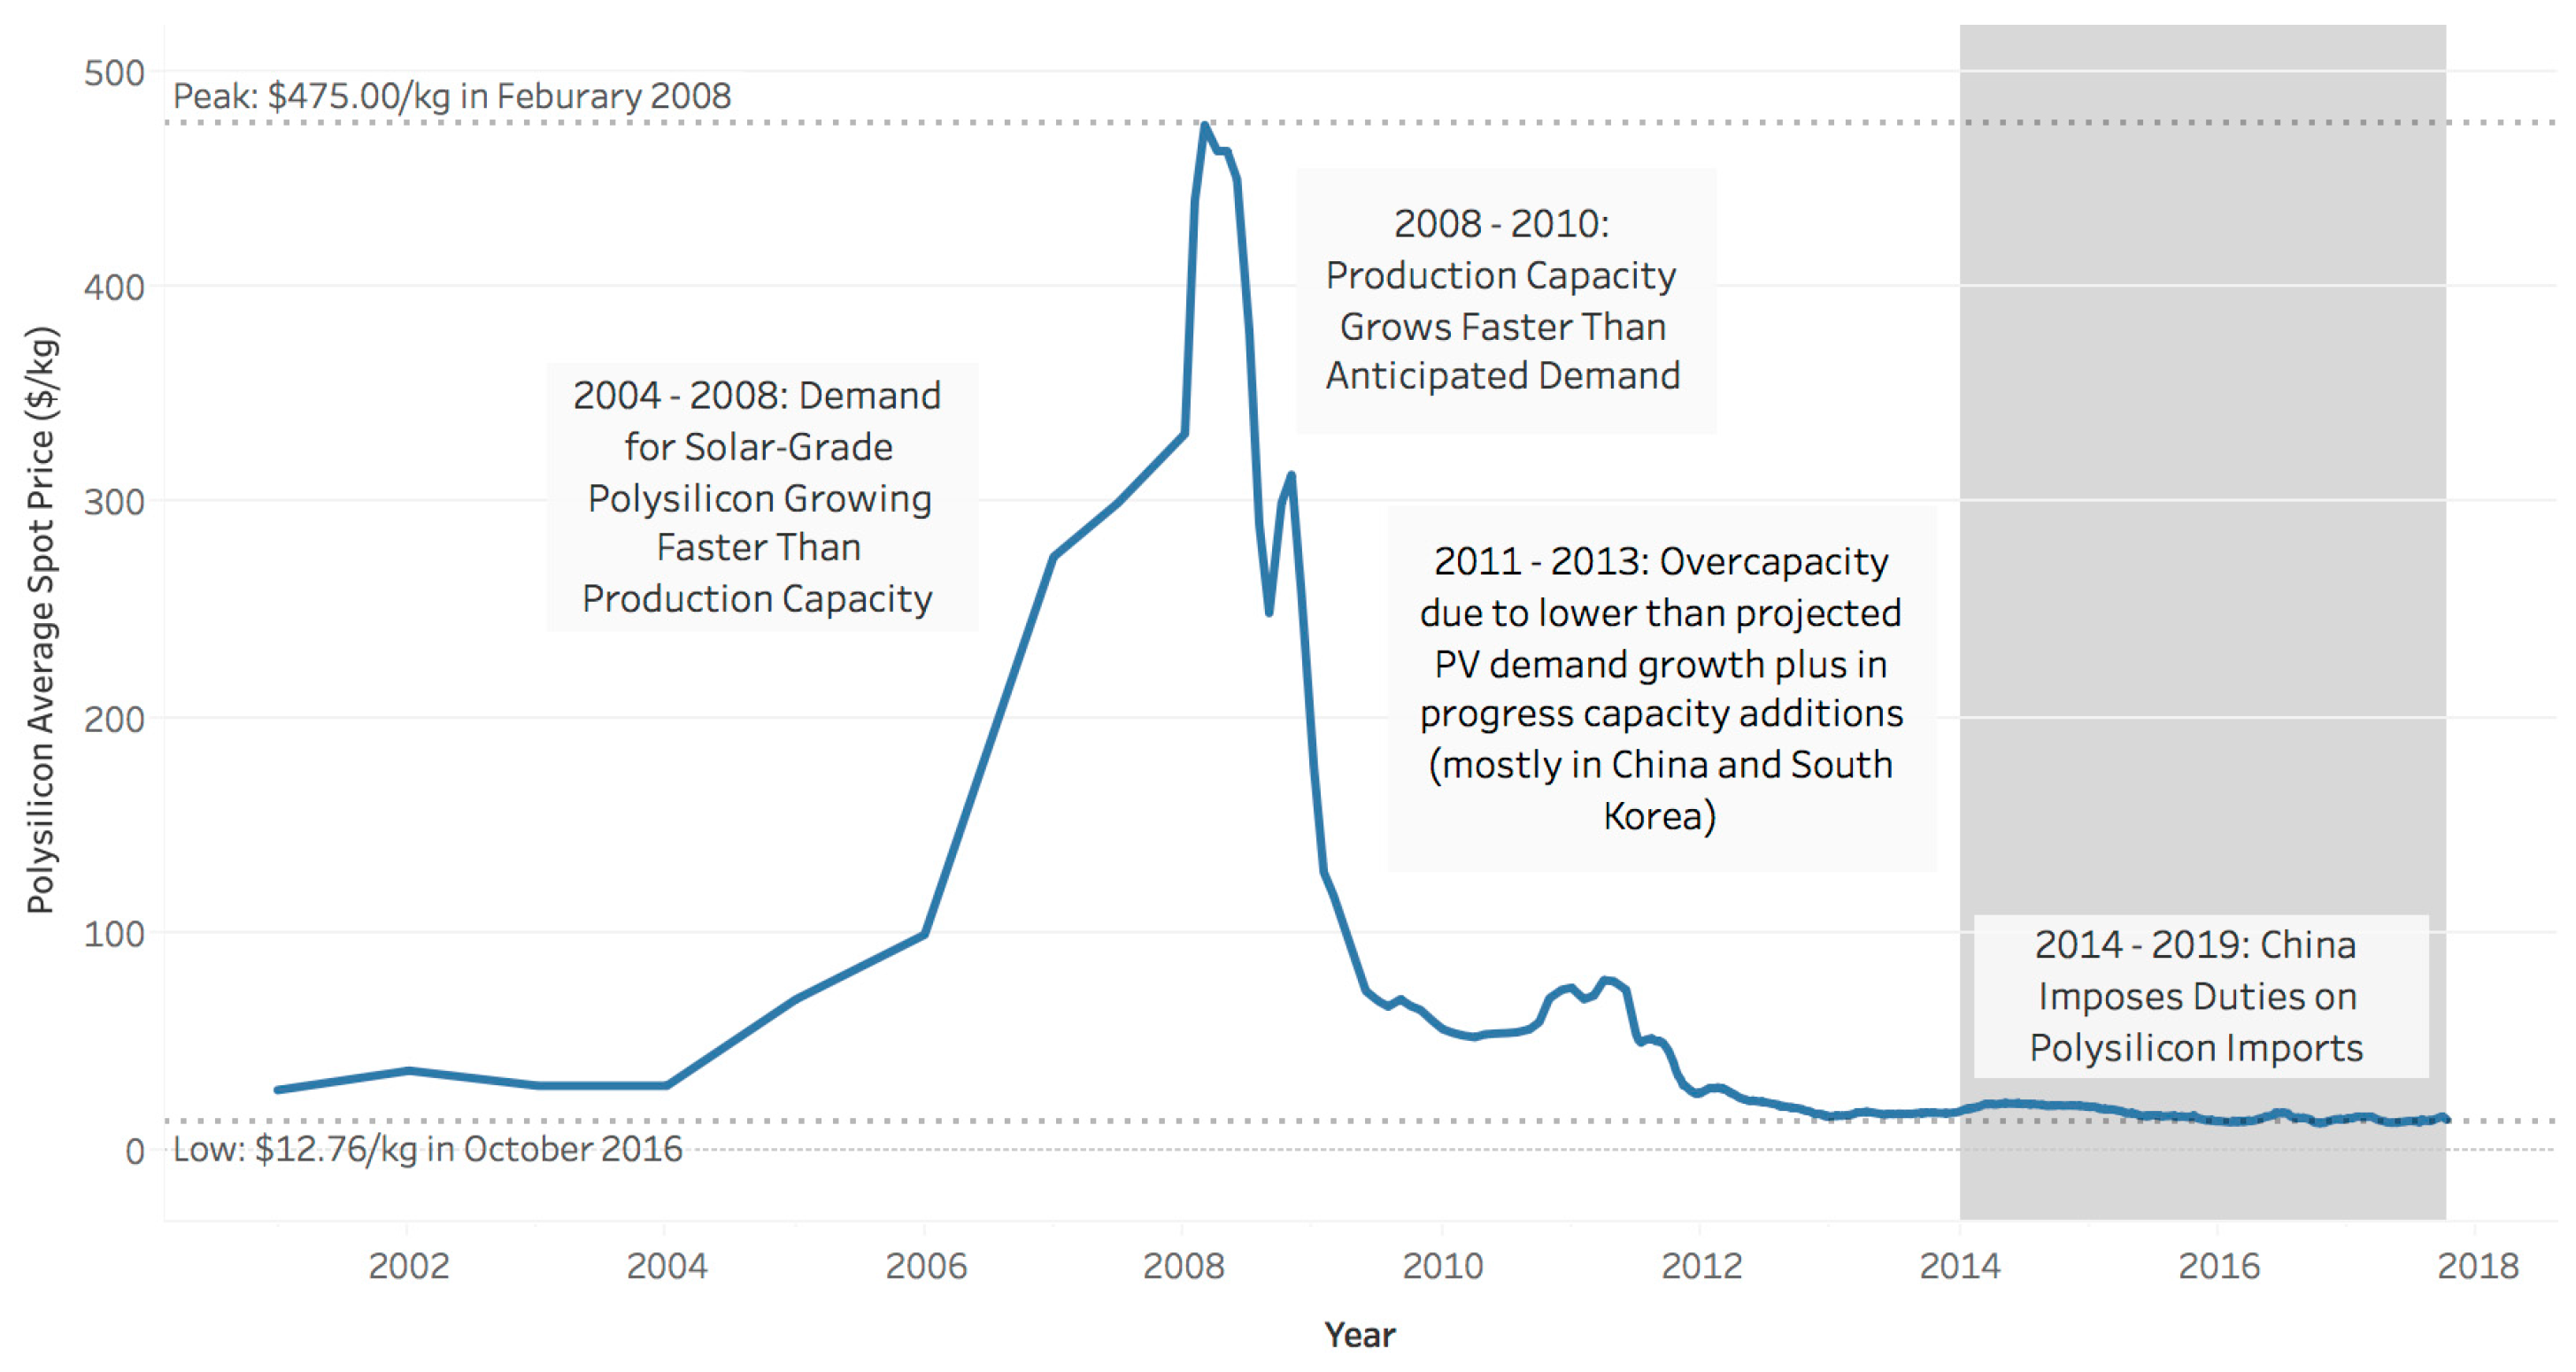
1.4. Polysilicon Market Evolution and Volatility

Before 2000, more than 80% of polysilicon produced was consumed by the semiconductor industry, with the PV industry relying on “off-spec” material (material that does not meet the stringent electronic-grade purity required for integrated circuits) remaining from the electronic wafer production process [17,23]. With the growth in PV module demand over the last decade, and the associated emergence of dedicated solar-grade polysilicon production to meet that demand, this situation has almost completely reversed. In 2016, 90% of polysilicon used worldwide was consumed by the solar industry [20]. This transformation has led to significant cyclical fluctuations in the market price of polysilicon. For example, between 2004 and 2012, the solar-grade polysilicon market was initially undersupplied and the average spot selling price exceeded $400/kg in 2008; as manufacturing capacity quickly grew, the market became oversupplied and the average spot selling price dropped to $15/kg in 2012 [20]. Overall, since 2012, aside from a brief recovery in 2014 when the spot price reached $22.60/kg, downward price pressure from oversupply has continued; in October 2016, the spot price dropped to just under US$13/kg, a new record low [20]. These historical trends are presented in Figure 1. Even with low spot prices, in 2014, most polysilicon (65% to 70% of total) was still sold through medium- and long-term bilateral contracts (to ensure a steady supply of high-quality polysilicon [24]), with the remaining 30% to 35% sold through the spot market [17]. Contract prices have ranged from $35/kg in 2003, peaking at ~$70/kg in 2007, and then dropping to ~$20/kg in 2015 [20].
Since the establishment of the dedicated solar polysilicon market, uncertainty in PV module demand as policies are enacted and expire has contributed to polysilicon supply-demand imbalances. Polysilicon pricing is generally more sensitive to fluctuations in supply-demand balance (over/under-capacity cycles) than other supply chain intermediates because polysilicon plants, with their high capital costs, large size, and long lead and ramp times, do not have the flexibility to respond quickly to relatively rapidly changing market conditions [17]. In addition to supply–demand imbalances, polysilicon price variations are also driven by differences in manufacturing cost related to the specific production process employed and the plant location [19]. Electricity rates, labor rates, raw material costs, and capital costs vary by location and can significantly influence manufacturing costs as described above [19].
Polysilicon price fluctuations impact the downstream manufacturing costs of PV wafers, cells, and modules. For example, between 2008 and 2014, polysilicon price reductions contributed about $2.3/watt to the decline in total module production cost. Polysilicon costs contributed around $2.40/watt and $0.12/watt to module manufacturing costs in 2008 and 2014, respectively [19].

1.5. PV Module Supply Chain Trade Actions

Over the last decade, international trade actions in the renewable energy technology sector, particularly PV trade between the United States, the European Union, and China, have risen significantly [14,15]. In 2009–2010, manufacturers in Germany and the United States first expressed concerns about China’s direct subsidies for its domestic solar manufacturing companies [25]. In 2012, the United States Department of Commerce issued AD and CVD orders on solar cells produced in China regardless of where those cells were incorporated into solar modules (with duties of 18.32–249.96% [AD] and 14.78–15.97% [CVD]) [26,27]. In 2013, the European Union followed suit (27.3–64.9% [AD] and 3.5–11.5% [CVD]) [28,29,30]. In 2015, to close a “loophole” that allowed Chinese exporters to avoid the U.S. AD and CVD orders by producing solar modules in China from solar cells made in third countries, the U.S. Department of Commerce issued a second set of AD and CVD orders on imports of solar modules from China made with third-country solar cells (with duties of 26.71–165.04% [AD] and 27.64–49.79% [CVD]) [15,31,32].
In early 2014, the Chinese Ministry of Commerce imposed AD and CVD on polysilicon exports from the United States (53.3–57% [AD] and 0–2.1% [CVD]) [33,34], which resulted in a significant reduction of U.S. exports to China. The Chinese Ministry of Commerce has also imposed AD and CVD duties on polysilicon exports from the European Union (14.3–42% [AD] 1.2% [CVD]), as well as South Korea (2.4–48.7% [AD]) [20,33,35,36]. Initially, under “processing trade rules”, the duties did not apply to U.S. polysilicon imports into China that were used in the production of exported modules, allowing U.S. firms to continue to ship polysilicon to Chinese ingot and wafer manufacturers. China closed this loophole in September 2014, possibly in response to additional duties on Chinese module imports to the United States [17,20,37].
In all of these trade actions targeting solar PV trade, specific manufacturing companies were assessed either higher or lower duties based on the complainant country’s investigation results. Trade actions enacted by the United States, China, and the European Union over the last decade are summarized in Table 2.
The impacts of trade actions—specifically ADs and CVDs—on the PV industry can include the following [14,15]:
  • Trade actions directly reduce imports of targeted products. For example, between 2009 and 2014, AD and CVD measures reduced c-Si PV cell trade by about $8.5 billion [14,15].
  • Trade actions can lead to trade diversion, shifting production, imports and exports.
  • From a supply chain perspective, trade actions can increase the costs of inputs for downstream producers by limiting imports of lower cost upstream intermediates.
  • Over the longer term, increasing use of trade actions can impact competitiveness and inhibit investment in the solar-PV energy sector.
The trade actions in the PV industry have impacted global trade dynamics across the supply chain. The impacts on polysilicon trade flows are highlighted in Figure 4. When China began action to impose duties on solar-grade polysilicon in 2011 [25], trade dynamics began to change. (Many other factors contribute to the fluctuations of imports and exports over time including global price variability, regional price differences, cost of production, increasing manufacturing capacity, and technology improvements that reduce the polysilicon required for each PV module. For example, the price of polysilicon, which has dropped sharply since 2008 (see Figure 1, also influenced the value of trade.) Specifically, China’s imports from the United States dropped dramatically, with the gap filled by increased imports from South Korea and the rest of the world (as well as increased domestic Chinese polysilicon production, which is not shown in Figure 1). Likewise, U.S. exports to China dropped dramatically, with the gap filled, in part, by increased exports to Japan. The drop in demand led some U.S. polysilicon manufacturers to shut down.
The rapidly changing PV industry—with its expanding market, evolving global supply chain network, and competing domestic and international interests—is well suited for investigation using an SD approach.

2. Data and Methods

SD is a methodology designed to improve the understanding of the behavior of complex systems over time. Originally developed in the 1950s by Jay Forrester at the Massachusetts Institute of Technology [42], the approach was initially used to address supply chain management issues [43]. SD can facilitate communication among stakeholders, clarify mental models, analyze the impacts of policy interventions, and support strategic decision-making [44], and has been applied to a broad set of problems in business, social, ecological, and economic systems [44,45]. An adaptation of feedback control system principles, SD is utilized to represent how dynamic systems and processes are structured and to understand how their performance could be improved [46]. The methodology has three key components:
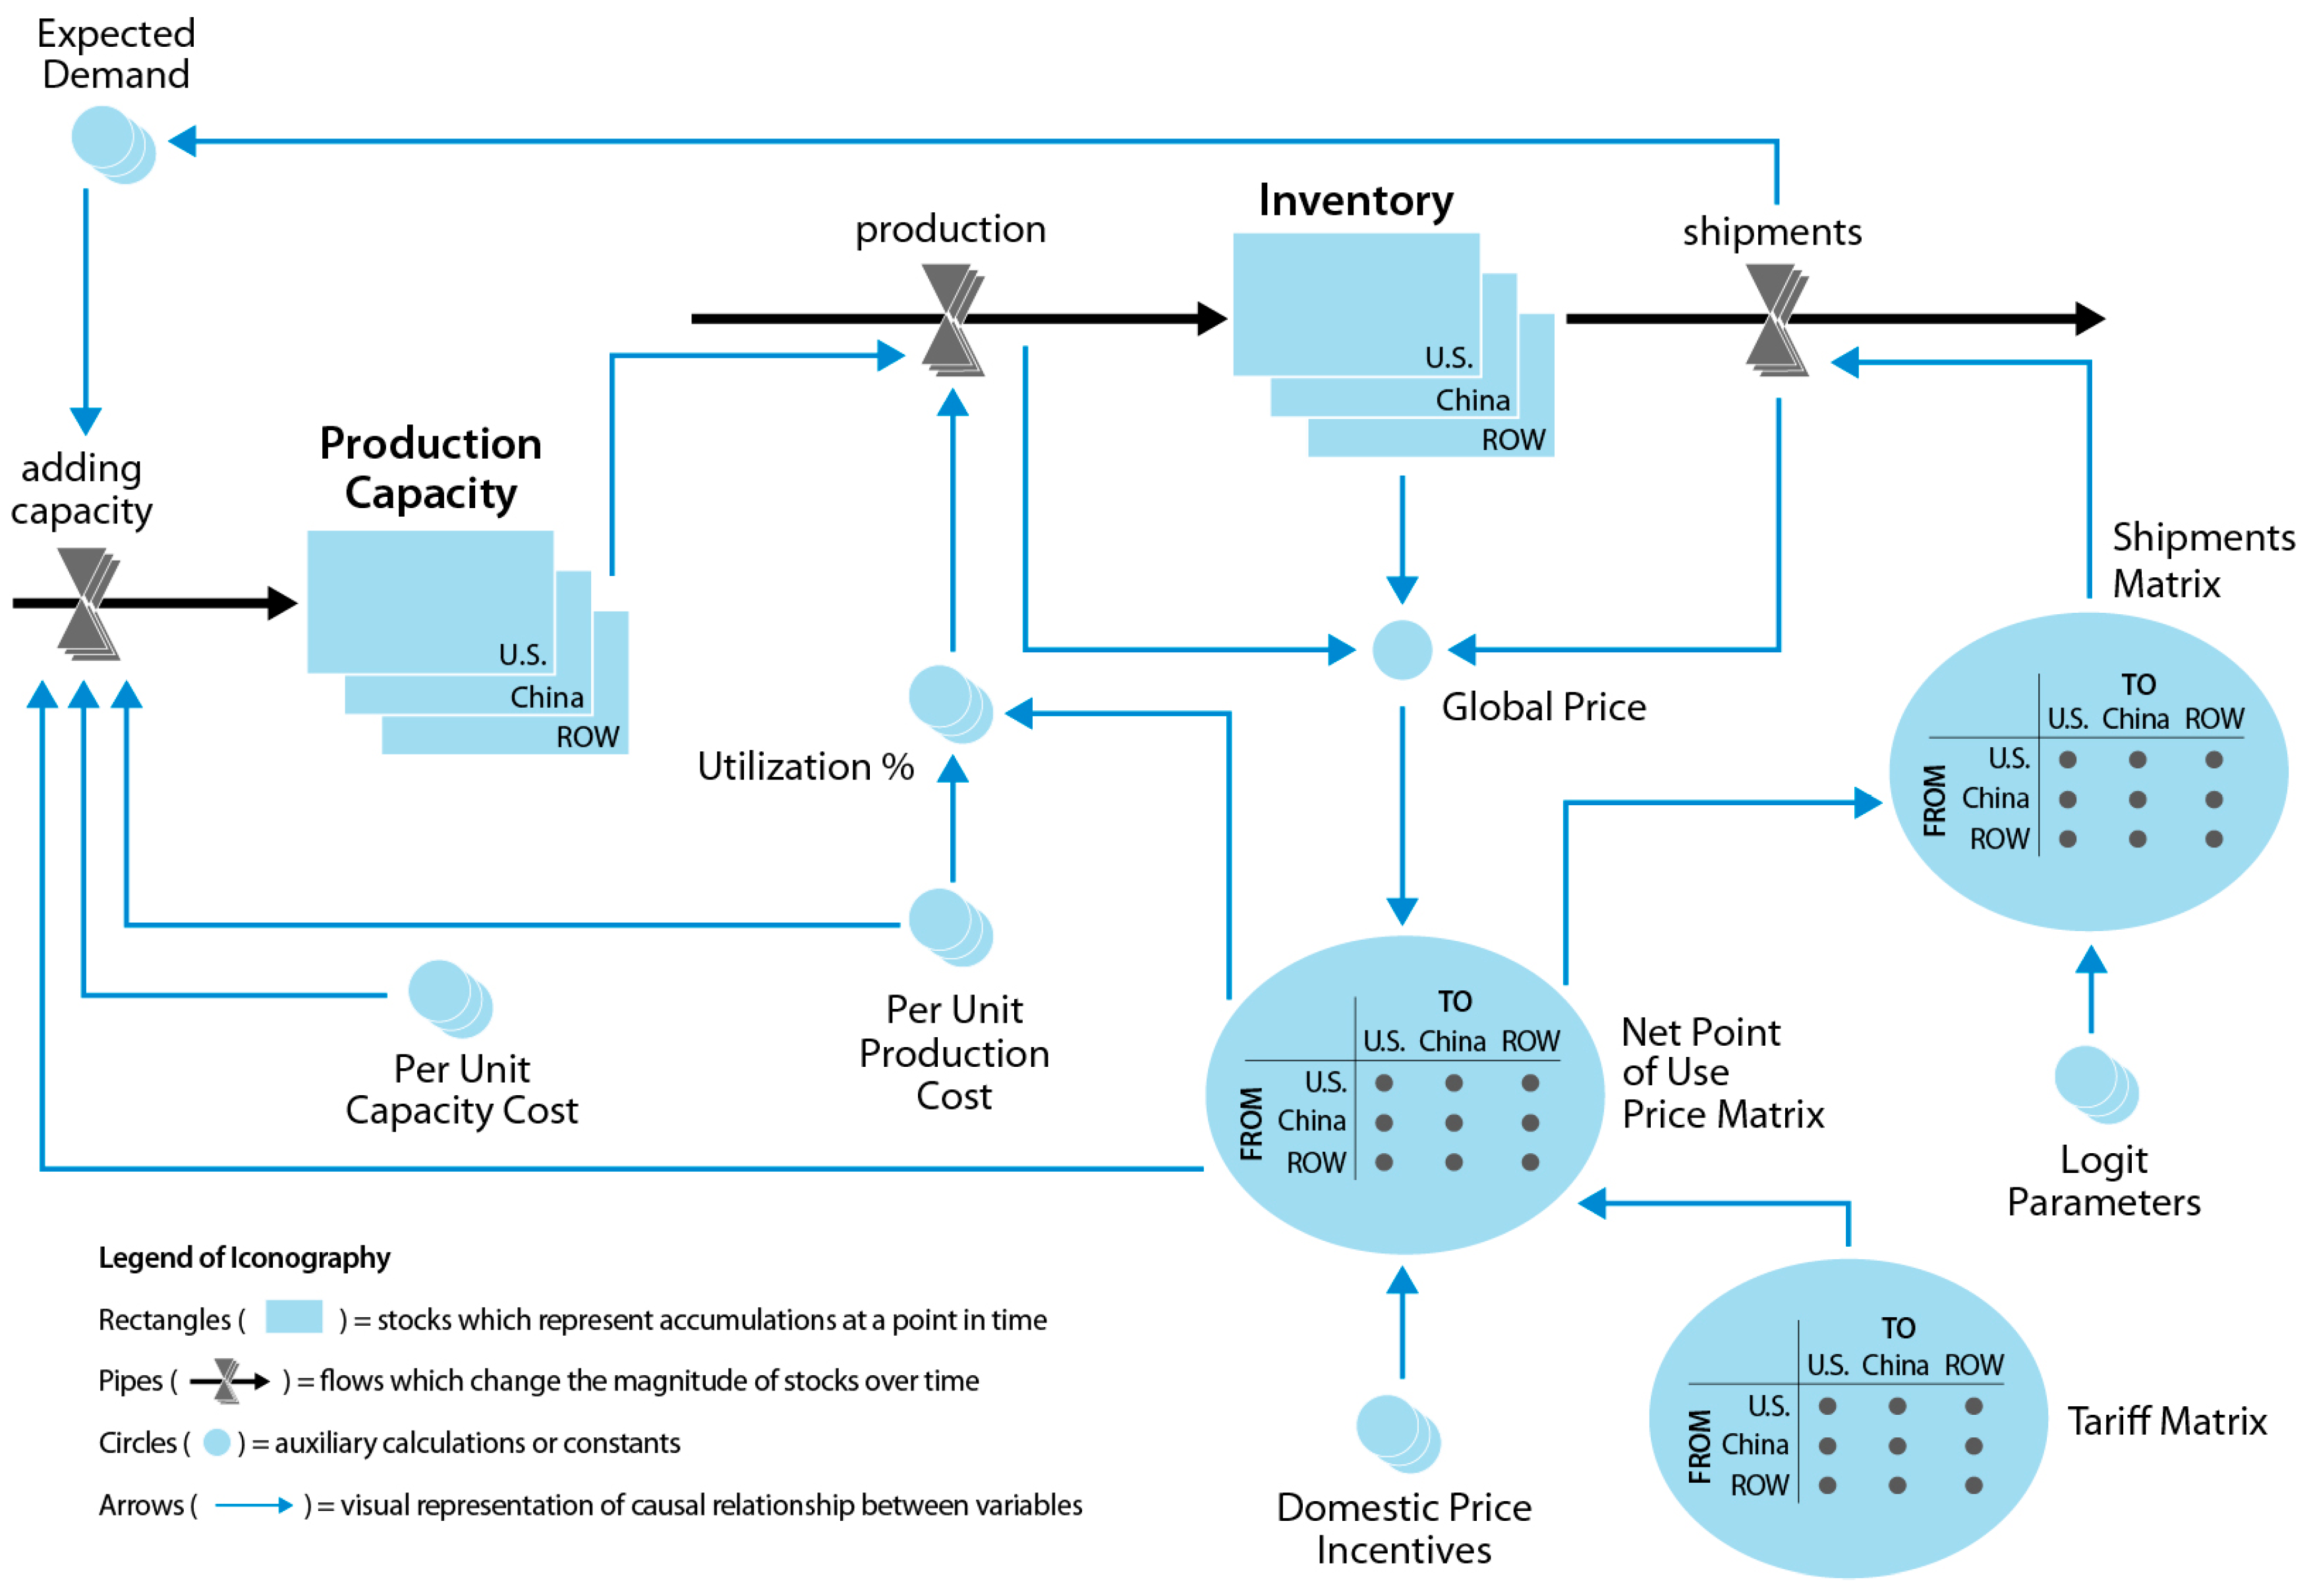
  • Main system elements are broken down into places where items/materials exist at a point in time (“stocks”, in SD parlance) and the rate at which items move between such accumulations (“flows”). This ensures that a proper accounting exists as material moves from one accumulation to the next, sometimes in a series of steps, which is of particular importance in supply chain analysis.
  • SD models are generally rich in feedback mechanisms, meaning that changes to one part of the system kick off internally driven responses, which “feedback” and ultimately affect the component that was originally changed. Information feedback assumes a causal connection between model elements (stocks and flows, in particular) [47]. This feedback dynamic is sometimes referred to as a “circular causality” and exists in one of two forms: positive feedback (which tends to accelerate the rate of change in the system) or negative feedback (which counteracts or slows down the rate of change). Combinations of these two types of feedback loops drive the non-linear behavior often seen in dynamic systems.
  • Many SD models incorporate logic (including which information is being utilized) about decision rules on the part of decision makers; in aggregate, these actions can be thought of as dynamic response mechanisms. Analysis of system behavior can provide quantitative assessments of the impact of changes to decision rules and response mechanisms, leading to improved future decision making or a more robust understanding of how current system conditions would be different under alternative historical behavior rules.
The stock/flow/feedback/decision-rule structure of SD models can be represented as a set of finite difference equations that can be simulated using standard numerical methods [46], and the models often utilize qualitative and/or quantitative empirical data to determine the strength of feedback relationships and derive parameters related to decision rules [48]. Extensive testing of the structure and parameter values of SD models can help to build confidence in both assumed feedback mechanisms and resulting system behavior, particularly when comparing model outputs to known historical data [44,46,49].
SD has been proven to be an effective tool to gain insights into the (1) behavior of energy systems and (2) dynamics of global trade in energy. Numerous studies have supported strategic energy planning for a range of applications, including: comparing impacts of policies (e.g., feed-in tariffs and renewable portfolio standards) and incentives on renewable energy technology deployment [50]; laying out scenarios that support the transition from petroleum to cellulosic biomass-based transportation fuels [51]; assessing long-term availability of raw materials used to fabricate renewable technology components (e.g., tellurium availability for cadmium telluride [CdTe] PV) [52]; and exploring capacity expansion of national and regional electric grids [53,54]. Recent studies investigating trade dynamics in the energy sector have focused on identifying viable import and export options to ensure security of energy supply during transition to liberalized electricity and natural gas markets [55,56]; exploring global land use change scenarios to support cellulosic biomass production for fuels and power [57]; and analyzing the impact of targeted AD duties on a country’s domestic renewable energy industry [58].
In this study we explore the impacts of AD and CVD on polysilicon produced for the solar PV industry. Although we focus on just one link in the PV supply chain here, the overarching purpose is to understand the effects that trade actions may have on the full supply chains of a range of renewable energy technologies. It is important to note that, while we focus on duties applied by China to imports of polysilicon, the factors that affect global trade are numerous and complex (e.g., non-tariff barriers to trade, investment activity, fiscal policy). Focusing on this one set of actions is intended to establish the model framework, not to imply these actions were the primary or sole drivers of changes in trade flows.

2.1. Polysilicon Manufacturing and Trade (PolyMAT) Model

This analysis uses the Stella software platform [59] to develop a simple SD model of the global polysilicon supply and trade system, focusing on the impact of trade actions (AD, CVD) (as a proxy for other disruptions). In the longer term, the model can be expanded to represent additional components of the PV supply system and then used to identify types, magnitudes, and timing of policies and investments that may mitigate disruptions such as (1) changes in trade patterns due to regional economics, supply chain constraints, or trade policies such as tariffs and embargoes; (2) changes in clean energy policies; and (3) over-/under-building of production capacity.
The PolyMAT model establishes a simplified structure of the global polysilicon supply and trade system, as illustrated in Figure 5, which depicts some of the key elements and relationships of the model. By design, the model structure does not capture every aspect of the global polysilicon market, but instead was developed to provide a basic representation of historical patterns of marketplace behavior (Development plans for future versions of the PolyMAT model include more exhaustively-researched parameter values and rigorous calibration of outputs to historical data.) and to establish a framework for testing the impact of various tariff/trade actions.
The model establishes a three-region segmentation comprising the U.S., China, and the rest of the world (ROW). This mutually exclusive, collectively exhaustive (MECE) segmentation allows for the global polysilicon market to be represented, but with key regionally specific details and dynamics to be captured as well. Within each region, a simple stock/flow structure, as shown in Figure 5, calculates the production of polysilicon and the rate at which shipments (both within the region and exported to others) are made; the accumulated net of these two flow components allows for the stock of polysilicon inventory within each region to be tracked over time. This combined accounting of material flow and storage allows for the global/aggregate magnitude of supply and demand for polysilicon to be calculated and compared to the data for the historical time period investigated (2000–2016), in addition to providing a mechanism driving the changes in global price of polysilicon over time.
This global price metric provides feedback into the individual regions in two key ways. First, decision makers compare prevailing prices (modified by any extant point-of-production incentives provided by governments in each individual region) to per unit capital costs to either accelerate or slow down capacity expansion, in addition to using price relative to per unit production costs to affect utilization rates of existing capacity. This feedback mechanism creates a dynamic response to changes in prices by altering the rate of polysilicon production (which ultimately affects the price of polysilicon through the inventory and demand/supply mechanisms described above).
Second, prices in any region may be affected by tariffs put in place on inter-region shipments. For example, if China puts a 50% tariff on materials coming into China from the United States, Chinese PV manufacturers may find domestically produced polysilicon to be cheaper and shift their demand away from U.S. imports. This dynamic, which exists both within and between regions of the model, impacts the demand stream seen by individual regions in terms of in-region consumption and demand from exports. SD models such as PolyMAT which contain regional segmentation generally require an algorithm to distribute aggregate quantities (such as regional consumption/demand of polysilicon) across segmented options (sources of supply, in this case) using one or more endogenously-generated model outputs. The PolyMAT model uses a price signal (incorporating effects of tariffs) to determine the share of regional demand met by any of the three included regions. A logit choice formulation [60] first establishes an “attractiveness” metric of polysilicon from each region based on (1) the relative price of polysilicon supplied from each region and (2) exogenous factors reflecting drivers such as the impact of domestic content requirements or free trade agreements. The attractiveness of polysilicon in any region i coming from each of the j possible regions is then used to determine the share of demand met by each source, as follows:
S h a r e   o f   d e m a n d   ( i , j )   =   A ( i , j ) / m = 1 j A ( i , j ) ,
where A(i, j) = the attractiveness of polysilicon in region i based on regional origin j.
As noted above, the calculation of attractiveness/utility of polysilicon is driven by both price and exogenous components, as follows:
A ( i , j )   =   e [ k ( i , j )   α ×   P ( i , j ) ]
where
  • P = point-of-use price of polysilicon in region i based on regional origin j
  • α = a scaling parameter for polysilicon price (P)
  • k = the non-price-driven component of polysilicon attractiveness for any region i based on regional origin j
Initial, time-invariant values for the k and α parameters were first estimated based on analysis of industry data [20,21]. These parameters were then systematically modified based on the results of PolyMAT simulations in order to generate a set of outputs, as detailed below, that approximate known historical data for the polysilicon market. Further model development can incorporate more detailed data regarding shipments of polysilicon between regions, allowing for more precise estimates of region-specific parameters.

2.2. Scenario Overview

The PolyMAT model, as described here, established a Base Case that incorporated region-specific data and was parameterized such that simulation outputs approximate key historical (2000–2016) data on the global price for polysilicon, production volume in each region, and the inter-regional shipments of product. The Base Case then served as a testing ground for different scenarios to be evaluated, parameter values to be adjusted, and a variety of scenario analyses to be performed. Specifically, the PolyMAT model was used to analyze what may have happened under different historical scenarios regarding import tariffs and domestic production incentives. Results from these counterfactual scenarios can help provide initial insights into the potential impacts of new trade actions on future global polysilicon flows.
The scenarios analyzed for this paper are summarized in Table 3 and are designed to gain insight regarding the impact of:
  • The severity of the import duty on the relative volumes of imports and domestic supply
  • Retaliatory duties on the relative volumes of imports and domestic supply
  • The level of tariff absorbed by a region on global polysilicon flows
  • Non-price “attractiveness” drivers on the relative volumes of imports and domestic supply.
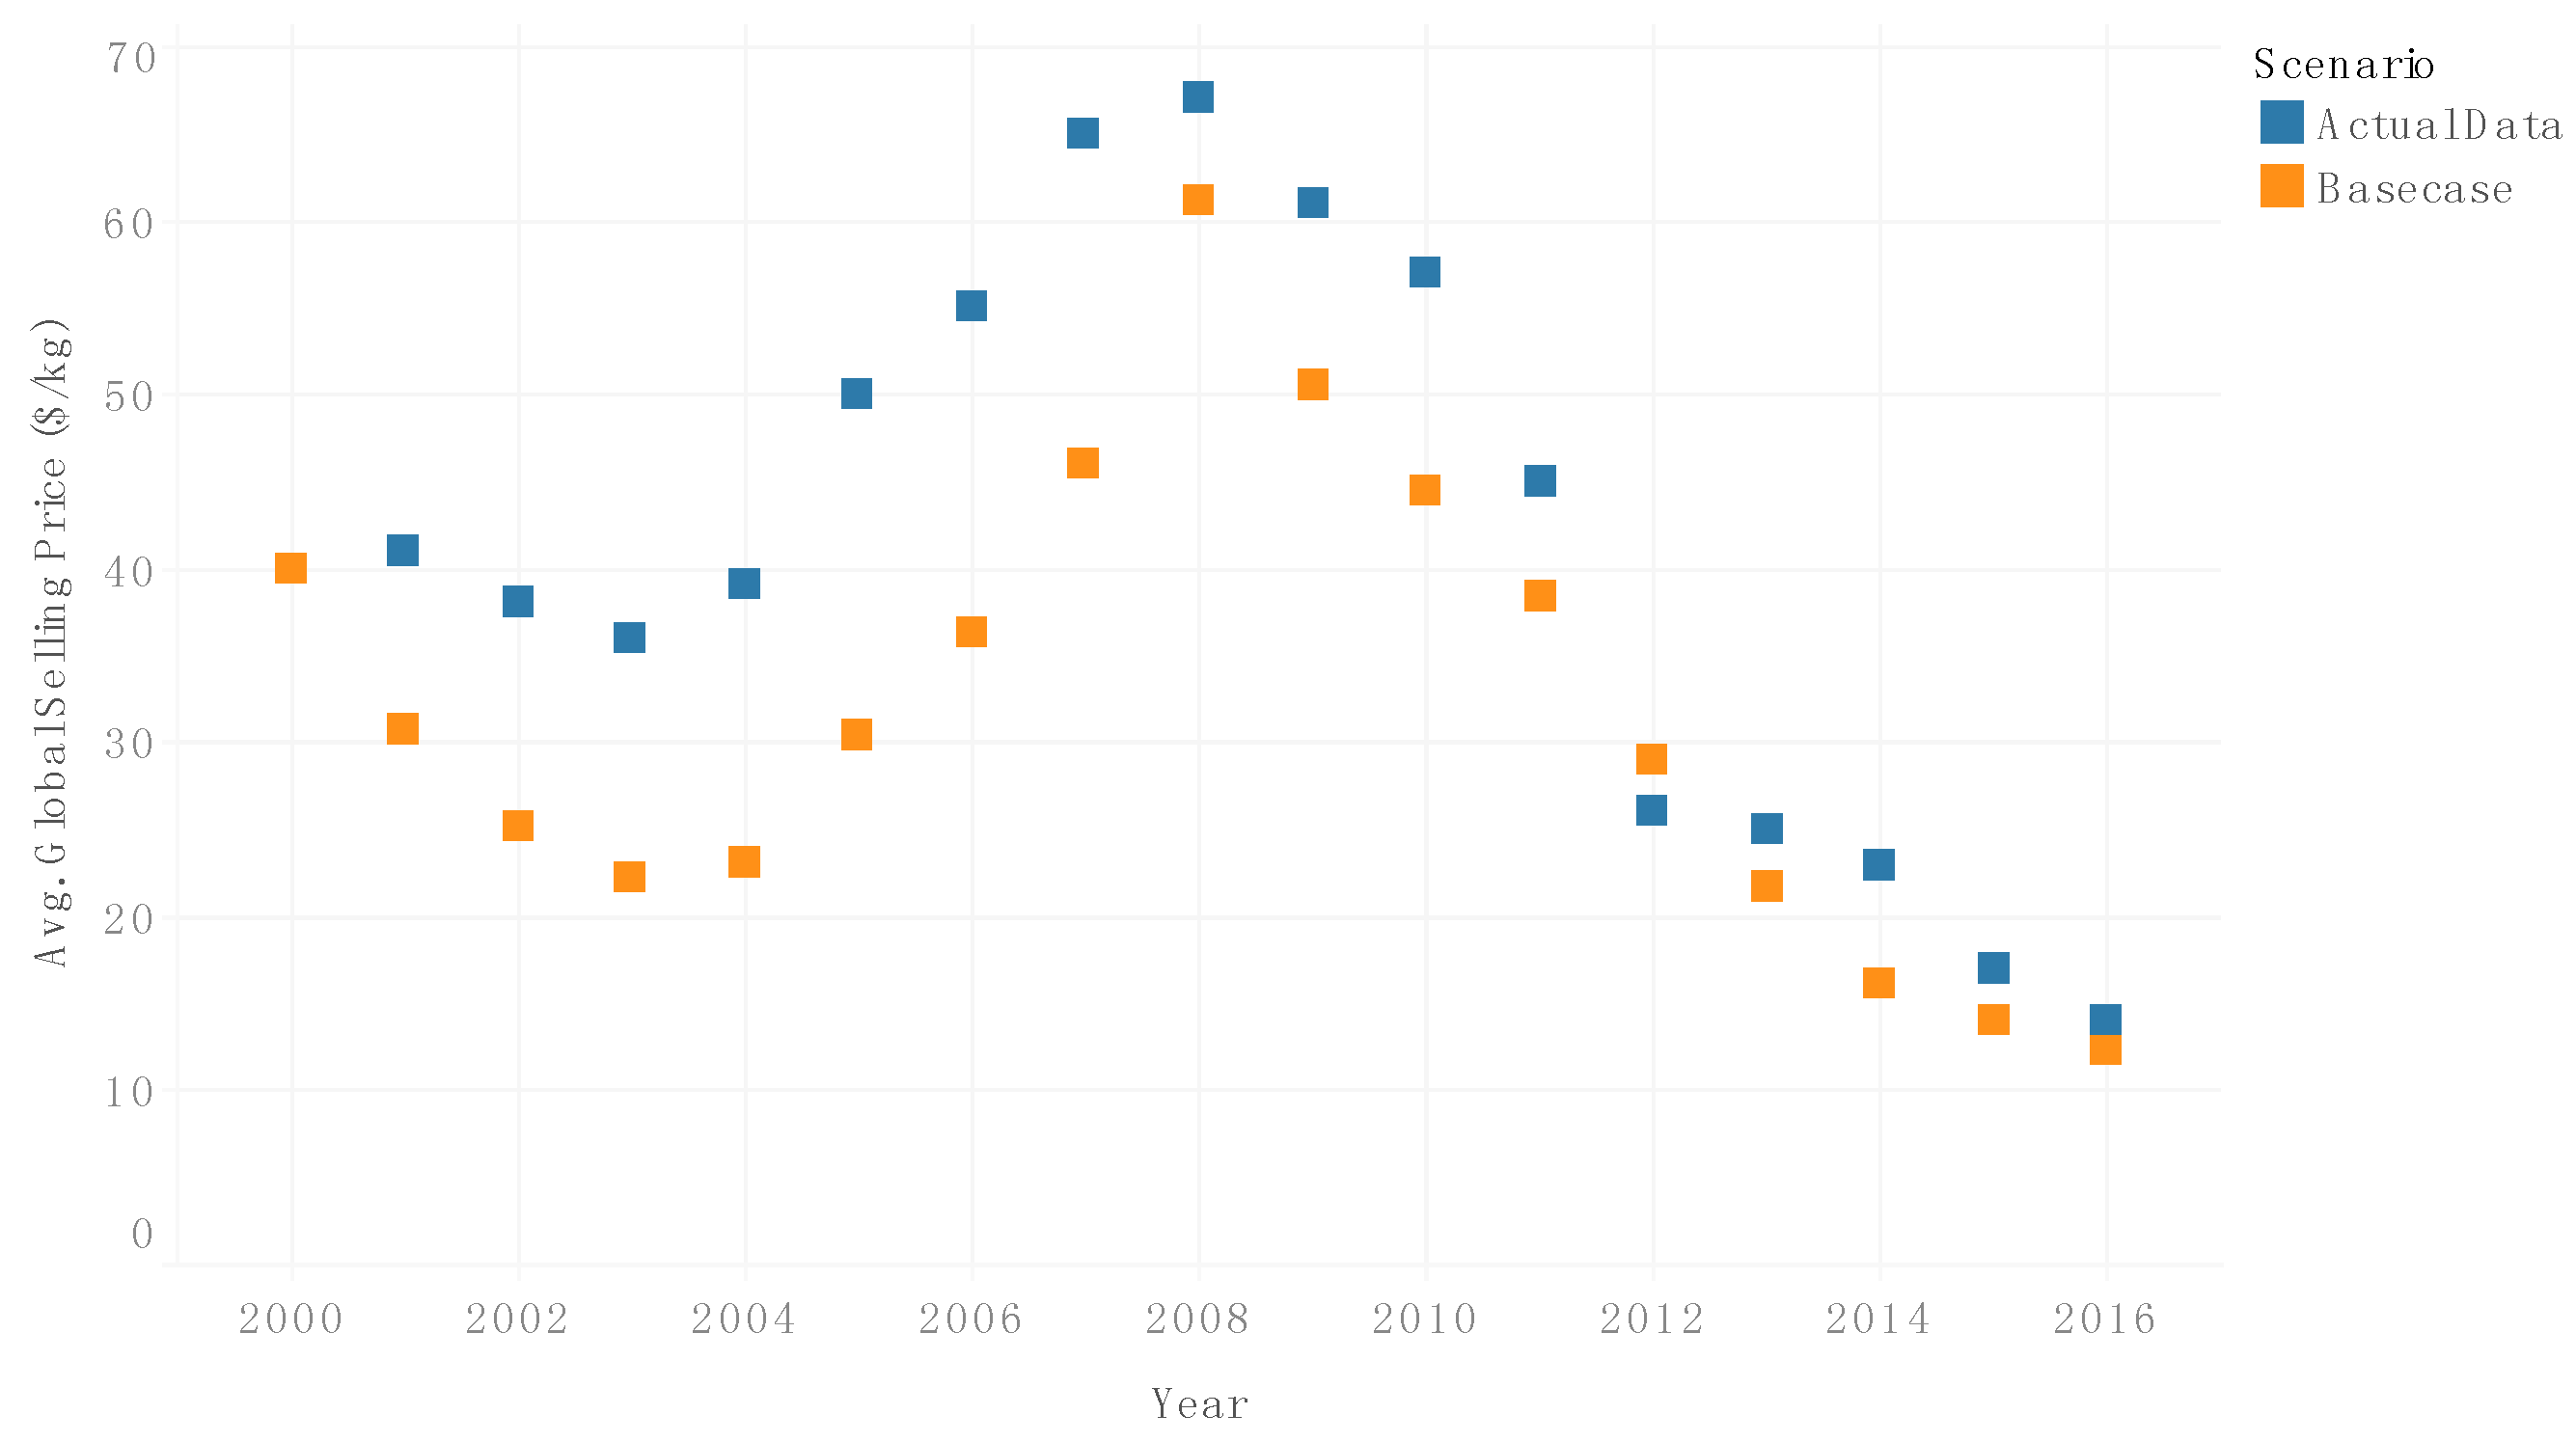
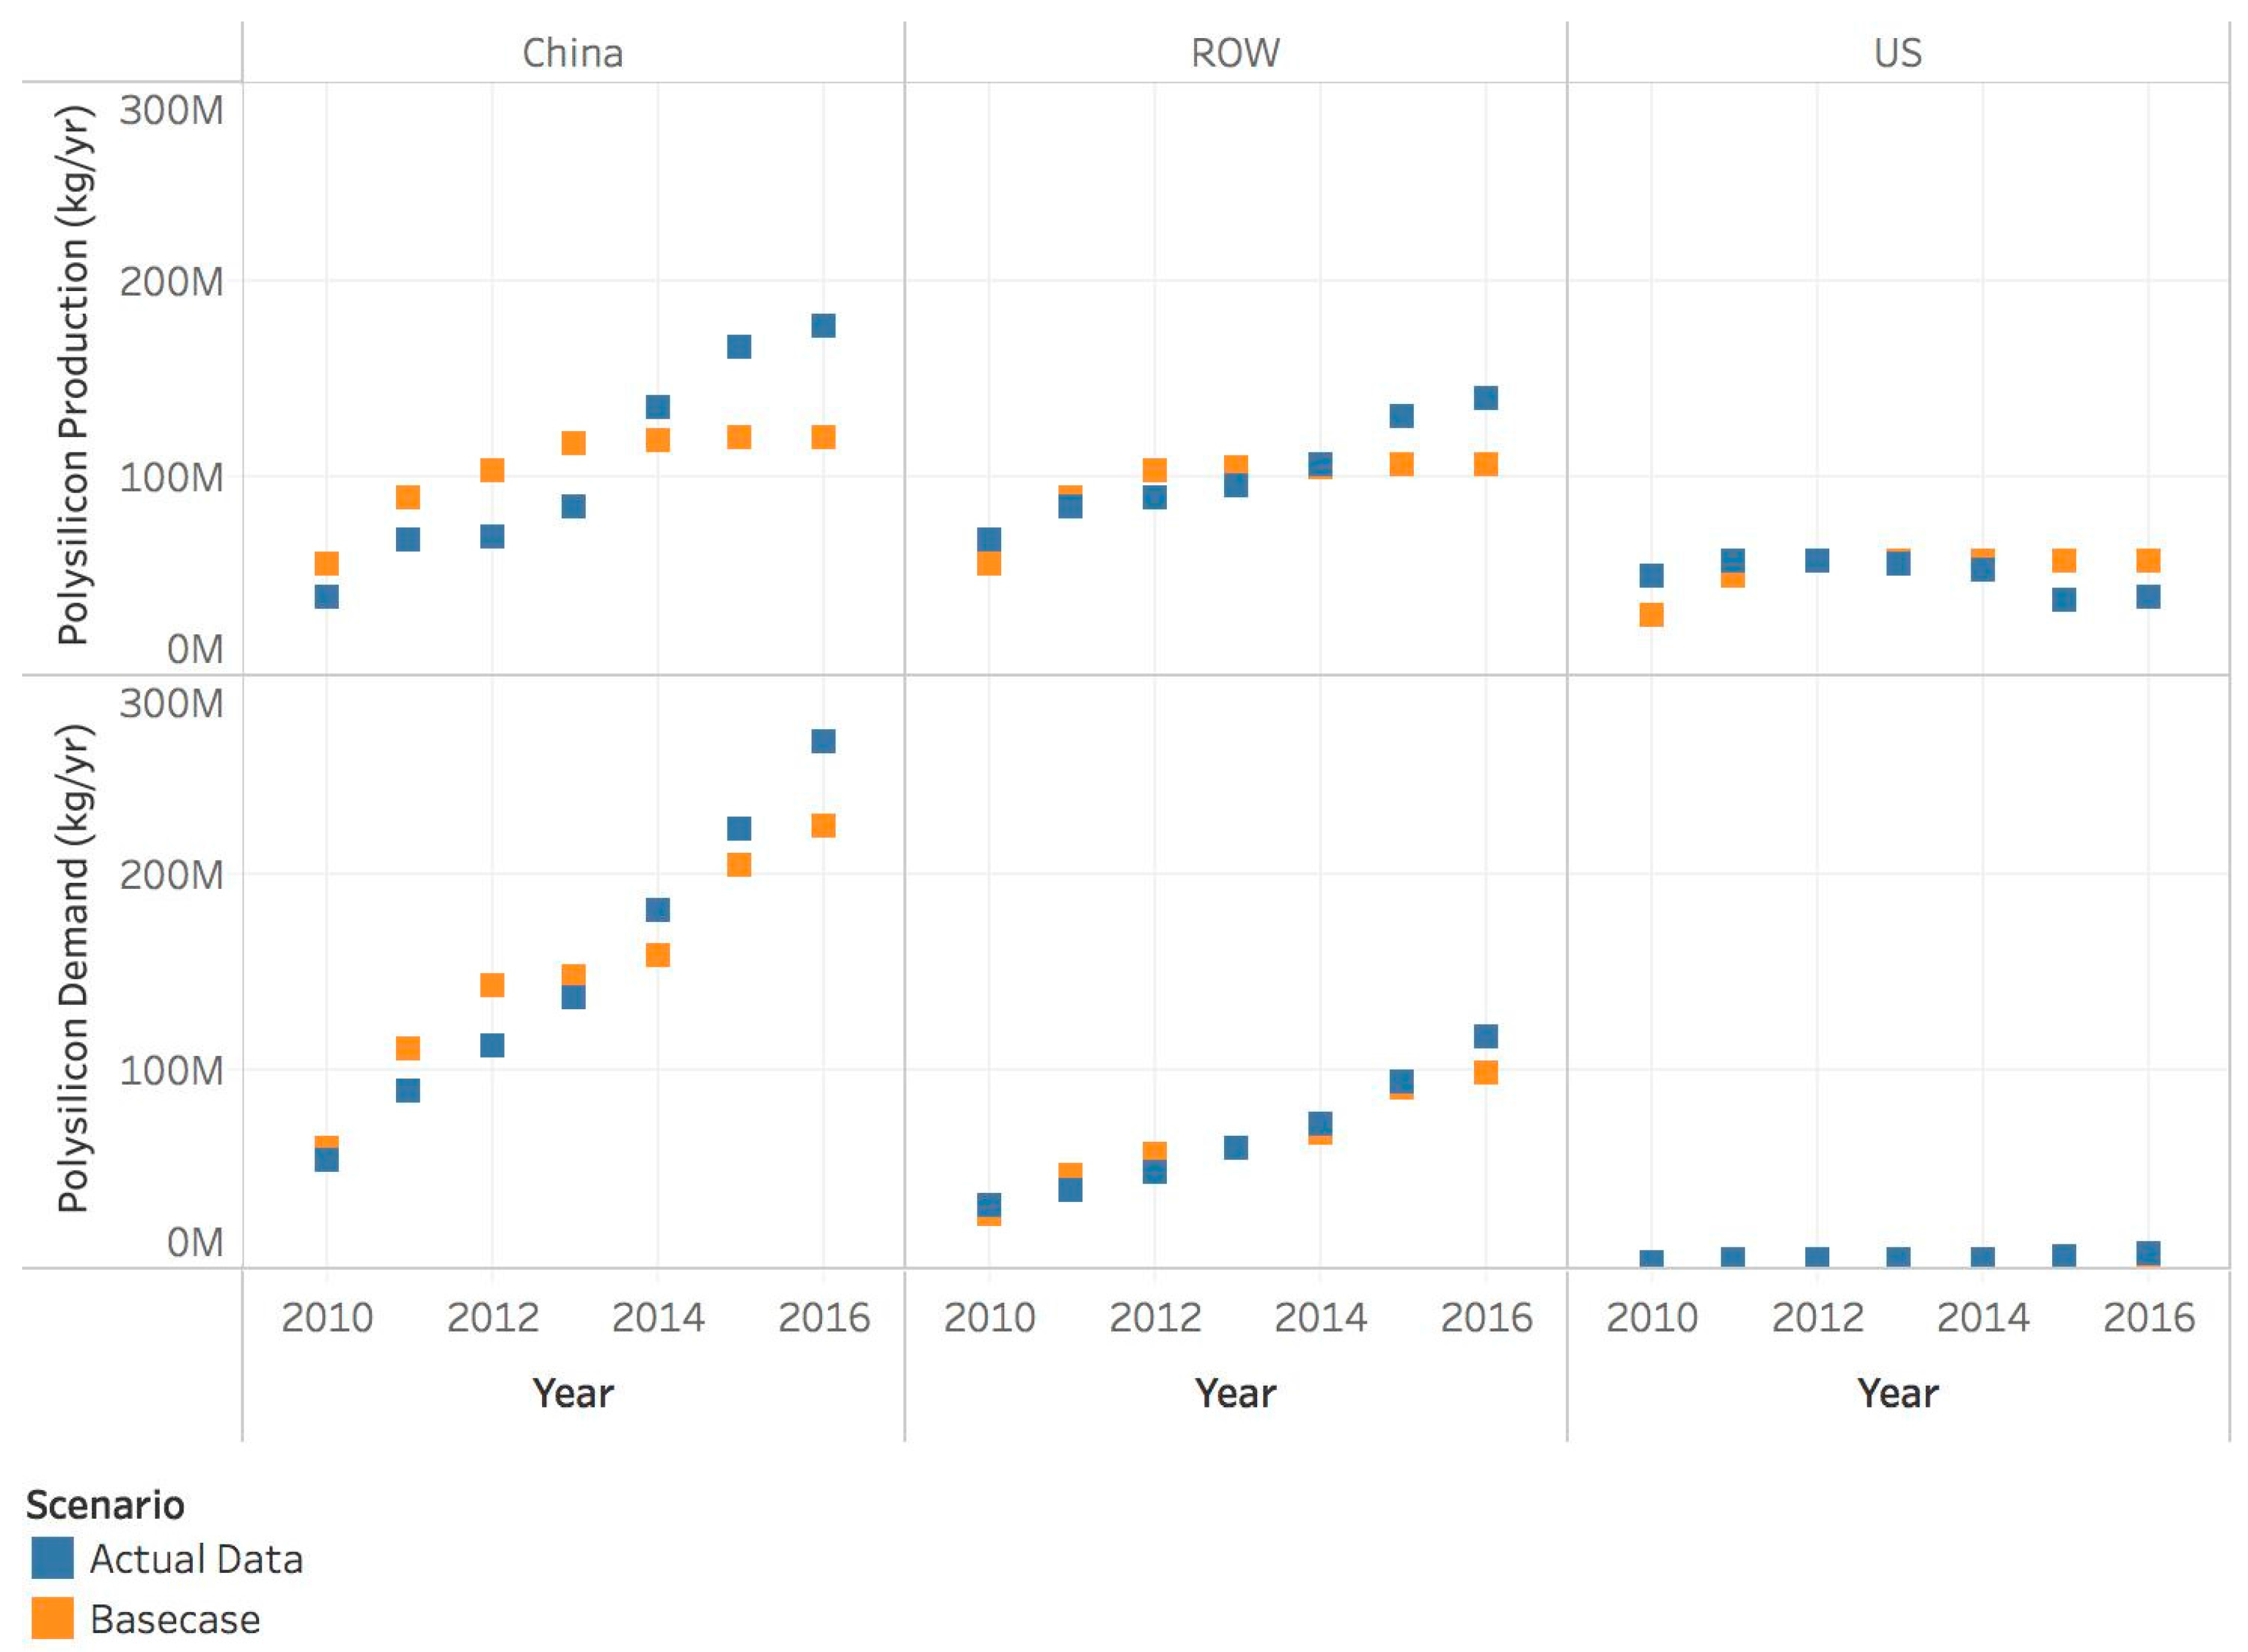
2.3. Base Case

The Base Case was developed to qualitatively replicate important dynamics observed in the recent (2000–2016) history of the global polysilicon market. The duties on U.S. and ROW polysilicon imports to China were officially implemented in 2014 and will be in effect through at least 2019. In the model, an average duty is applied from 2014–2016 (see Table 3), with an initial lesser tariff applied in 2012–2013 to serve as a proxy for the changes in regional behavior—in terms of trade flows and domestic supply—based on anticipation of the new duties.
Outputs from the model Base Case scenario were compared to historical data for three key metrics: global average selling price ($/kg), global production by region (kg/year), and global demand by region (kg/year). The actual data and modeled results compare favorably, with similar magnitude and trends over the time period, as shown in Figure 6 and Figure 7, providing an initial validation of the model logic and dynamics. Figure 7 shows that the modeled demand values match reasonably well, while the modeled production values flatten out relative to the trajectory of the historical data; this is likely due to the limits on capacity expansion integrated in the model (which can be adjusted in the future when the model calibration is further refined). In addition, the current version of the PolyMAT model does not allow for capacity to be taken offline (as happened in the United States starting in 2014), which makes accounting for declining regional production rather challenging. Future versions of the model will address the dynamic drivers of capacity elimination.

3. Results

The regional production for each scenario is shown in Figure 8. U.S. production ranges from 58 million (M) kg to 60 M kg for the Base Case scenario (which imposes the highest duty on U.S. imports to China) and the No Tariff scenario, respectively. China’s production ranges from 107 M kg to 127 M kg for the No Tariff and All High Tariff scenarios, respectively. ROW production ranges from 104 M kg to 108 M kg, for the Reverse (which imposes the highest duties on ROW imports to China) and No Tariff scenarios, respectively. Though China’s Base Case modeled polysilicon production is the largest of the three regions under investigation, the region’s production is also the most responsive to the choice of trade scenario. China’s modeled production varies by as much as 15.7% of 2016’s maximum modeled production, whereas the ROW’s modeled production varies only by 3.7% of the maximum and the US’s varies by 3.3%. Though modeled production is subject to the model’s production limitations as previously discussed, all else equal, China’s modeled production absorbs the majority of the impacts of trade case variation on polysilicon production within the model.
Because the goal of this study is to understand and analyze the dynamics of polysilicon flow within and between regions, the results discussion is generally focused on the demand share, influx, and outflux results for each scenario. In the PolyMAT model, “influx” into one region includes imports from the other two regions and domestically produced polysilicon. “Outflux” from one region includes exports to the other two regions and domestically consumed polysilicon. “Demand shares” is the fraction of demand supplied by each of the three regions to meet one region’s demand.

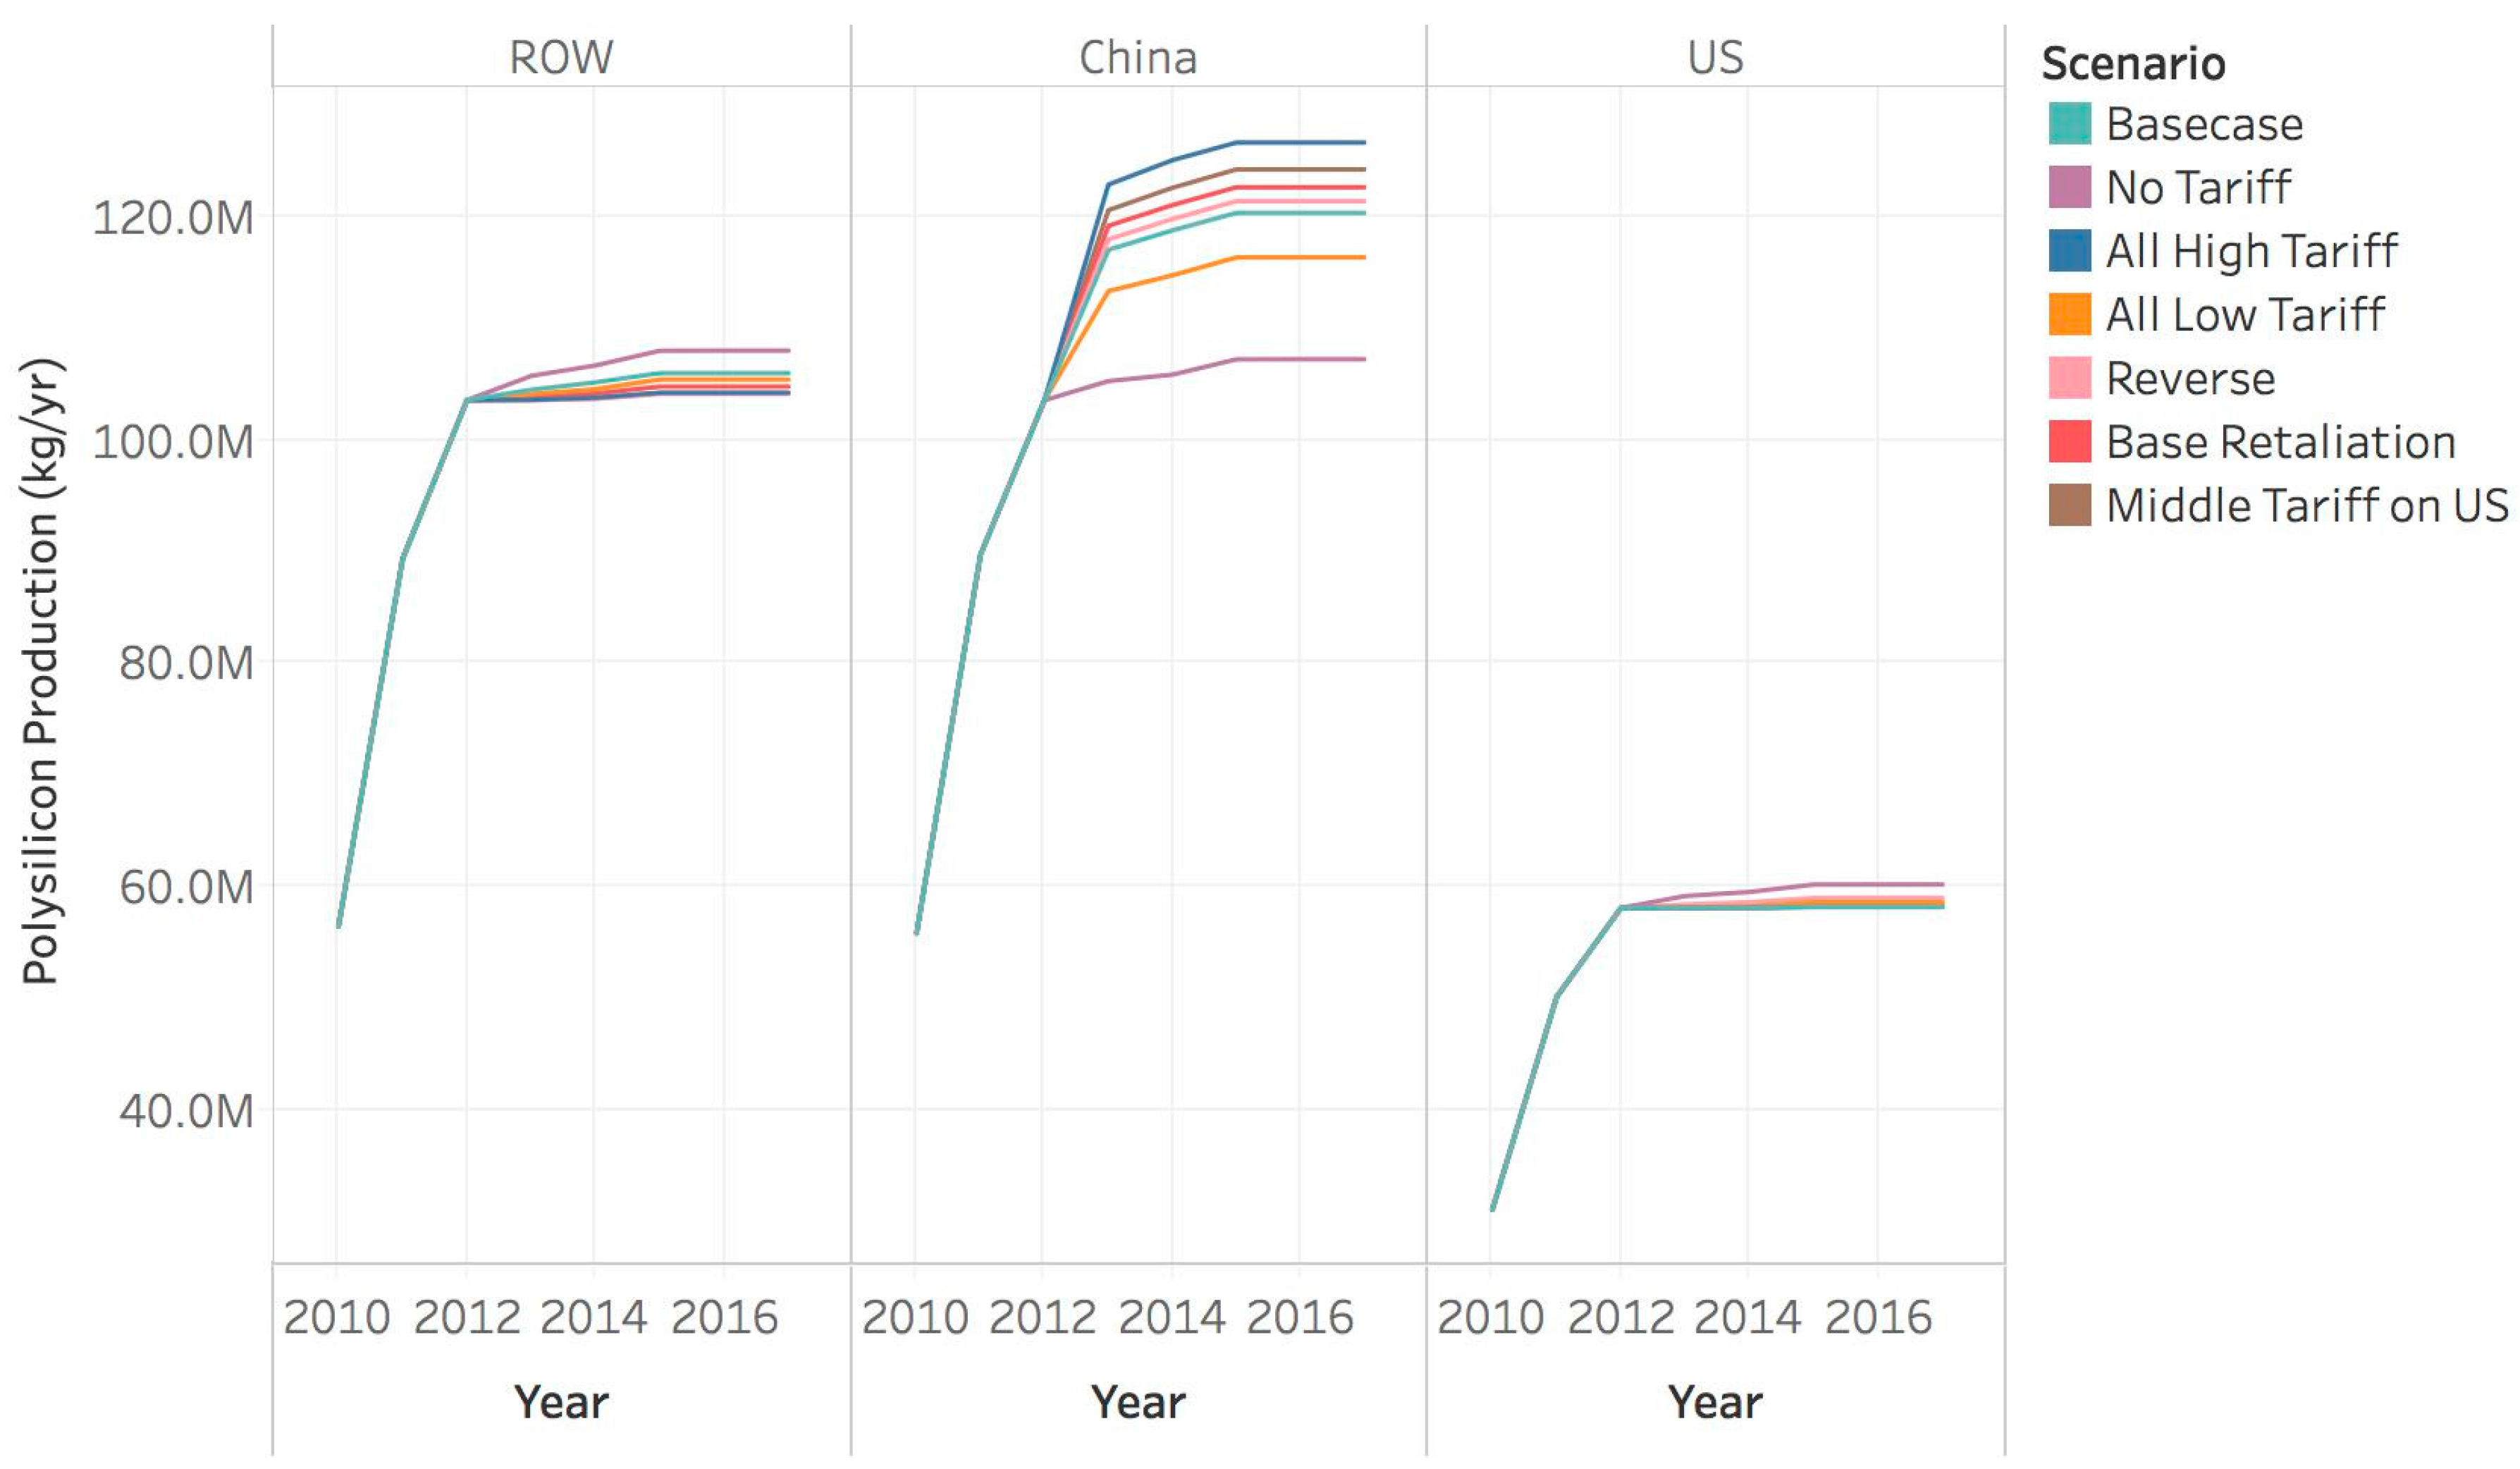
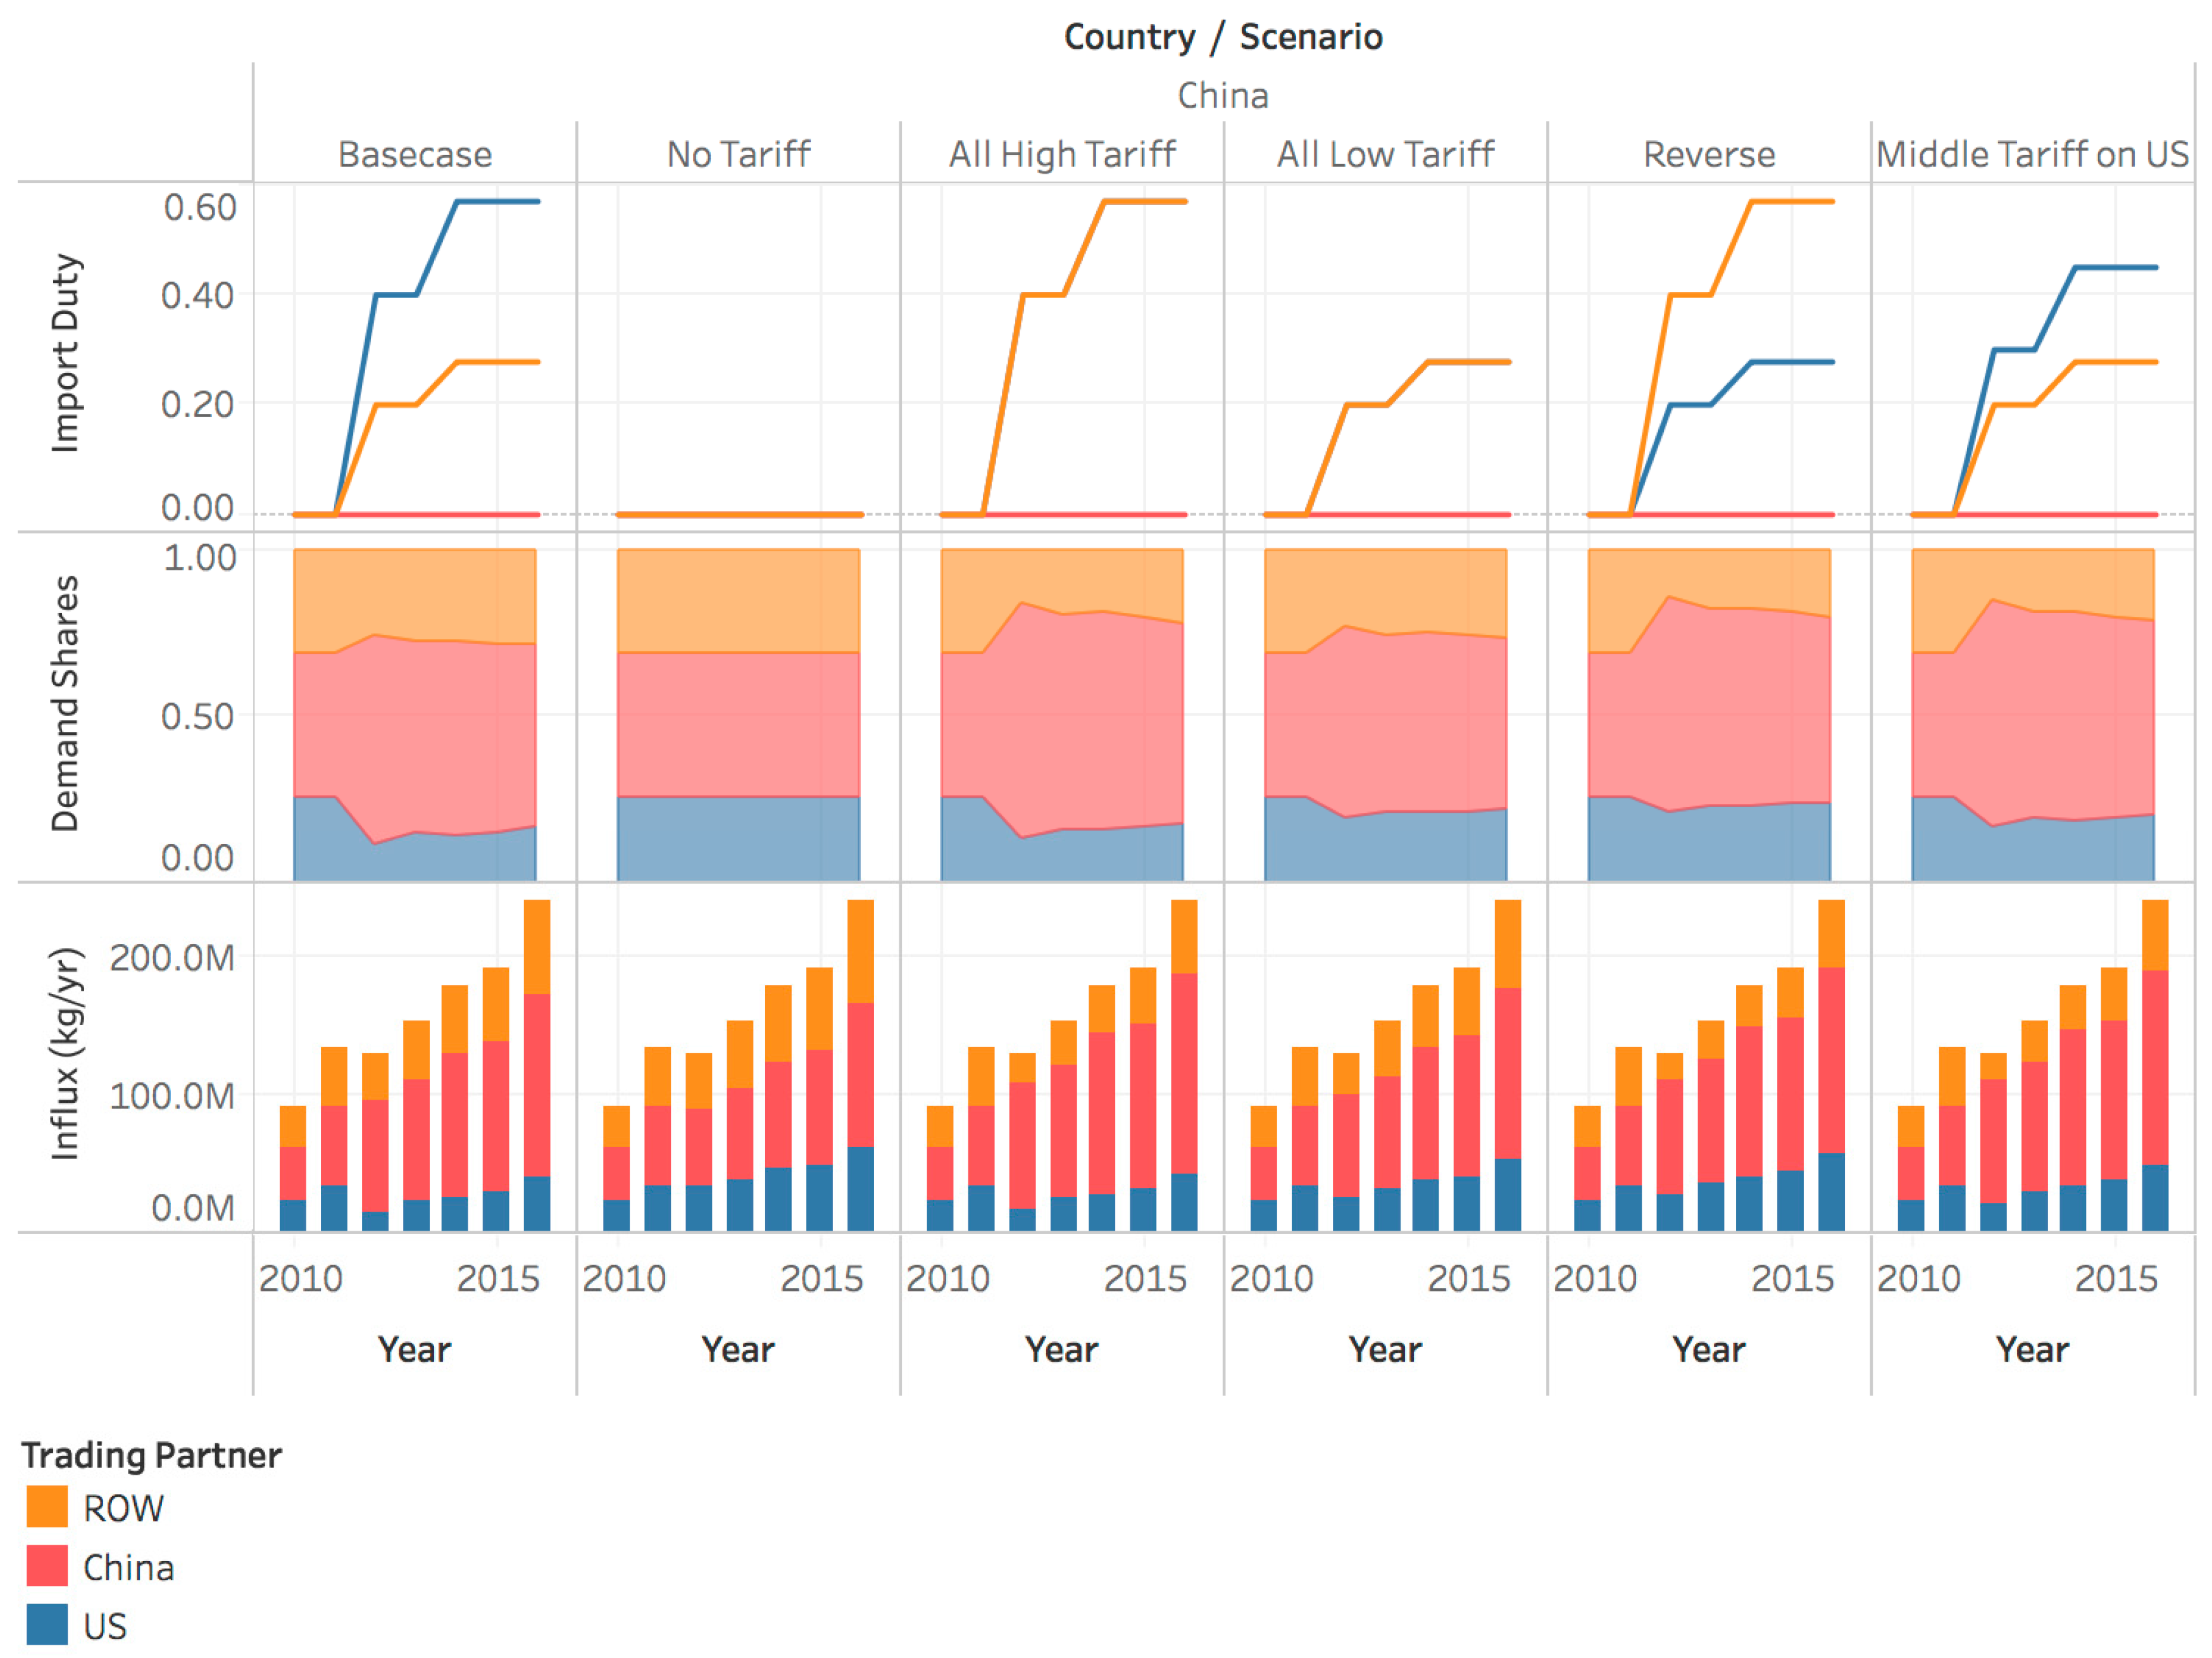
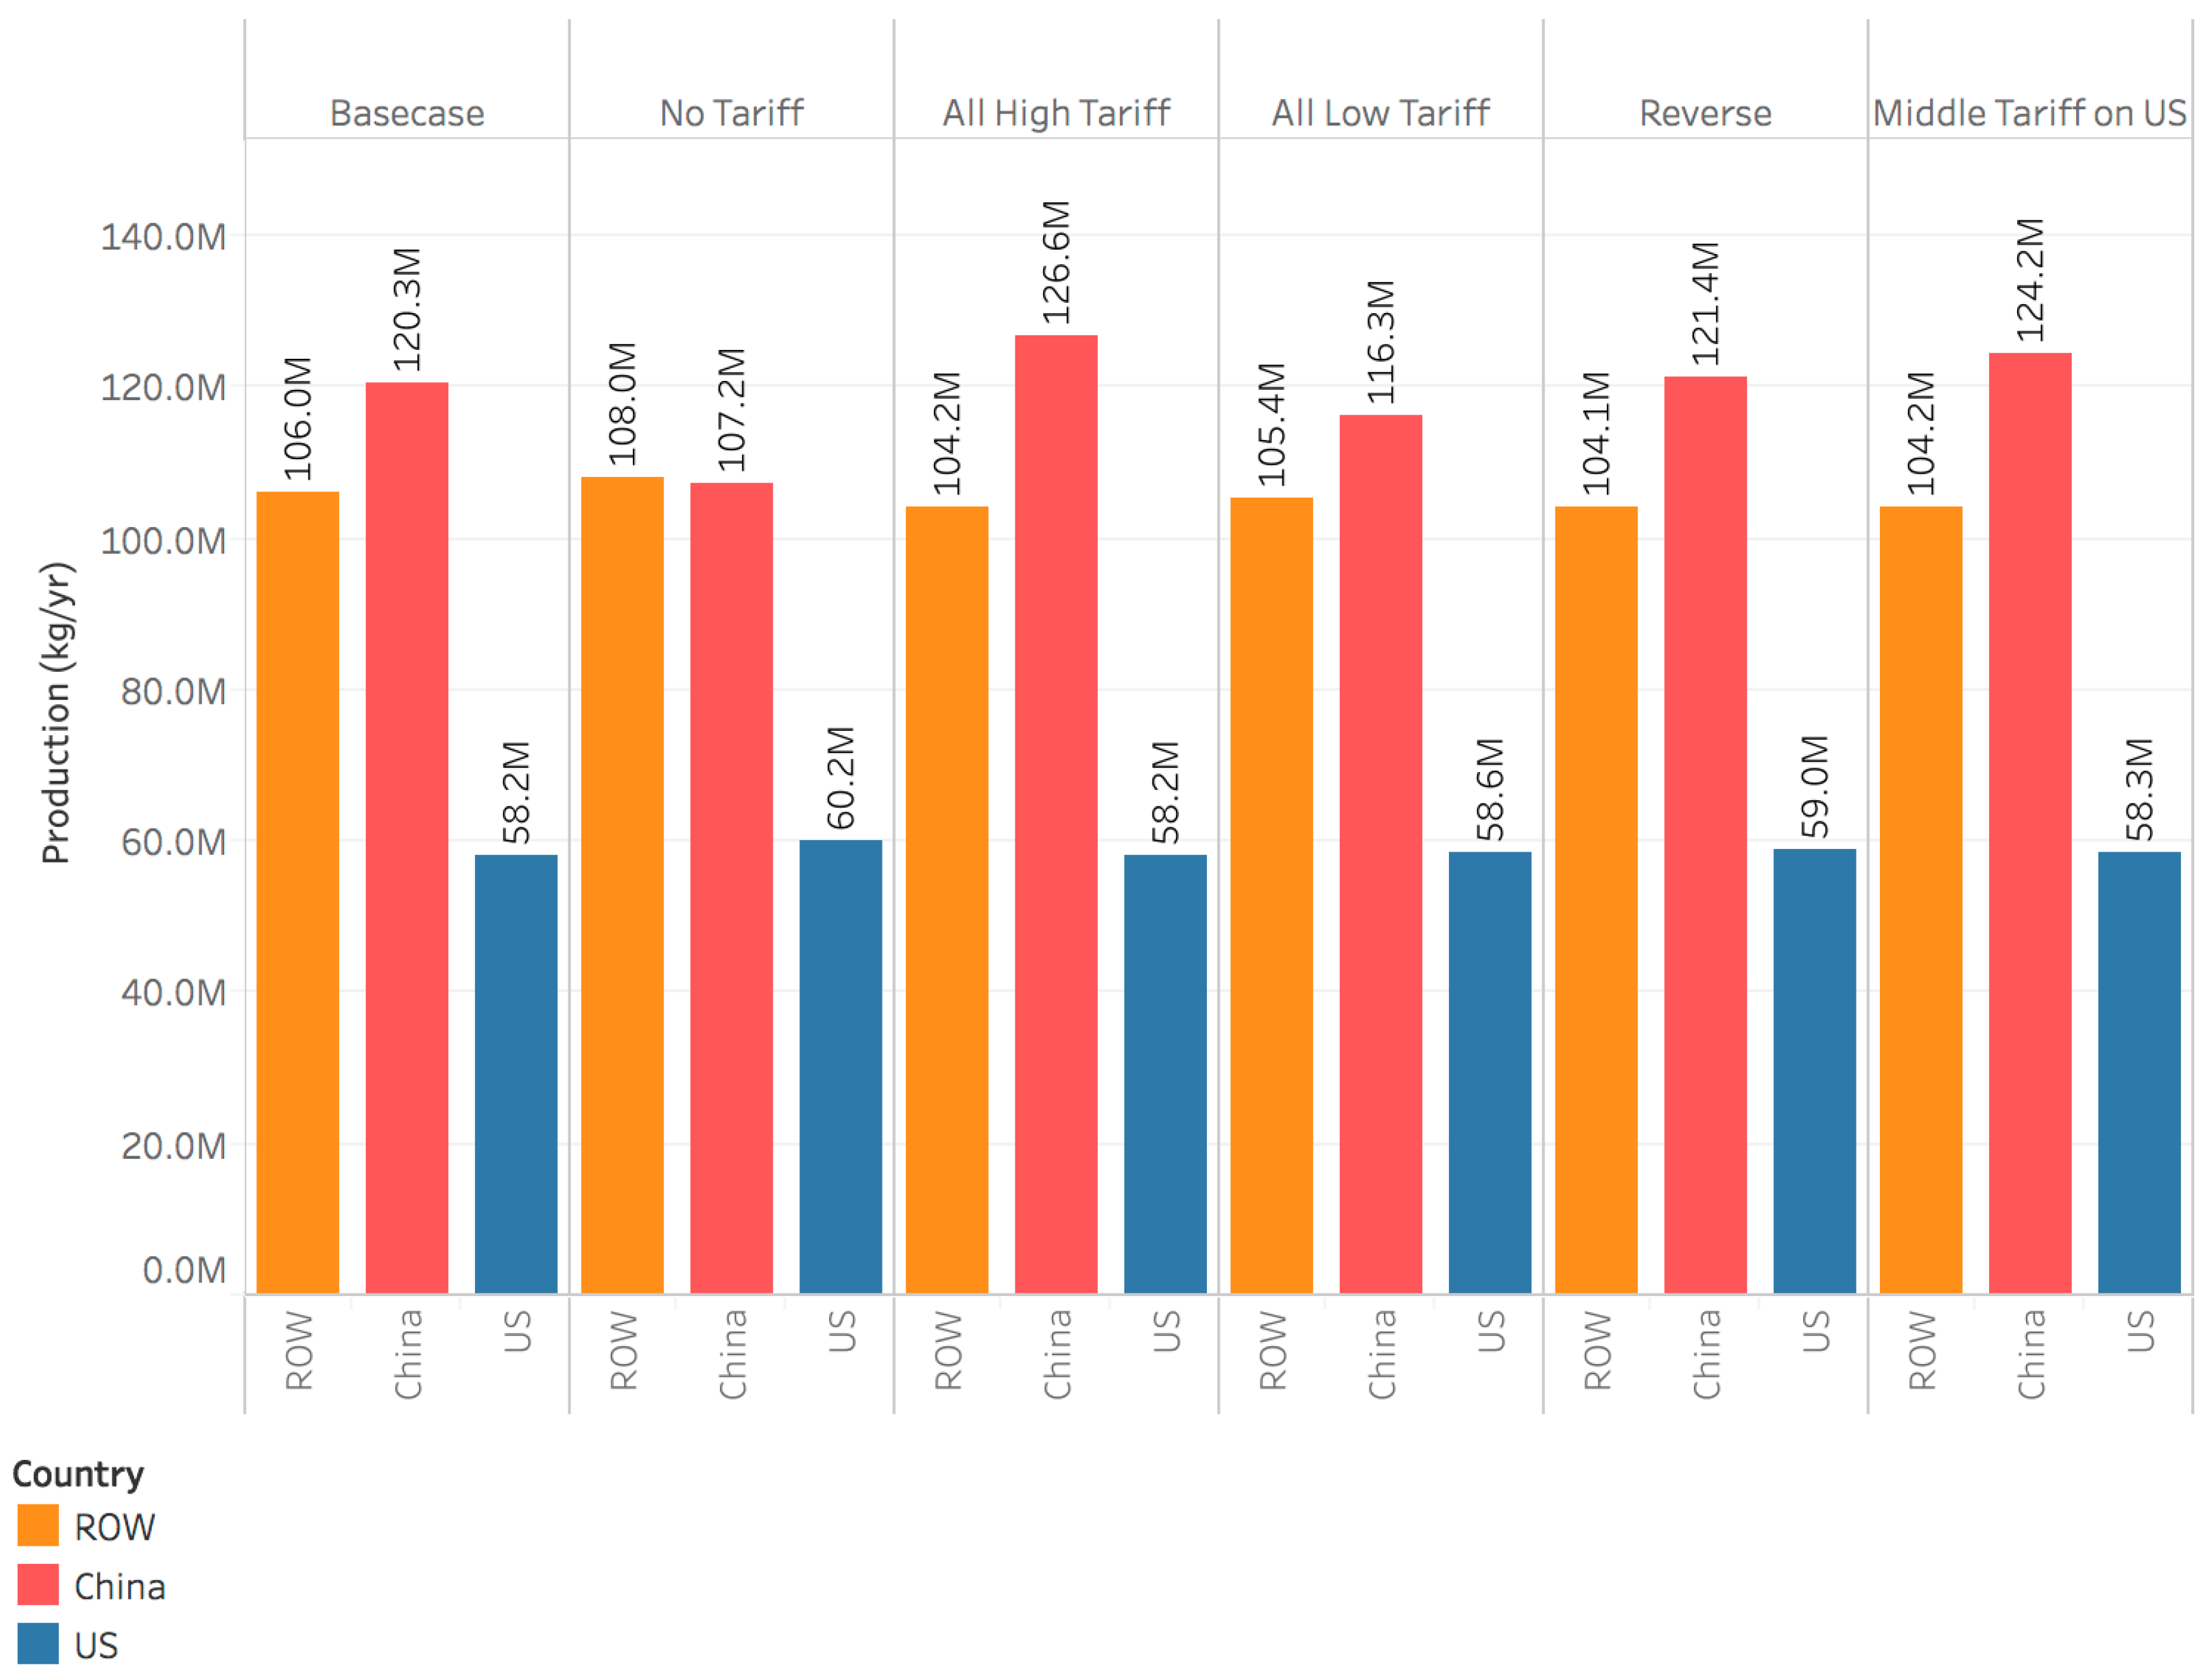
3.1. Trade Action Severity: Impact on Global Polysilicon Flows

Our first set of scenarios aims to build an understanding of how the relative severity of trade actions impacts trade flows. Using the PolyMAT model, we compare five scenarios (summarized in Table 3), each with a varying degree of tariff severity, with the Base Case scenario. These results are summarized in Figure 9. Because China is the world’s largest producer and consumer of polysilicon for PV module production, the impact of China’s duties on U.S. and ROW imports to China is the focus of the results presented here. The first row of Figure 9, “Import Duty”, displays China’s modeled import duty on both the USA and ROW across the analysis’s time horizon. In the No Tariff, All High Tariff, and All Low Tariff cases, the import tariffs are set at the same value for both the U.S. and the ROW. The next row of Figure 9, “Demand Shares”, displays how each of the three regions, U.S., ROW, and China, combine to meet China’s demand. In the Base Case, when a relatively steep tariff is imposed on U.S. imports, and a less steep tariff is imposed on ROW imports, the ROW’s share of Chinese demand is reduced, but not as much as is the USA’s share of Chinese demand. The final row of Figure 9, “Influx (kg/yr)”, displays how each region’s imports to China are changing over the time period while also displaying the year-on-year growth in China’s demand.
In the Base Case scenario, as shown in the first column of Figure 9, when the duties are first assumed to shift the global dynamics of trade flow in 2012, U.S. imports to China decrease from 34.9 M kg to 15.4 M kg (44%) from the prior year. Similarly, ROW imports to China decrease from 42.7 M kg to 33.6 M kg (21%) between 2011 and 2012. Modeled results show that with the Base Case’s ultimate 57% duty rate, the United States’ deliveries to China do not recover, even with increasing demand, until 2016 when U.S. imports to China reach an estimated 39.6 M kg. In addition, U.S. demand share never achieves pre-duty levels, dropping from 0.26 in 2010 to 0.16 in 2016. The model shows that ROW imports, which were assessed at a lower duty rate (28%), recovered in 2013 with 42.3 M kg of imports to China. China supplied additional polysilicon to fill the gap, with China’s demand shares increasing from 0.43 to 0.62 and total volume increasing from 55.5 M kg to 81.1 M kg (an increase of 40.1%) in 2011 and 2012, respectively. In 2016, the model shows that U.S. and ROW imports to China totaled 39.6 M kg and 69.5 M kg, respectively.
For comparison among the seven scenarios exploring the impact of import duty severity, the 2016 production for each of the scenarios is presented in Figure 10.
In the No Tariff scenario, we investigate what the global landscape for polysilicon would look like if China had not imposed import tariffs. We use 2016 as a representative year (i.e., after the duty has been in place for a few years and initial dynamics have stabilized) for this discussion. With no tariffs, U.S. and ROW production increases (58.2 M to 60.2 M [3.5%] and 106.0 M kg to 108.0 M kg [1.9%], respectively) and China’s production decreases (120.3 M kg to 107.2 M kg [10.9%]).
The 2016 outflux from the United States to China is 39.7 M kg in the Base Case (with 57% tariff) and increases to 62.4 M kg with no tariff (57.2% increase). The 2016 outflux from ROW to China increases from 69.5 M kg (with 27.8% tariff) to 76.3 M kg with no tariff (9.8% increase). In terms of meeting China’s demand, in 2016 the U.S. contribution increases from 0.16 to 0.26 and the ROW contribution increases from 0.29 to 0.32, for the Base Case and no tariff scenarios, respectively. China’s 2016 self-supply (influx) drops 22.3%, from 132.5 M kg (with Base Case tariffs) to 103.0 M kg in the No Tariff scenario. China domestic contribution drops to 0.43 in the No Tariff scenario, down from 0.55 (Base Case scenario) in 2016. The United States sees a larger increase in exports to China than the ROW in the No Tariff scenario because the larger duty reduction (57% → 0% vs. 27.8% → 0) has a greater impact on the price of polysilicon coming from the United States vs. the ROW.
We next investigated the impact of a range of tariffs specific to China imports from the United States and ROW. The range of values is shown in Table 3 for the scenarios included: Reverse, All High Tariff, and All Low Tariff relative to the Base Case. The duty levels, demand shares, and influx to China are highlighted in Figure 9.
Once again focusing on 2016 results, in the Reverse scenario, when the severity of the current China import tariff is reversed, i.e., U.S. imports are assessed a 28% duty and ROW imports are assessed a 57% duty, compared to the Base Case, U.S. influx increases by 45.6% to 57.8 M kg and ROW influx decreases by 29.0% to 49.2 M kg. Polysilicon self-supplied by China increases slightly to 134.6 M kg (1.2%). In the High Tariff scenario, when all importers are assessed a high tariff (i.e., 57% for both United States and ROW), compared to the Base Case, U.S. influx decreases by 10.0% to 43.7 M kg and ROW influx decreases by 23.2% to 53.4 M kg in 2016. Polysilicon domestically supplied by China increases by 9.1% to 144.6 M kg. In the Low Tariff scenario, when all importers are assessed a low tariff (i.e., 28% for both United States and ROW), compared to the Base Case, U.S. influx increases by 33.5% to 53.0 M kg and ROW influx decreases by 6.8% to 64.8 M kg. Polysilicon domestically supplied by China decreases by 6.5% to 123.9 M kg.
The magnitude of the import tariff in a region impacts the demand share distribution from the three regions. Specifically, as the tariff on a region increases, its contribution to the demand share decreases and the other regions’ demand shares increase to fill the gap. In all of these scenarios, in the first year of the duty’s initial impact (2012 for this study), there is a steep drop in the importers’ contribution to demand and a corresponding increase in the domestic contribution to demand. The higher the duty, the larger the initial drop in the importers’ contribution to demand share. For example, the U.S. and ROW contributions to China demand show the greatest 2011–2012 drop, between 48% and 54%, in the scenarios where a 57% duty is assessed and the lowest 2011–2012 drop, between 16% and 25% when the lower 28% duty is in place. For the time period evaluated, the U.S. and ROW contributions to China’s polysilicon demand do not recover to pre-tariff levels in the scenarios evaluated.

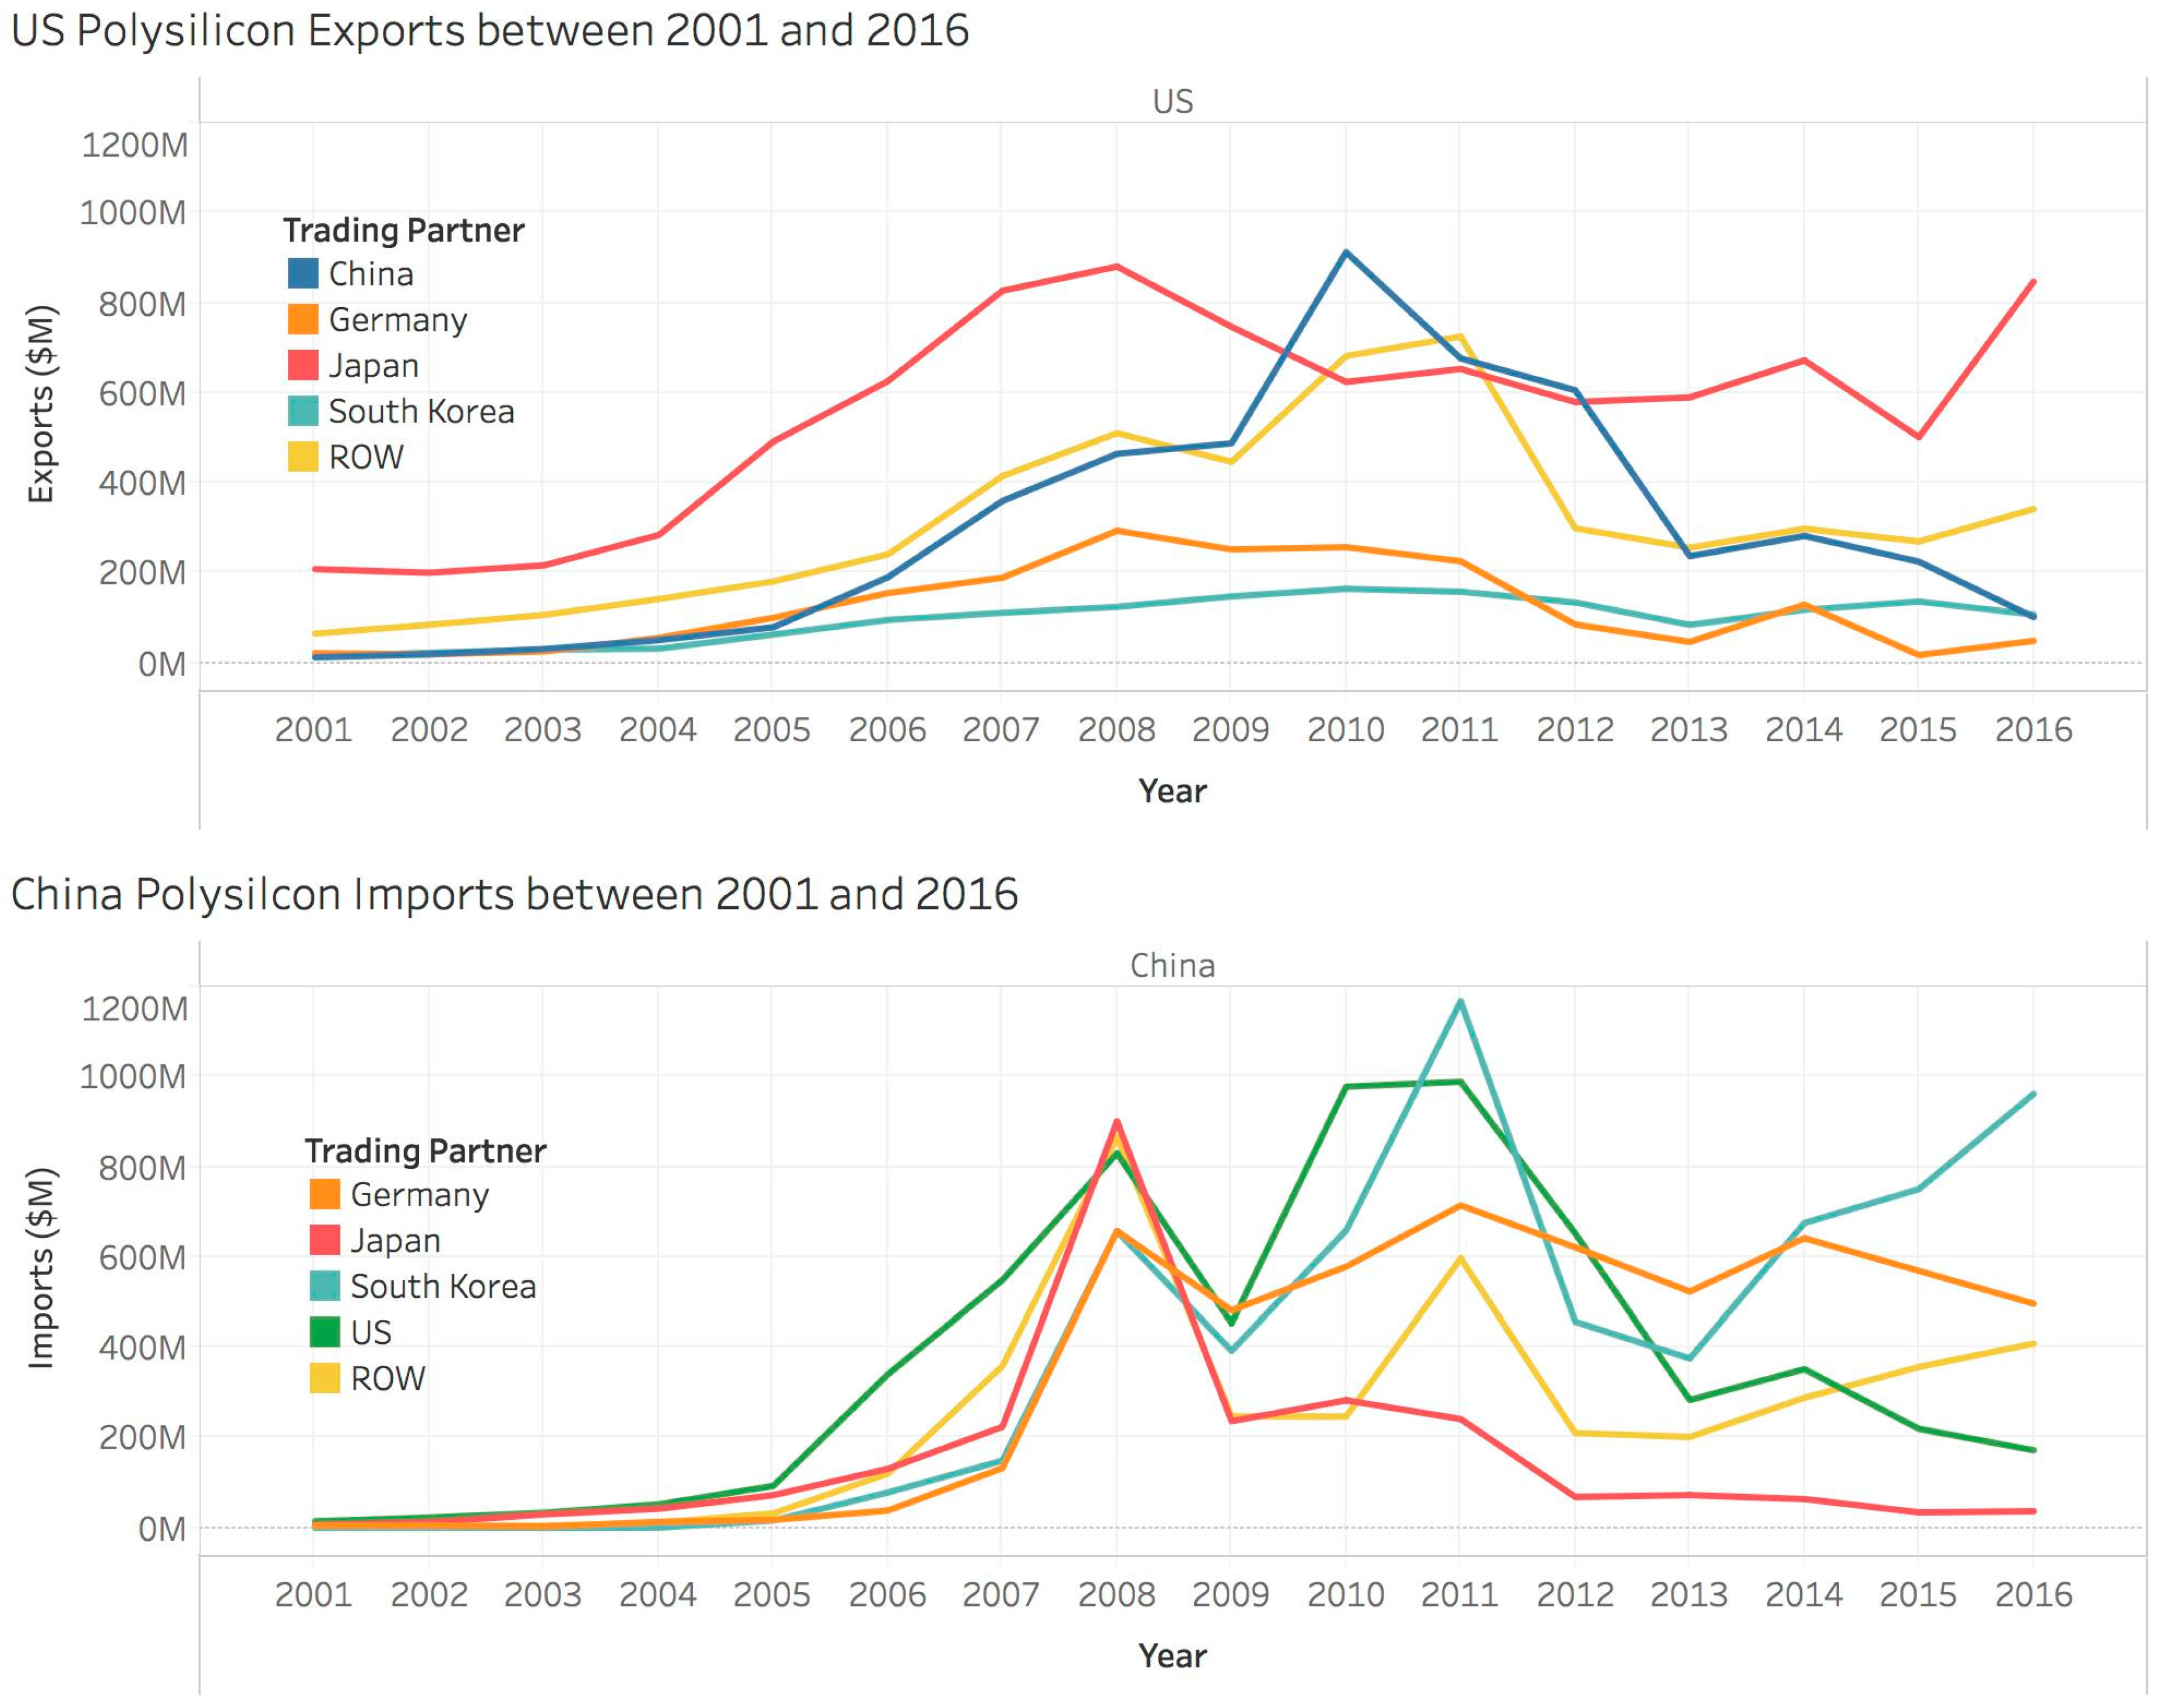
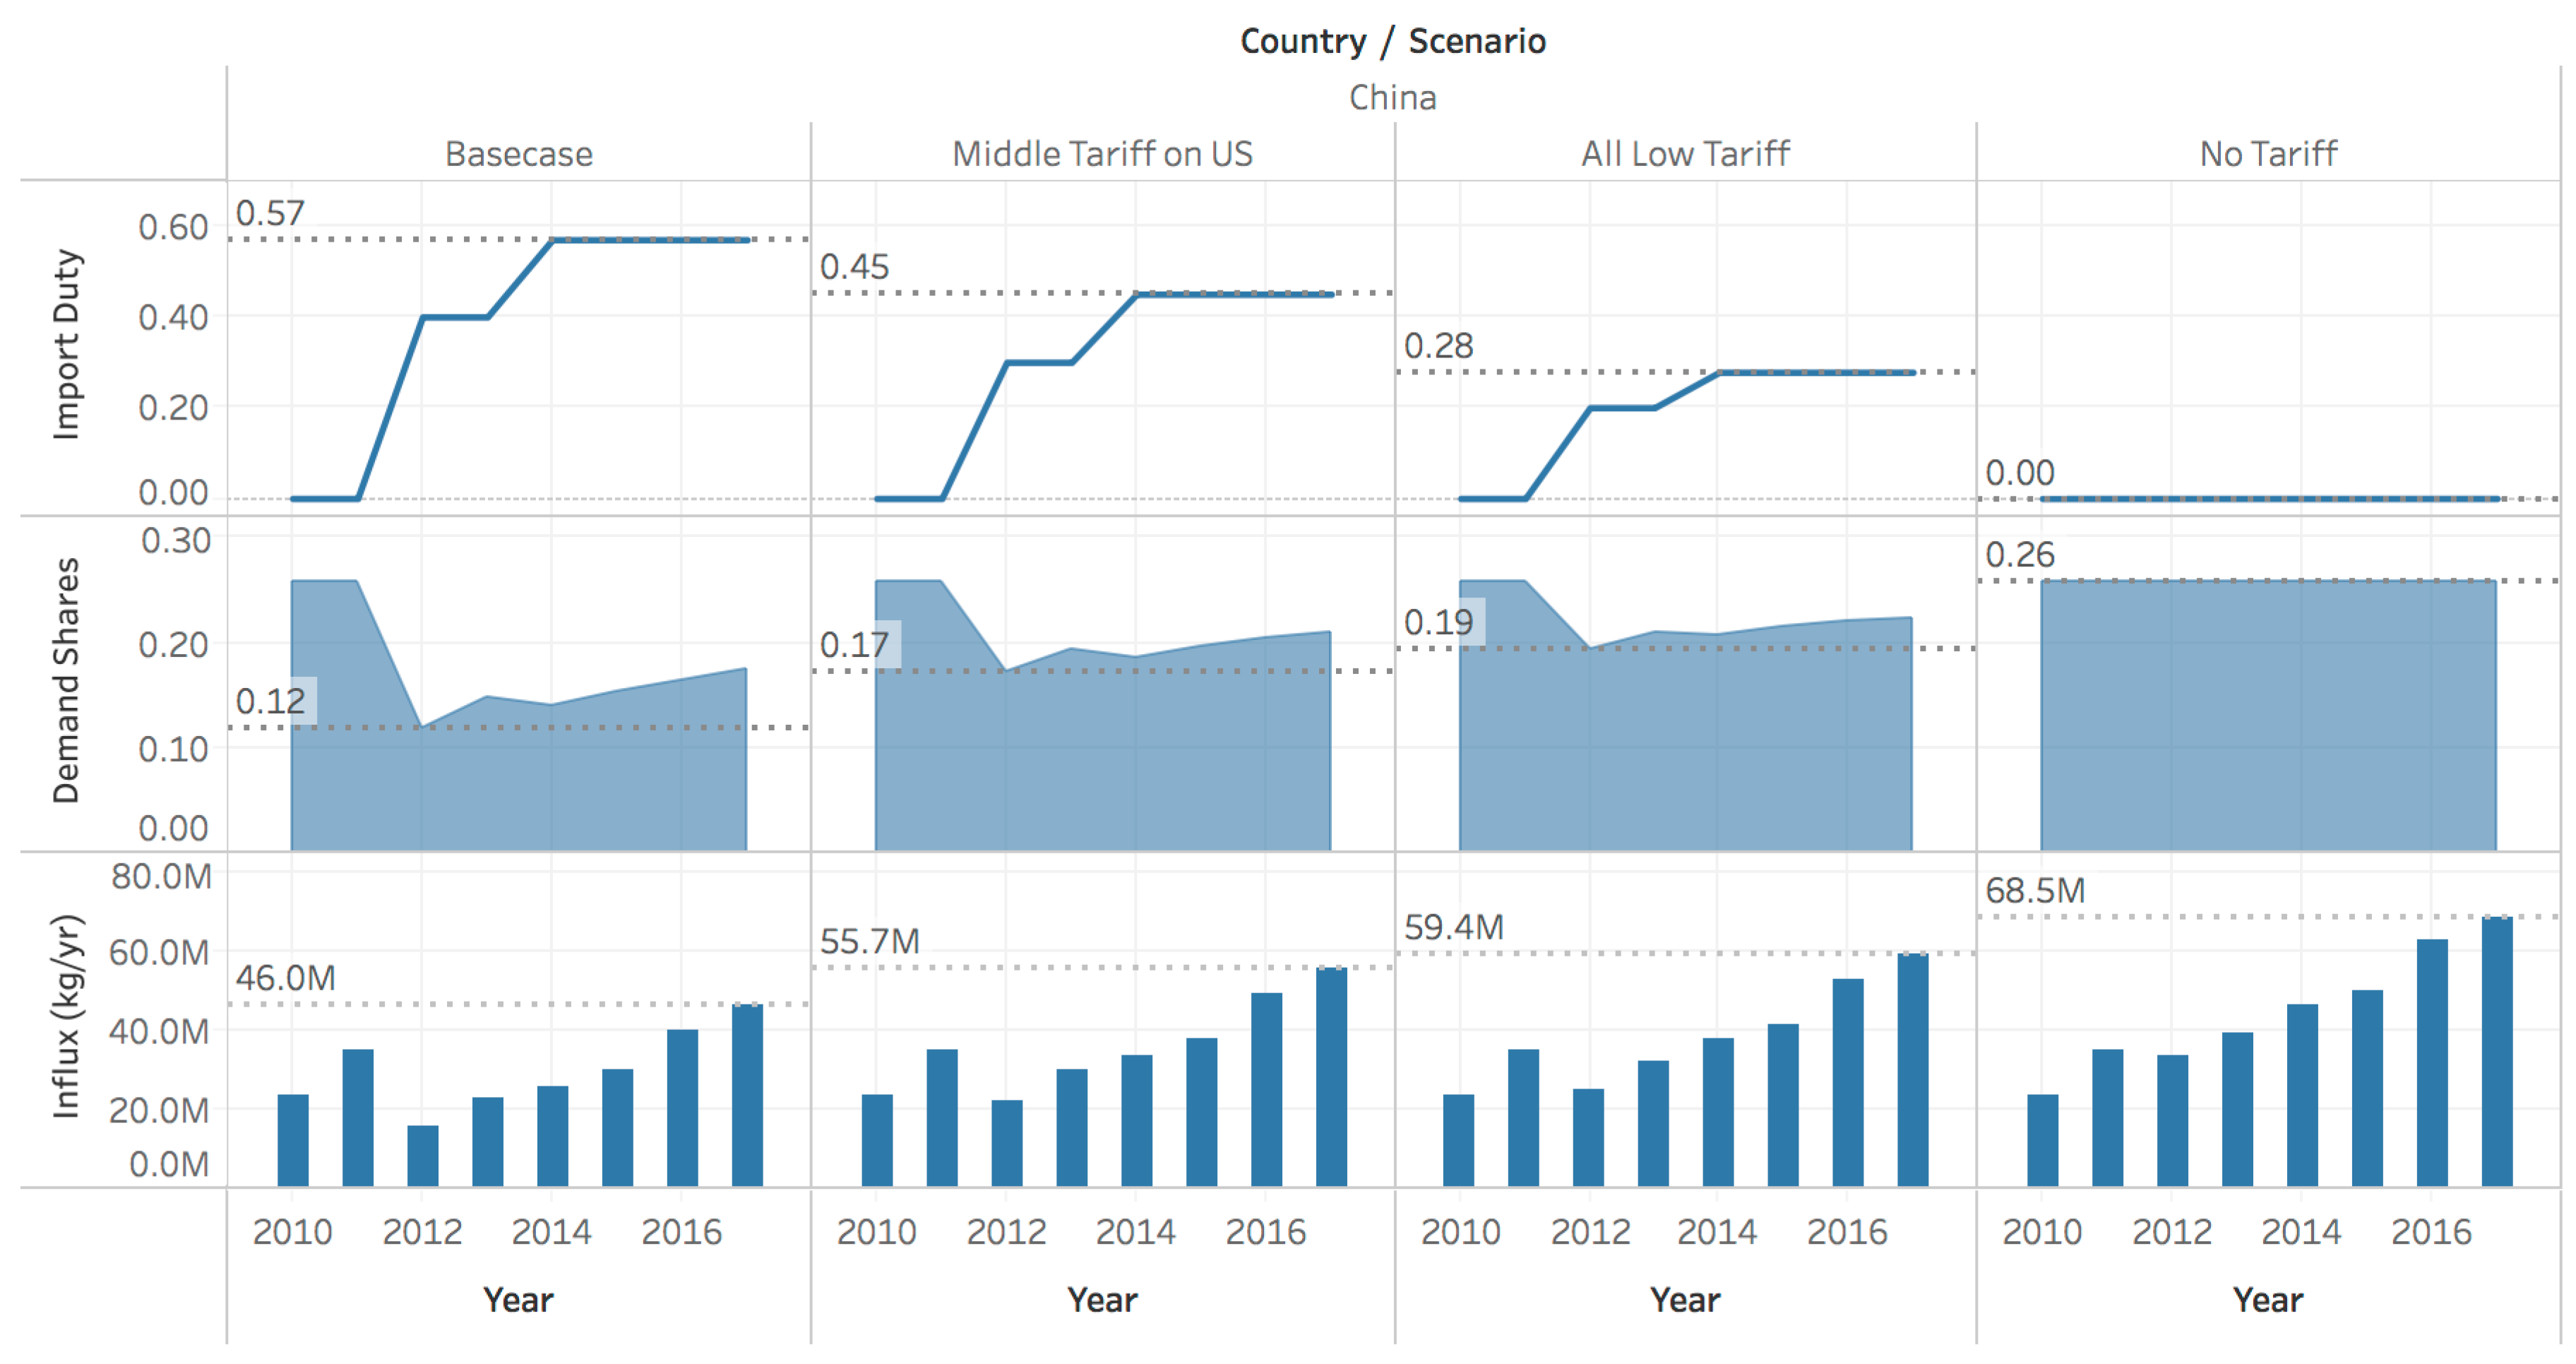
3.2. Impact of Tariff Severity on China and U.S. Flows

To further investigate the impact of the severity of import tariffs, we looked at the impact of a range of China tariffs on U.S. imports in isolation from any changes to the ROW tariff (i.e., the ROW tariff remained constant at 28%). As shown in Figure 11, as the tariff on U.S. imports decreases (shown from left to right), the influx of U.S. polysilicon to China increases. Figure 11 also shows the initial steep drop in influx when the tariff is first implemented, which increases with increasing duty level. The relationship is between the duty on U.S. imports to China and the volume of U.S. imports to China is illustrated in Figure 12. Using 2016 as a reference point, in the scenarios examined, each 10% increase in the import duty results in a 40% decrease in import volume. The magnitude of the decrease is influenced by the ability of the other regions to meet demand.

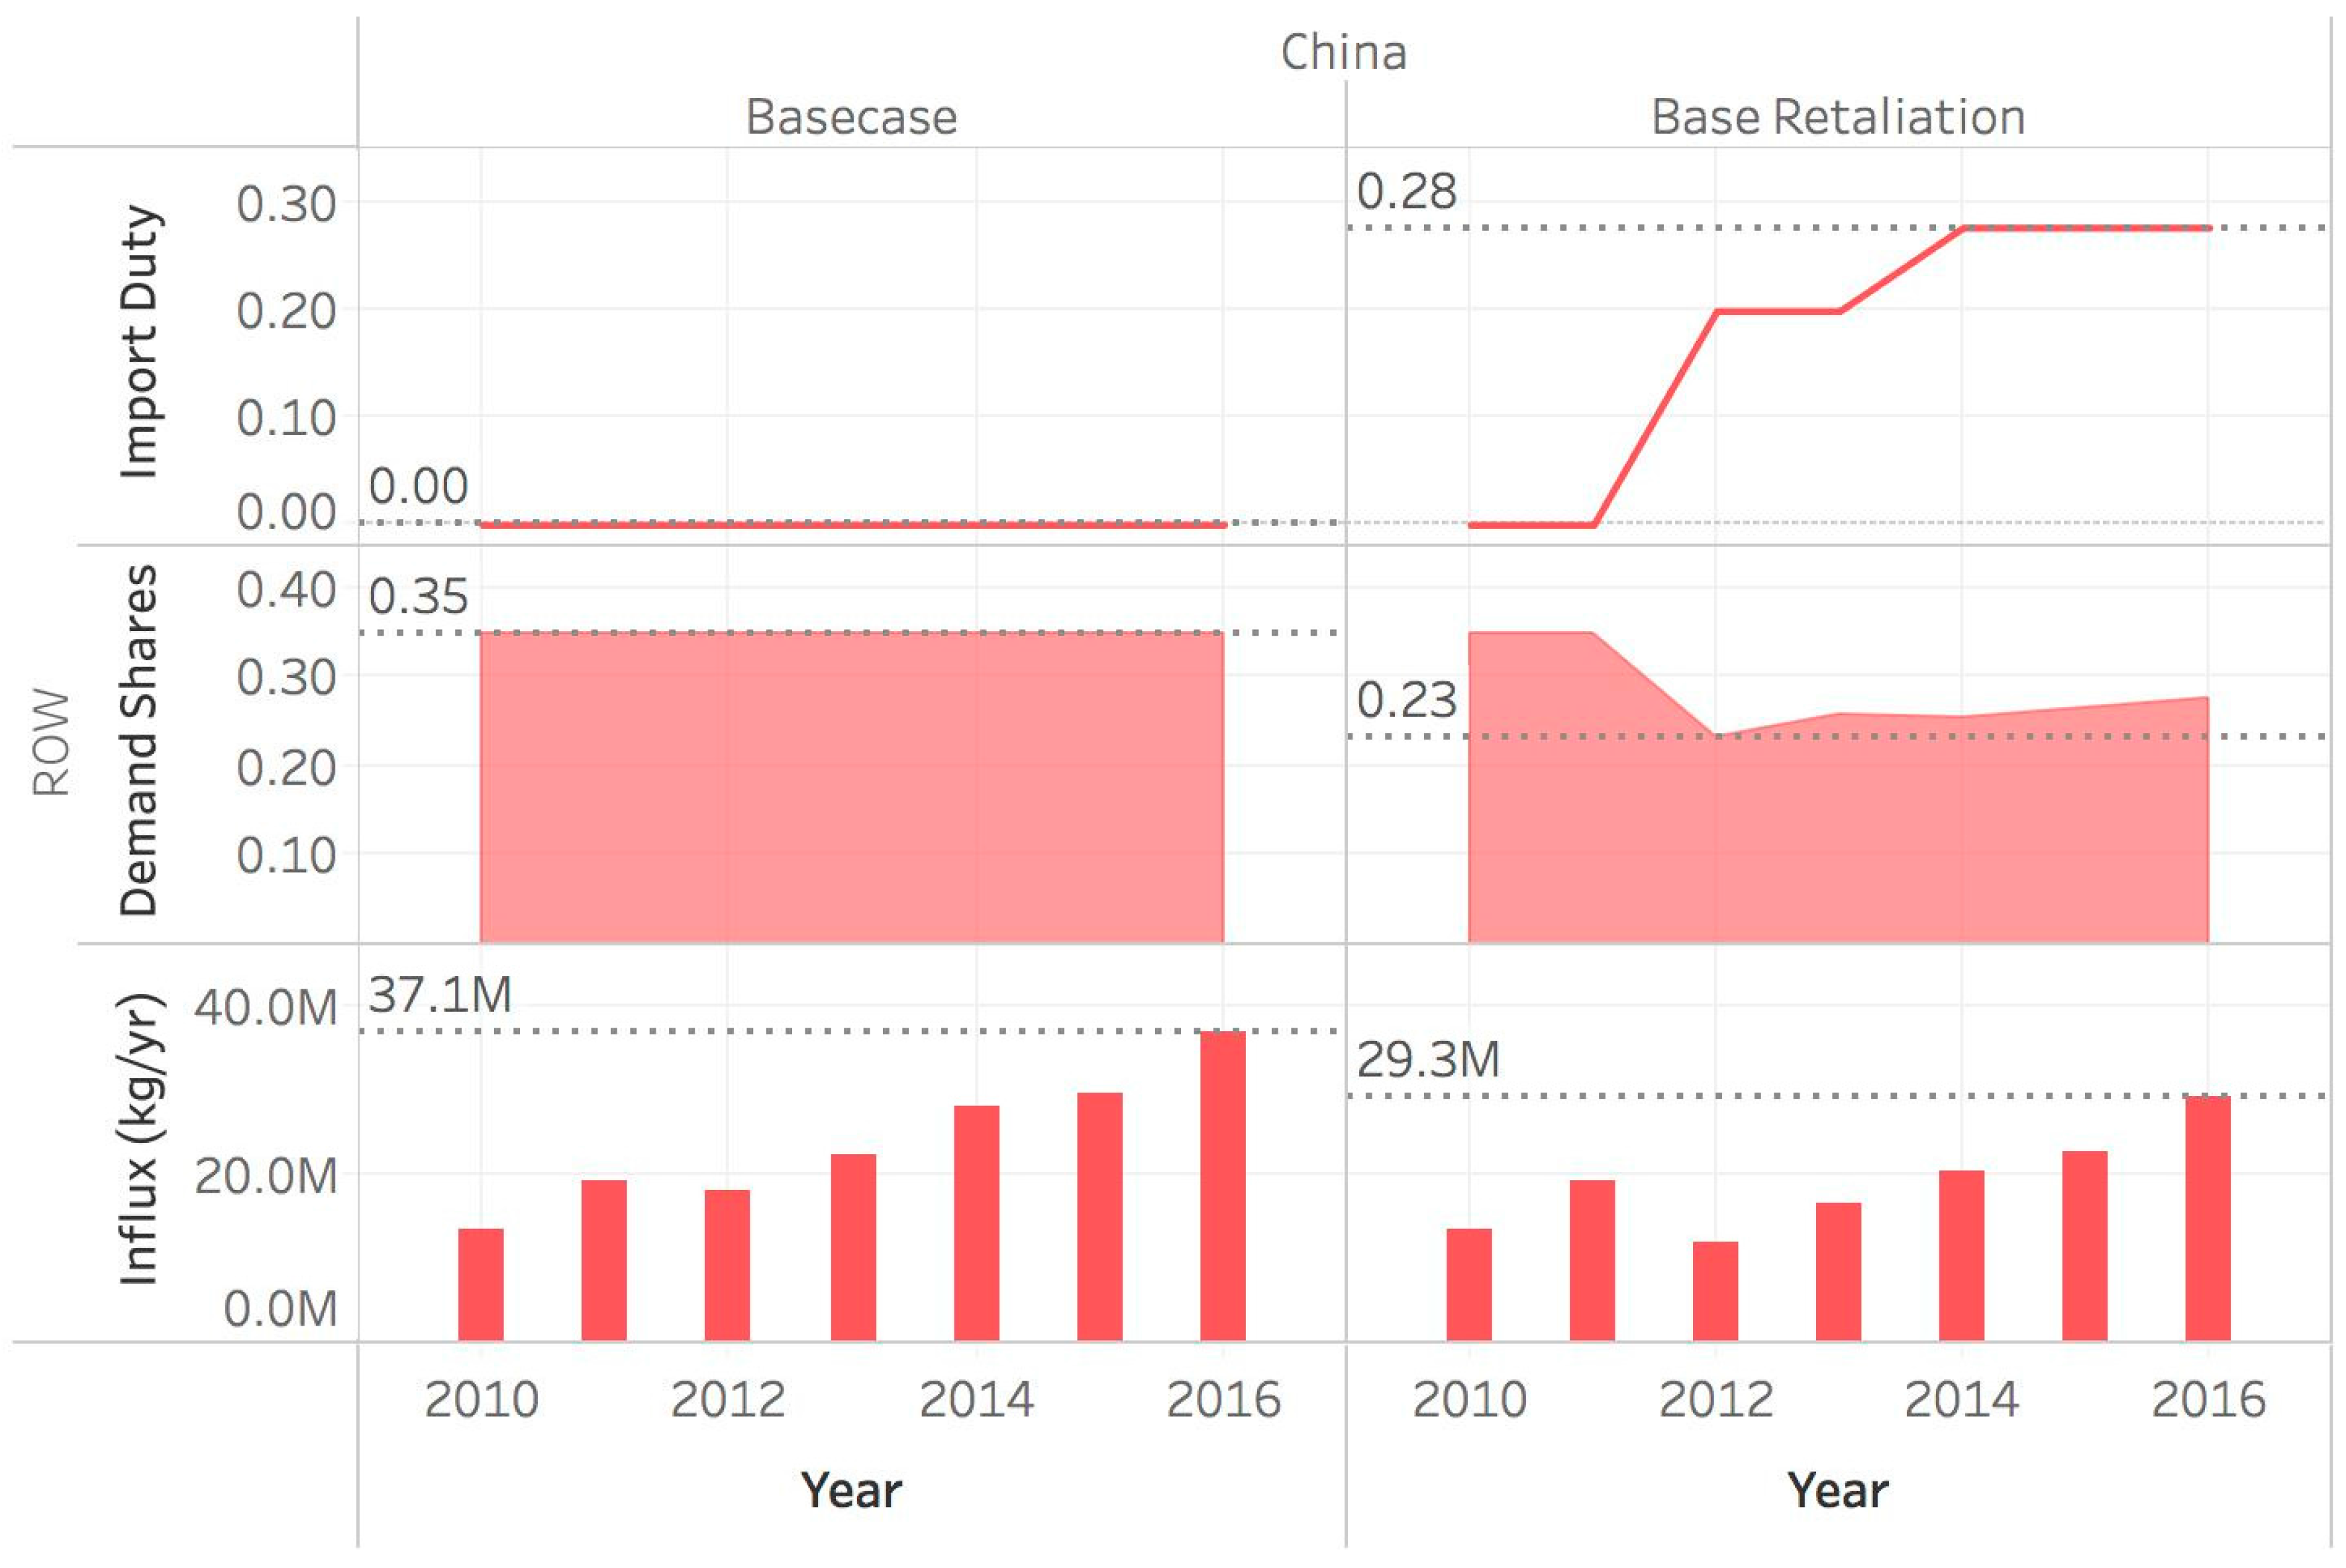
3.3. Retaliation: Impact of U.S. and ROW Tariffs on China Imports

To understand the impacts of retaliatory tariffs targeting a region that has implemented duties on another region’s imports, we assessed the impact of the United States and ROW imposing tariffs on China imports. The duty levels are shown in Table 3 for the Retaliation scenario relative to the Base Case scenario. Because the United States imports so little polysilicon from China, this discussion is focused on the impact of a ROW duty on imports into ROW from China. These results are highlighted in Figure 13, which shows the level and timing of the “retaliatory” duty on China imports, China’s contribution to ROW demand, and volume of polysilicon imports from China into the ROW.
As with the other scenarios evaluated, in the first year the duty begins to influence trade flows, there is a steep drop in the demand shares along with a drop in the influx from the targeted region. In this scenario, imports from China to ROW drop 34.3%, from 0.35 to 0.23, from 2011 to 2012. Although not shown in Figure 13, the bulk of this shortage is made up by an increase in the ROW self-supplied polysilicon (or ROW demand share) from 0.57 to 0.68 (an increase of 19%). The corresponding drop in imports is 19.4 M kg to 12.0 M kg from 2011 to 2012. In 2016, China influx to ROW decreases from 37.1 M kg to 29.3 M kg in the Retaliation scenario, compared to the Base Case scenario, a 21.0% reduction. As with the other scenarios evaluated, over the time period used, China’s contributions to the ROW polysilicon demand do not recover to pre-tariff levels in the scenarios evaluated.
This scenario shows that the model is responsive to changing duties from all included regions.

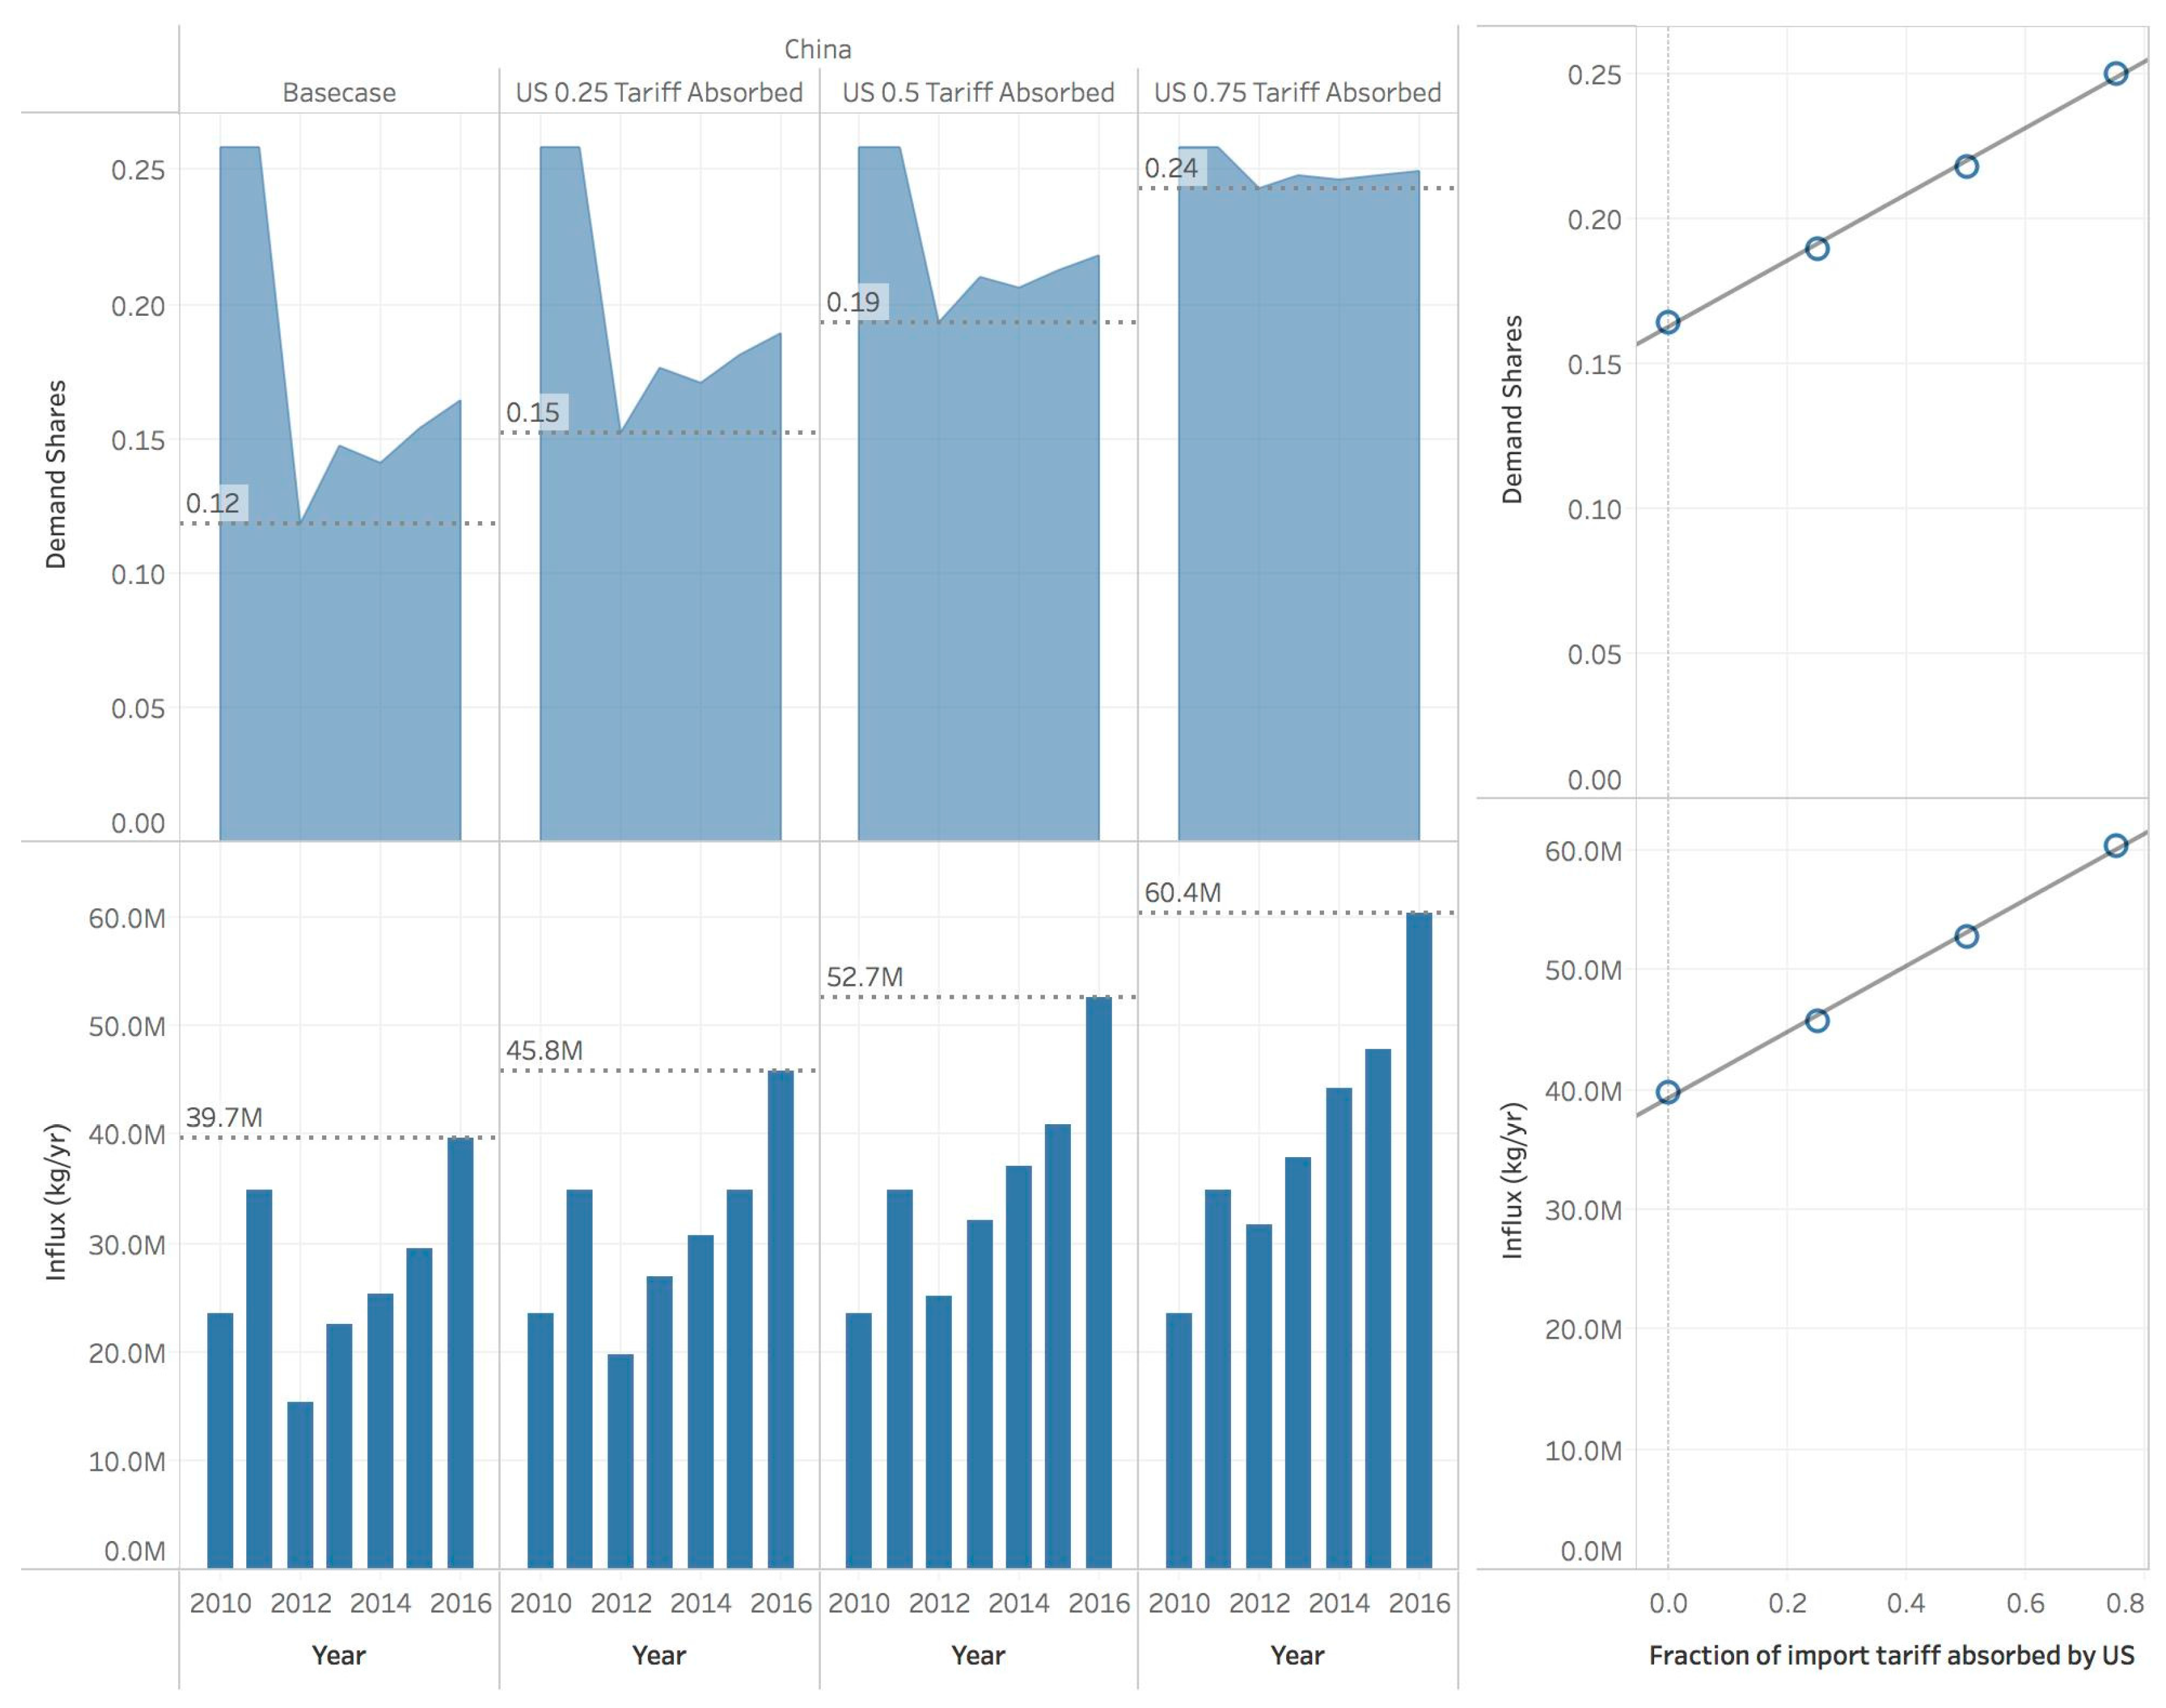
3.4. Impact of Differences in Level of Tariff Absorbed

A region impacted by an export tariff has the option to absorb a portion of the tariff in order to maintain some level of trade, potentially avoiding costly shut downs of polysilicon manufacturing plants. Doing so has financial implications on the producing country in terms of per unit revenues (net of any tariff absorbed), but also on the importing country with regards to the point-of-use price seen by end-users. The Level of Tariff Absorbed scenarios, shown in Figure 14, illustrate the impact of the United States absorbing from 25% to 75% of the polysilicon import tariff imposed by China. (In all other scenarios considered, regions impacted by an export tariff absorbed none of the tariff (i.e., 0%)). As the United States absorbs an increasing level of the tariff, the level of reduction in demand shares and influx into China decreases. Simply, when an import tariff is imposed, it can be paid by the exporting country’s producers or the importing country’s consumers. As the share of the import tariff that is paid by the exporting country’s producers increases, the price paid by the importing country’s consumers is less and less affected. If the import duty is not passed to consumers, then the exporters’ product may remain competitive. As exporting producers pay more of the importing country’s import duty, exports are less and less reduced. The modeled impact of this relationship is displayed in Figure 14.

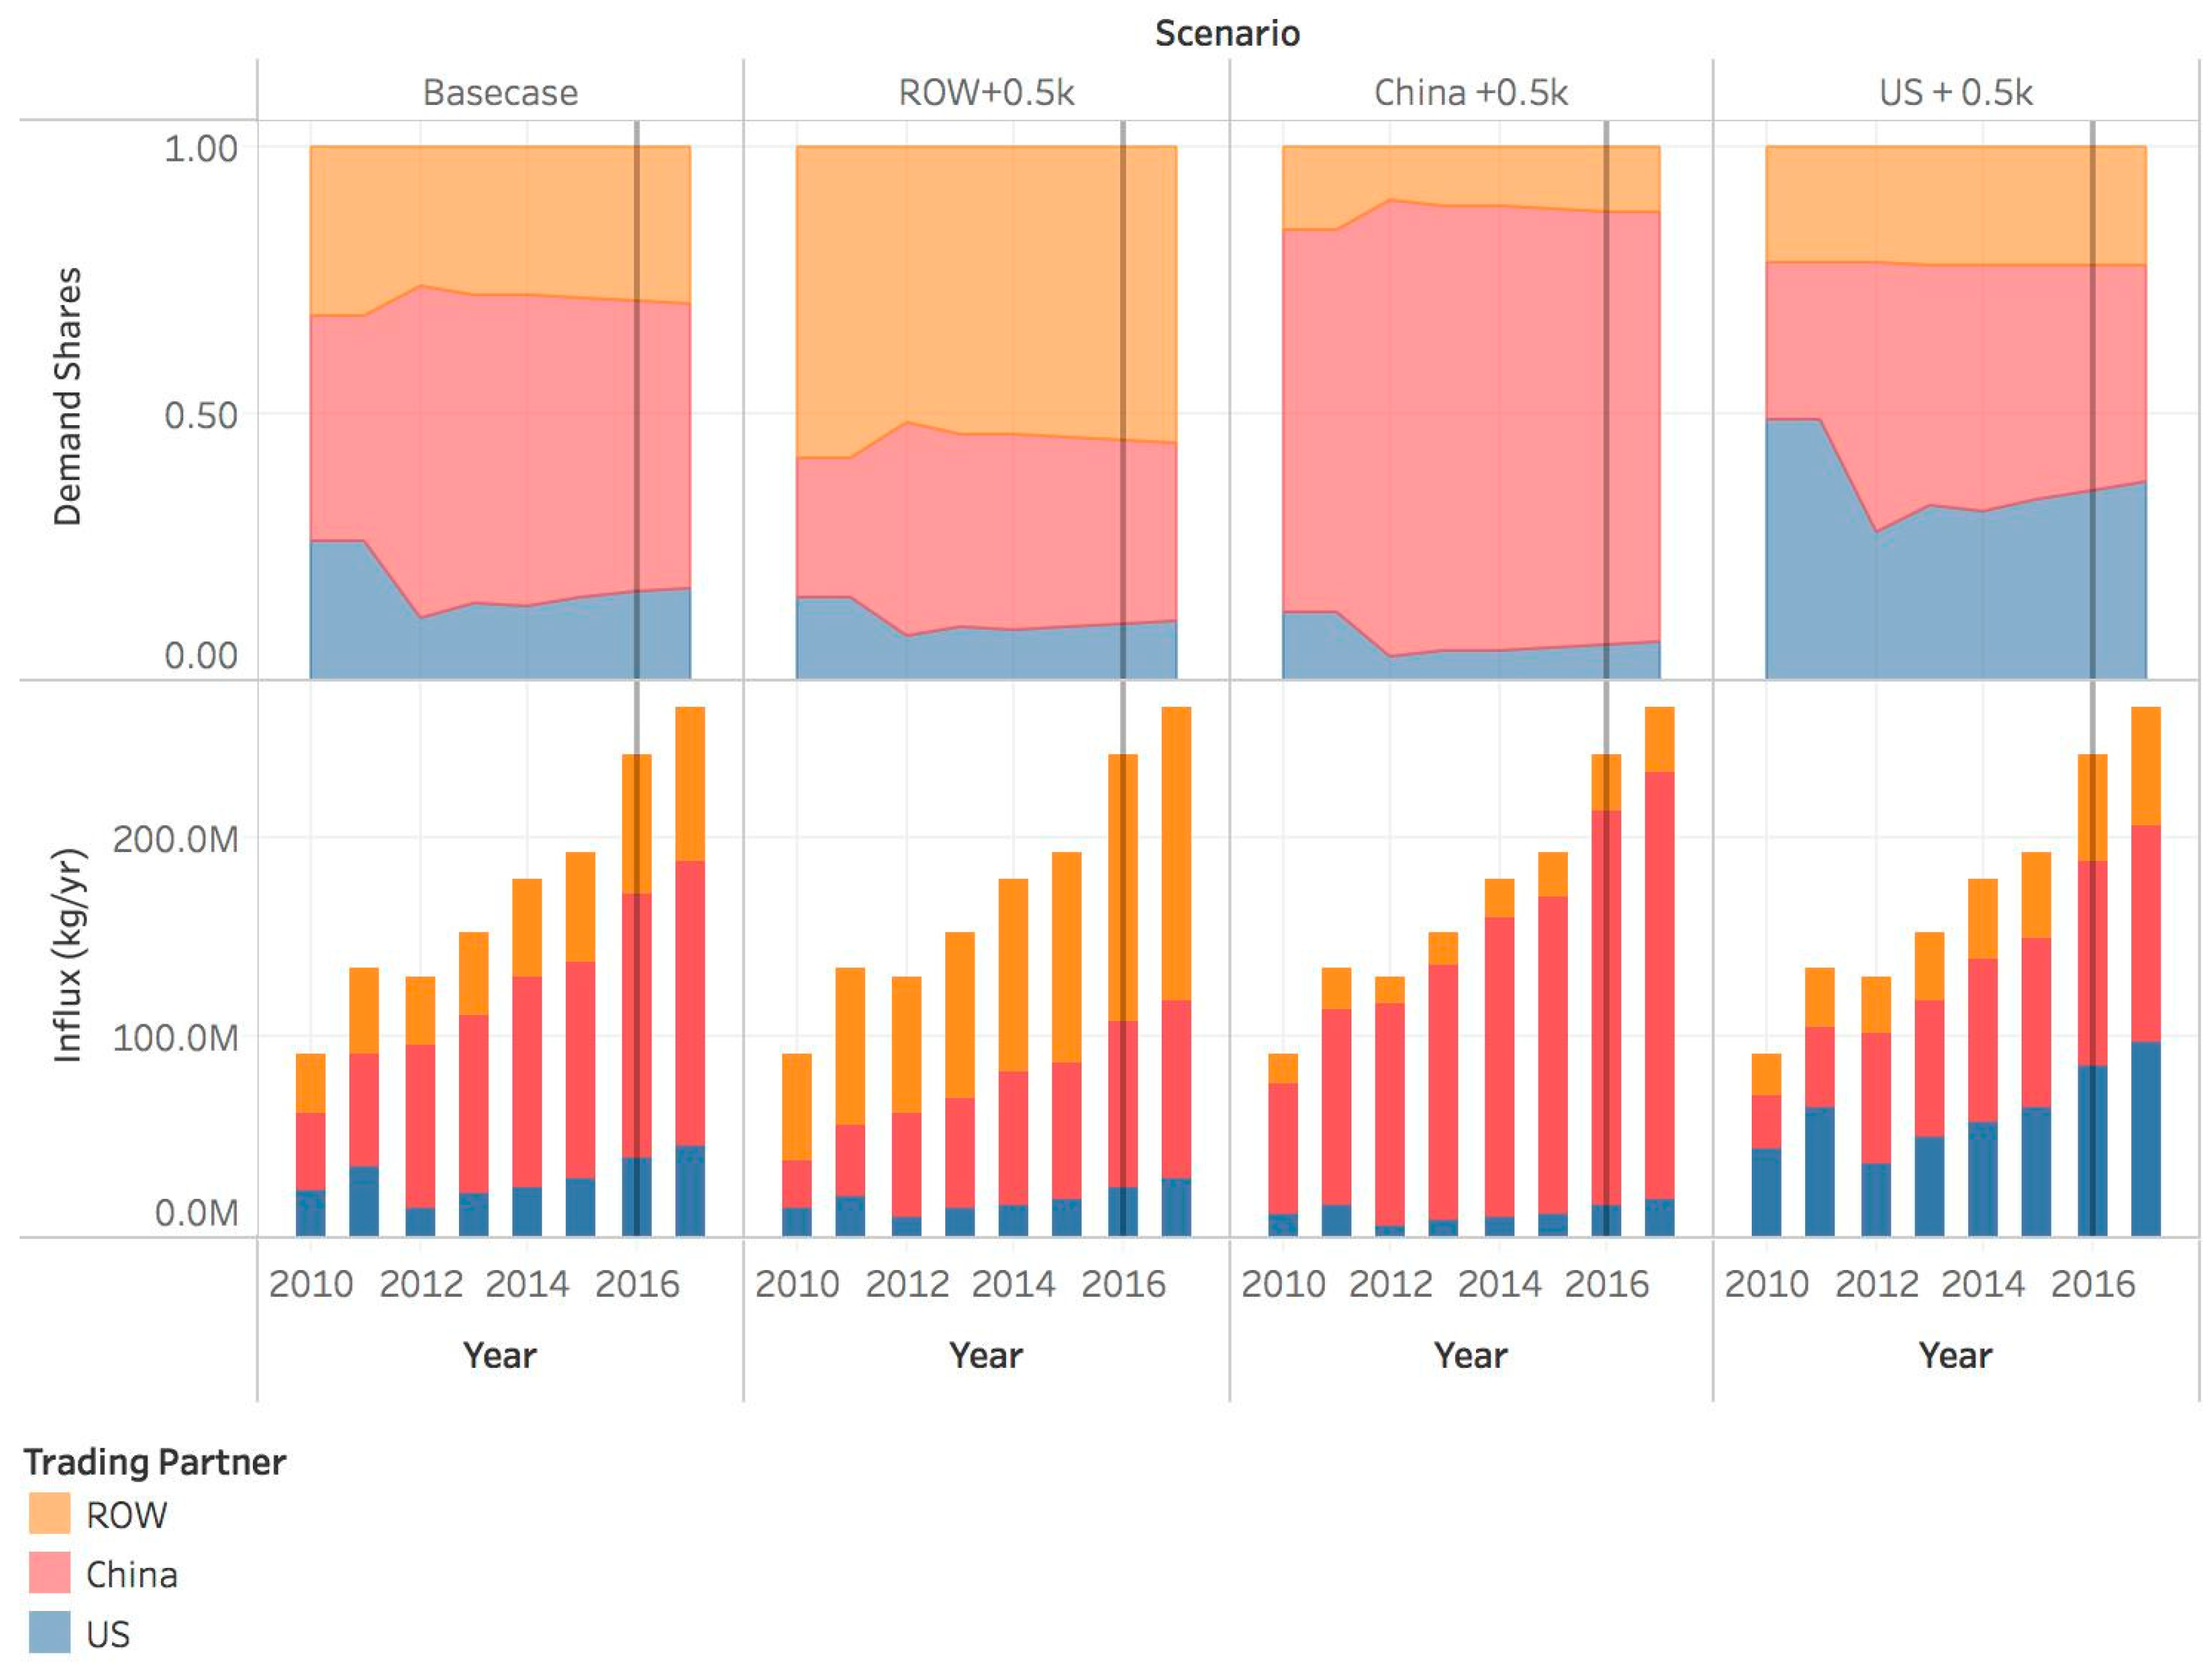
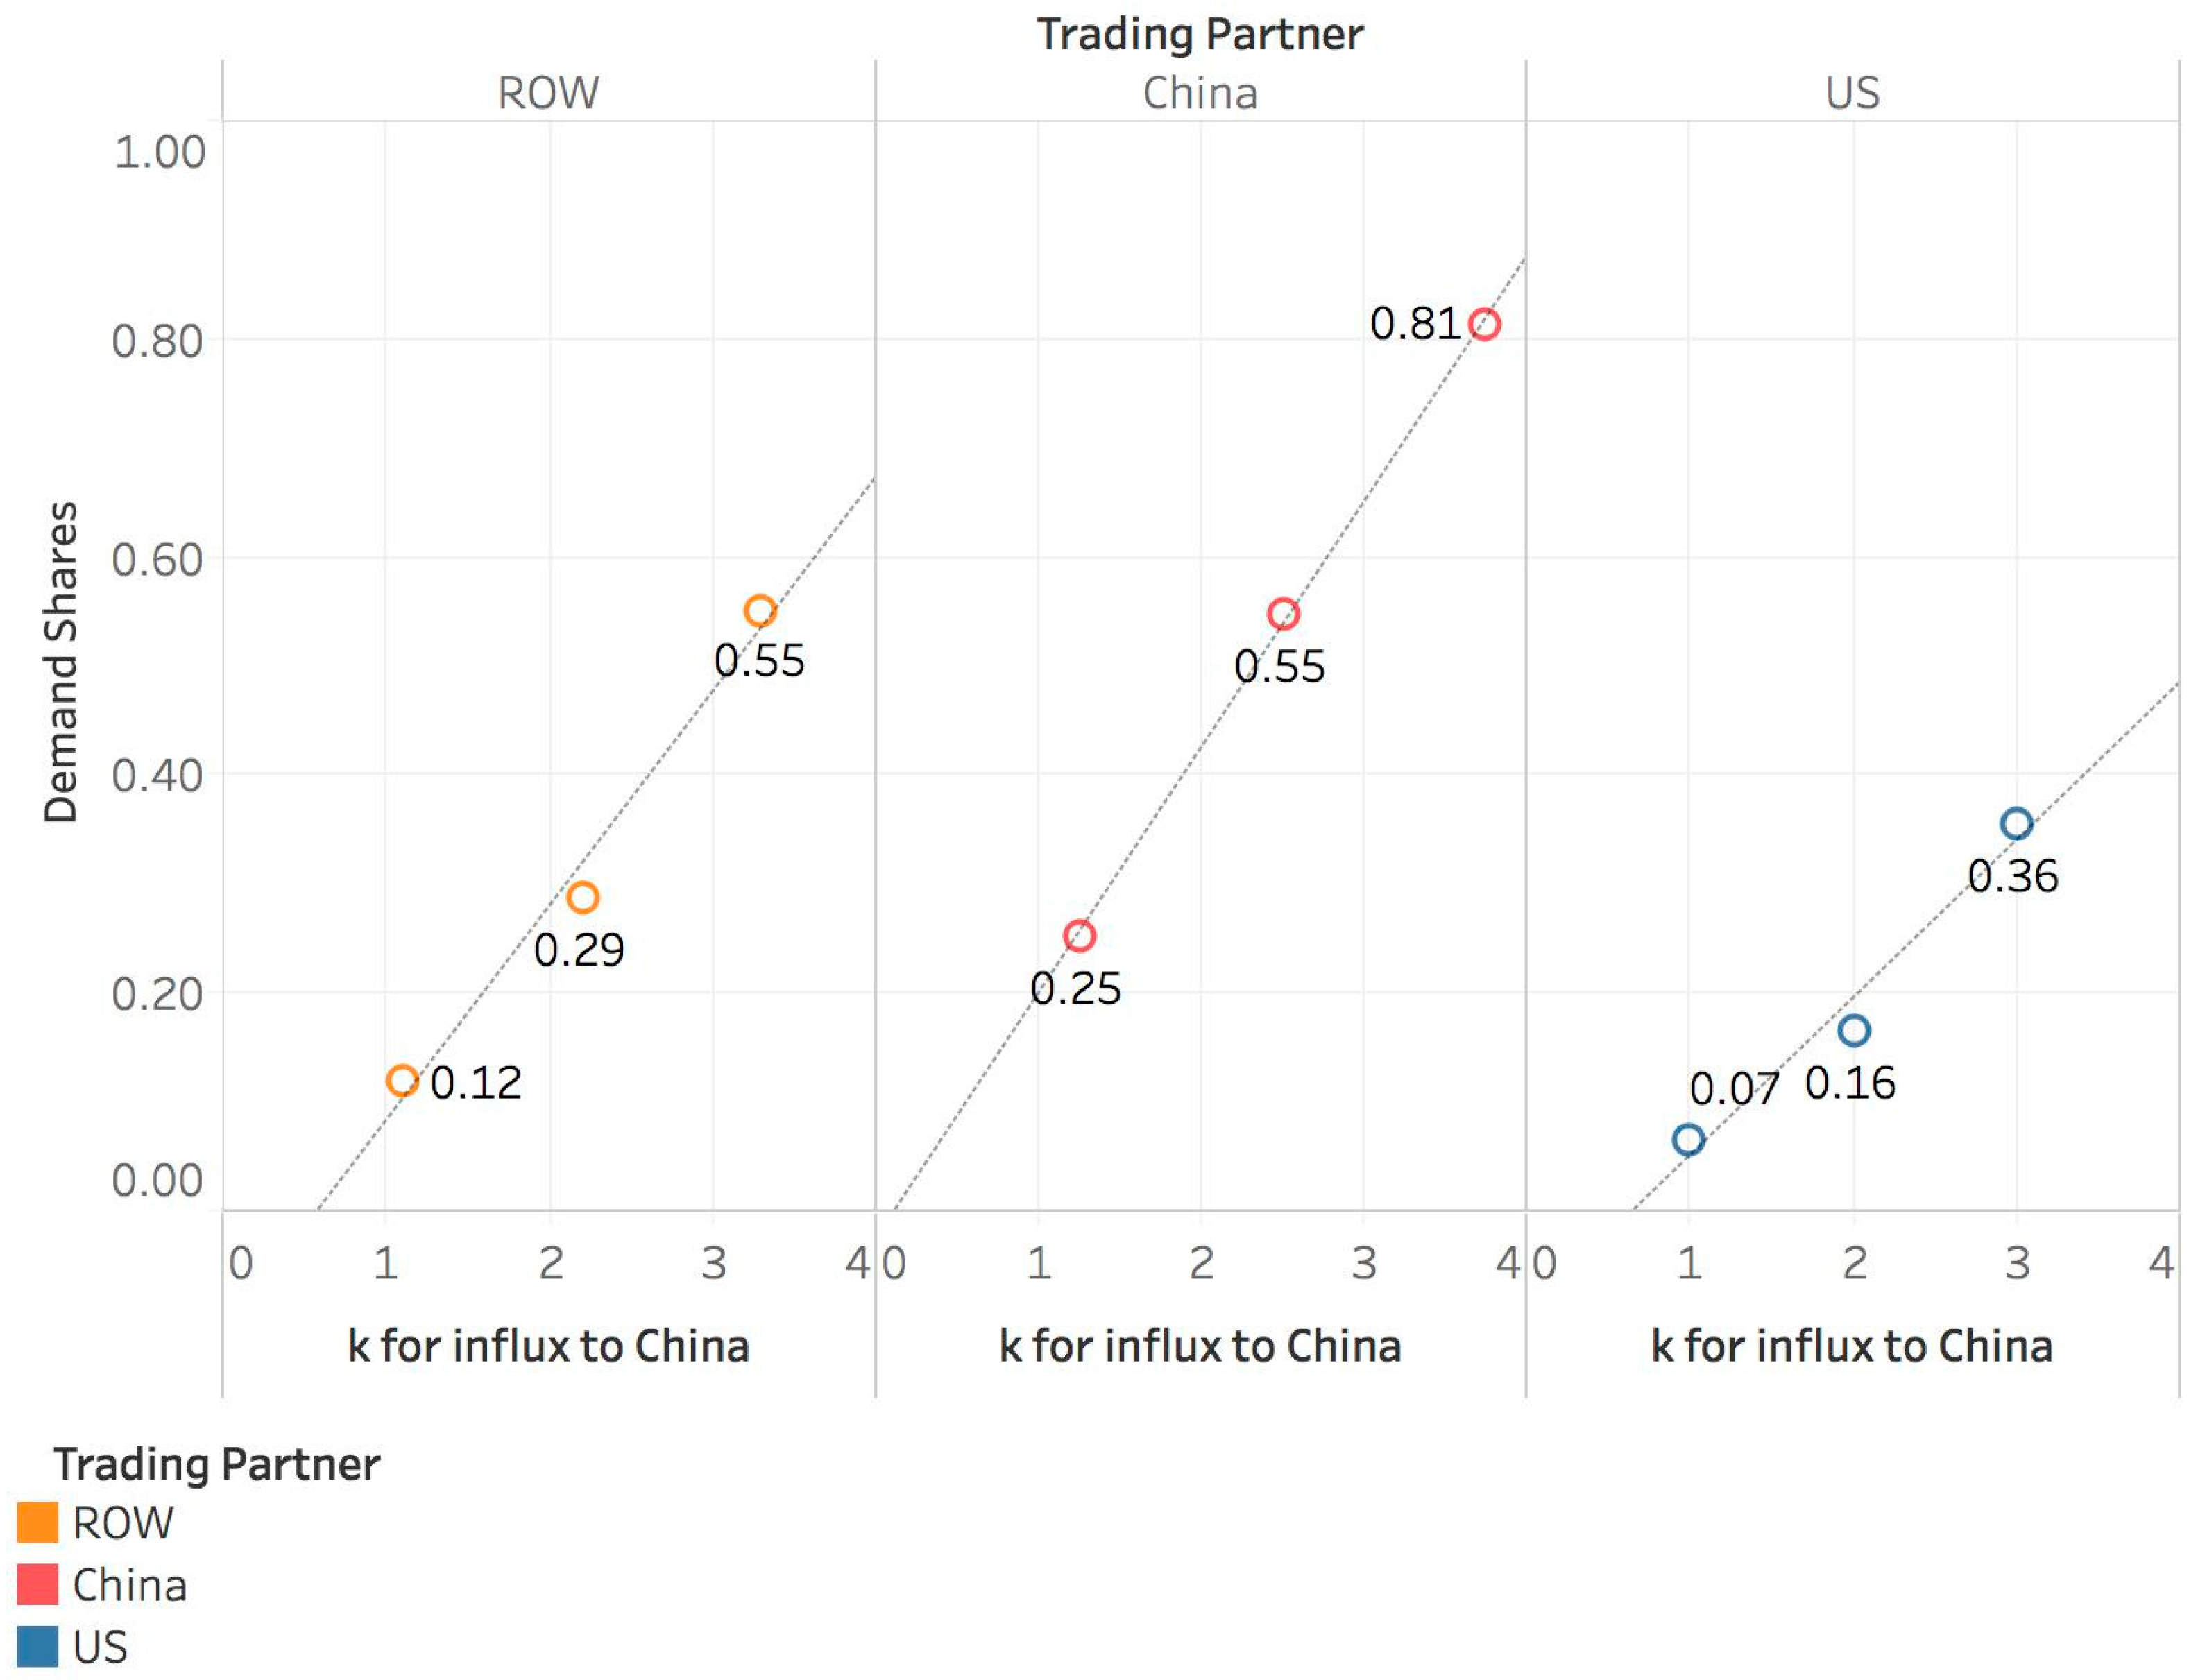
3.5. Impact of Differences in Relative Regional Attractiveness

Other measures to promote domestic production and trade with specific regions have been used in the renewable energy manufacturing sector. As described in Section 2.1, the PolyMAT model estimates the “attractiveness” of polysilicon from each of the three regions using a logit function that considers (1) the relative price of polysilicon supplied from each region and (2) other non-price-driven, exogenous factors such as the impact of domestic content requirements or free trade agreements (the parameter, k). In aggregate, the k parameter embodies all inputs to polysilicon attractiveness except price and can be used to fine-tune the model to mirror historical data (particularly in times of relative price parity).
Results from the scenarios presented to this point were driven by the relative attractiveness of polysilicon from competing producers, based on its relative price and the logit function parameters required to generate model outputs that qualitatively capture historical data. To begin to understand the impact of changing relative attractiveness on the demand share and influx volumes, the k portion of the logit function was adjusted by ±50% from the Base Case for each region while the other regions were held at Base Case levels. Figure 15 shows the results for the changes to demand shares and influx to China by each potential source region for the +50% k scenarios.
Figure 16 shows the relationship between the k parameter in the attractiveness calculation and demand shares and influx from each regional trading partner (using 2016 results for China), when the k value is varied by ±50%. Higher values of k correspond to greater attractiveness of polysilicon coming from a particular region (due to exogenous factors, not the price of polysilicon itself) and hence a greater share of demand being fulfilled by that specific region. Differences in the slope of the relationships depicted in Figure 16 are a function of both the Base Case value of k for a specific regional trading partner as well as the Base Case values of k for the other competing regions. More rigorous estimates of the regional values for k, based on inter-regional data for shipments of polysilicon, would allow deeper analysis of these relationships in the future.

4. Discussion and Conclusions

This study lays the groundwork for investigating the economic risks (“Economic risks are related to price shocks and international supply disruptions of energy commodities, critical materials, and/or equipment.” [61]) to the energy security of renewable technology supply chains. Specifically, the PolyMAT model provides a simple structural framework for the investigation of the dynamics observed in the polysilicon component of the PV module manufacturing supply chain. The model is parametrized such that simulation outputs approximate historical global price, production, and demand trends. Results from the model show the following trends across all the scenarios investigated:
  • The demand shares and influx from the United States and ROW into China show a steep drop in the year a new duty is assessed, driven by the change in relative polysilicon prices seen as the result of the tariff.
  • As the severity of the duty placed on imports from any region increases, the export volumes decrease from that region into the region that levied the tariff. The magnitude of the decrease is influenced by the extent to which other regions are able to meet the tariff levier’s demand (as estimated in the attractiveness, or k, parameter). If, for instance, China levies a tariff on imports from the United States, and the U.S.’s production is clearly more attractive to China than is production from other countries (either because it is the cheapest available or because the United States is a more attractive trading partner for other reasons like trade agreements or political positioning), imports into China from the United States may be reduced but would be further reduced if the same tariff were levied, but China had other available trading partners that were at least as attractive as the United States.
  • Once an import tariff has been imposed on a region, the contribution of that region to the duty-imposing region’s demand does not achieve pre-duty levels over the time period and specific scenarios investigated, even as global and regional demands increase. This is to say that, within the current model’s set of specifications, once a region’s exports into a country are hit with a tariff, they were never seen to contribute more total imports into the country than they did prior to the tariff. (Import volumes could, of course, return to or even exceed pre-tariff values, due to increased overall demand, but the presence of an import tariff means that demand share will continue to be less than what it was in a pre-tariff scenario.)
  • A region can offset some of the negative trade impacts by absorbing all or part of an export tariff, thereby affecting the ultimate point-of-use price seen by end-users (and hence demand shares) in a tariff-imposing region.
While these results provide a starting point, understanding the impacts of disruptions in just one link of the supply chain is not sufficient to mitigate economic energy security risks to a renewable energy technology such as PV modules, which relies on an integrated network of materials and subcomponents sources from around the world. The framework of the current PolyMAT model provides a simplified but useful foundation that can be can be expanded to address more complex issues. Future model development could include incorporating and validating: production and capital costs by region (the current version uses averages across all regions); regional production incentives; additional scenarios including other trade actions (e.g., minimum selling price) and policies that favor domestic production; other specific countries/regions (e.g., European Union/Germany, South Korea); and additional supply chain links (PV wafer, PV cell, and PV module). An expanded model could provide insights into potential global and regional responses to factors such as targeted trade actions, price volatility, and shifting regional demand and production distribution across the entire manufacturing supply chain supply chain to help inform policy and actions to strengthen energy security. For example, results could be used to understand the relative implications of levers such as tariffs and subsidies across the PV module manufacturing supply chain. The expanded model could also be used to identify potential bottlenecks and lock-in/lock-out effects in the supply-chain and the conditions under which they retard or accelerate industry evolution and domestic competitiveness.
The deployment of renewable energy technologies is expected to continue to grow exponentially as countries seek to increase their economic and energy security through diversification of energy sources and the use of domestic and secure fuels such as sun and wind. However, these massive energy infrastructure deployments require access to low cost generation technologies in the form of solar panels and wind turbines, which in turn require access to specialized manufacturing facilities and processed materials through resilient supply chains. The imposition of trade duties has the potential to increase the cost or reduce the access to energy technologies within a country that does not have control of the entire supply chain, potentially destabilizing the global market in these technologies. This may result in decreased renewable energy technology deployment (and decreased access to a native renewable resource). Alternatively, given time, it may cause increased domestic manufacturing for a domestic market, which may or may not result in a price decrease. Under any scenario, trade is complex and decision makers need better market information on how trade policy levers may impact the entire supply chain of key energy technologies, in order to achieve greater energy security for all. SD models can help evaluate and analyze a range of possible scenarios to improve decision-making in this arena.

Acknowledgments

The authors would like to thank the Clean Energy Manufacturing Analysis Center for its support of the development of this analysis and preparation of this article. Operational support by the Joint Institute for Strategic Energy Analysis and the U.S. Department of Energy Office of Energy Efficiency and Renewable Energy is instrumental to CEMAC and to the completion of this analysis. Thanks also to the reviewers of the entire document from the National Renewable Energy Laboratory, the U.S. Department of Energy, U.S. Department of Commerce, and others. Special thanks to Michael Woodhouse for his detailed insights of solar PV manufacturing and trade and to David Keyser and Ashwin Ramdas for updating the CEMAC PV module supply chain trade data to 2016. We also appreciate the editorial support of Kathryn Ruckman and design services of Stacy Buchannon.

Author Contributions

Debra Sandor led the analysis and prepared the polysilicon background, results and discussion sections of the paper. Sadie Fulton collected polysilicon market data and supported scenario analysis and preparation of the methods and analysis sections of the paper. Jill Engel-Cox conceived of the paper topic, prepared the sections related to energy security and manufacturing, and prepared text and revisions for multiple sections throughout. Corey Peck and Steve Peterson developed the structure of the SD model and prepared the description of the model and the relevance of SD modeling.

Conflicts of Interest

The authors declare no conflicts of interest.

References

  1. Valentine, S. Emerging symbiosis: Renewable energy and energy security. Renew. Sustain. Energy Rev. 2011, 15, 4572–4578. [Google Scholar] [CrossRef]
  2. Winzer, C. Conceptualizing energy security. Energy Policy 2012, 46, 36–48. [Google Scholar] [CrossRef]
  3. Yergin, D. Ensuring energy security. Foreign Aff. 2006, 85, 69–82. [Google Scholar] [CrossRef]
  4. Kruyt, B.; van Vuuren, D.P.; de Vries, H.J.M.; Groenenberg, H. Indicators for energy security. Energy Policy 2009, 37, 2166–2181. [Google Scholar] [CrossRef]
  5. EIA. Real Prices Viewer. U.S. Energy Information Administration. Available online: https://www.eia.gov/outlooks/steo/realprices/ (accessed on 25 August 2017).
  6. Asif, M.; Muneer, T. Energy supply, its demand and security issues for developed and emerging economies. Renew. Sustain. Energy Rev. 2007, 11, 1388–1413. [Google Scholar] [CrossRef]
  7. Awerbuch, S. Portfolio-Based Electricity Generation Planning: Policy Implications For Renewables and Energy Security. Mitig. Adapt. Strateg. Glob. Chang. 2006, 11, 693–710. [Google Scholar] [CrossRef]
  8. Wang, Q.; Martinez-Anido, C.B.; Wu, H.; Florita, A.R.; Hodge, B.M. Quantifying the Economic and Grid Reliability Impacts of Improved Wind Power Forecasting. IEEE Trans. Sustain. Energy 2016, 7, 1525–1537. [Google Scholar] [CrossRef]
  9. Martinez-Anido, C.B.; Botor, B.; Florita, A.R.; Draxl, C.; Lu, S.; Hamann, H.F.; Hodge, B.M. The value of day-ahead solar power forecasting improvement. Sol. Energy 2016, 129, 192–203. [Google Scholar] [CrossRef]
  10. NREL (National Renewable Energy Laboratory). Distributed Generation Renewable Energy Estimate of Costs. National Renewable Energy Laboratory. Available online: https://www.nrel.gov/analysis/tech_lcoe_re_cost_est.html (accessed on 25 August 2017).
  11. Sandor, D.; Chung, D.; Keyser, D.; Mann, M.; Engel-Cox, J. Benchmarks of Global Clean Energy Manufacturing; Clean Energy Manufacturing Analysis Center: Golden, CO, USA, 2017; NREL/TP-6A50-65619.
  12. The Terminal, Bloomberg Professional Services. (Database: Commodity Price Graph for BNEF Survey Spot Polysilicon Overall Average Price 12/25/00 to 10/2/17). Available online: https://www.bloomberg.com/professional/solution/bloomberg-terminal/?utm_source=bloomberg-menu&utm_medium=terminal&bbgsum=DG-WS-PROF-SOLU-TERMINAL-bbgmenu (accessed on 10 October 2017).
  13. Hughes, L.; Meckling, J. The politics of renewable energy trade: The U.S.-China solar dispute. Energy Policy 2017, 105, 256–262. [Google Scholar] [CrossRef]
  14. Cimino, C.; Hufbauer, G. Trade Remedies in Renewable Energy: A Global Survey. In Proceedings of the China, the West, and the Challenge of Alternative Energy Innovation Workshop, Washington, DC, USA, 26 June 2014; Peter, G., Ed.; Peterson Institute for International Economics: Washington, DC, USA, 2014. Available online: http://cedmcenter.org/wp-content/uploads/2014/07/Cimino-trade.pdf (accessed on 15 July 2017).
  15. OECD (Organization for Economic Cooperation and Development). Overcoming Barriers to International Investment in Clean Energy; OECD Publishing: Paris, France, 2015. [Google Scholar] [CrossRef]
  16. Mints, P. Photovoltaic Manufacturer Capacity, Shipments, Price & Revenues 2015/2016. In SPV-Supply4; SPV Market Research: San Francisco, CA, USA, 2016. [Google Scholar]
  17. Mehta, S. Polysilicon 2015–2018: Supply, Demand, Cost and Pricing; GTM Research, Greentech Media: Cambridge, MA, USA, 2014. [Google Scholar]
  18. CEMAC (Clean Energy Manufacturing Analysis Center). Benchmarks of Global Clean Energy Manufacturing, 2nd ed.; Clean Energy Manufacturing Analysis Center (in Development): Golden, CO, USA, 2018.
  19. Fu, R.; James, T.L.; Woodhouse, M. Economic Measurements of Polysilicon for the Photovoltaic Industry: Market Competition and Manufacturing Competitiveness. IEEE J. Photovolt. 2015, 5, 515–524. [Google Scholar] [CrossRef]
  20. Bernreuter, J. The Polysilicon Market Outlook 2020; Bernreuter Research: Wurzburg, Germany, 2016. [Google Scholar]
  21. REN21 Secretariat. Advancing the Global Renewable Energy Transition: Highlights of the REN21 Renewables 2017 Global Status Report; REN21 Secretariat: Paris, France, 2017; ISBN 978-3-9818107-7-6. [Google Scholar]
  22. PV Module Intelligence Service, HIS Markit Technology. (Database: PV Suppliers Tracker–Q4 2016). Available online: https://technology.ihs.com/Services/441328/pv-module-intelligence-service (accessed on 3 May 2017).
  23. Woditsch, P.; Koch, W. Solar grade silicon feedstock supply for PV industry. Sol. Energy Mater. Sol. Cells 2002, 72, 11–26. [Google Scholar] [CrossRef]
  24. Surplus Supply of Polysilicon Pressures Pricing—But Not All Polysilicon Prices are Equal. 18 April 2012. Available online: https://technology.ihs.com/405979/surplus-supply-of-polysilicon-pressures-pricingbut-not-all-polysilicon-prices-are-equal (accessed on 19 July 2017).
  25. Lewis, J.I. The Rise of Renewable Energy Protectionism: Emerging Trade Conflicts and Implications for Low Carbon Development. Glob. Environ. Politics 2014, 14, 10–35. [Google Scholar] [CrossRef]
  26. Crystalline Silicon Photovoltaic Cells, Whether or Not Assembled Into Modules. From the People’s Republic of China: Countervailing Duty Order, 77 Fed. Reg. 236, 73017. 7 December 2012. Available online: https://www.gpo.gov/fdsys/pkg/FR-2012-12-07/html/2012-29669.htm (accessed on 27 September 2017).
  27. Crystalline Silicon Photovoltaic Cells, Whether or Not Assembled Into Modules. From the People’s Republic of China: Amended Final Determination of Sales at Less Than Fair Value, and Antidumping Duty Order, 77 Fed. Reg. 236, 73018. 7 December 2012. Available online: https://www.gpo.gov/fdsys/pkg/FR-2012-12-07/html/2012-29668.htm (accessed on 27 September 2017).
  28. European Commission. EU Imposes Definitive Measures on Chinese Solar Panels, Confirms Undertaking with Chinese Solar Panel Exporters, Press Release IP/13/769. 2 December 2013. Available online: http://europa.eu/rapid/press-release_IP-13-1190_en.htm (accessed on 27 September 2017).
  29. Commission Implementing Decision on Confirming the Acceptance of an Undertaking Offered in Connection with the Anti-Dumping and Anti-Subsidy Proceedings Concerning Imports of Crystalline Silicon Photovoltaic Modules and Key Components (i.e., Cells) Originating in or Consigned from the People’s Republic of China for the Period of Application of Definitive Measures [2013] OJ L325/214. Available online: http://trade.ec.europa.eu/doclib/docs/2013/december/tradoc_151946.UT.en.L325-2013.pdf (accessed on 27 September 2017).
  30. Commission Implementing Regulation (EU) 2017/367 of 1 March 2017 Imposing a Definitive Anti-Dumping Duty on Imports of Crystalline Silicon Photovoltaic Modules and Key Components (i.e., Cells) Originating in or Consigned from the People’s Republic of China Following an Expiry Review Pursuant to Article 11 of Regulation (EU) 2016/1036 of the European Parliament and of the Council and Terminating the Partial Interim Review Investigation Pursuant to Article 11 of Regulation (EU) 2016/1036 [2017] OJ L56/131. Available online: http://eur-lex.europa.eu/legal-content/EN/TXT/PDF/?uri=CELEX:32017R0367&from=EN (accessed on 27 September 2017).
  31. Certain Crystalline Silicon Photovoltaic Products from the People’s Republic of China: Antidumping Duty Order; and Amended Final Affirmative Countervailing Duty Determination and Countervailing Duty Order. 80 Fed. Reg. 32, 8592; 18 February 2015. Available online: https://www.gpo.gov/fdsys/pkg/FR-2015-02-18/html/2015-03183.htm (accessed on 28 December 2017).
  32. Certain Crystalline Silicon Photovoltaic Products from Taiwan: Antidumping Duty Order. 80 Fed. Reg. 32, 8596; 18 February 2015. Available online: https://www.gpo.gov/fdsys/pkg/FR-2015-02-18/html/2015-03179.htm (accessed on 28 December 2017).
  33. Ministry of Commerce, People’s Republic of China (MOFCOM). Announcement No. 48, 2013, on the Preliminary Ruling of the Anti-Dumping Against Imports of Solar-Grade Polysilicon Originated in the USA and South Korea. 18 July 2013. Available online: http://english.mofcom.gov.cn/article/policyrelease/buwei/201308/20130800224101.shtml (accessed on 27 September 2017).
  34. Ministry of Commerce, People’s Republic of China (MOFCOM). Announcement No. 63, 2013, on the Preliminary Ruling of the Countervailing Investigation against Imports of Solar-Grade Polysilicon Originated in the U.S. 16 September 2013. Available online: http://english.mofcom.gov.cn/article/policyrelease/buwei/201309/20130900316570.shtml (accessed on 27 September 2017).
  35. Ministry of Commerce, People’s Republic of China (MOFCOM). Announcement No. 25, 2014, on Final Ruling on Anti-Dumping Investigation against Imports of Solar-Grade Polysilicon Originated in EU. 1 May 2014. Available online: http://english.gov.cn/policies/latest_releases/2014/08/23/content_281474983026898.htm (accessed on 27 September 2017).
  36. Ministry of Commerce, People’s Republic of China (MOFCOM). Announcement No. 26, 2014, on Final Ruling on the Countervailing Investigation against Imports of Solar-Grade Polysilicon Originated in the EU. 5 May 2014. Available online: http://english.mofcom.gov.cn/article/policyrelease/buwei/201405/20140500585551.shtml (accessed on 27 September 2017).
  37. Congressional Research Service. U.S. Solar Photovoltaic Manufacturing: Industry Trends, Global Competition, Federal Support; Platzer, M.D., Ed.; R42509; Congressional Research Service: Washington, DC, USA, 2015. Available online: https://fas.org/sgp/crs/misc/R42509.pdf (accessed on 19 July 2017).
  38. Certain Crystalline Silicon Photovoltaic Products from the People’s Republic of China: Initiation of Countervailing Duty Investigation. 79 Fed. Reg. 4667; 29 January 2014. Available online: https://www.gpo.gov/fdsys/pkg/FR-2014-01-29/html/2014-01743.htm (accessed on 27 September 2017).
  39. Certain Crystalline Silicon Photovoltaic Products from the People’s Republic of China and Taiwan: Initiation of Antidumping Duty Investigations. 79 Fed. Reg. 4661; 29 January 2014. Available online: https://www.gpo.gov/fdsys/pkg/FR-2014-01-29/html/2014-01738.htm (accessed on 27 September 2017).
  40. Commission Implementing Regulation (EU) on Imposing Definitive Countervailing Duties on Imports of Solar Glass Originating in the People’s Republic of China [2014] OJ L142/23. Available online: http://trade.ec.europa.eu/doclib/docs/2014/may/tradoc_152501.def.en.L142-2014.pdf (accessed on 27 September 2017).
  41. Commission Implementing Regulation (EU) 2015/1394 of 13 August 2015 amending Regulation (EU) No 470/2014, as amended by Regulation (EU) 2015/588, on Imposing a Definitive Anti-Dumping Duty and Collecting Definitively the Provisional Duty Imposed on Imports of Solar Glass Originating in the People’s Republic of China Following an Absorption Reinvestigation Pursuant to Article 12 of Council Regulation (EC) No 1225/2009 [2014] OJ L215/42. Available online: http://eur-lex.europa.eu/legal-content/EN/TXT/PDF/?uri=CELEX:32015R1394&from=EN (accessed on 27 September 2017).
  42. Forrester, J.W. System dynamics—A personal view of the first fifty years. Syst. Dyn. Rev. 2007, 23, 345–358. [Google Scholar] [CrossRef]
  43. Forrester, J.W. Industrial dynamics. J. Oper. Res. Soc. 1997, 48, 1037–1041. [Google Scholar] [CrossRef]
  44. Sterman, J.D. Business Dynamics: Systems Thinking and Modeling for a Complex World; Irwin/McGraw-Hill: Boston, MA, USA, 2000; ISBN 978-0-07-231135-8. [Google Scholar]
  45. Meadows, D.; Randers, J.; Meadows, D. Limits to Growth: The 30-Year Update; Chelsea Green Publishing: White River Junction, VT, USA, 2004. [Google Scholar]
  46. Millington, J.D.A.; Xiong, H.; Peterson, S.; Woods, J. Integrating Modelling Approaches for Understanding Telecoupling: Global Food Trade and Local Land Use. Land 2017, 6, 56. [Google Scholar] [CrossRef]
  47. Richardson, G.P. Feedback Thought in Social Science and Systems Theory; Pegasus Communications, Inc.: Encino, CA, USA, 1999. [Google Scholar]
  48. Luna-Reyes, L.F.; Andersen, D.L. Collecting and analyzing qualitative data for system dynamics: Methods and models. Syst. Dyn. Rev. 2003, 19, 271–296. [Google Scholar] [CrossRef]
  49. Qudrat-Ullah, H.; Seong, B.S. How to do structural validity of a system dynamics type simulation model: The case of an energy policy model. Energy Policy 2010, 38, 2216–2224. [Google Scholar] [CrossRef]
  50. Chiung-Wen, H. Using a system dynamics model to assess the effects of capital subsidies and feed-in tariffs on solar PV installations. Appl. Energy 2012, 100, 205–217. [Google Scholar] [CrossRef]
  51. Vimmerstedt, L.; Bush, B.W.; Hsu, D.D.; Inman, D.; Peterson, S.O. Maturation of biomass-to-biofuels conversion technology pathways for rapid expansion of biofuels production: A system dynamics perspective. Biofuels Bioprod. Biorefin. 2015, 9, 158–176. [Google Scholar] [CrossRef]
  52. Houari, Y.; Speirs, J.; Candelise, C.; Gross, R. A system dynamics model of tellurium availability for CdTe. Prog. Photovolt. 2014, 22, 129–146. [Google Scholar] [CrossRef]
  53. Aslani, A.; Helo, P.; Naaranoja, M. Role of renewable energy policies in energy dependency in Finland: System dynamics approach. Appl. Energy 2014, 113, 758–765. [Google Scholar] [CrossRef]
  54. Al-Sarihia, A.; Contestabileb, M.; Chernia, J.A. Renewable Energy Policy Evaluation Using a System Dynamics Approach: The Case of Oman Paper. In Proceedings of the 33rd International Conference of the System Dynamics Society, Cambridge, MA, USA, 19–23 July 2015; Available online: http://www.systemdynamics.org/conferences/2015/papers/P1003.pdf (accessed on 12 November 2017).
  55. Osorio, S.; van Ackere, A. Security of Supply in the Swiss Electricity Market: A System Dynamics Approach. In Proceedings of the 32nd International Conference of the System Dynamics Society, Delft, The Netherlands, 20–24 July 2014; Available online: http://www.systemdynamics.org/conferences/2014/proceed/papers/P1201.pdf (accessed on 25 July 2017).
  56. Happach, R.M.; Größler, A. Modelling the inner-European trade volumes of natural gas. In Proceedings of the 32nd International Conference of the System Dynamics Society, Delft, The Netherlands, 20–24 July 2014; Available online: http://www.systemdynamics.org/conferences/2014/proceed/papers/P1138.pdf (accessed on 25 July 2017).
  57. Warner, E.; Inman, D.; Kunstman, B.; Bush, B.; Vimmerstedt, L.; Peterson, S.; Macknick, J.; Zhang, Y. Modeling Biofuel Expansion Effects on Land Use Change Dynamics. Environ. Res. Lett. 2013, 8, 10. [Google Scholar] [CrossRef]
  58. Chung-Shu, L.; Chih-Tung, H.; Dong-Shang, C.; Cheng-Hsing, H. How the European Union’s and the United States’ anti-dumping duties affect Taiwan’s PV industry: A policy simulation. Renew. Sustain. Energy Rev. 2016, 53, 296–305. [Google Scholar] [CrossRef]
  59. Isee Systems. 2017. Available online: https://www.iseesystems.com/store/products/ (accessed on 9 September 2017).
  60. Train, K.E. Discrete Choice Methods with Simulation, 1st ed.; Cambridge University Press: Cambridge, UK, 2003. [Google Scholar]
  61. U.S. Department of Energy. Energy Challenges. In Quadrennial Technology Review; Energy Efficiency and Renewable Energy; U.S. Government Publishing Office: Washington, DC, USA, 2015; pp. 11–32. Available online: https://energy.gov/sites/prod/files/2015/09/f26/QTR2015-01-Challenges.pdf (accessed on 12 November 2017).
Figure 1. Polysilicon spot prices and drivers of price fluctuations [12].
Sustainability 10 00160 g001
Figure 2. The c-Si PV module manufacturing supply chain. Key supply chain intermediates are highlighted. Figure from [11].
Sustainability 10 00160 g002
Figure 3. Balance of trade for PV modules, cells, and polysilicon in 2016. Imports are shown as negative values and exports are shown as positive values, US$ millions. The numerical value is the balance of trade (exports less imports) [18]. (Data sources: https://www.usitc.gov and https://www.trademap.org/Index.aspx).
Sustainability 10 00160 g003
Figure 4. Polysilicon trade between 2001 and 2016, US$ millions. Global distribution of Chinese imports and U.S. exports shifted significantly following Chinese AD and CVD on U.S. imports. (Data sources: https://www.usitc.gov and https://www.trademap.org/Index.aspx).
Sustainability 10 00160 g004
Figure 5. Key elements and relationships in the PolyMAT model.
Sustainability 10 00160 g005
Figure 6. Comparison of modeled results and historical data for polysilicon average global selling price (contract price estimated from [20]), 2010–2016.
Sustainability 10 00160 g006
Figure 7. Comparison of modeled results and historical data for polysilicon production and demand (historical data from [22], 2010–2016).
Sustainability 10 00160 g007
Figure 8. Modeled polysilicon production volume by region for scenarios considered, 2010–2016.
Sustainability 10 00160 g008
Figure 9. Import duty, demand shares, and influx to China for a range of duties on polysilicon imports to China.
Sustainability 10 00160 g009
Figure 10. Modeled 2016 regional production for scenarios exploring the impacts of duty severity on global polysilicon flows, 2016.
Sustainability 10 00160 g010
Figure 11. Impact of China tariff severity on U.S. demand shares and influx into China. As the tariff severity decreases the drop in demand shares decreases and imports (i.e., influx) increase.
Sustainability 10 00160 g011
Figure 12. Relationship between severity of China import tariff on U.S. polysilicon and volume of U.S. exports to China, 2016.
Sustainability 10 00160 g012
Figure 13. Impact, in terms of demand shares and influx in to ROW, of ROW duty on China polysilicon imports.
Sustainability 10 00160 g013
Figure 14. Impact of increasing level of U.S. absorption of China polysilicon duty on demand shares and influx of U.S. polysilicon into China. Numbers on the left show 2010–2016 data; numbers on the right show 2016 data.
Sustainability 10 00160 g014
Figure 15. Impacts of increasing the relative non-price drivers, k, on polysilicon supply from different regions (demand share split and influx), 2010–2016.
Sustainability 10 00160 g015
Figure 16. Impact of variations in relative non-price drivers, k, on China demand share split among United States, China, and ROW.
Sustainability 10 00160 g016
Table 1. Changes in polysilicon demand and production distribution between 2010 and 2016 [22].
CountryDemand
20102016
Volume (million kg)Share (%)Volume (million kg)Share (%)
China53.860.9%266.468.0%
United States2.83.2%7.82.0%
Japan6.67.4%10.02.5%
ROW25.228.5%107.627.5%
CountryProduction
20102016
Volume (million kg)Share (%)Volume (million kg)Share (%)
China40.025.2%176.549.5%
South Korea15.79.9%69.819.6%
Germany30.018.9%51.514.5%
United States50.631.9%39.411.1%
ROW22.314.1%19.15.4%
Table 2. Summary of certain trade actions in solar energy supply chain.
Complainant CountrySubject CountrySubject Product(s)Anti-Dumping DutyCountervailing DutyInvestigation Initiated (Date)Measure in Force
(Date(s))
Source(s)
United StatesChinaModules from China made with third country c-Si PV cellsChina: 26.71–165.04% China: 27.64–49.79%20142015 *[31,32,38,39]
Chinac-Si PV cells made in China, regardless of where those cells are incorporated into modules.18.32–249.96%14.78–15.97%20112012 *[26,27]
European UnionChinaSolar glass17.5–75.4% on selected firms; 67.1% on all other firms3.2–17.1% on selected firms; 17.1% on all other firms20132014–2019 **[40,41]
ChinaSolar cells and modules27.3–64.9% on selected firms; 53.4% on all other firms3.5–11.5% on selected firms; 11.5% on all other firms20122013–2018[28,29,30]
ChinaU.S.Solar-grade polysilicon53.30–57% 0–2.1%20122014–2019[20,33,34]
EUSolar-grade polysilicon42% on selected firms; 14.3% on all other firms1.2% on all firms20122014–2017[20,35,36]
South KoreaSolar-grade polysilicon2.4–48.7% on selected firms; 12.3% on all other firmsNone 20122014–2019[20,33]
* The U.S. does not have an “automatic sunset” provision in its AD and CVD laws so an “end date” is not listed here. For additional information on the U.S. process for “sunset reviews”, see https://www.usitc.gov/press_room/us_sunset.htm. ** Could not confirm end date; a five-year enforcement period is typical.
Table 3. PolyMAT model scenario summary.
ScenarioImport Duty Level, 2012–2013, 2014–2019 *k, the Non-Price-Driven Component of Attractiveness Fraction of Tariff Absorbed (by Exporting Region)Scenario Goal/Question Addressed
China–USAChina–ROWUSA–ChinaUSA–ROWROW–USAROW–ChinaChina–USAChina–ROWChina–China
Base Case40%, 57%20%, 28%0%0%0%0%2.02.22.50To what degree do model results align with historical data?
Impact of Duties on Global Polysilicon Flows
No Tariff0%, 0%0%, 0%0%0%0%0%2.02.22.50What if: China had not imposed tariffs?
Reverse20%, 28%40%, 57%0%0%0%0%2.02.22.50What if: China had imposed larger tariffs on the larger source of imports?
All High Tariff40%, 57%40%, 57%0%0%0%0%2.02.22.50What if: China had imposed higher tariff on all imports?
All Low Tariff20%, 28%20%, 28%0%0%0%0%2.02.22.50What if: China had imposed lower tariff on all imports?
Middle Tariff on USA30%, 45%20%, 28%0%0%0%0%2.02.22.50What is the relationship between the severity of China import tariff and U.S. imports?
Impact of Responses to Duties on Global Polysilicon Flows
Retaliation40%, 57%20%, 28%40%, 57%0%0%20%, 28%2.02.22.50What if: U.S. and ROW retaliated with tariffs on China imports?
Fraction of Tariff Absorbed40%, 57%20%, 28%0%0%0%0%2.02.22.50.25, 0.50, 0.75What if: U.S. absorbs China’s export tariff rather than passing it on?
Impact of Non-price Drivers on Global Polysilicon Flows **
Increased influence of non-price drivers40%, 57%20%, 28%0%0%0%0%2.02.22.5 ± 50%0What if: China implements policies to increase use of domestic products (e.g., LCRs, production incentives)?
40%, 57%20%, 28%0%0%0%0%2.0 ± 50%2.22.50What if: China establishes free trade agreement with U.S. or ROW or faces domestic shortage and needs to expand imports? (This is simulated through changes to the parameters in the model logit function.)
40%, 57%20%, 28%0%0%0%0%2.02.2 ± 50%2.50
* The anticipation of new duties is assumed to impact trade two years prior to implementation of the duty, but at a lower level than the full tariff, as documented here. In addition, these scenarios assume static duties although in reality AD and CVD can be dynamic depending on administrative reviews of companies and other factors. ** Non-price drivers are captured by the “k” parameter in the PolyMAT model logit function parameter.

