Article

The Coupling Strategy Research of Urban Public Space and Traffic for Improving the Residents’ Low-Carbon Travel Accessibility: A Case Study of Hexi New City Central Area in Nanjing

School of Architecture, Nanjing Tech University, Nanjing 211800, China
*
Author to whom correspondence should be addressed.
Sustainability 2017, 9(12), 2166; https://doi.org/10.3390/su9122166
Submission received: 19 September 2017 / Revised: 3 November 2017 / Accepted: 20 November 2017 / Published: 25 November 2017
(This article belongs to the Section Sustainable Urban and Rural Development)

Abstract

:
Under the current model of advocating urban intensive development and updating built-up areas, promoting the coupling optimization of space and public transport in built-up areas is an important way to realize sustainable urban development. Apart from researching the space and accessibility of the central area in Hexi new city of Nanjing and analyzing problems from various aspects, i.e., urban land use, road network planning, bus station distribution, non-motorized traffic, and space and environment design, combining with the OD (Origin & Destination) survey, this paper further put forward the corresponding improvement strategy for the public space accessibility of different levels and optimized design of non-motorized traffic.

1. Introduction

At present, under the background of rapid urbanization in China, enhancing the coupling development of urban space intensification and accessibility of low-carbon transport has become an important part of low-carbon city design. There is a complex relationship between urban traffic and land use, in which accessibility is a key factor. It plays a significant role in determining the scale, intensity, and space distribution of urban land use [1]. To improve the utilization efficiency of urban land and space, and promote the development of urban low-carbon transport, the accessibility of residents’ traveling is a vital influencing factor. Through aggregating elasticity of individual demand, Ewing and Cervero (2010) discovered that people’s VMT (Vehicle-Miles of Travel) are mainly affected by two factors: the accessibility of the destination and variables of street network design. What is closely related to residents’ walking is the number of destination within the walking distance, while the most relevant factors to buses are the distance towards bus stations and variables of street network design [2].
In recent years, the TOD (Transit-Oriented Development) model has received widespread recognition in academia. It is believed that reasonable urban space and transport design method should be devoted to gradually turning the current plot scale model that emphasizes “Car-based” large block and wide road into a model of “small block, dense road network”. In addition, it should increase the density of public transport network and the distribution of public transport stations, while, at the same time, accelerate the construction of people-oriented blocks, which is conducive to pedestrians and bicycling. It will then improve the non-motorized traffic effectively, and reduce residents’ dependence on cars [3,4]. Therefore, many research results both in China and abroad emerged during recent years, focusing on the urban development model of advocating the people-oriented traveling. Huang studied the central area scale of many international metropolises and combined with the present situation in China, thus put forward that the reasonable block scale of urban construction should be controlled within the range of 150–200 m [3]. Qiu proposed that in a suitable-scaled eco-city, the number of intersections should reach more than 100 within one square kilometer, which is four times more than that of a traditional mode which covered only 25 intersections in one square kilometer and each block with a side length of 250 m [5]. Relevant studies in China and abroad have also confirmed that the increase of intersection density will improve the probability of residents’ walking and bus traveling [6]. Meanwhile, the vehicle kilometers per car in the area with more intersections will be lower than that of the area with fewer intersections [7]. By studying the traveling behavior of residents from blocks of different scales, Li found that over-sized block scale is bad for non-motorized traveling [8]. Shen and Li elaborated on the relationship between road network density and block scale in their paper [9]. In his book TOD in China, Calthorpe recommended values for the width of the boundary line of roads and road density at all levels [10]. As to the block scale and land use, Pan came up with the idea that the intensity of the land development depends on the accessibility of public transport, and with the combination of reasonable block scale and suitable mixed land-use, the proportion of motor vehicle travel can be reduced effectively [11]. Qian [12] and Lin [13] advocated that we should learn from international research and apply the utilization of high mixed land use, while Zheng did not support the above practice [14]. Meanwhile, Ding also thought highly mixed land use would bring about chaotic and random traffic flow [15], which is one of the factors that lead to traffic congestion [16]. When it comes to the research on accessibility of road network, Zeng believed that the absolute indices such as the length and density of the network cannot be used to compare the traffic efficiency of road network structure among different cities, and put forward a comprehensive evaluation method of relative index of urban road network [17]. The evaluation method of accessibility of TAZ (Traffic Analysis Zone), road nodes and the whole road network as well as some other relative index are described in detail in his paper “Accessibility Assessment on Structure of Street Network” [18].
Many of the above studies delved into several aspects e.g., the block scale, the degree of mixed land use, road network intensity and the road index. However, there are few studies on the interaction between road network accessibility, the above factors and people’s travel demand. When it comes to the appropriate block scale and road network model, we think we should consider the time and local conditions, and explore deeper under the guidance of the interaction and relationship between urban space and transport during the long-term urban development process. This interaction is constantly evolving by people’s use of street space, thus leading the city’s renewal and change.
Since the twenty-first Century, China’s urbanization level has accelerated, and the level of urbanization will reach 60% by 2020. Hexi new city central area in Nanjing is a typical rapidly urbanizing city, but some problems have been exposed after over ten years of construction. The rapid urban expansion and monotonous utilization of the land-use accompanied with over-sized division of block scales have led to the increase of commuting traffic. The lagging public transport distribution caused the choice of travel model to heavily depend on cars. Furthermore, travel difficulties, poor quality of life and excessive dependence on the old city have been more and more serious in Hexi. According to the statistics, the carbon emission of transportation in Nanjing has doubled in the past five years from 2008 to 2012, of which private cars account for a large proportion. In addition, the growth trend continues to rise. Thus, improving residents’ travel environment, creating comfortable low carbon travel conditions and advocating green low-carbon travel and TOD develop model have been an important measure for the government to construct low-carbon city.
Based on this background, this paper measured the absolute index of block scale, road network density, public transport distribution and land use mixing degree in Hexi new city central area of Nanjing, researched and analyzed their relevance, and the relationship between block scale and walking accessibility. From the perspective of the residents, this paper studied the OD (Origin and Destination) demands of the research area and further put forward optimization strategy that is beneficial to residents’ low-carbon travel and to accelerate the interactive development of urban space and traffic.

2. The General Situation and Status Quo of the Research Area

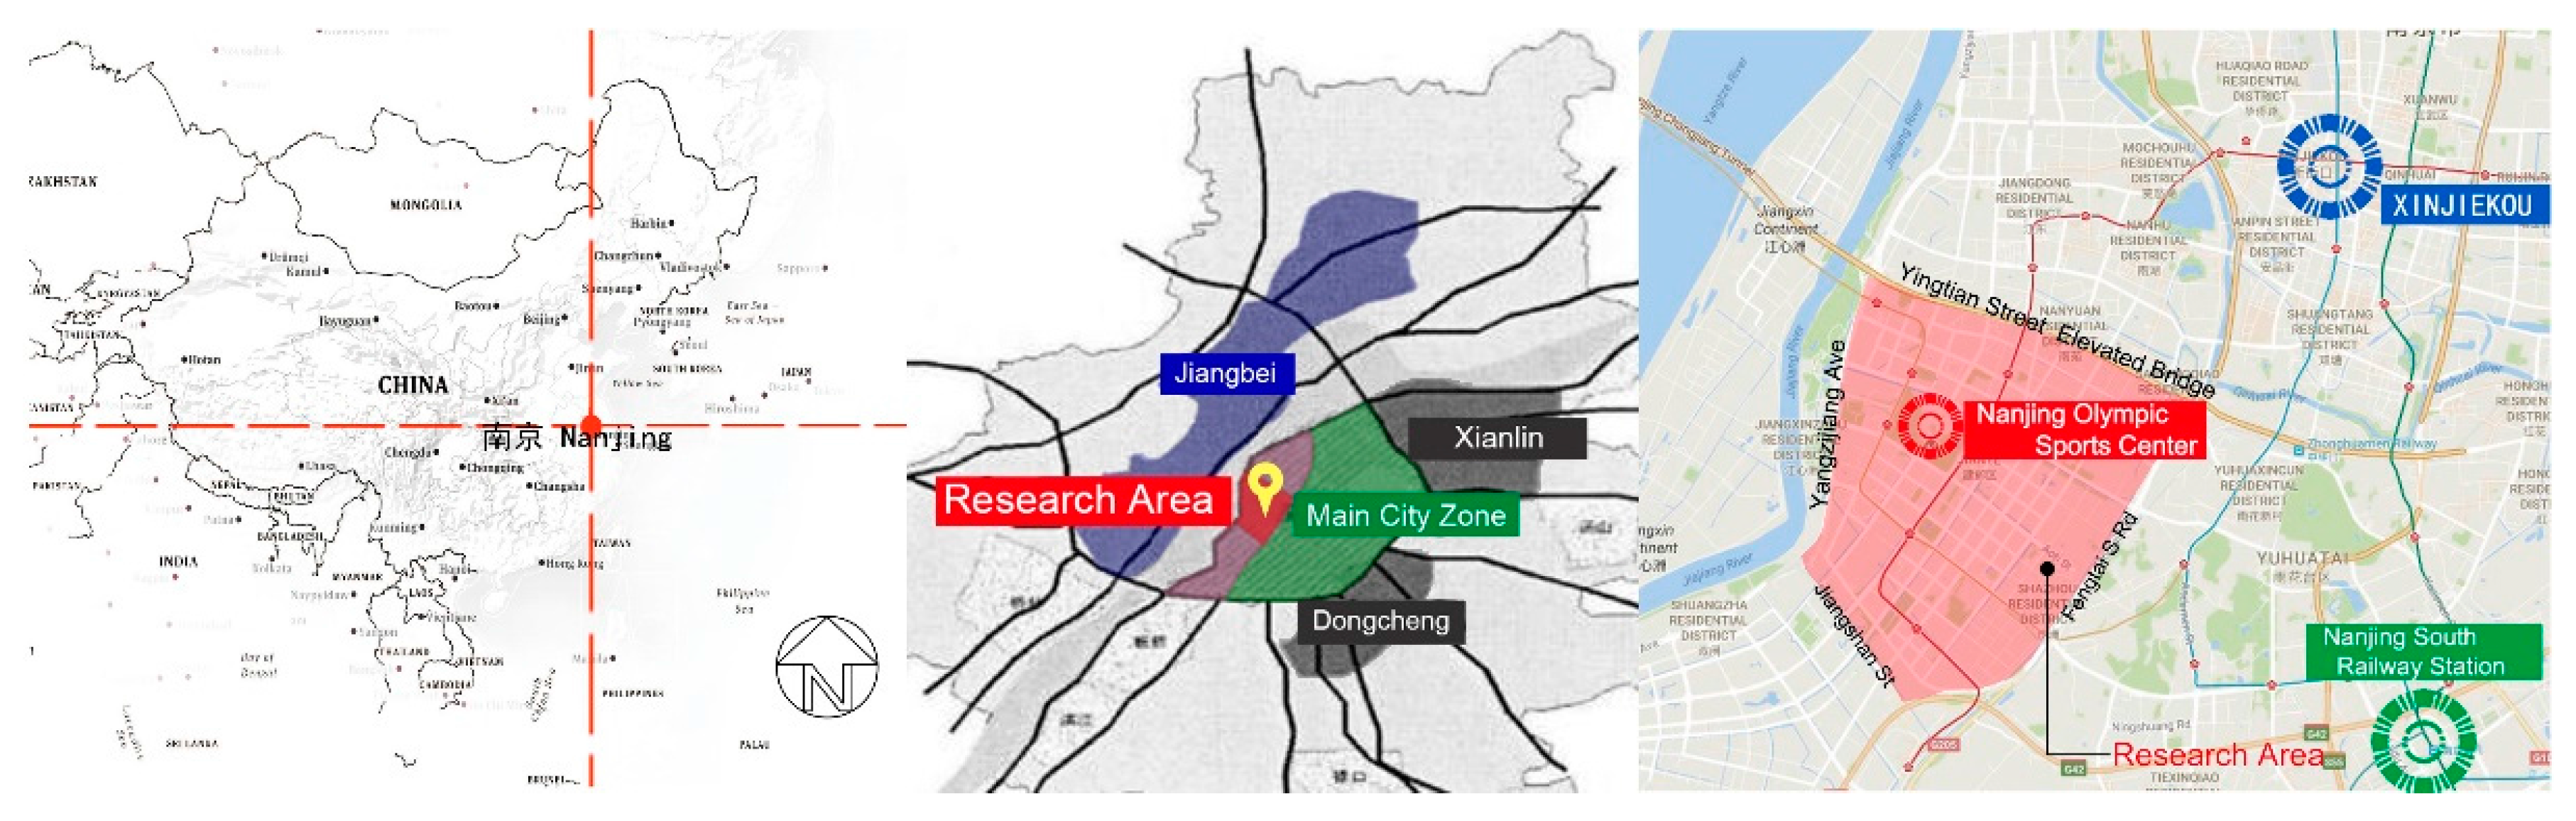
2.1. The General Situation of the Research Area

As a key construction project of Nanjing city, which is focused on “one city and three districts”, Hexi new city central area is classified into the main city zone, and it functions as a bridge between the old city areas and the new city of Jiangbei area (north of the Yangtze River), boosting the cross-Yangtze River development of Nanjing city [19]. Especially since June, 2015, when the Nanjing Jiangbei new district was approved as a national new district, the Hexi new city across the Yangtze River would play a more important role in the following development. The utilization of mixed land use is a significant factor of developing TOD. By adopting the layout of putting residential area, office area, retail stores and other urban facilities around the bus station, it could achieve the integration of long-distance public transport and pedestrian traffic alongside the streets [20], while, at the same time, better accessibility would boost regional economic development [21]. Since 2000, the central area of Hexi new city has experienced over ten years of construction and has formed a complex central zone with urban functions in finance, business, culture and sport, exhibition, and residence. The construction in the past years provided this region with relatively good urban public space system. Moreover, Hexi new city central area has formed a systematic web-based urban transport system which offers various ways of traveling, such as bus, metro, tramcar, and public bicycle. All of the above supplied a solid foundation to us to study the optimized coupling strategy for urban public transport and space.
However, as mentioned in the Introduction, the rapid urbanization also brought many problems to Hexi new city central area. Although the land use functions in this region are diverse, they are separated from each other, which leads to a relatively low land mixing degree. Even though the municipal infrastructure is good, the public transportation is complete, people’s satisfaction and utilization rate are not high, the daily trip of residents is still dominated by cars. To explore the root cause of the above problems, this paper studied Hexi new city central area from different levels.

2.2. Determination of the Absolute Index of Land Use, Road Network Density and Public Transport Distribution in Hexi New City Central Area

From November 2016 to June 2017, we carried out research to understand the current situation of Hexi new city central area. The research area is surrounded by Yingtian Street Elevated Bridge, Fengtai South Road, Jiangshan Street and the Yangtze River Avenue (Figure 1). To analyze the public space at all levels, the service conditions of mixed land use, and the accessibility of urban transport, we collected data, conducted questionnaire surveys, visited the research area and interviewed residents, and adopted the ArcGIS calculation. Then, we rationally analyzed what led to the existing problems in the target area, and put forward the corresponding optimization and improvement strategy.
Data acquisition is divided into three categories: (1) public transport distribution; (2) urban land development and utilization; and (3) demand and satisfaction survey of public transport and urban public space in Hexi new city central area.
(1)
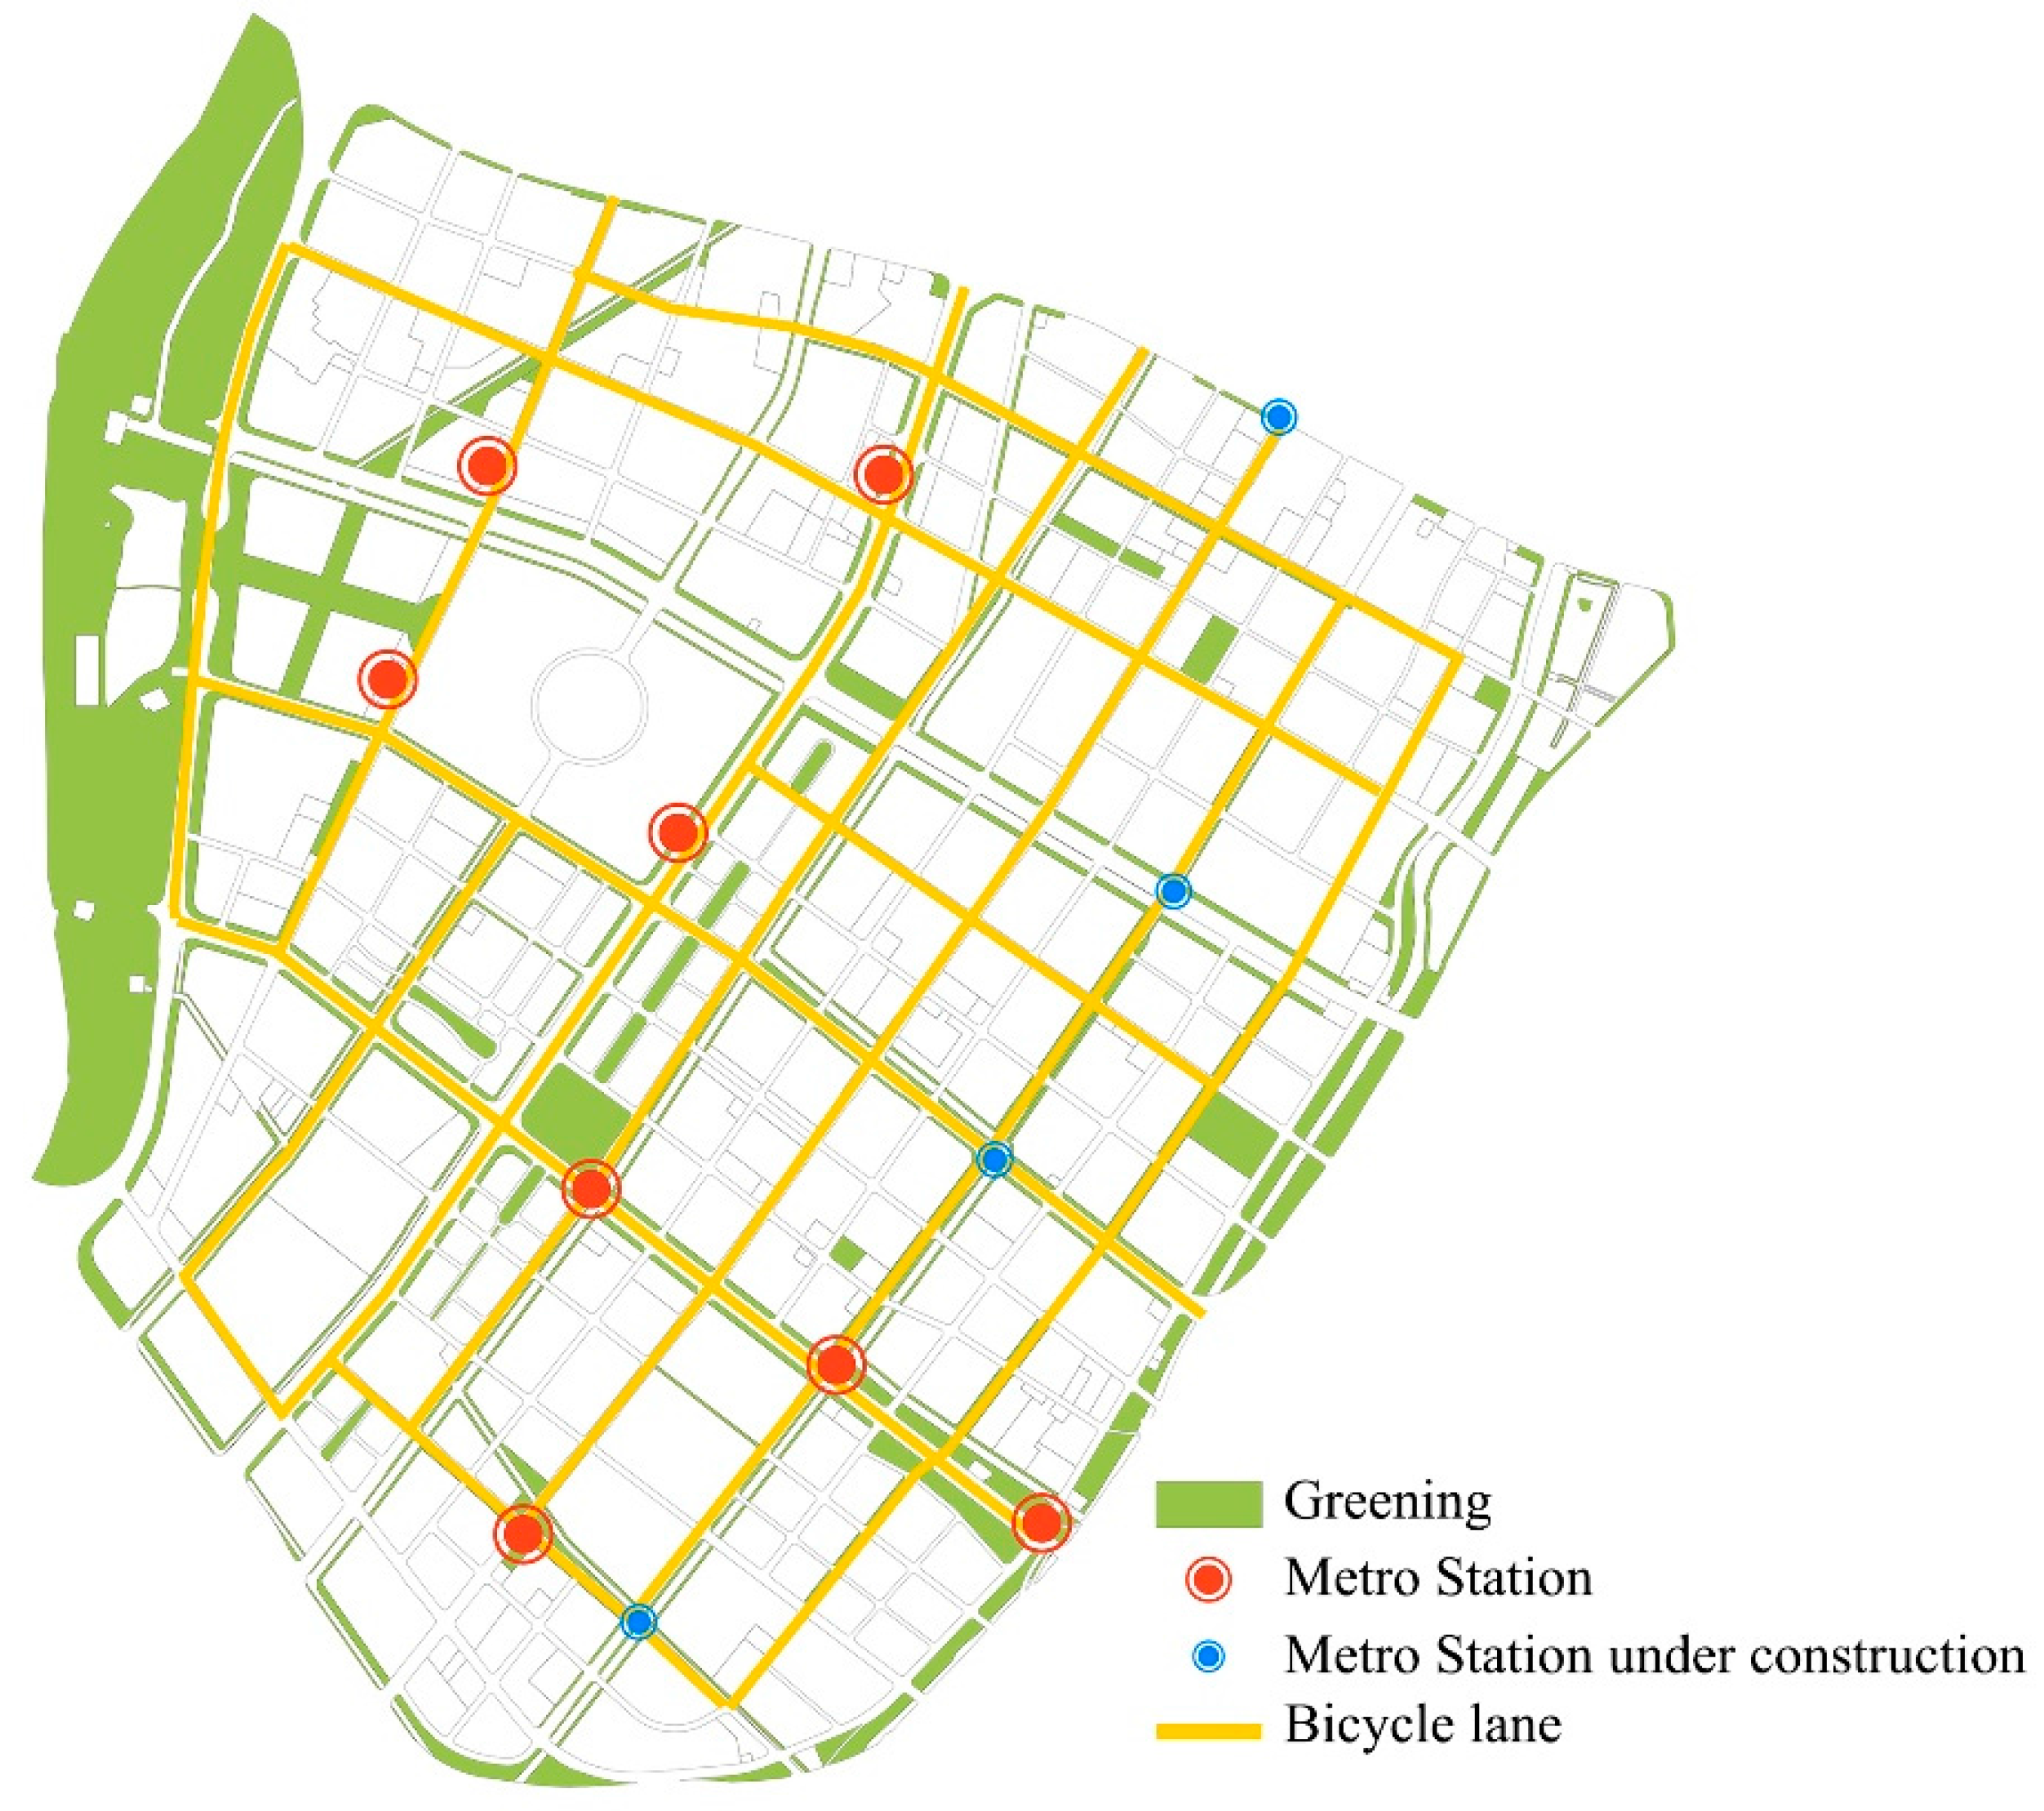
The data of the public transport distribution were collected and acquired through on-the-spot research and satellite map data.
(2)
To ensure the accuracy of the data of urban land development and utilization, we collected detailed land planning documents issued by the department of urban planning and the Ministry of Land and Resources of China, and further selected the data based on the regional situation.
(3)
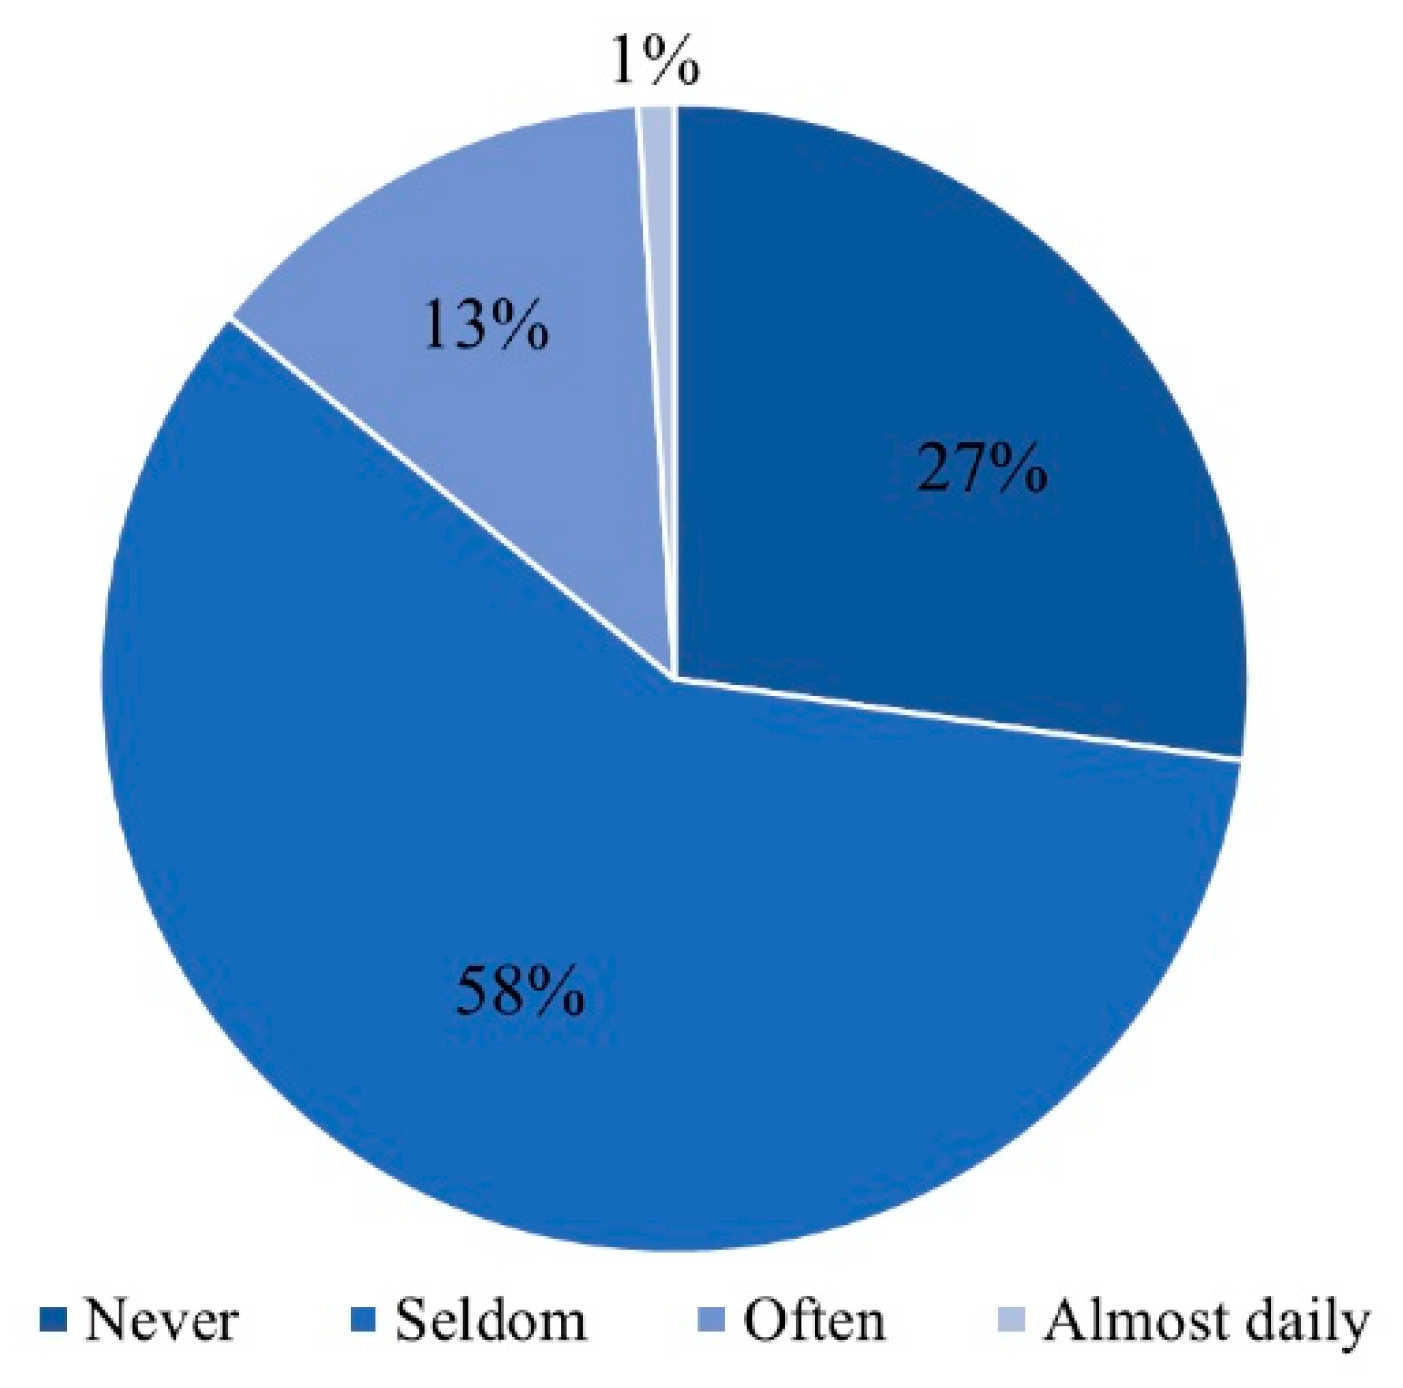
As to the demand and satisfaction survey of public transport and urban public space in Hexi new city central area, we applied the combined form of paper questionnaire and e-questionnaire to guarantee the reliability of the survey subjects.

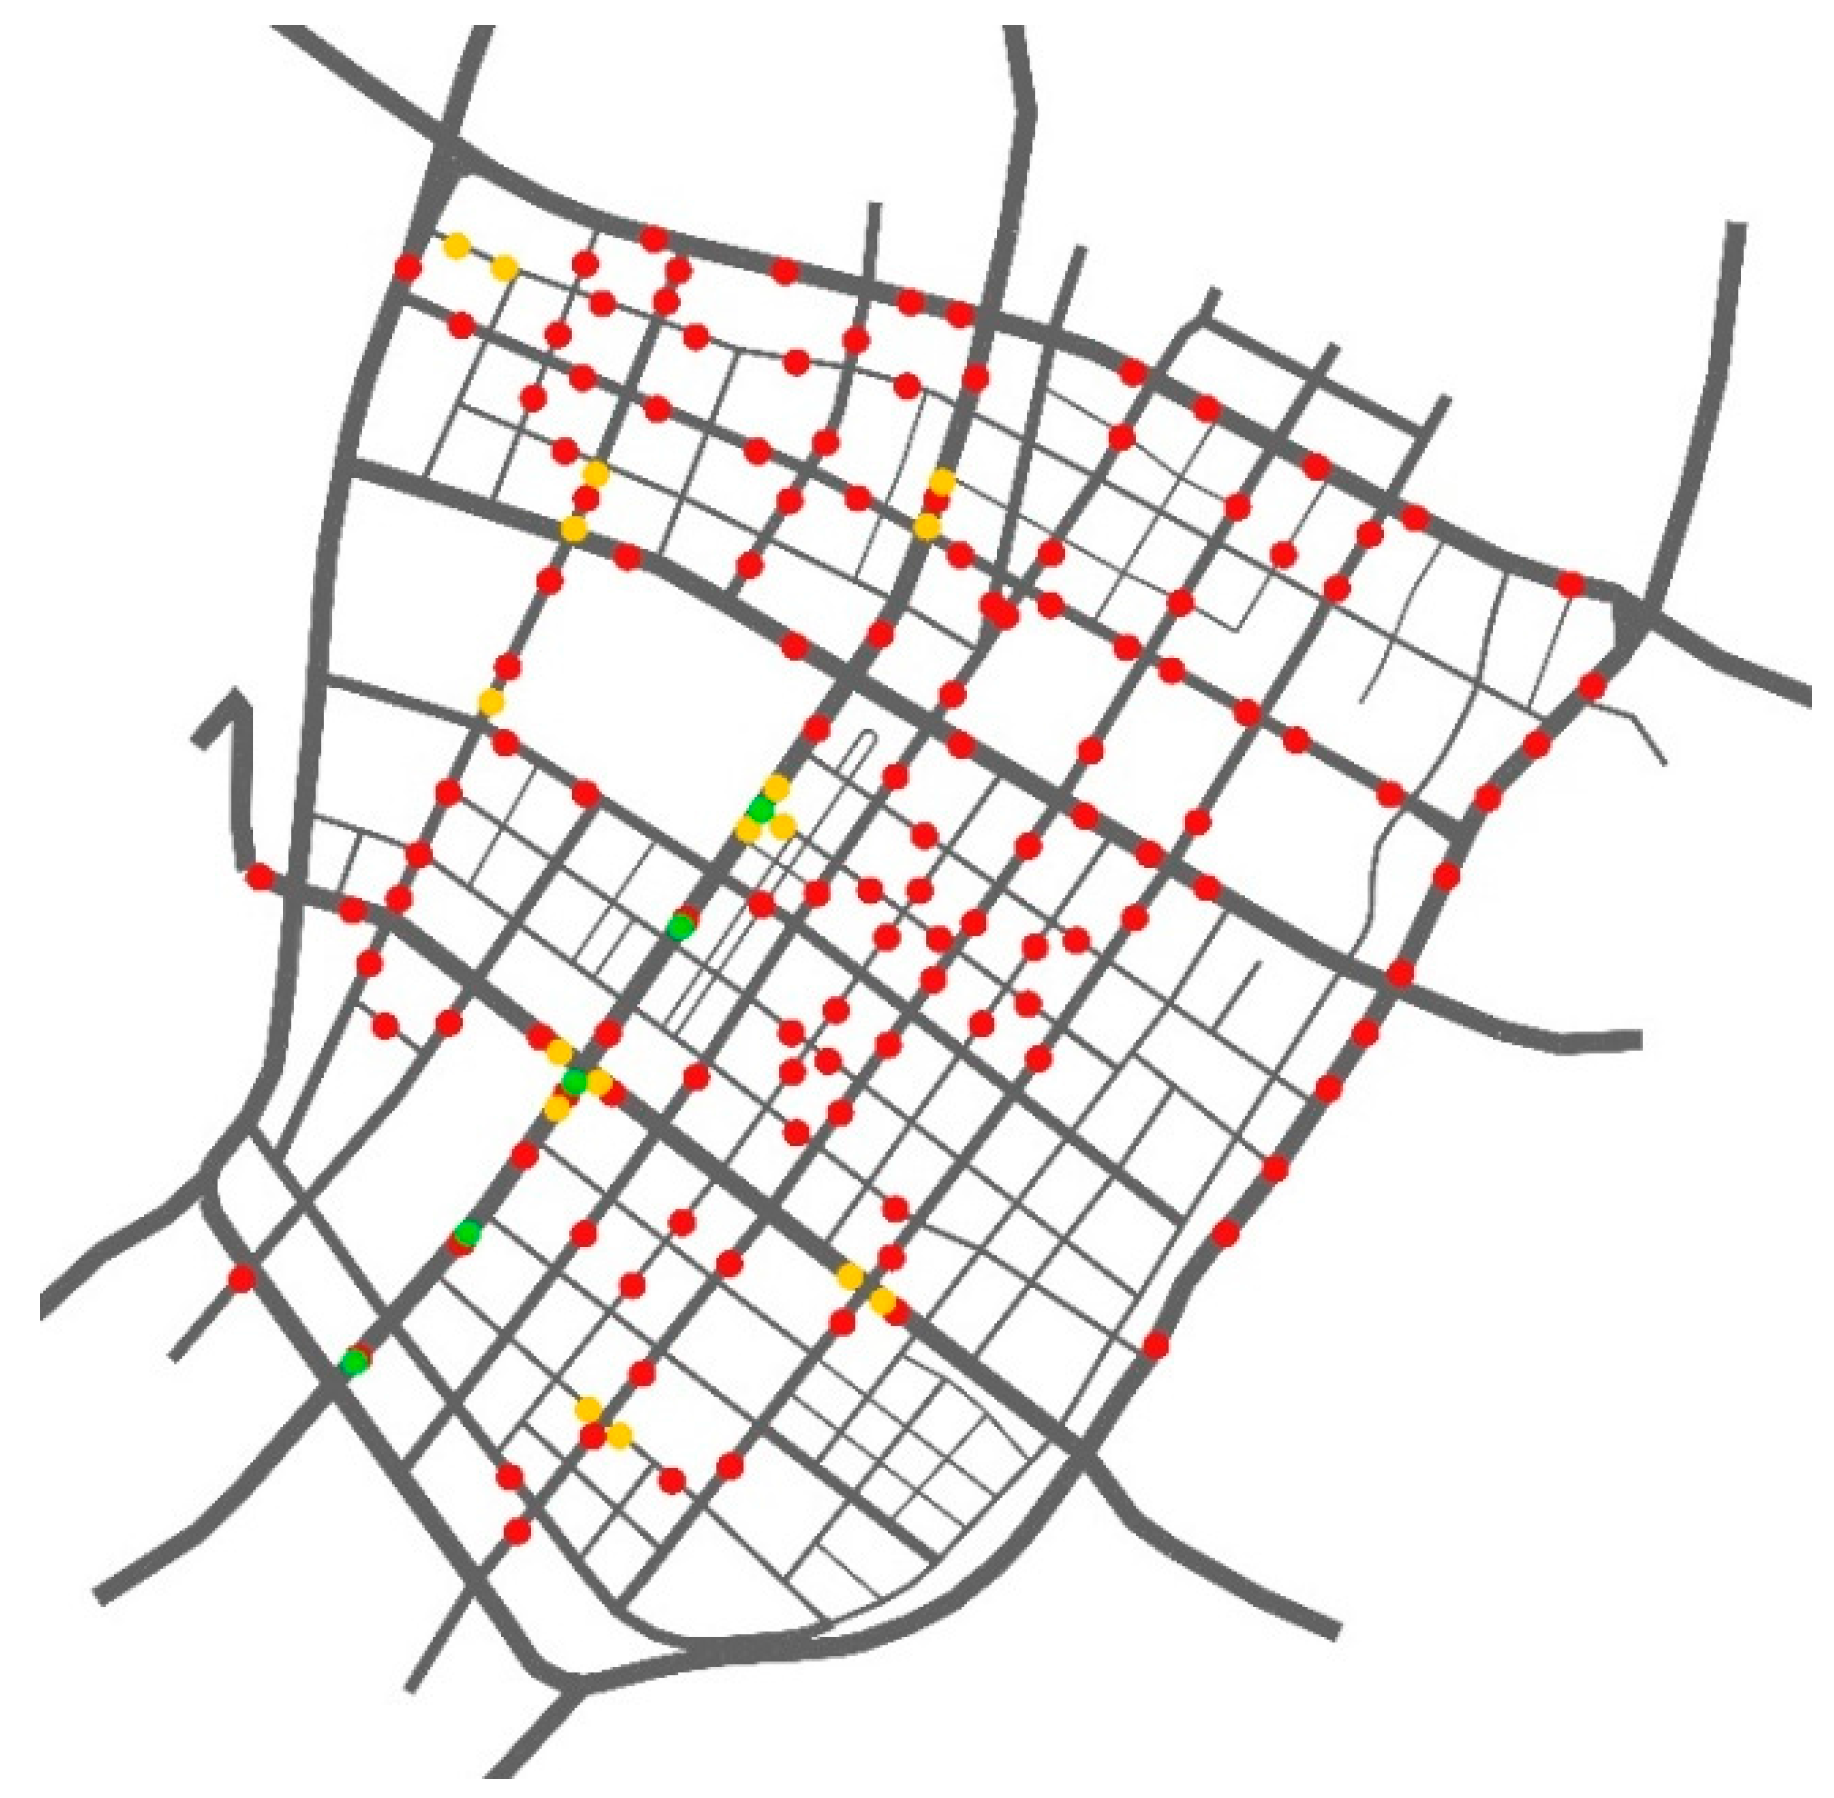
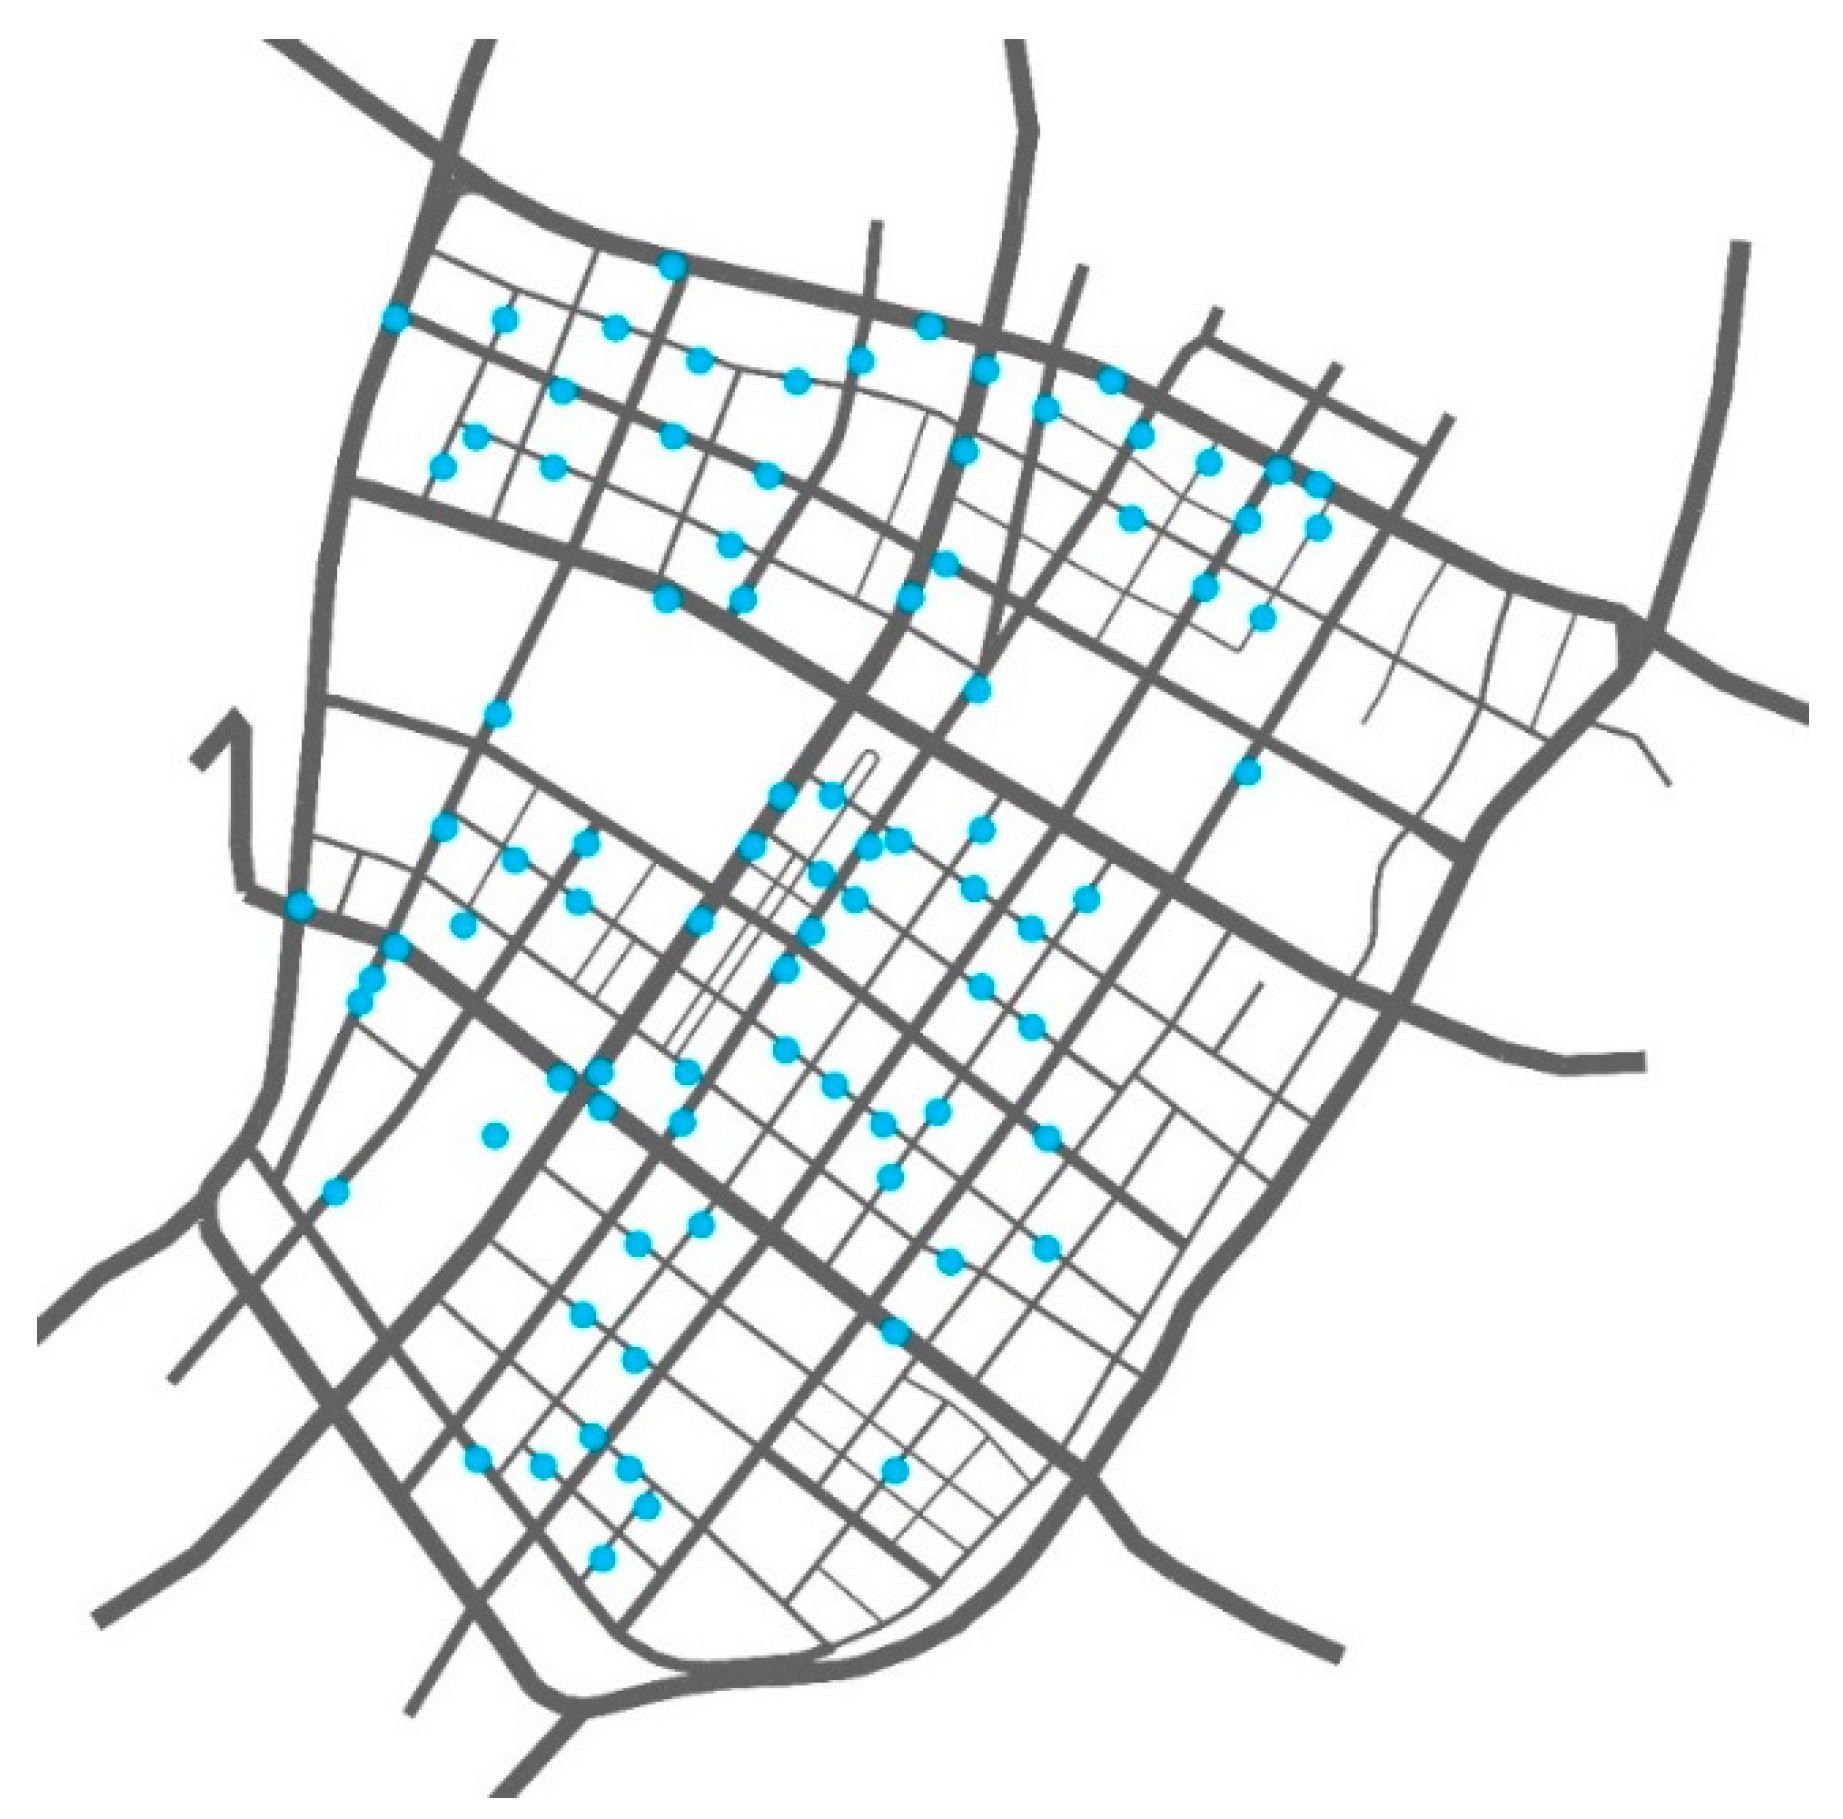
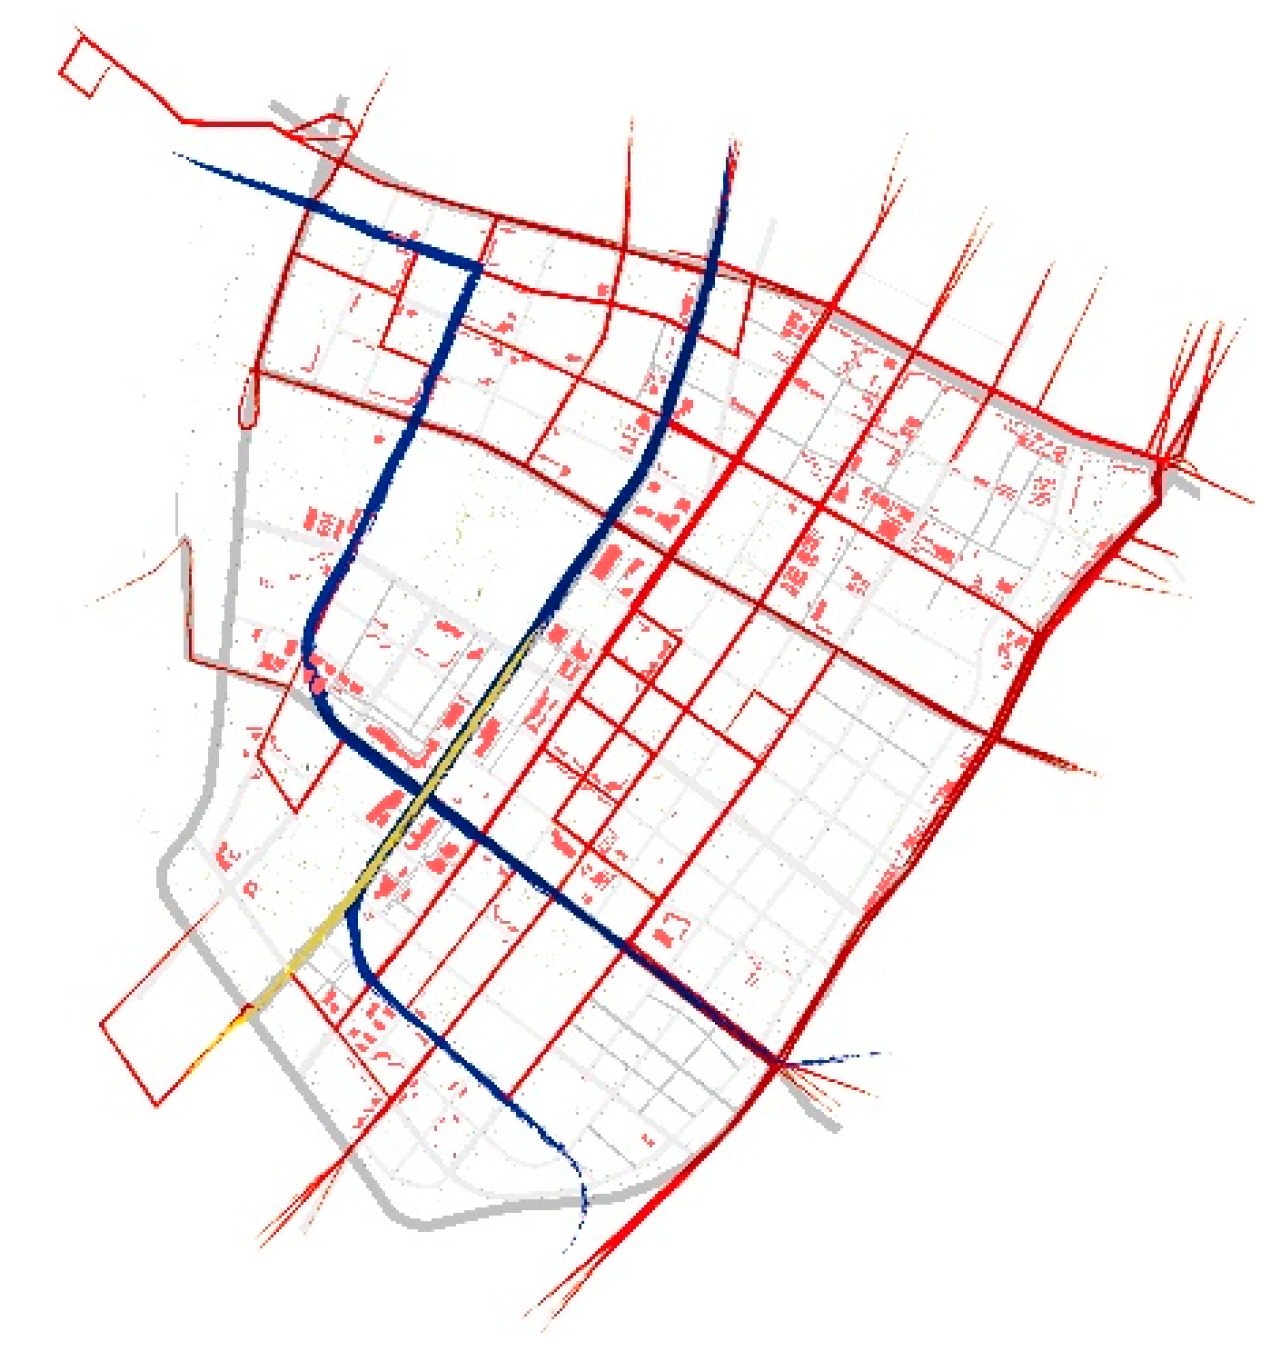
2.2.1. Status Quo of Urban Road Network

During the past fifteen years of development and construction, the planning of the Hexi new city central area includes some large-scale architecture such as the Olympic Sports Center, the Youth Olympic Sports Center, and Jiangsu Center for the Performing Arts, thus forming a plot scale model of “large block and wide road” in some of the areas. In this study, we considered the current land-use situation of Hexi new city central area , and analyzed the existing blocks and streets of the research area (statistics are listed in Table 1), from which we found that, within the research area (about 20 km2), only 8% of blocks have a side length of less than 200 m, and 49% of them have the side length reaching 200–300 m, while those over 300 m and 350 m occupy 17% and 26%, respectively, including 13 super-large blocks with over 350 m side length. Overall, roads account for 23.4% in this area, with 256 road nodes and the road network density is 6.23 km/km2, while the density of access road is 3.18 km/km2.
Based on the side length statistics, we drew the distribution of blocks with different scales (Figure 2), from which we can see that the over-sized division of block scales reduced the density of urban road network, which is bad for the formation of the non-motorized travel system. Furthermore, with the rapid process of urbanization in recent years more and more land is developed for monotonous utilization in the city. All these disadvantages lead to the residents’ low efficiency of traveling, and affect the construction of a low-carbon city as well.

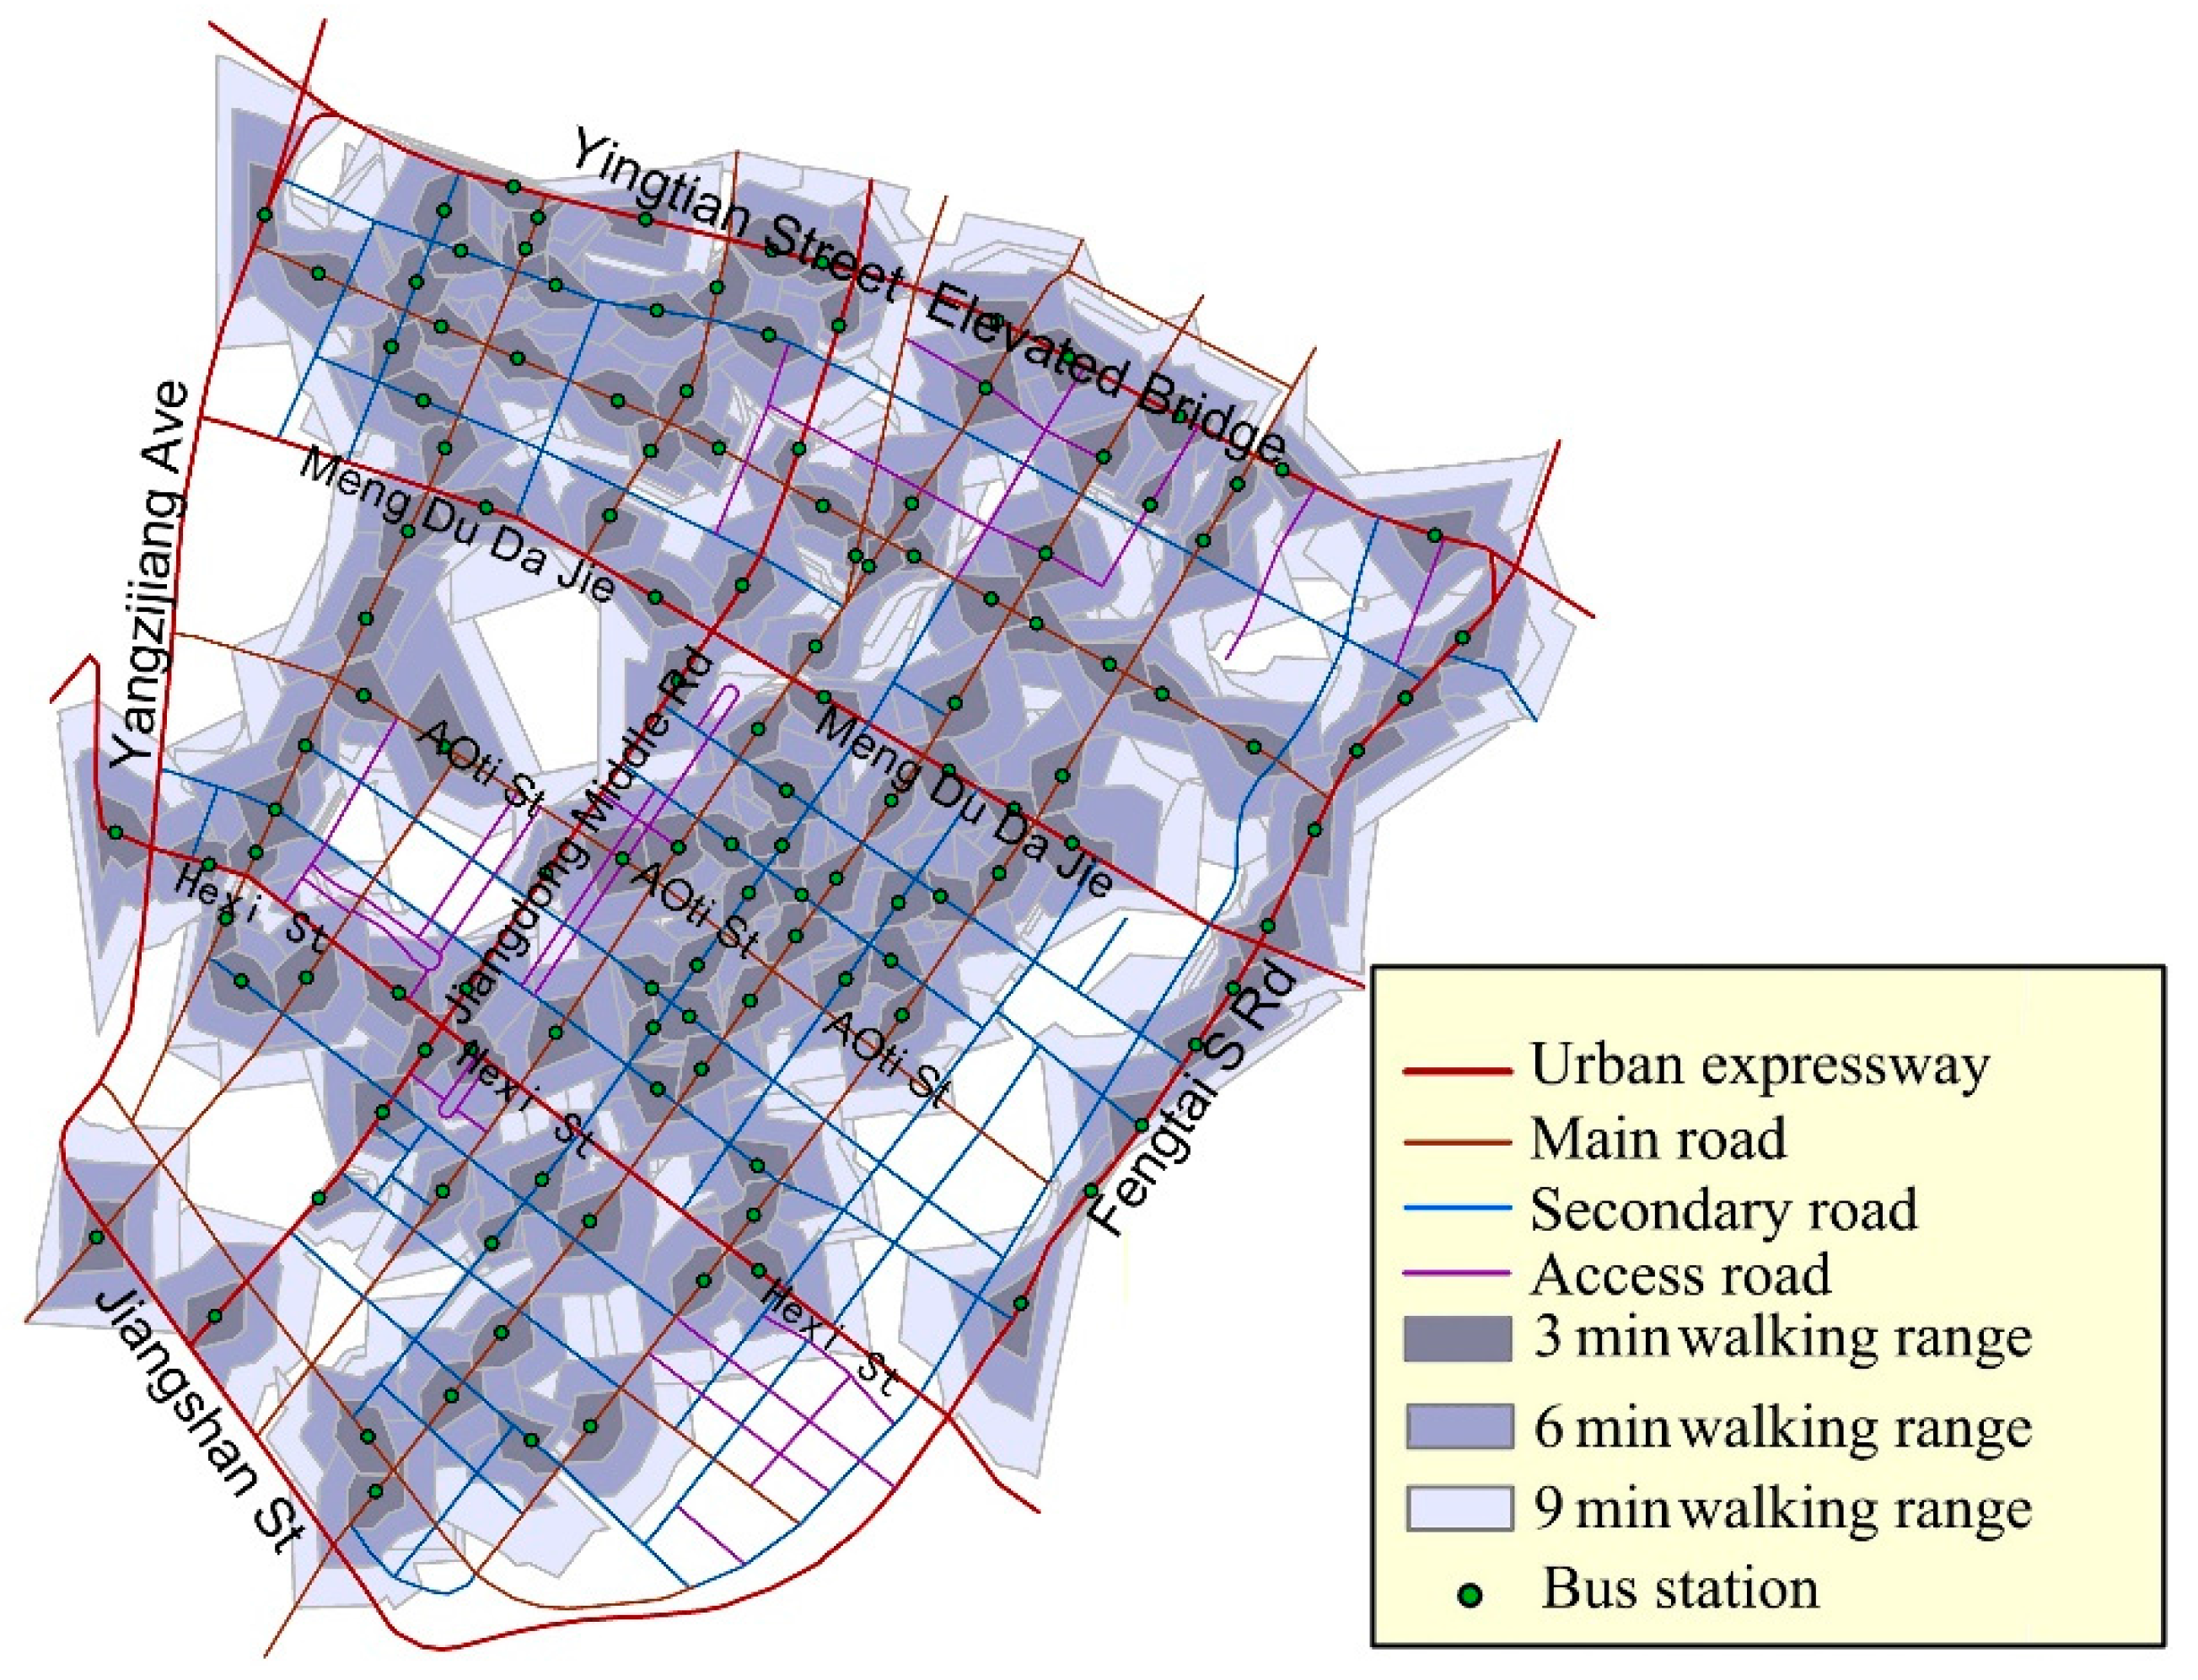
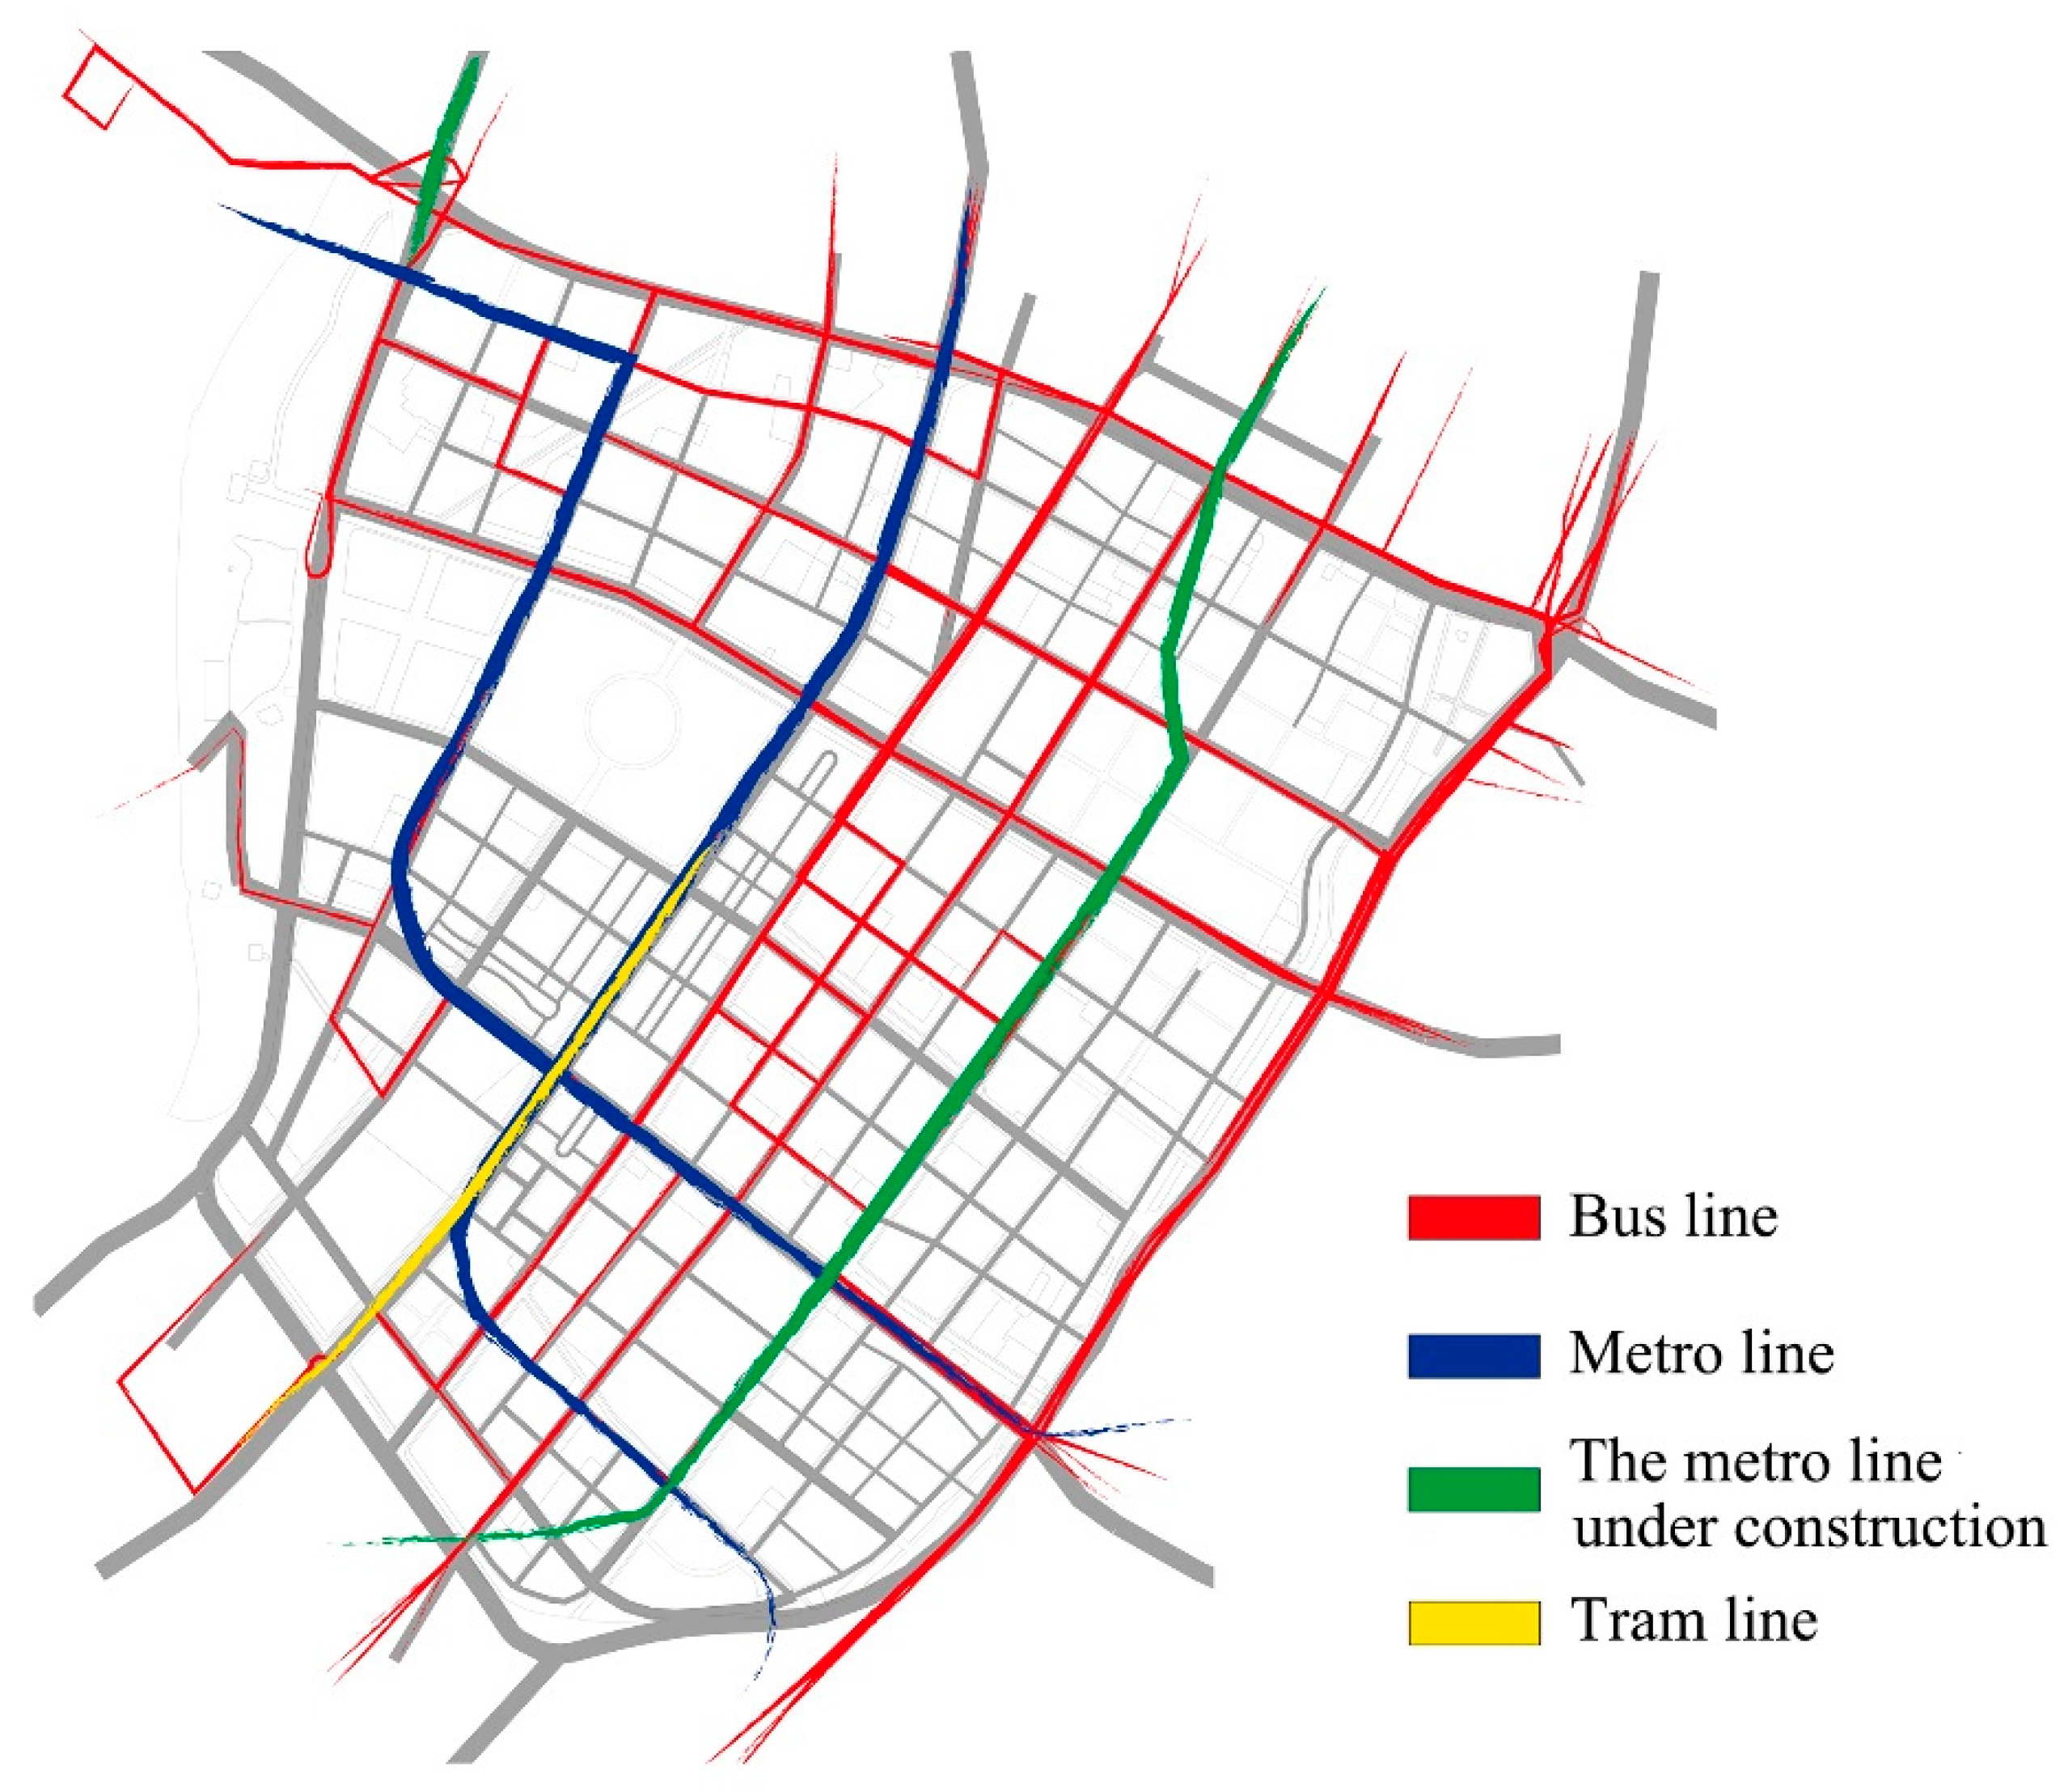
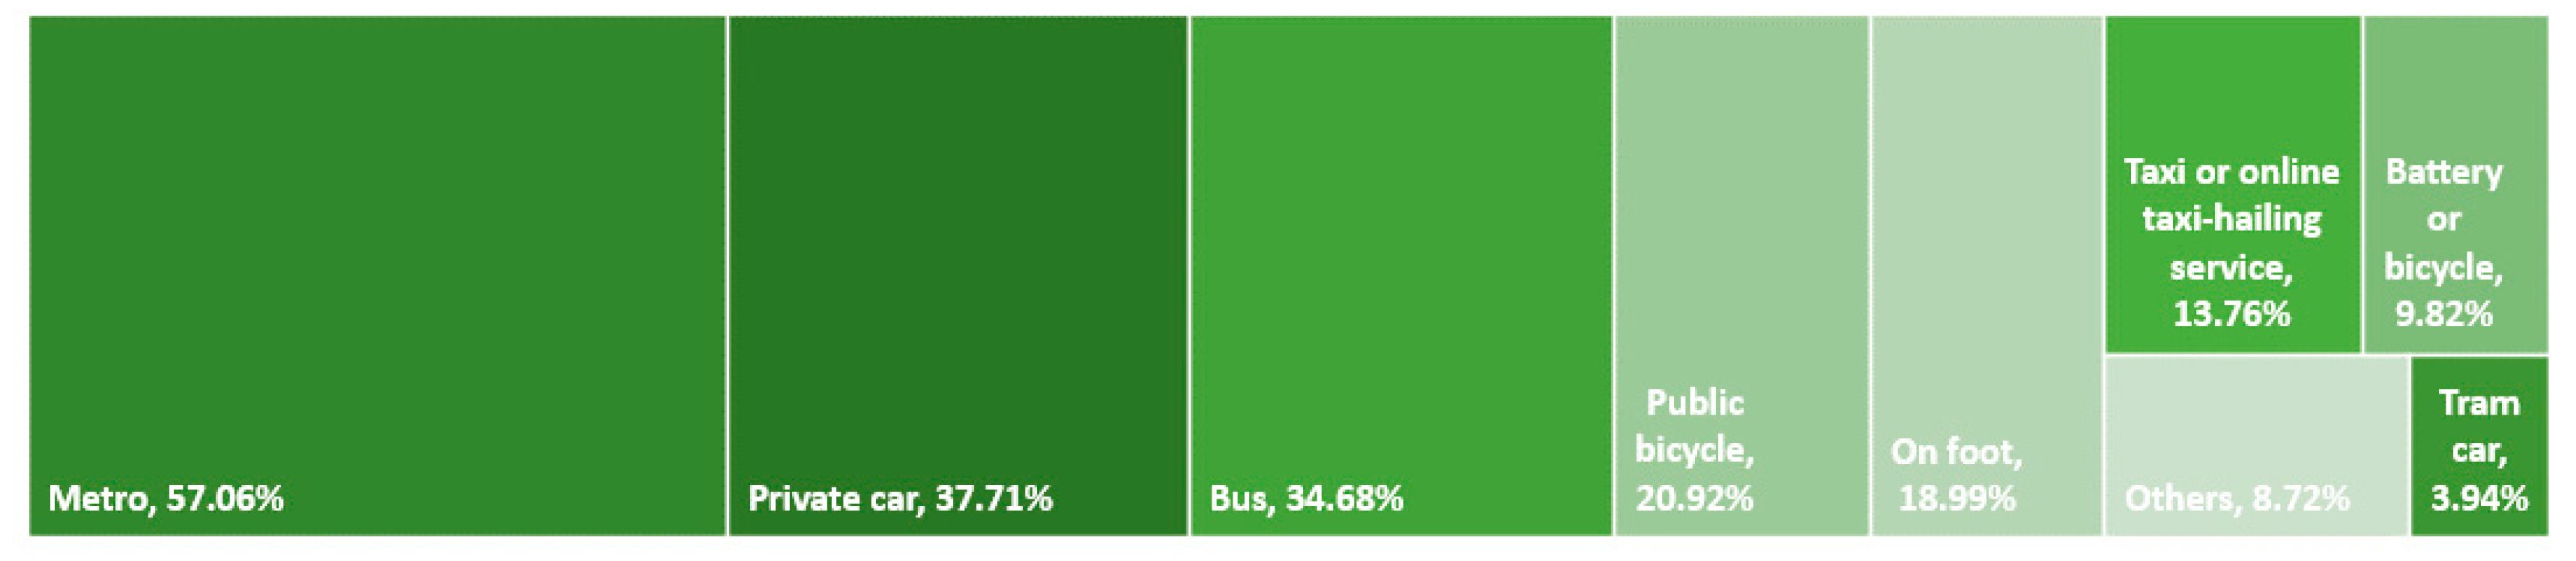
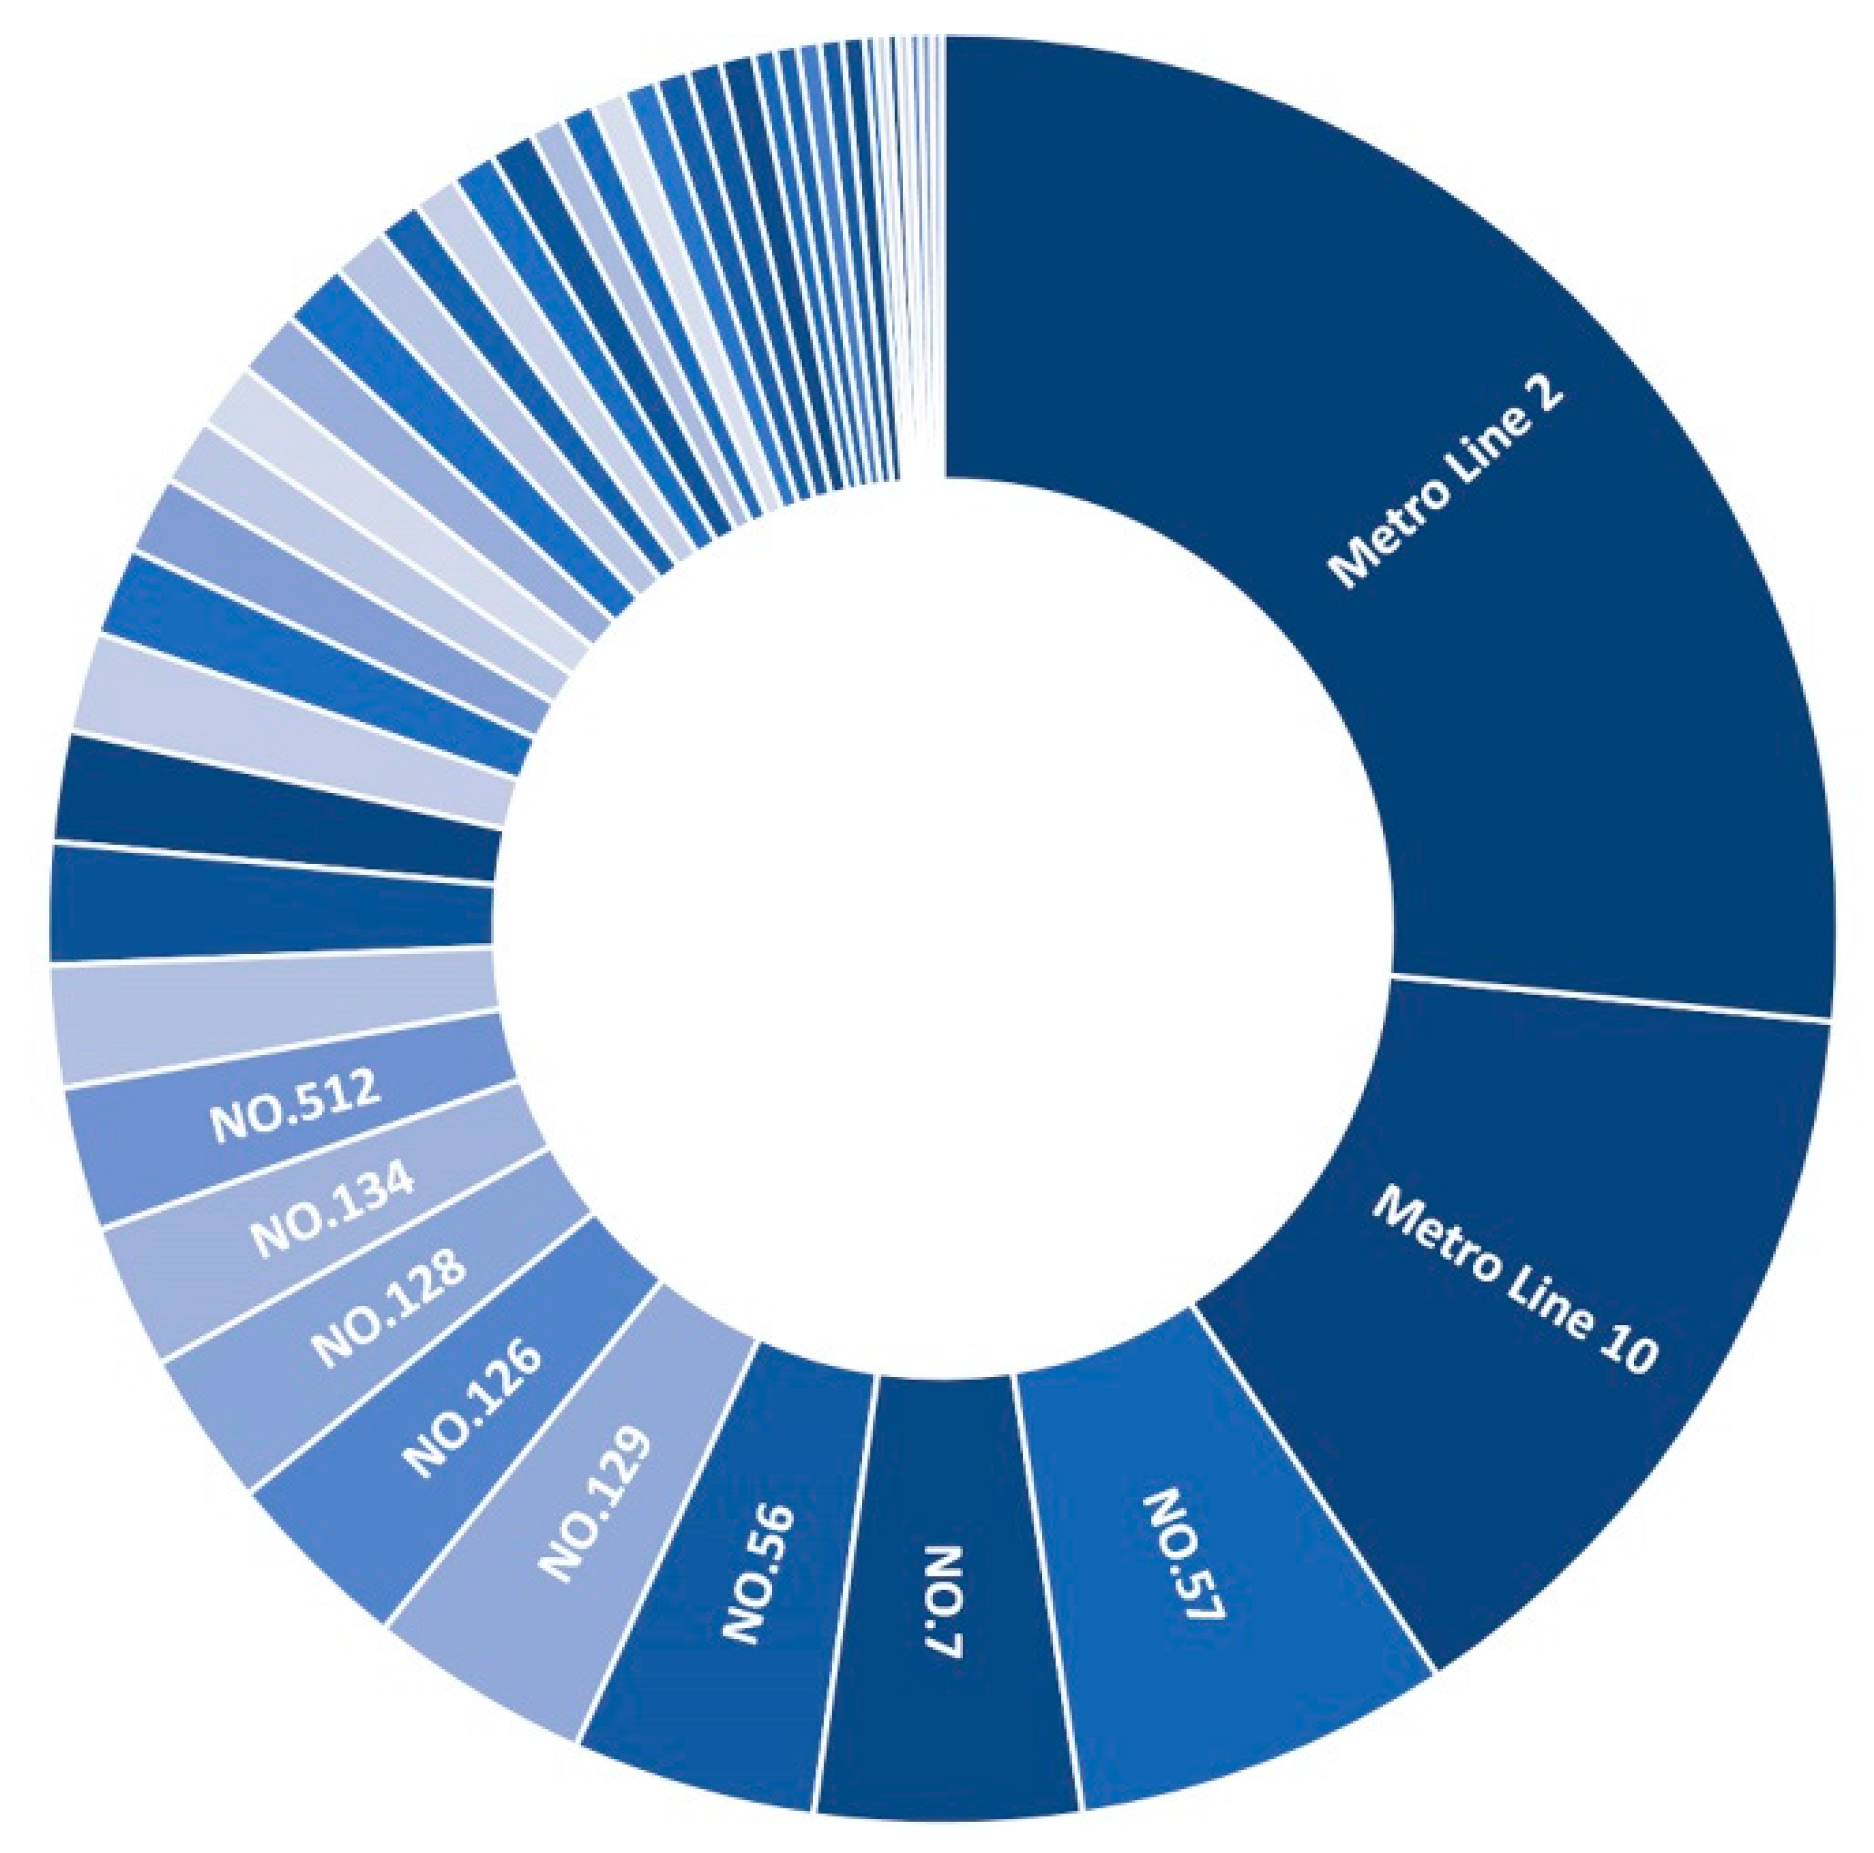
2.2.2. The Status Quo of Public Transport

As the core part of TOD development model, public transport plays a significant role in constructing and developing a low-carbon city. Table 2 shows the current situation and the line planning of public transport in Hexi new city central area. In Figure 3, Figure 4 and Figure 5, we can see that the overall distribution is shaped like the number “7”, with more lines in the northern part and fewer lines in the southern, and too many repeated placements in the axial part.
During the past planning and development, Hexi new city central area has formed a distinct hierarchical road structure of urban expressway, main and secondary road, and access road. Affected by the structure, for one thing, the bus lines and stations were mainly distributed alongside the main road, with lower coverage and higher repeated rate, which do harm to people’s enthusiasm for public transport travel. For another, the wide road scale reduces the safety of non-motorized travel, which indirectly leads to the increase in the proportion of car travel.

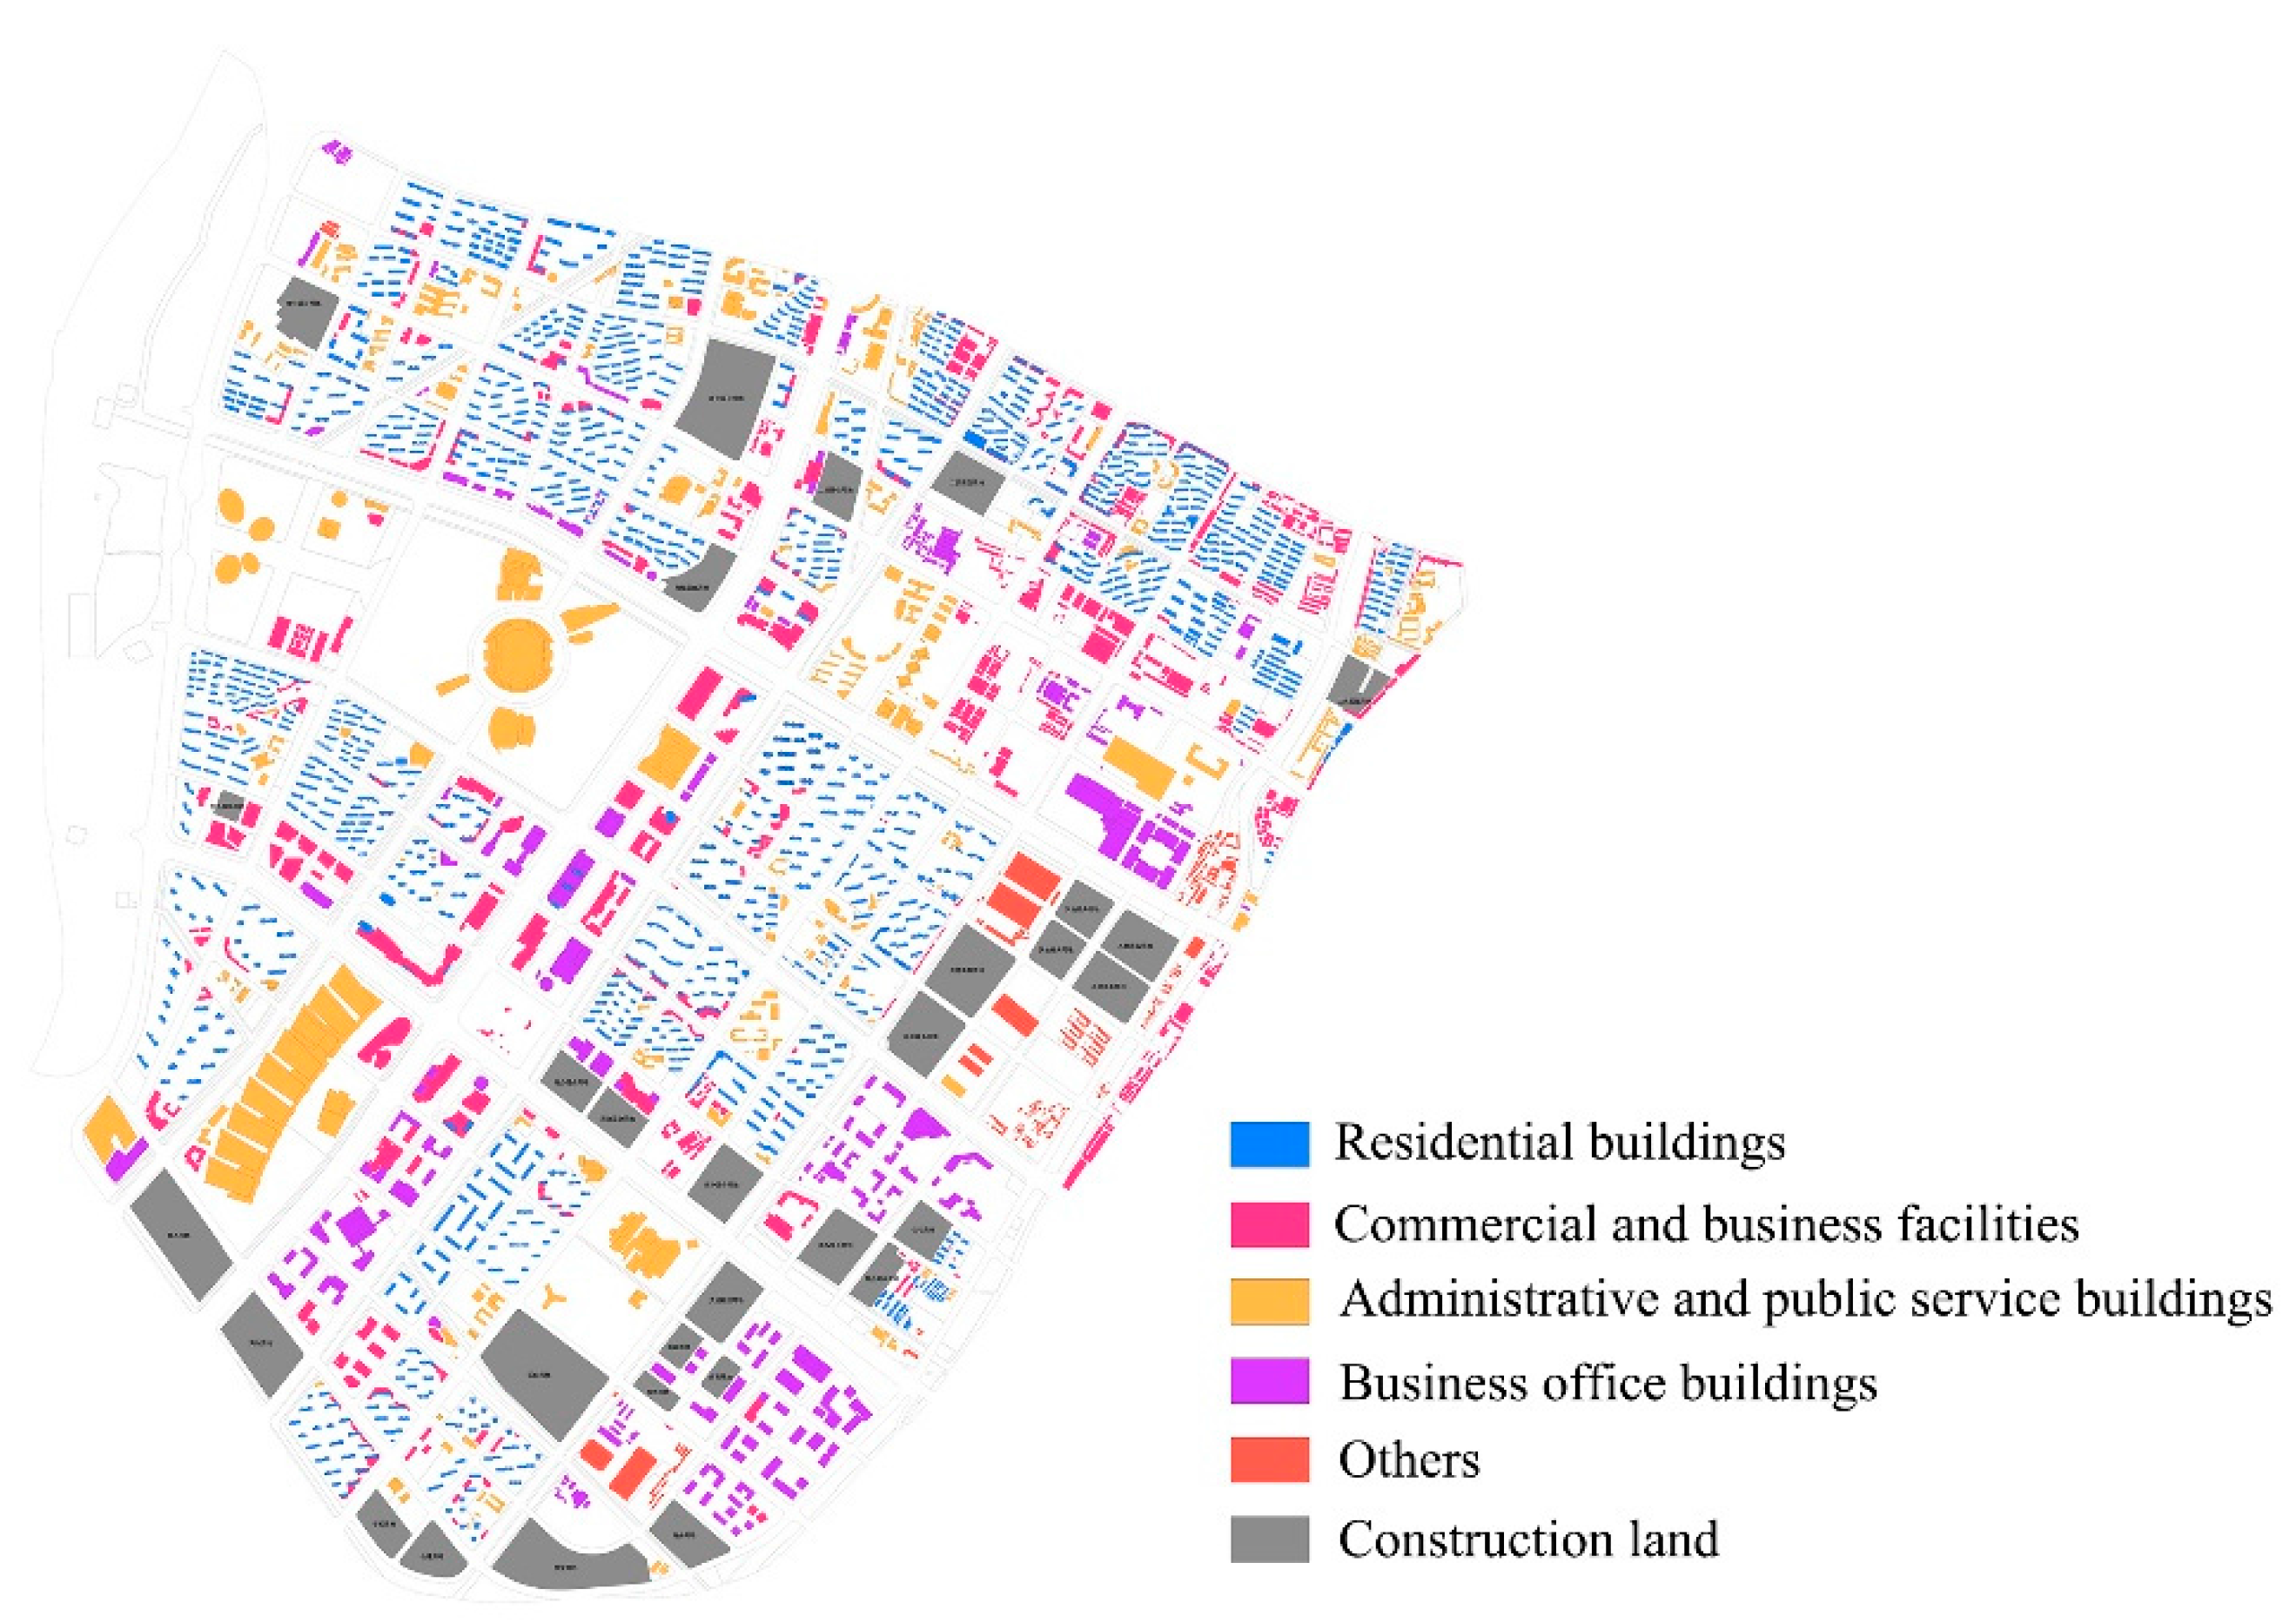
2.2.3. The Status Quo of Land Use

The existing studies have shown that the mixed community characterized by land use diversity and the community with single function have a totally different impact on the demand for car traffic and carbon emission [22]. The results of Huang and Du showed that the higher the land mixing degree is, the lower the carbon emission is [23]. Therefore, land use characteristics have an important influence on the construction of low-carbon travel atmosphere and the construction of low-carbon city. To truly and accurately reflect the current situation of land use in this area, we conducted on-the-spot research on the existing architectures in Hexi new city central area. In the early stage of the research, we separated the target region into 29 TAZs (Traffic Analysis Zone: from No. 1 to No. 29); outside the region, we chose 11 regions, from No. 30 to No. 40 (Figure 6), according to road distribution conditions (the roads that enter the target region). In addition, according to the classification methods of land-use nature, this paper classified the buildings in the 29 TAZs into five types: residential buildings, administrative and public service buildings, commercial and business facilities, business office buildings and others (Figure 7).
The degree of mixed land use in one city can reflect its intensification situation. In calculating the mixed degree of each TAZ, this paper selected data from the first four types of buildings (residential buildings, administrative and public service buildings, commercial and business facilities, and business office buildings), and calculated as follows [24,25,26]:
L a n d u s e m i x i = K = 1 K P k , i   ln ( P k , i ) ln ( K , i )
where K stands for the number of land-use types of TAZ i; and Pk,i represents the construction area proportion of Kth land-use type in TAZ i. The value interval of Landusemixi is between 0 and 1, and the size of this number reflects the mixed degree of land-use functions. The larger the number is, the higher mixed degree it has, and it also means more balanced distribution of the functions in this TAZ. The smaller number reflects the monotonous land use and lower degree of mixed land use [26]. In the calculation, the occurrence of incomplete land-use types is inevitable. To get an effective contrast, we compared the mixed degree of land use from different levels (assuming the degree is 0 when there is only one land-use type) (Table 3).
With all the four types, the mixed degree of the eight TAZs that have more buildings for commercial and business facilities (No. 17, No. 10, No. 6, No. 28, No. 23, No. 21, No. 12, and No. 7) are more than 0.6. In Figure 8, which stacks the distribution of the commercial and business facilities with the distribution of public transport, we can find that the two are almost concomitant, exhibiting the same shape of “7” in this area. Meanwhile, the areas with more commercial and business facilities have higher mixed degree, which indicates that the layout of commercial and business facilities has an interactive relationship with the arrangement of public transport. The existence of this relationship shows that the arrangement of public transport will to some extent influence the land-use type of its surrounding areas, and this kind of influence will be displayed in the design of architectures. For instance, architects will choose to design commercial and business facilities on the ground floor in the area with convenient public transport. With more and more impact factors stacking together, the mixed degree will be affected gradually, which expresses that the existence of non-motorized traffic is beneficial to improve the mixed degree.

3. Analysis of the Main Existing Problems in the Research Area from the Perspective of Travel Behavior

From the above status quo, we can find the car-oriented travel model in the central area of Hexi new city has caused various problems to urban planning and development: the over-sized block scale, monotonous land-use type, and uneven arrangement of public transport. These are common problems in the construction of some emerging cities in China. In the process of promoting the combined model of emphasizing on both new area construction and old city renewal, it is of great importance to find and solve the related problems in time to accelerate the sustainable development of urban space. Recently, scholars have carried out many detailed researches on the block scale, road network planning and road design, this paper will not repeat the details. From the perspective of residents’ travel behavior, we tried to conduct practical research on the public transport use status in built-up areas, residents’ travel demand and the accessibility of low-carbon travel, and set foundation for putting forward suitable optimization strategy in the follow-up study.

3.1. Study on the Relationship between the Selection of Travel Mode and Land Use

A variety of factors can influence people’s selection of travel mode, including travelers’ personal economic ability, physical condition, weather and other uncertainties; apart from some relatively certain factors, such as the convenience of the surrounding public transport layout and the utilization conditions of the land-use development. Figure 9 shows that of all the existing travel modes, car and metro are the main travel ways, while tramcar and bus occupy low proportion, and lower selection on walking. This phenomenon is closely related to the block scale of Hexi new city central area: the over-sized block scale causes a low efficiency of non-motorized traffic, which to a certain extent affects the traffic accessibility and is not conducive to form a non-motorized traffic system. Meanwhile, the segregated function layout in the research area formed a boundary among blocks, which brought long commuting time for travelers. Besides, the separation of block functions reduces the vitality in the city, while the long walking distance is also a psychological obstruction to the occurrence of social behavior [27].
Figure 10 shows that compared with other factors, residents have higher demand on the layout of bus stations and commercial and business facilities. That means the arrangement of bus lines and the land use along the lines will influence residents’ choices of travel vehicles. In other words, the destinations of their travel determine their travel paths, while a convenient bus line in the path will determine travelers’ choice of travel mode. Therefore, arranging public transport lines that couple with travelers’ path helps guide the residents to choose low-carbon travel mode. However, according to the on-the-spot research, we found that residents were not satisfied with the current bus lines, so the problem of “where and how” remained to be discussed.
In their daily commuting, the job-housing distance affects residents’ travel behavior to a great extent, which often happens trans-regionally, namely the flow of people inward and outward the area. Mercado [24] and Maoh [28] thought the high mixed development of the commercial and residential areas would increase the employment rate in the area. According to the study results of Dang, the street with relatively high degree of land use mixing is beneficial to reduce the probability of the separation between occupation and residence [26]. Thus, we supposed that the daily travel behavior inside the region was strongly affected by the distance between the commercial area and residential area, and this distance was the leading factor that influenced the occurrence of the travel behavior inside the region. Through improving the current situation of monotonous land-use type and the utilization of land-use intensification, and optimizing the layout of public transport, we can effectively guide the low-carbon travel and improve residents’ travel efficiency. We provide a specific explanation for the assumption in Section 3.2.
The increase of the mixed degree is hard to achieve at once, which further requires that the existing public transport system in the region should establish a rapid connection between residences and public service, commercial and business facilities. At the same time, the government should make pointed references to strengthen the development and high-mixed utilization of those blocks with single land-use nature. The adding of access roads can to some extent gather more people along the road and enhance the vitality, which will attract some commercial and public service functions like restaurants and entertainment service to improve the mixed degree of land use. However, a dense road network does not definitely mean a better situation, and the addition of access road should be reasonable. As for the area with such large public architectures, the reasonable increase of access road is vital importance. The investigation of daily travel habits such as travel purpose, travel mode and route choice can help us better understand which TAZ needs to be optimized and which area needs to add access roads.

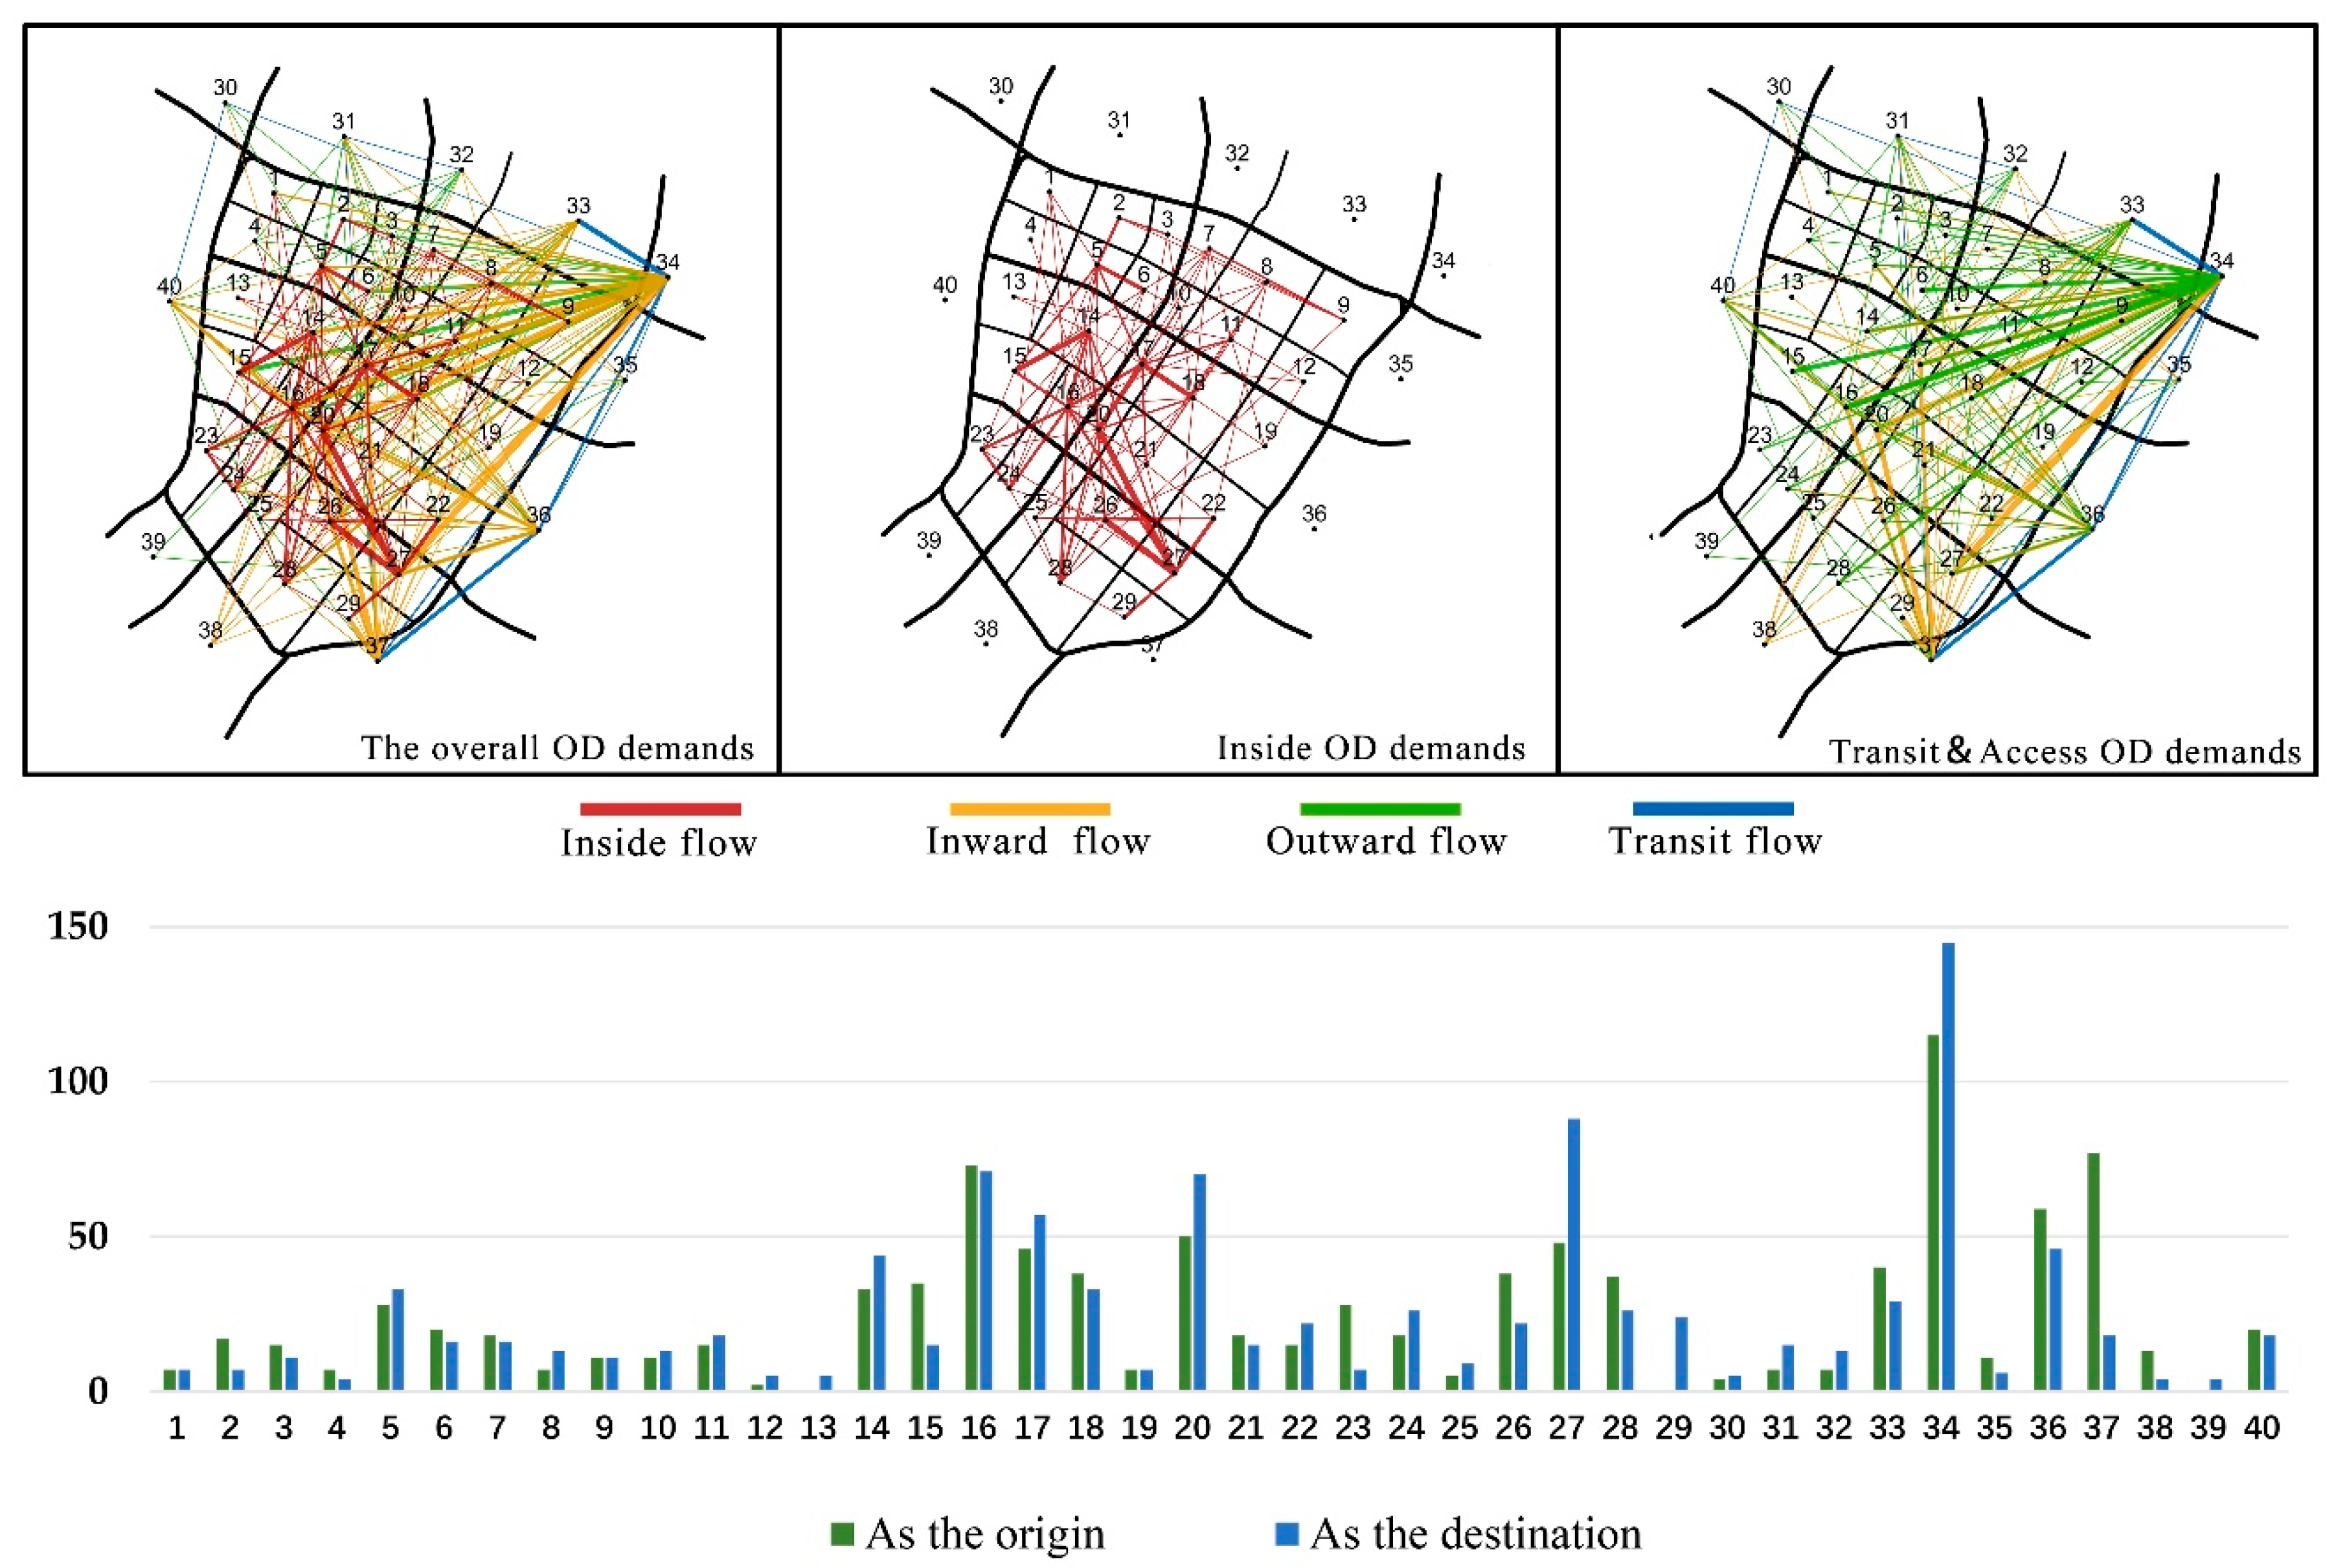
3.2. Demand Research on Residents’ Travel Based on OD Survey

The above study shows there is a mutual influence relationship between the layout of public transport and the land-use nature along the lines. To shorten the distance between occupation and residence and that between commercial area and residential area, to guide the low-carbon travel and improve travel efficiency, we conducted preliminary analysis on residents’ way of choosing buses. As displayed in Figure 11, the frequent bus shifts represent that there are more activities happened along the bus lines.
We have mentioned the destination of residents’ travel will influence their travel path and mode, while their destinations remain uncertain. In the simulation analysis, we assumed an ideal state which showed the destinations can be reached within 3 min, 6 min, and 9 min from the existing public transport stations (Figure 12), and combined with the results from Section 2.2.2, we found that the “7”-shaped bus layout reduced the accessibility of public transports in other regions. For example, in Figure 12, there is almost no bus coverage in the southern part of the Aoti street and the bottom-right area.
It is obvious that the better state is that the road in the figure can basically be covered by the 9 min walking range, but the state itself is a waste of resources, as there is no necessary to distribute high density bus stops in some areas. The distribution of bus lines should also be consistent with the residents’ travel habits. To better understand residents’ path choice and the daily flow habits in a larger range, we did an OD demand survey in this area and provided the basis for the follow-up optimization solutions. There are altogether 1090 valid samples, the inside flow within the region accounts for 39.47%, and the transit and access flow occupy 60.53%. The distribution result of OD demand is shown in Figure 13.
The line in the Figure 13 represents the daily travel behavior from one TAZ to another, and the thicker the line is, the more frequent the daily travel between the two TAZ is. The red line represents the daily flow of people within the study area (No. 1–No. 29), the yellow line indicates that the people outside the target area (No. 30–No. 40) flows into study area which is opposite to the green line that represents the outward flow. The blue line represents the transit flow which means the travelers only pass through the research area and do not stay long.
The TAZ No. 5, No. 14, No. 16, No. 17, No. 18, No. 20, No. 26, No. 27, and No. 28 had a higher OD demand than other TAZs, and the distribution of blocks was basically consistent with the current metro lines. Referring to the distribution of land-use types in Figure 7, we can find its distribution basically coincides with the distribution of non-residential land. This states the TAZs that attract or have large flow in daily travel tend to possess better public transport travel environment and higher mixed land use degree. From the inside OD demands in Figure 13 we can see that, in the mentioned nine TAZs, most of the inside flow comes from adjacent neighborhoods. Two reasons can explain the appearance of this phenomenon: first, travelers want to find large scale transport station nearby; second, travelers would like to seek for complementary functional facilities. The public transport, public service, commercial and business facilities were excessively located in the axial area of Hexi new city central area, which made the daily commuting take on the situation of gathering from the west and the east to the axial part, leading to the longer distance of daily travel, unbalanced difficulty in traveling within this area, and low travel efficiency. This result also indicates the assumption we have mentioned, that the distance between commercial area and residential area is the major factor that influence the occurrence of travel behavior inside the region. In future development and construction, we should consider residents’ demand and lay more emphasis on the balanced distribution of public transport and public service, commercial and business facilities.

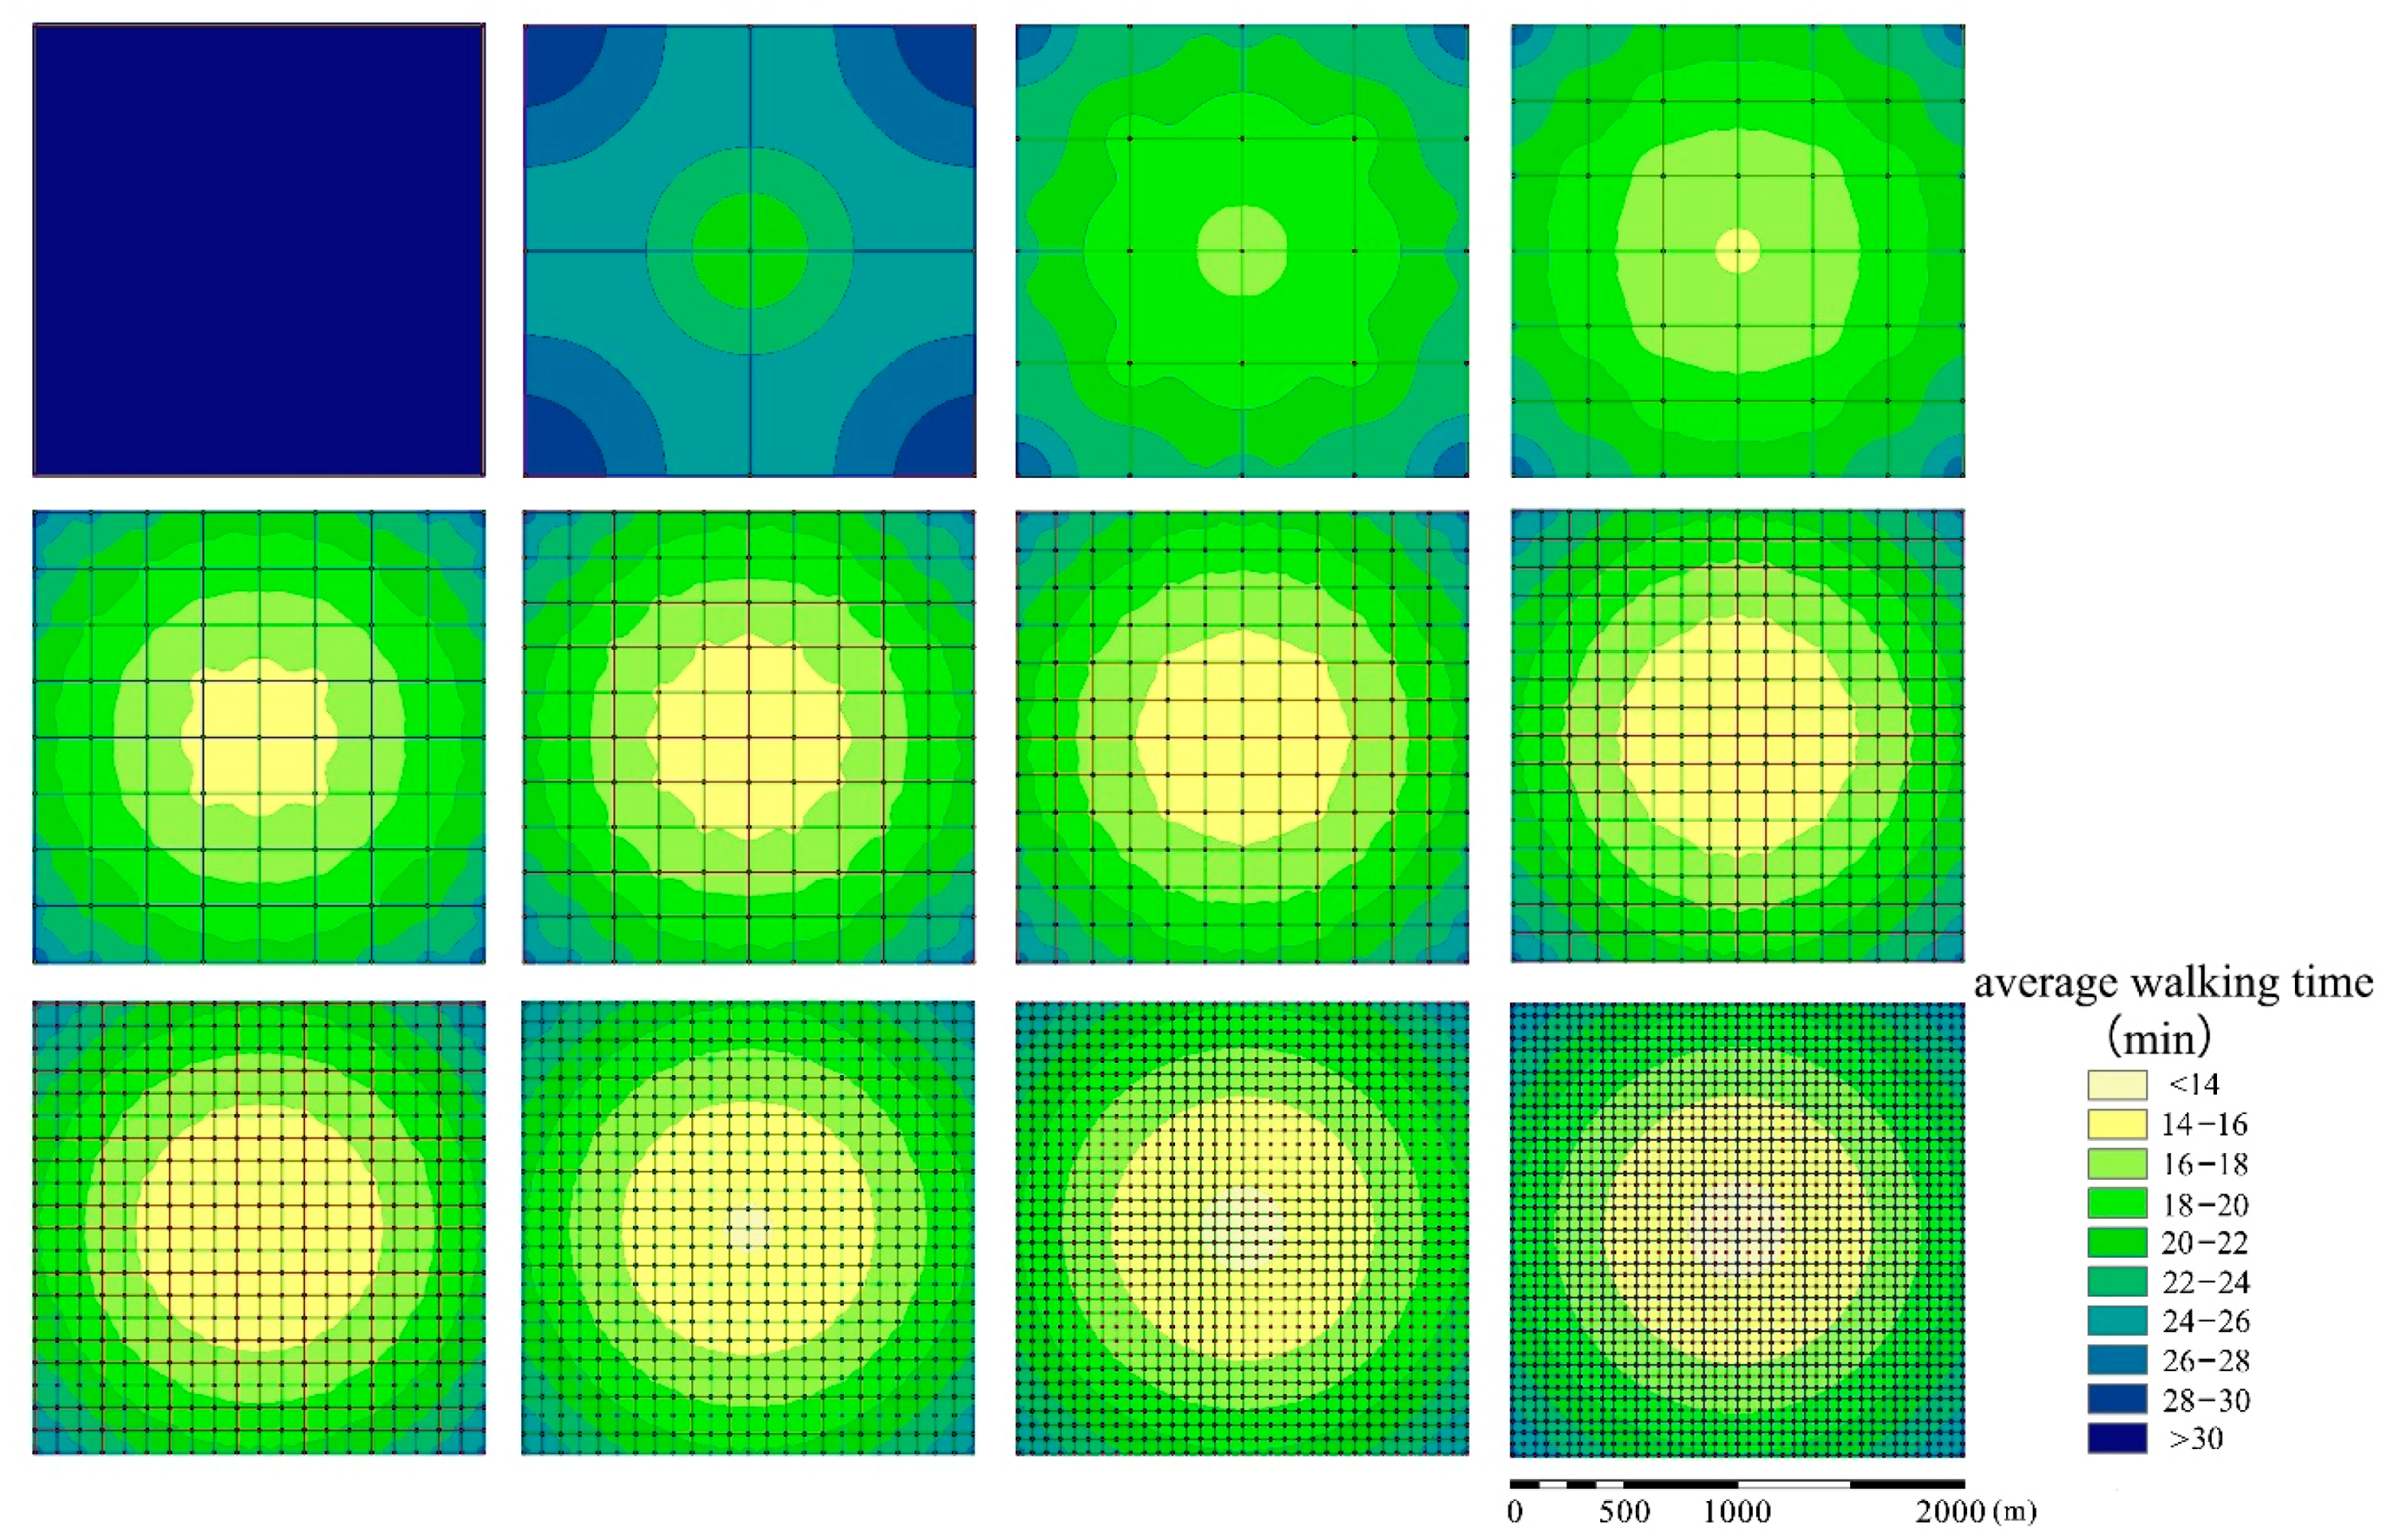
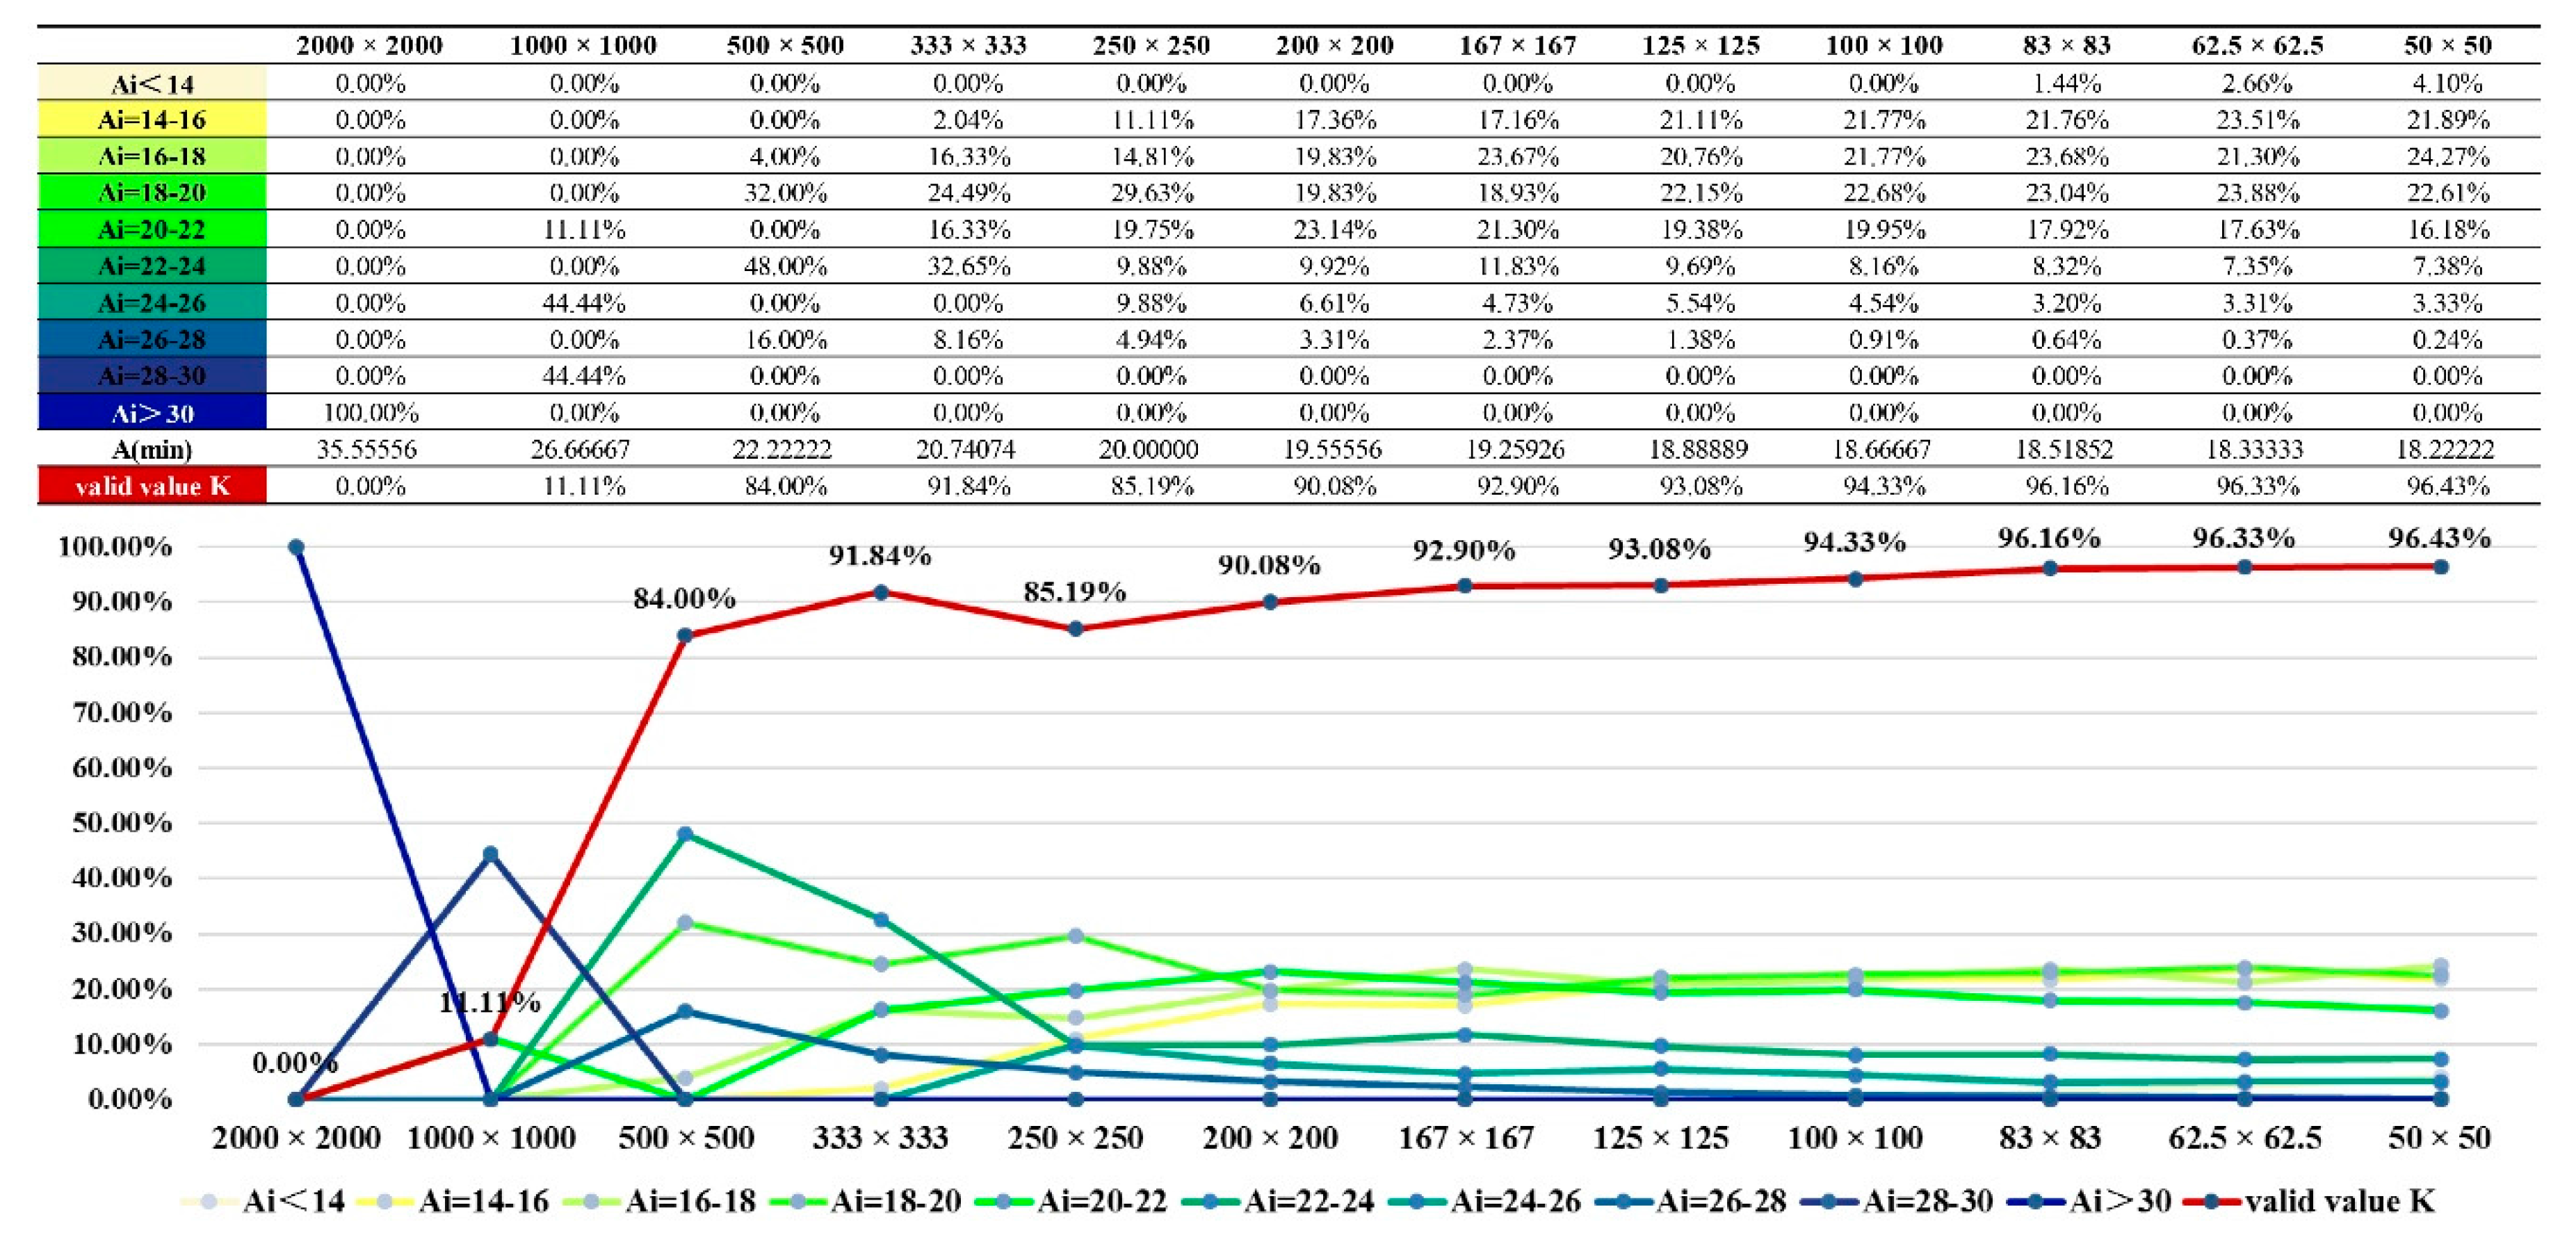
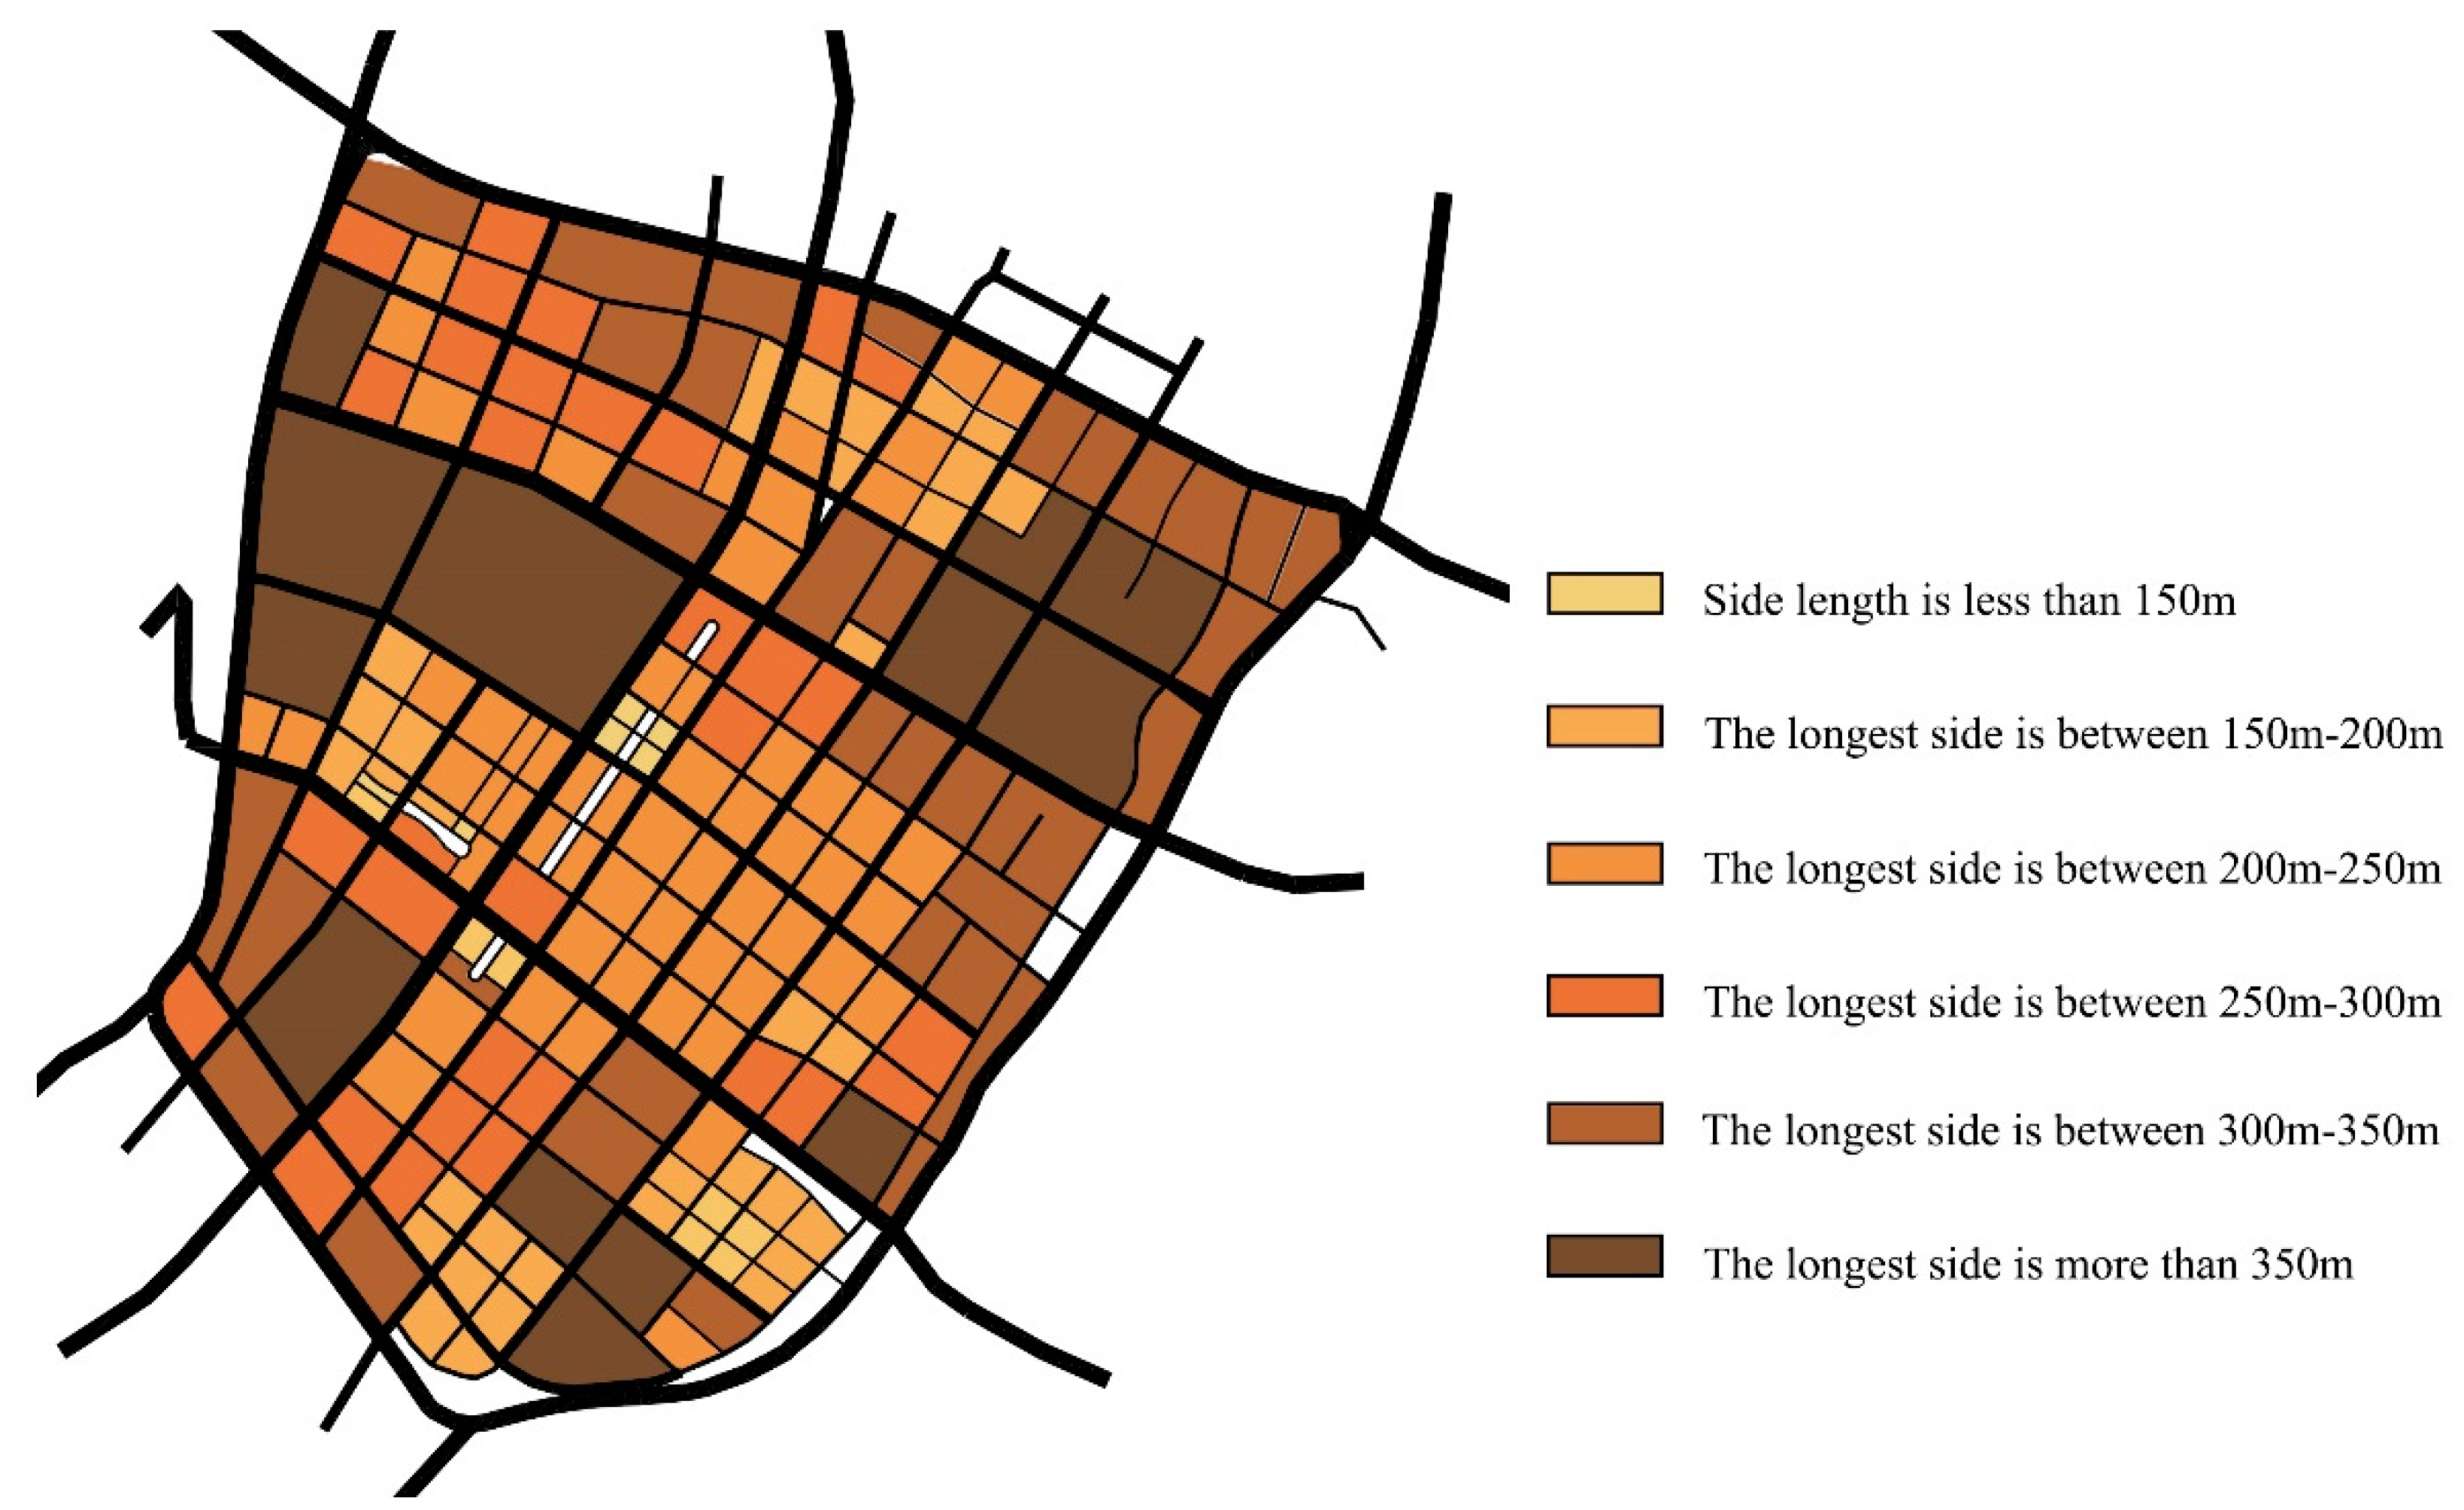
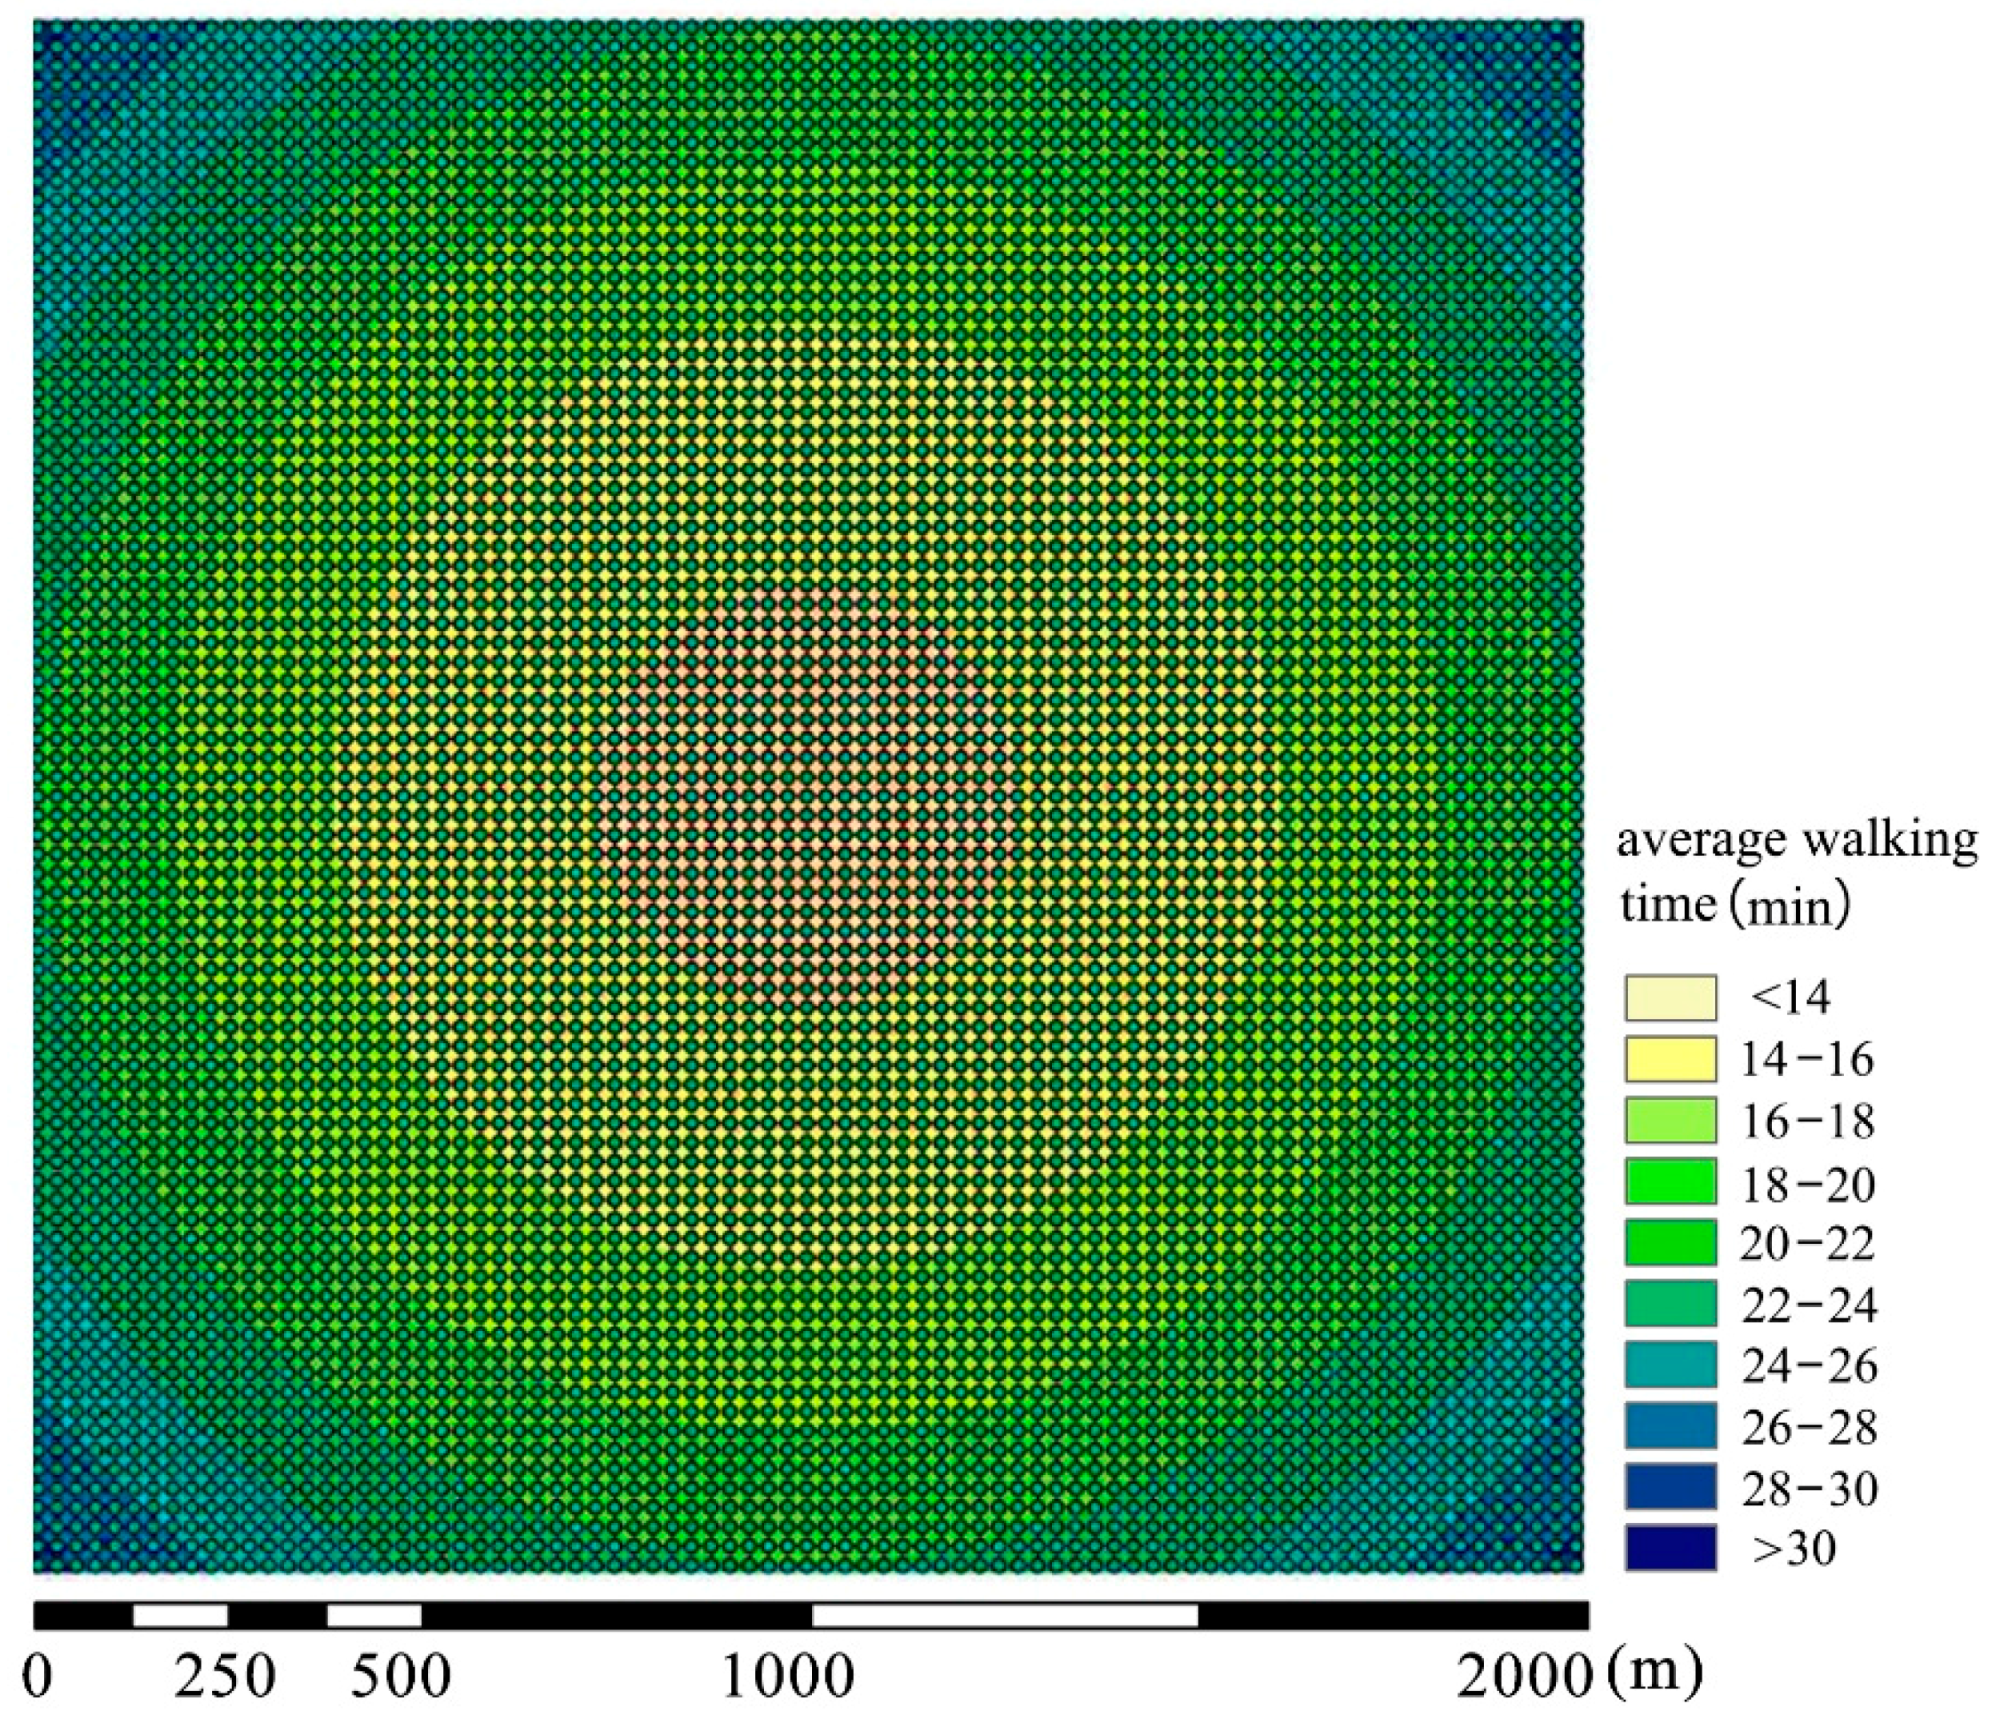
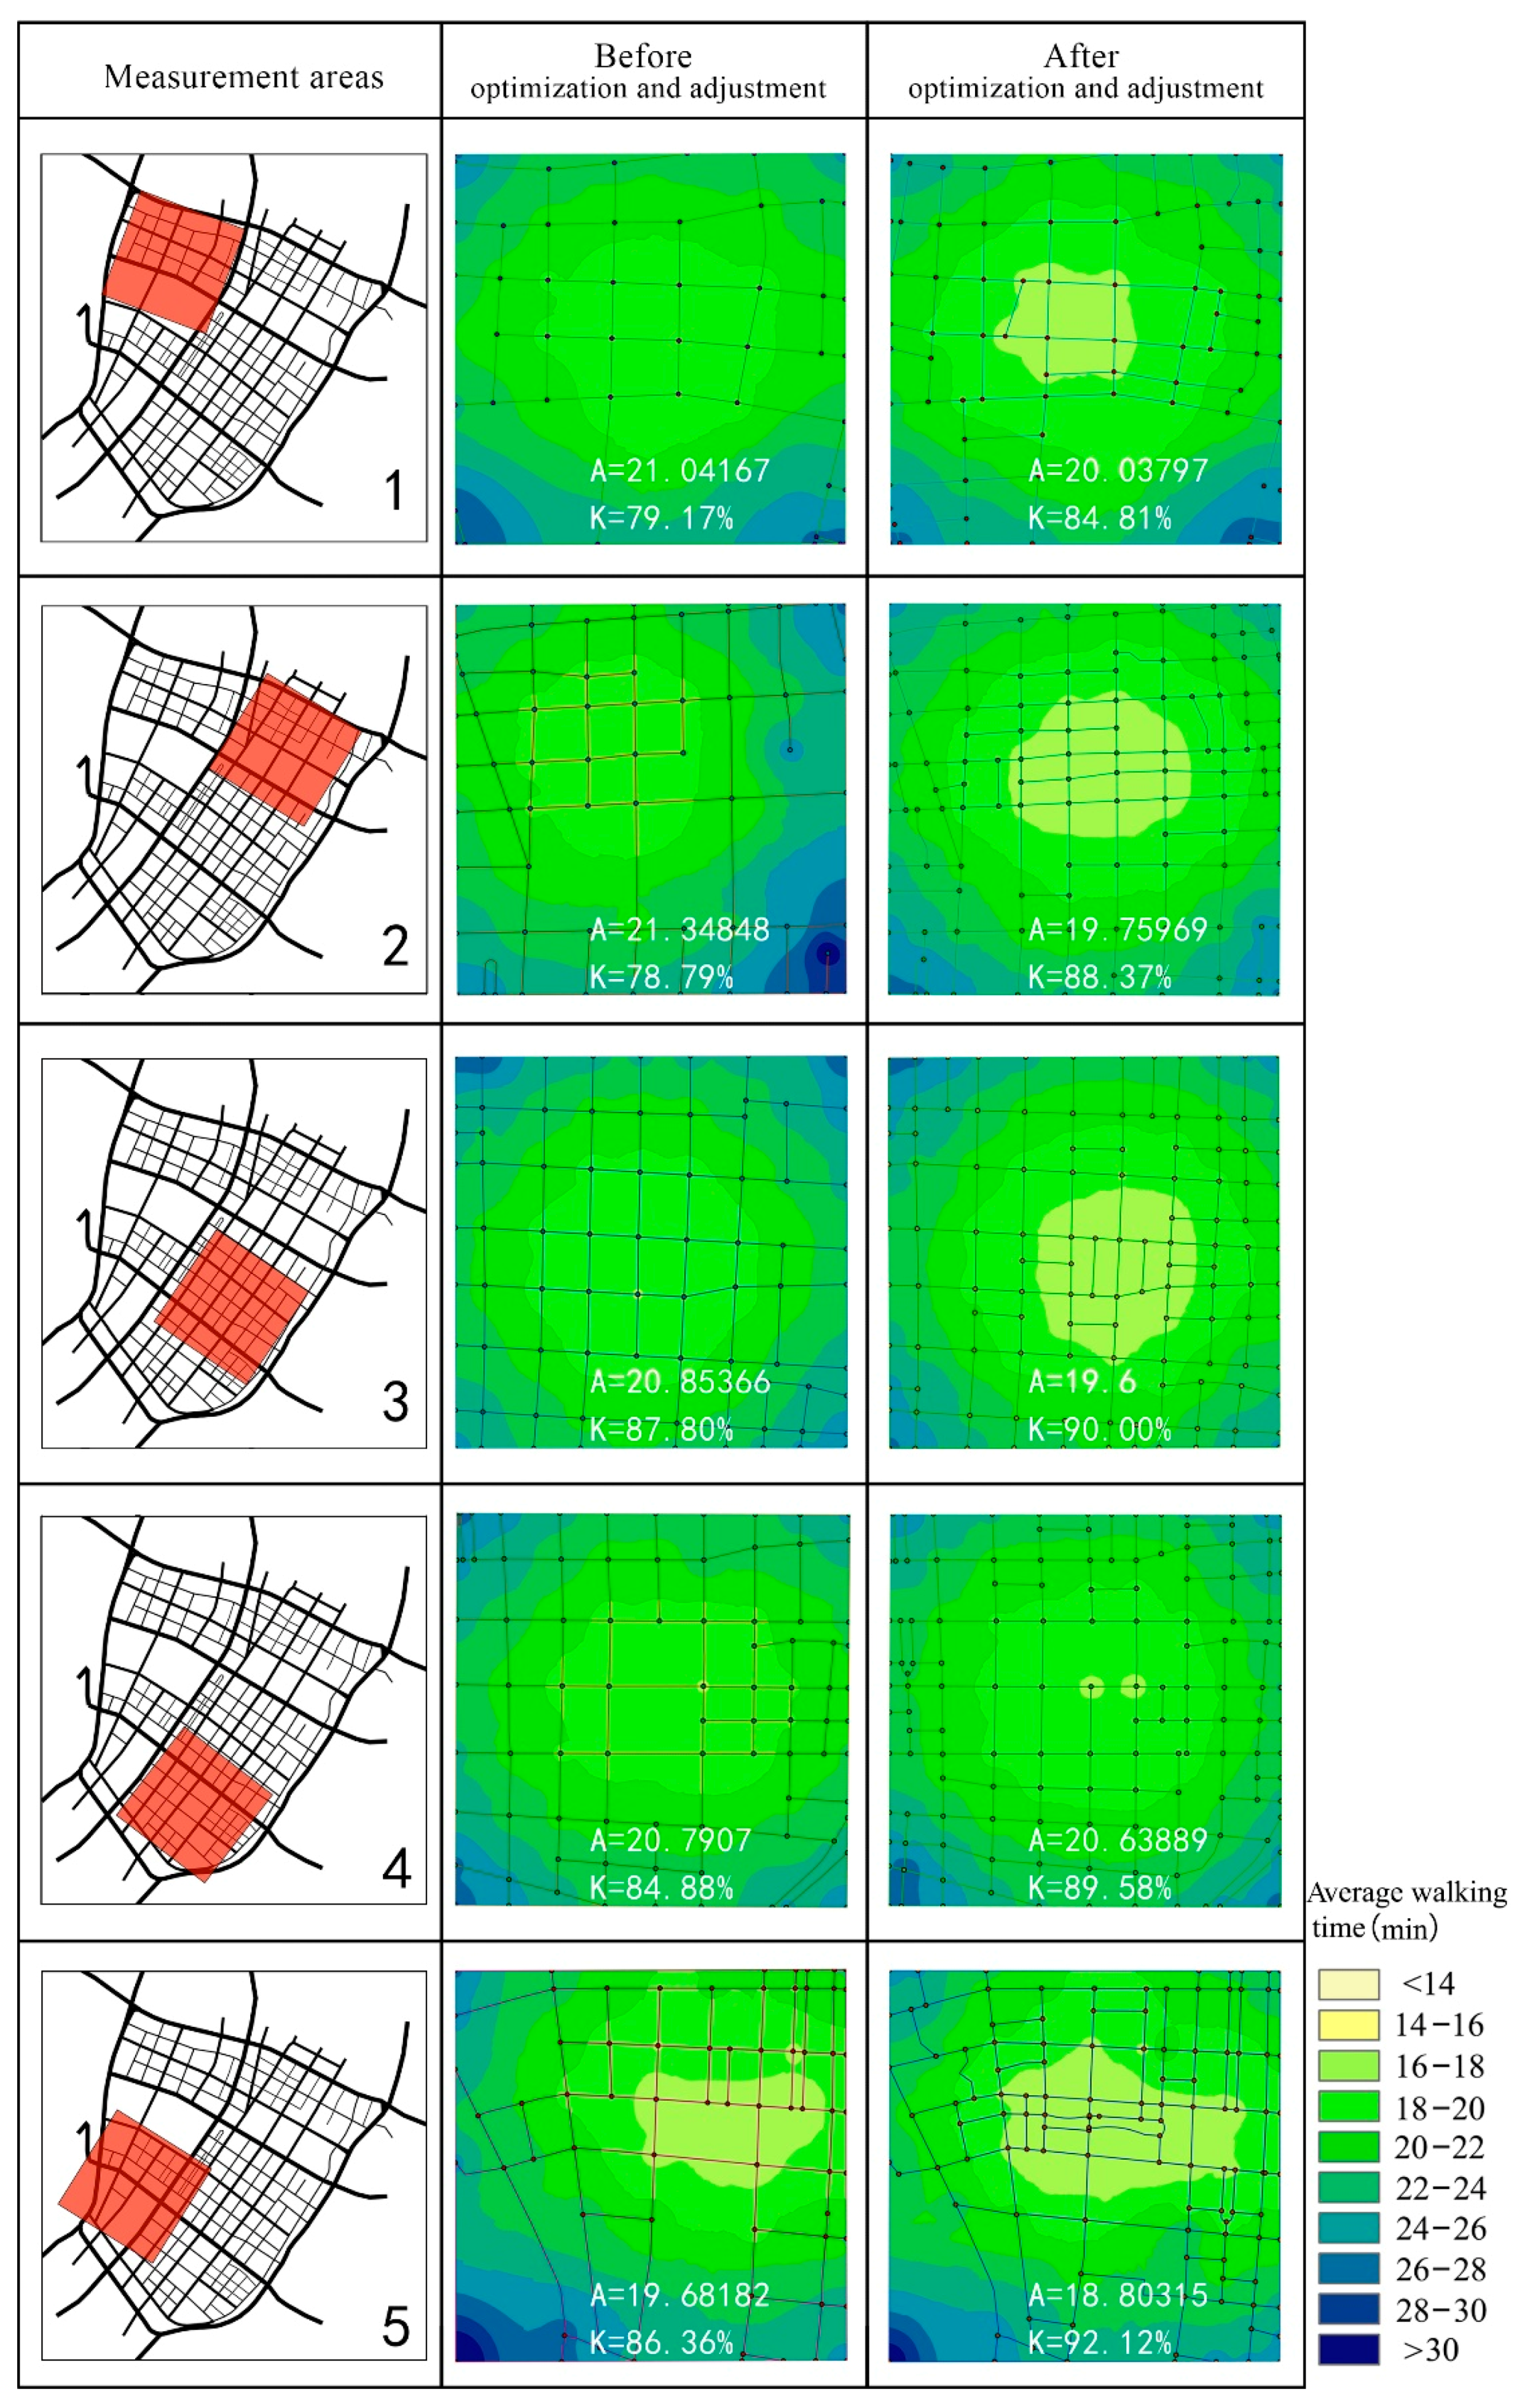
3.3. The Determination of Reasonable Block Scale Based on the Walking Accessibility Analysis

In Section 2.2.1, we used the comparison of the side length to judge the scale of the blocks, so what is the standard to judge the big or small of the blocks? Many scholars regarded the range of 100–200 m as a suitable scale [3], but this number was an empirical value. We think we should not take the block scale as the only main standard when assessing the strengths and weaknesses of the road network in one region, we are supposed to measure and calculate the accessibility of this region for precise consideration, and try to find out the relationship between block scale and the accessibility of the whole area.
There are different ways to measure and calculate the accessibility: one method is to measure the road network density, the road occupation ratio, and the detouring coefficient of walking in the region; another is to carry out specific analysis according to the network accessibility model. The latter has been widely spread after the supplement and amendment of Hansen (1959) [29], Ingram (1971), Allen (1995) [30], and James A (1996) [31].
A i = 1 n 1 j = 1 j i n t j i                     A = 1 n i = 1 n A i
where Ai represents the accessibility of node i; A means the accessibility of the whole network; and tij expresses the minimum resistance between node i and node j [32], which may be the distance l, time t or expense s, and, in this research, we took time t as the resistance.
We built a 2 km × 2 km homogeneous grid network model by using ArcGIS software, and took the minimum traveling time as the resistance in the simulation, viewed all the intersections in this region as departure point and destination, and further calculated the average shortest traveling time between the intersections, which worked as the evaluation index of the accessibility. To distinct the average traveling time clearly, this research adopted 75 m/min (people’s walking speed) as the traveling rate (other rate is also available according to different requirements), and obtained the visualization model of walking accessibility (Figure 14).
The results of this experiment are as follows: the circle of the same color represents the same walking accessibility Ai of the road nodes in this region. In the simulation, the circle which stands for less than 24 min traveling time almost takes up the 2 km × 2 km simulated area. Therefore, in the experiment, the road nodes covered inside 24 min area are considered as valid nodes. We then added up the valid nodes of each circle and worked out their proportion of the total nodes, as shown in Figure 15. (Annotation: In the practical application phase, the area of 2 km × 2 km is artificially delimited, and the nodes on the border are added by the author for calculation, so in the measured phase, they can be viewed as invalid nodes. For the convenience of statistics, in the simulation, we measured and calculated the nodes within 24 min of traveling time, and took other nodes as invalid nodes. To get a reliable result, this study compared both the accessibility of the whole network A (in the equation) and the valid value K (defined below) at the same time).
In Figure 15, we can see that, when the side length of the block is longer than 250 m, the tendency of the valid nodes of each circle shows a relatively disordered state, and when the side length is shorter than 250 m, the proportion of the valid nodes becomes stable with the shortening of the side length. For clear comparison, we chose the nodes that were under the coverage of six valid accessible circles with less than 24 min, figured out the ratio and the sum, and thus obtained the valid value K in red in the figure. All these lines moved towards stable state when the side length was shorter than 200 m, which basically consisted with the result of A (min) (the accessibility of the whole network). In this experiment, we attempted to adjust the side length into 25 m × 25 m and obtained the model in Figure 16. The average valid value K is 97.13%, which showed no obvious improvement compared with the previous result. This result demonstrated that the suitable block scale should be controlled within 200 m, and the road network density would show a relatively saturated state when it reached a certain value, namely, an intensive road network did not definitely mean a better situation. We took 75 m/min (people’s walking speed) as the traveling rate, therefore the result coincided with what Siksna A had proposed that a block scale of 5–70 m was most beneficial to people’s walking activities, while 80–110 m took both pedestrian and motor vehicles into account [33]. Thus, in the follow-up application phase, we utilized valid value K as the specific quantitative value to assess the accessibility of this area. In this regard, the closer K is to 100% means better accessibility of the network, and people can amend value K by optimizing every indicator of the block to help the accessibility of this research area reach a relatively reasonable state. It is important to point out that, contrary to value K, the smaller the value A is, the better accessibility it represents.
Based on the above study, when the block size is between 100 and 200 m (including road width), value K and A tends to be the ultimate stable, even if denser road network does not significantly improve the accessibility of the region. This result is basically consistent with the previous empirical values on the reasonable block scale. As for Hexi, an area with large public architecture clusters and block scale (Table 1), large-size block development model makes it difficult for the average value of the block scale to achieve the above indicators. However, to form a good walkable environment, the accessibility of the block should be controlled as much as possible within the range in which the block scale should be shorter than 250 m.
In the subsequent optimization design research phase, we compared value K with value A and cross-referenced them, and evaluated the overall block scale state of a block according to these two values in Figure 15.

4. Coupling Optimization Strategy of Space and Transport

Currently, the Hexi new city central area is still a very young city with imperfect road and public transport system. Based on the above study and analysis, following the principle of reduce travel demand and distance, supporting residents’ walking and traveling by bicycle or using public transport, and limiting car travel are good for the sustainable development of land use [34]. To improve the low-carbon accessibility of the space in the research area, and solve the current problems, this paper put forward some optimization strategies from the following aspects.

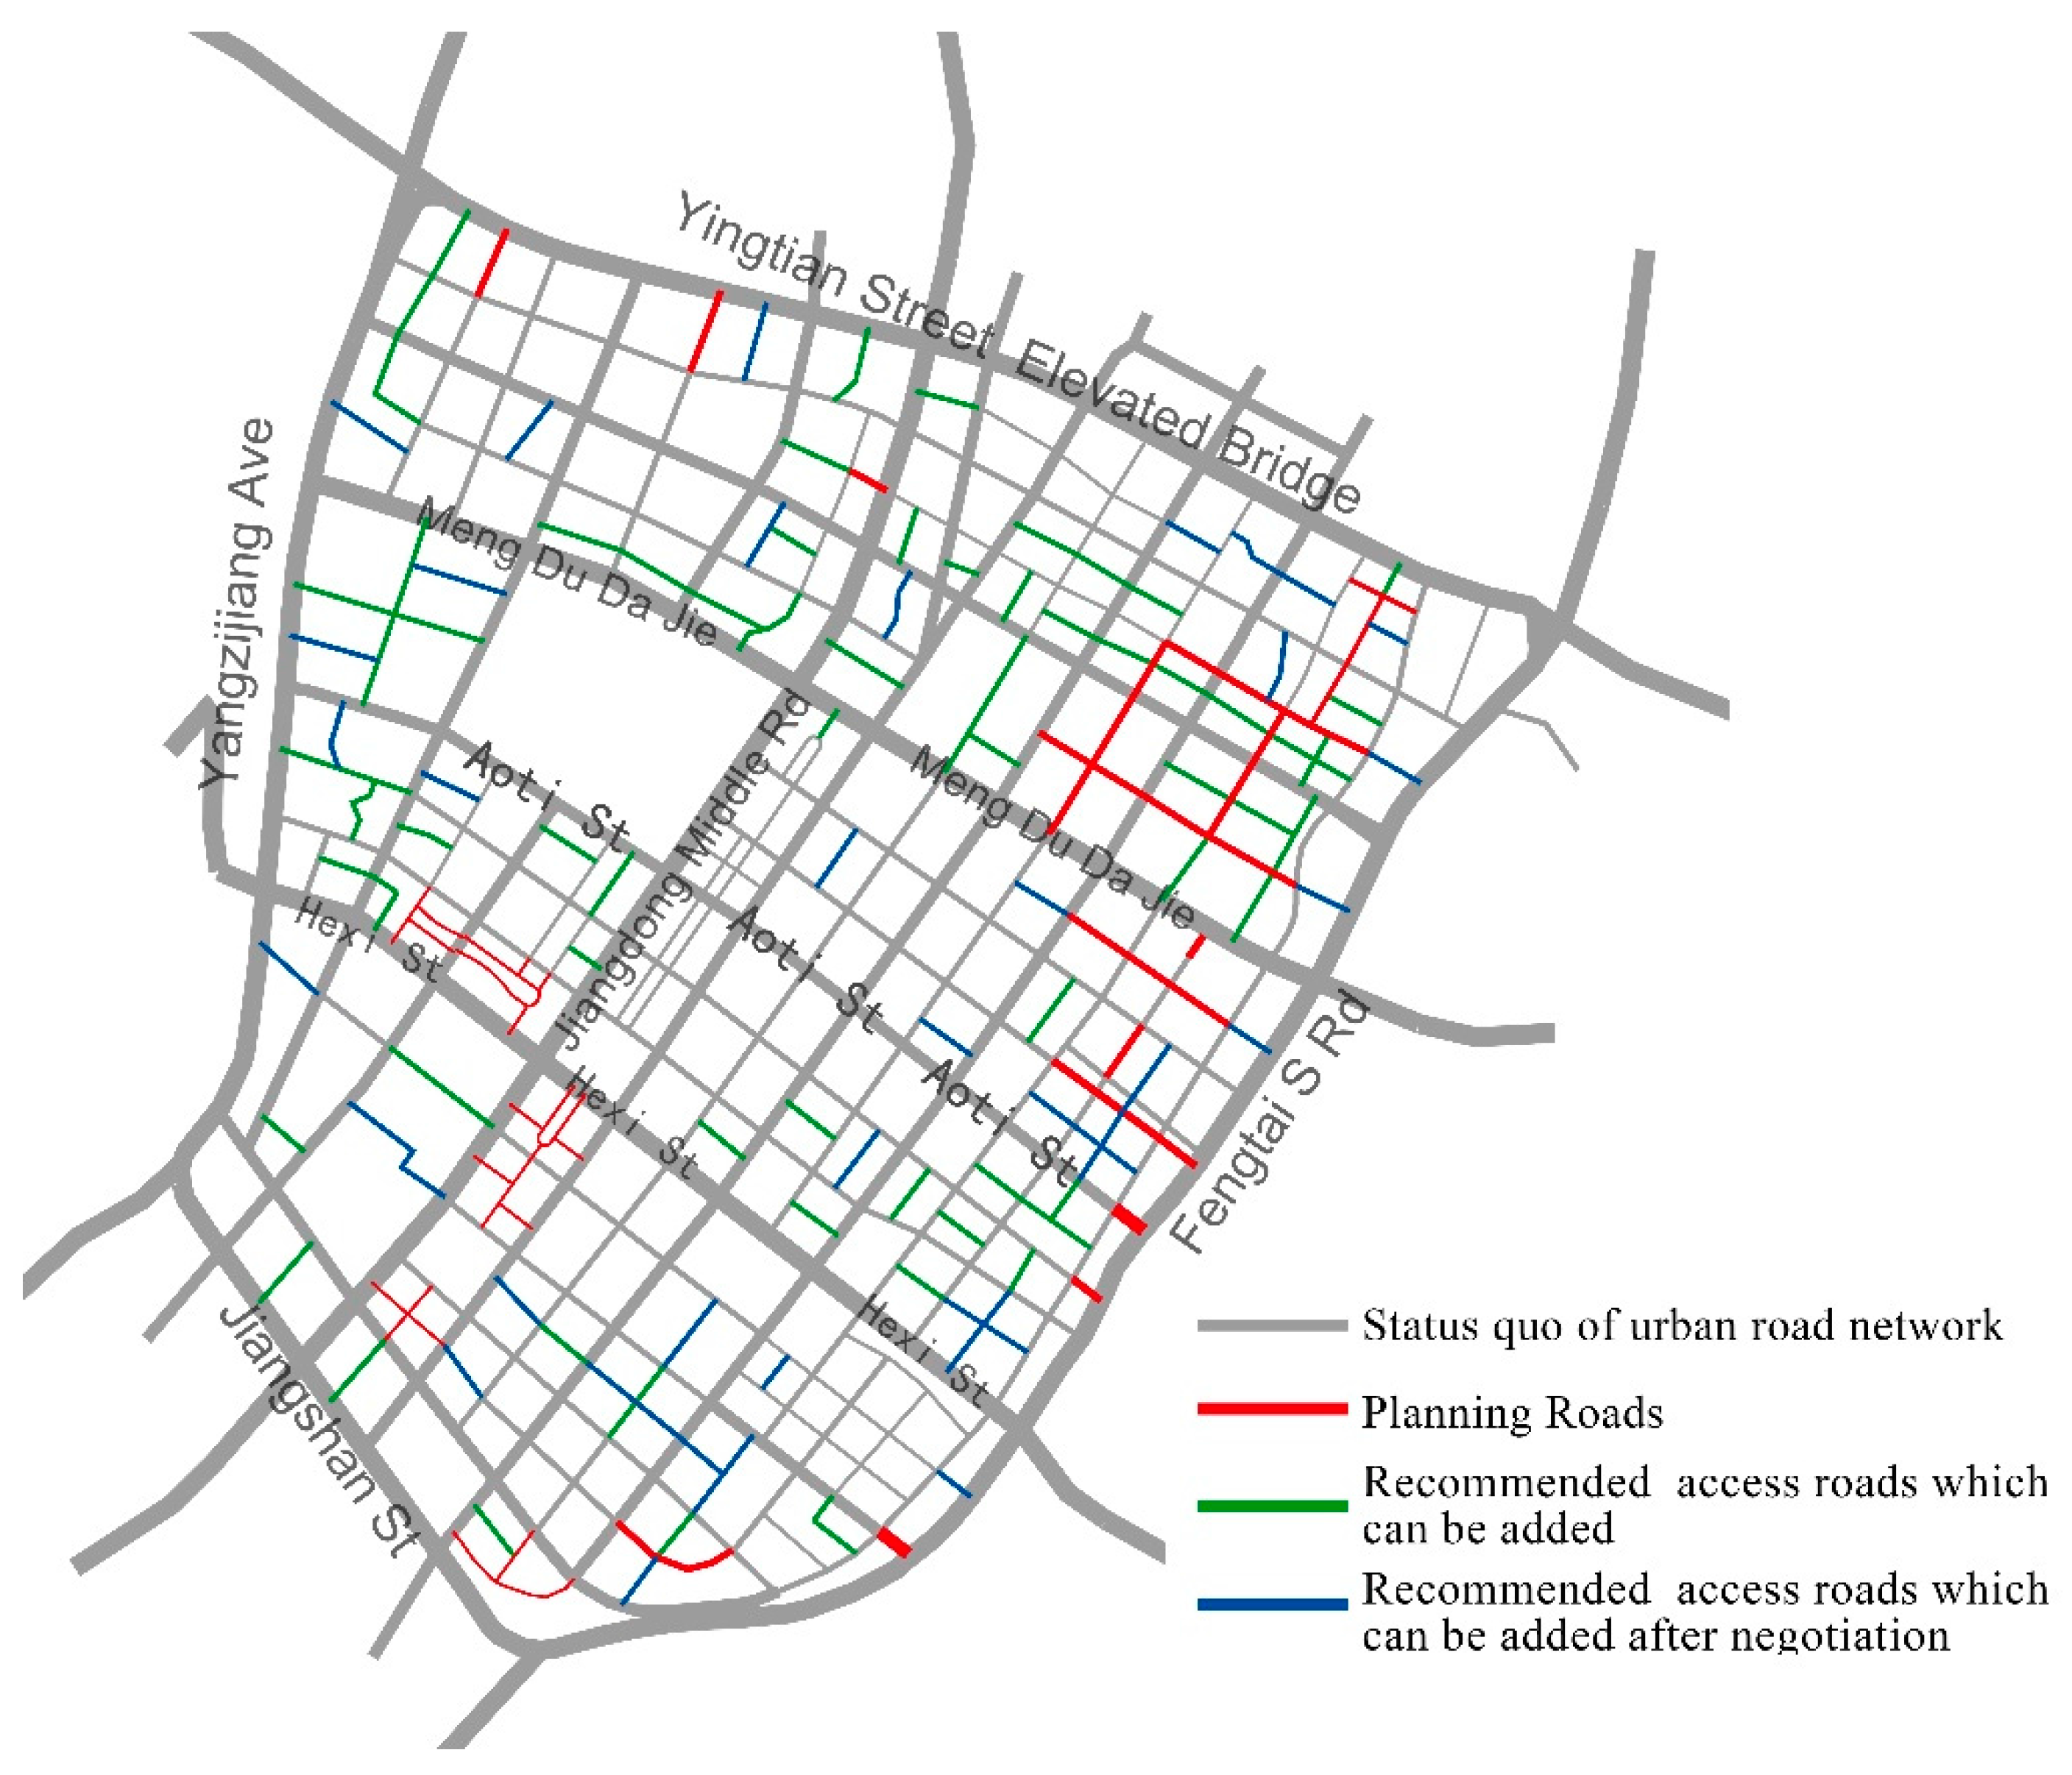
4.1. Optimize Access Road Network System

The fluid access road can help to build a non-motorized traffic friendly atmosphere, and further improve the regional road network accessibility and shorten the walking distance to the stations. Therefore, the optimization of the access road network has dual effects on promoting residents’ choice of walking and taking buses [35]. According to the investigation and analysis above, we put forward the following improvement measures to optimize the road network (Figure 17).
(1)
Paired with the overall OD demands in Figure 13, we can see the eastern part of the area requires the improvement of road network planning and construction, especially accelerating the road network construction of the region connected to Fengtai South Road to relieve the lateral traffic pressure of Hexi Street and Meng du Da Jie.
(2)
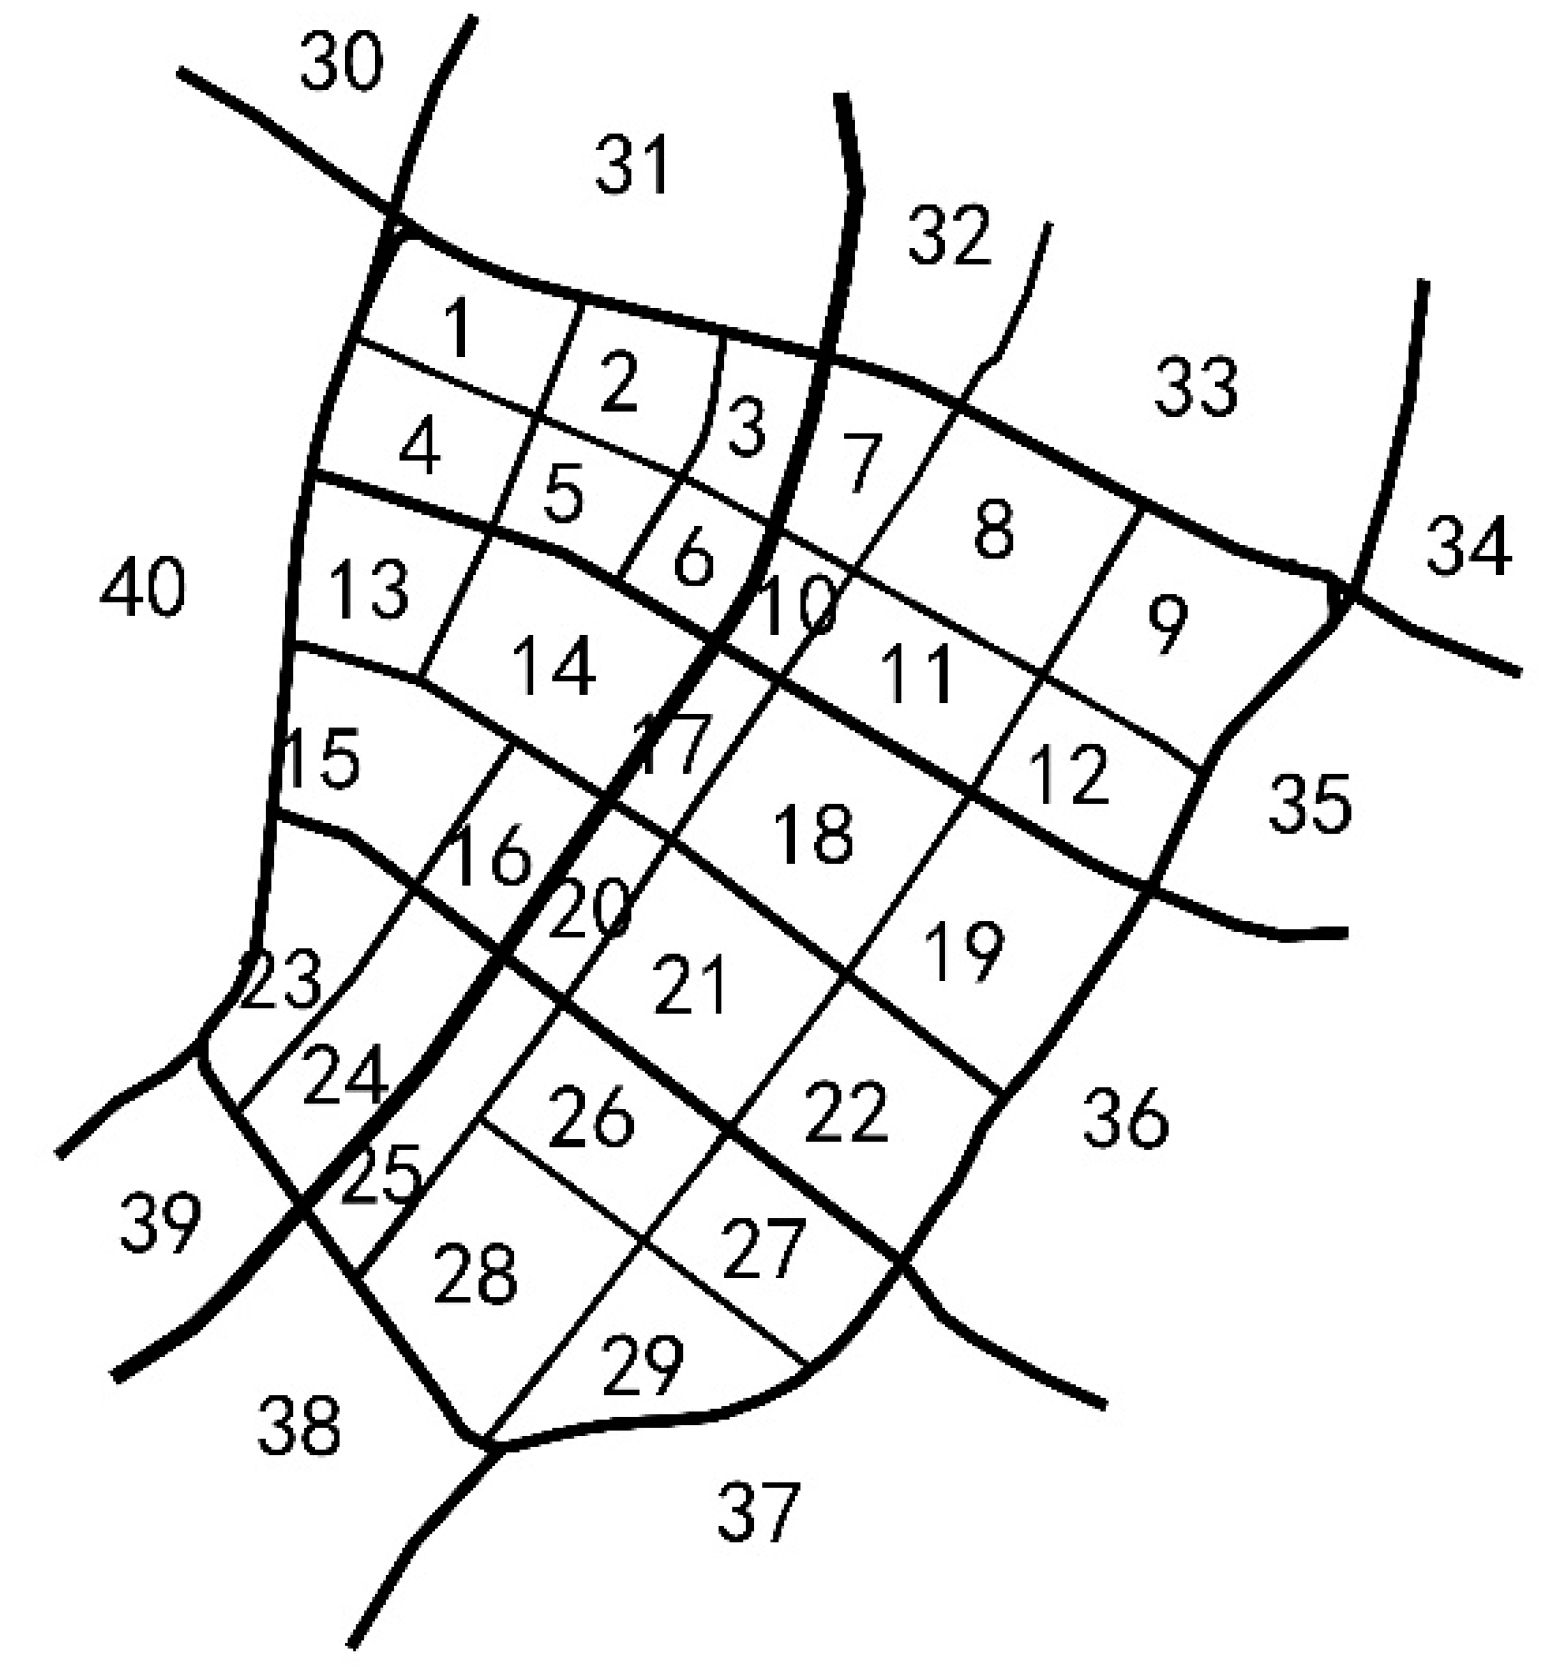
According to the research results in Section 3.3, the appropriate adding of access road can improve the walking accessibility of the whole area. Through visits and investigations, we divided the access road that can be added in the short term into three categories (shown in Figure 17). Based on the current urban construction, we recommended that the government gradually construct access roads selectively (green roads in Figure 17) and add blue access road network after negotiation to minimize the block scale; construct non-motorized roads that are suitable for walking and bicycling in the community to improve the low-carbon accessibility of those road sections and create a comfortable low-carbon traveling atmosphere. Specifically, according to Figure 8 and Figure 12, it is necessary to further improve the access road network system of the sections lacking in bus line; that is, speed up the construction of the access road network of the outer ring (TAZ No. 9, No. 12, No. 19, No. 22, No. 27, No. 29, No. 28, No. 25, No. 24 and No. 23).
(3)
Because of the current situation of the super-large blocks of the Olympic Sports Center and the central International Expo Center, which are in the southwest part of the research area, we advise gradually reconstructing the existing green landscape in this area and designing exclusive roads for walking and bicycling that integrated with the surrounding urban roads, and building open urban parks for citizens.
Figure 18 is the comparison of road network accessibility before and after the optimization; in the actual measurement, we divided the research area into five testing parts (from 1 to 5) with the size of 2 km × 2 km. The test result shows that after optimization adjustment, the accessibility of the 5 blocks was improved to some extent. If we sort the test result according to value A, before optimization, their accessibility ranked from high to low: 5 > 4 > 3 > 1 > 2; and after optimization: 5 > 3 > 2 > 1 > 4. If we assess it based on value K, before optimization, their accessibility was: 3 > 5 > 4 > 1 > 2; and after optimization their accessibility ranked from high to low: 5 > 3 > 4 > 2 > 1. There is a delicate difference of the results based on different calculation methods, specifically: (1) before optimization, the road network density of Block 3 should be superior to that of Block 4 and Block 5; and (2) After optimization, there is no distinct difference between Block 4 and Block 2, but the road density of Block 1 should be significantly lower than that of Block 4. While the assessment result of value A does not match with reality and there is an obvious deviation. After the optimization, the value K of Block 1 is 84.81% which is clearly lower than others, this conforms to reality. Thus, we thought in the real test, value K has a higher accuracy than value A.
As is shown in Figure 18, after the optimization and adjustment, the value K of block 2, 3 and 4 are all in the range of 85.19% and 90.08% (the value K of block scale is between 200 m and 250 m). The accessibility of block 1 has been significantly improved. However, due to the existence of Olympic Sports Center, the final value K is still only 84.81%. Interestingly, from the calculation result of Block 5, we can see there is high accessibility both before and after the optimization, especially the latter one. Although there exists the development of super-large area in Block 5, the results are quite different from block 1. There is an intensive road network of the surrounding areas: it has 127 intersections, which is only third to the 144 intersections in Block 4 and 129 in Block 2, thus still has good accessibility. In Figure 18 (the chromatogram), people can find the color distribution takes on apparent eccentricity in those blocks. This paper suggests the development of small blocks around the inevitable construction of super-large blocks to improve the overall accessibility in this area.

4.2. Build a Public Transport System Coupling with OD Demand

From the previous construction situation of urban transport in Hexi new city central area, there is less arrangement of the east–west public transport. The current road traffic was too concentrated on the strip-like area near the Jiangdong Middle Road with high repeated bus lines and low accessibility. If this continues, this road section will be the congestion zone. We can make full use of the secondary trunk road and access road on the two sides of the main road to ease the traffic flow, and make integrated arrangement of the road network to create a fast and accessible urban traffic [36]. Here are some proposals for adjustment:
(1)
According to the transit and access OD demands in Figure 13, it is necessary to accelerate the connection of Aoti Street and Fengtai South Road, and set east–west bus rapid transit along Aoti Street to enhance the association between the eastern and western areas, and further bring convenience and improve public transport accessibility of areas along Aoti Street.
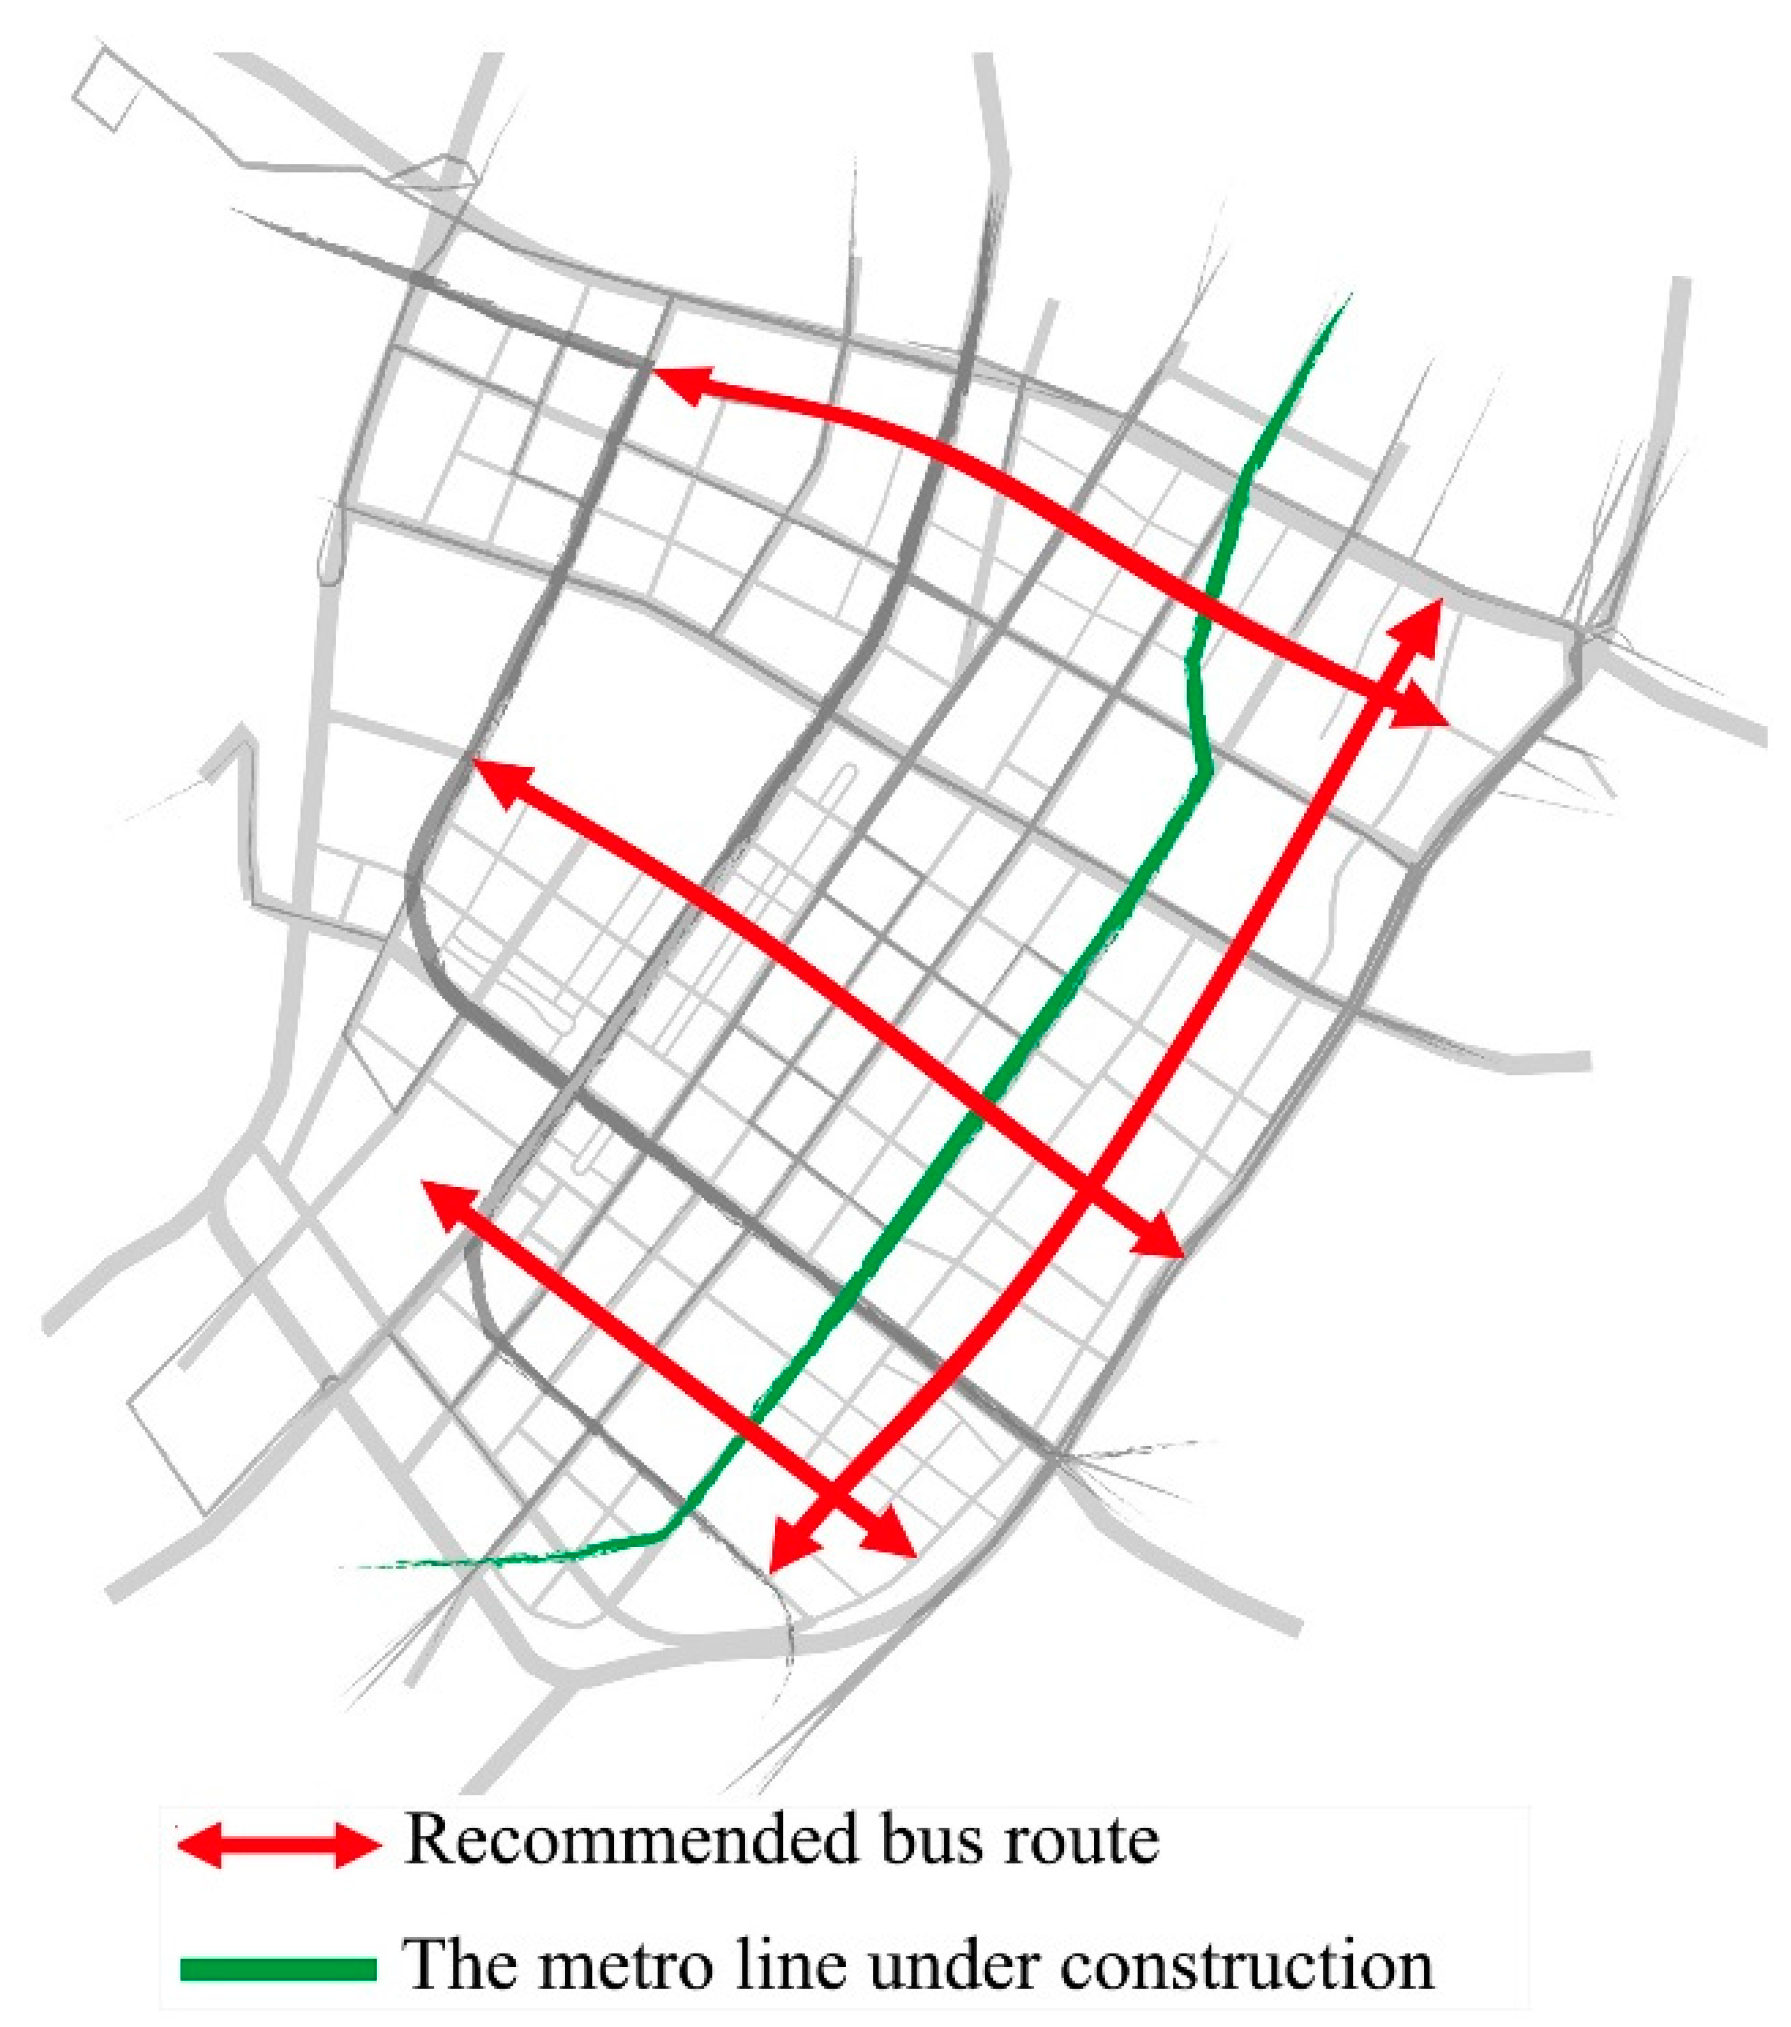
(2)
Notice the Inside OD demands in Figure 13, we advised strengthening the connections among TAZ No. 1, No. 2, No. 3, No. 7, No. 8, No. 9, No. 12, No. 19, No. 22, No. 27, No. 29, No. 28, No. 25, No. 24 and No. 23. Due to the construction of metro line 7, the traffic pressure is relieved in the south–north 9–29 areas, while the east–west lateral traffic of the south and north part of the research area should be strengthened in later construction (Figure 19).
(3)
At present, the commercial and business facilities are gathered in the axial part of the research area. From Figure 8 and the Overall OD demands in Figure 13, we suggested increasing the proportion of commercial and business facilities in TAZ No. 5, No. 19, and No. 26 to satisfy the travel demand of nearby residents, shorten the distance between commercial areas and residential areas, improve residents’ travel efficiency, and reducing the public’s excessive dependence on the old city.

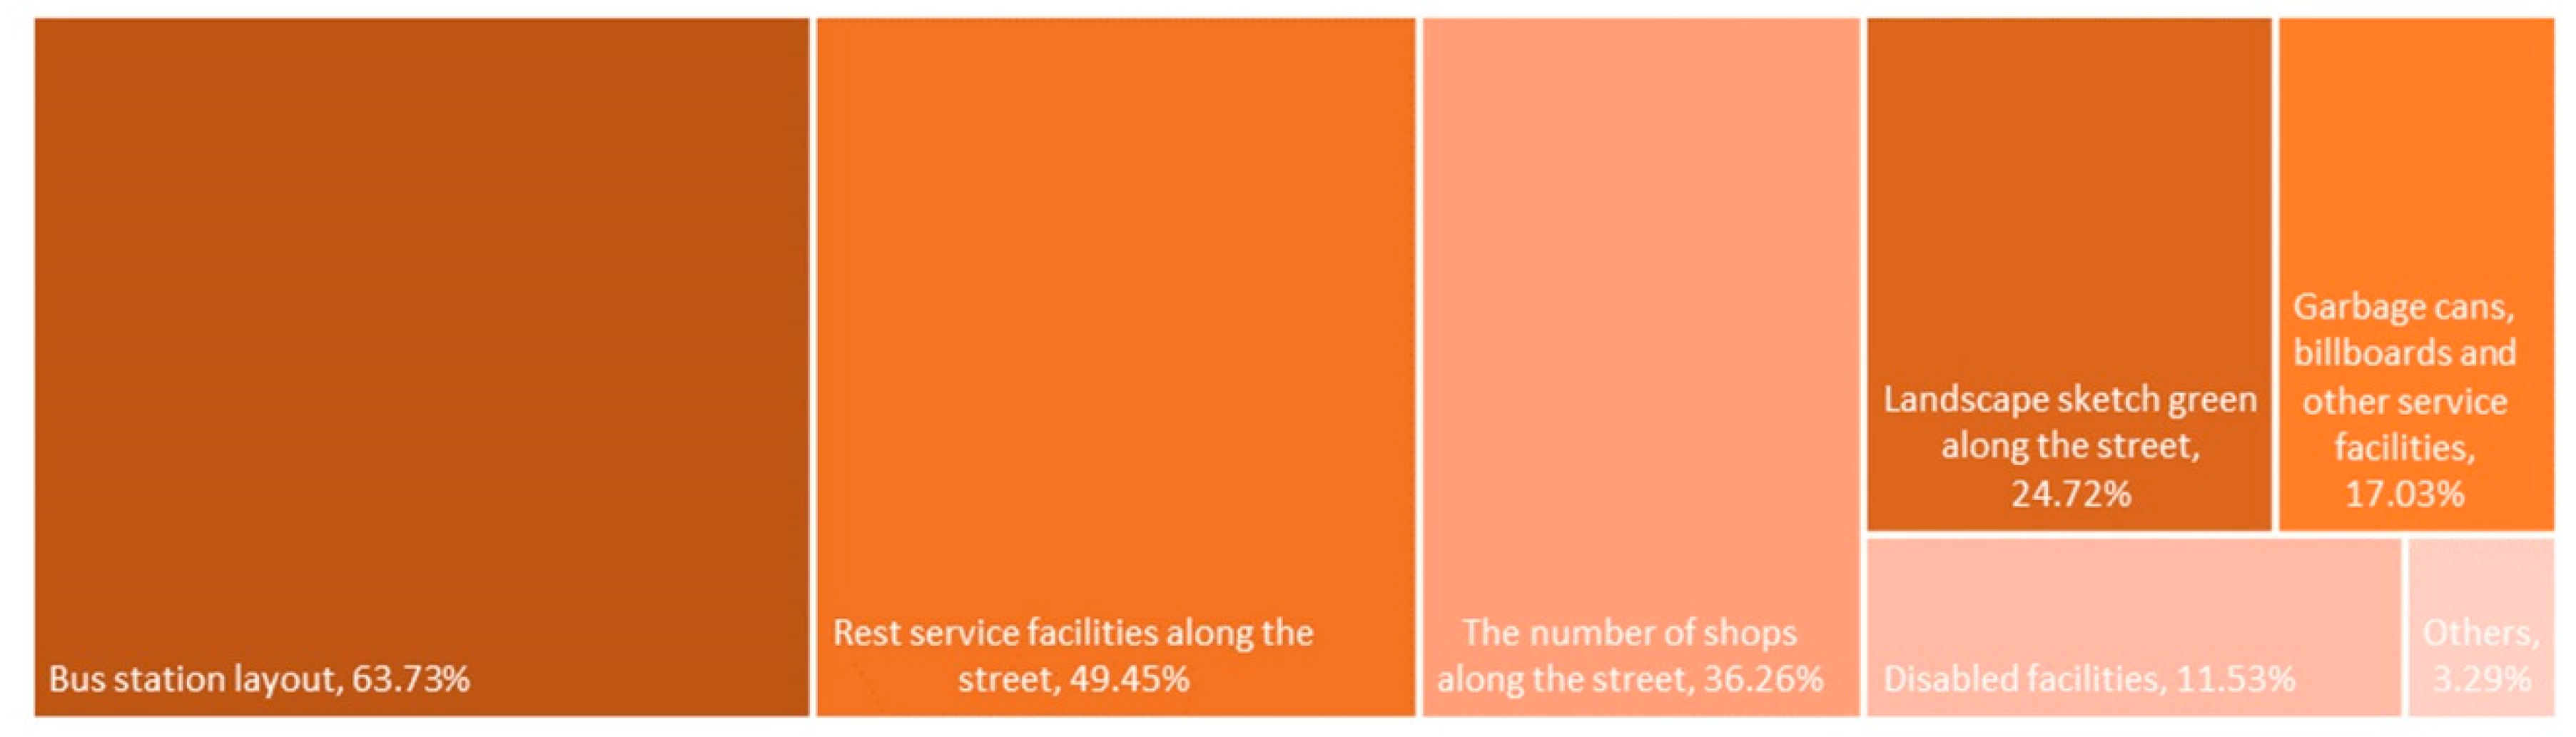
4.3. Optimize Public Space to Create a Comfortable Environment for Non-Motorized Traffic

The increase of the mixed degree of land use is closely related to the gathering of people, while a good environment for non-motorized traffic is a necessary condition to attract people. To solve “the last kilometer problem” in Hexi new city central area, almost 150 borrowing and returning stations for public bicycles are set, and a new type of traveling, the shared bike, is booming. The study shows residents are satisfied with the distribution of public bicycles in Hexi, but the road traffic is still a problem. For instance, there is no exclusive lanes for bicycles and no rest facilities along the road, which greatly influences residents’ choice of non-motorized traffic. Figure 20 shows the usage of public green space is low in Hexi new city central area. Compared with this, the green space in the axial part is more popular with the residents. Moreover, the mixed land-use degree of the axial part reaches a higher state, therefore, the residents’ travel efficiency is improved, which creates a virtuous circle. The suggestion is to add more rest facilities along the road and open more green space for public use; to set exclusive bicycle lanes along the road with better green landscape to instigate more walking and bicycling behavior; and to further help with the development of public service, commercial and business facilities along the street (Figure 21).

4.4. Strengthen Guidance and Development

In the future development and project approval of Hexi new city central area, the government planning and management departments may adopt the principle of “open large blocks and minimize the road network properly” as their requirement: to consciously open the blocks, strengthen the interactive relationship among walking road network, residential area and the city, and make the streets a carrier for public activities and communication; to guide the addition of the function types that are currently absence in the area, change the current situation that focuses on the axial part and diverge towards other directions, and form a multi-core development mode in the area and increase the mixed land-use degree by constructing the city complex; strengthen the guidance of the non-motorized traffic and walking transport to reduce the use of car and other motor vehicles and add more public transport in the function-gathering area; and to implement the separation of pedestrian and vehicles with the aid of overpass, form a three-dimensional urban transport system featuring underground, ground and air.

5. Conclusions

To promote the sustainable development of the city, there are many cities in China that transform from a model of “the development of new areas” to “the development of built-up areas”. In this process, it is of vital importance to strengthen the high-accessible and coupling development of urban space and transport. This paper made a survey and quantitative analysis of land use, road network planning, distribution and usage of public transport and existing problems in Hexi new city central area in Nanjing. The study showed that the degree of mixed use of land and the distribution of public transport promote each other. From the perspective of travel behavior, the related OD demand survey was carried out to find the pain point of supply and demand contradiction in the area, and put forward targeted optimization measures for land use and public transport distribution. To solve the relevance between block scale and walking accessibility, a pedestrian accessibility model was established, and the value K of the measurement result was used as the evaluation index of the accessibility of the whole region. According to the result, the reasonable block scale, being conducive to low-carbon travel accessibility, should be controlled between 100 and 200 m. This paper also provided some optimization strategies to realize the sustainable development of Hexi new city central area and build a low-carbon and accessible urban space and public transport system.

Acknowledgments

This study was supported by National Natural Science Foundation of China (No. 51578282 and No. 51508265); Natural Science Foundation of Jiangsu Province, China (No. BK20151538); Science and Technology Project of Ministry of Housing and Urban-Rural Development of China (2016-K2-027); and Foundation of the “333 High-Level Talents” of Jiangsu Province (No. BRA2016417).

Author Contributions

Caiyun Qian designed the analytical framework and revised the paper. Yang Zhou co-wrote the paper and revised the paper. Jiadeng Chen constructed the model, analyzed the data and co-wrote the paper. All authors read and approved the final manuscript.

Conflicts of Interest

The authors declare no conflict of interest.

References

  1. Martínez, F.J. Access: The transport-land use economic link. Transp. Res. Part B Methodol. 1995, 29, 457–470. [Google Scholar] [CrossRef]
  2. Ewing, R.; Cervero, R. Travel and the Built Environment: A Meta-Analysis. J. Am. Plan. Assoc. 2010, 76, 265–294. [Google Scholar] [CrossRef]
  3. Huang, Y.Q.; Sun, Y.M. Judgement Characteristics and Quantitative Index of Suitable Block Scale. J. South China Univ. Technol. Nat. Sci. Ed. 2012, 40, 131–138. [Google Scholar]
  4. Zhou, W.Z.; Yang, J.Q.; Ge, T.Y.; Xu, C. Study on three dimensional Land-Use Development: A planning concept based on the reduction of motorized-travel demand. City Plan. Rev. 2012, 36, 51–57. [Google Scholar]
  5. Qiu, B.X. Situation and tasks for development of China’s low carbon eco-city. City Plan. Rev. 2012, 12, 9–18. [Google Scholar]
  6. Lv, J.; Wang, F. Accessibility Research based on the Diverted Routing Factor. Urban Transp. China 2008, 1, 28–31. [Google Scholar]
  7. Lawrence Frank & Co Inc. A Study of Land Use, Transportation, Air Quality and Health in King County, WA; Law-Rence Frank & Co Inc.: King County, WA, USA, 2005. [Google Scholar]
  8. Li, M. Empirical Analysis of Land Use Mixing, Block Scale and Traffic Trip Taking Zhang Jiagang as an Example. In Diversity and Inclusion—Paper Collection of Annual National Planning Conference 2012, Proceedings of the Annual National Planning Conference 2012, Kunming, China, 17–19 October 2012; Urban Planning Society of China: Beijing, China, 2012. [Google Scholar]
  9. Shen, F.; Li, L.; Zhai, H. Road network planning and street design based on the planning pattern of “High Street Density, Small Block Size”: A case study of central district planning in Chenggong new town of Kunming. City Plan. Rev. 2016, 40, 43–53. [Google Scholar]
  10. Calthorpe, P.; Yang, B.J.; Zhang, Q. Transit Oriented Development in China: A Manual of Land-Use and Transportation for Low Carbon Cities; China Architecture & Building Press: Beijing, China, 2014. [Google Scholar]
  11. Pan, H.X.; Tang, Y.; Wu, J.Y.; Lu, Y.; Zhang, Y.F. Spatial Planning Strategy for “Low Carbon Cities” in China. Urban Plan. Forum 2008, 6, 57–64. [Google Scholar]
  12. Qian, L.B. The Research on the Relationship between Degree of Mixed Urban Land-use and Spatial Distribution of Trips: In Case Study of Main Districts in Nanjing. Mod. Urban Res. 2000, 3, 7–10. [Google Scholar]
  13. Lin, H.; Li, J. Relationship between spatial distri-bution of resident trips and mixed degree of land use: A Case Study of Guangzhou. City Plan. Rev. 2008, 9, 53–56. [Google Scholar]
  14. Zhen, S.Q. The Spatial Structure of Urban Economy: Housing, Jobs and Related Urban Issues; Tsinghua University Press: Beijing, China, 2012; pp. 147–153. [Google Scholar]
  15. Ding, C.R. International Perspective and China Development: Urban Growth and Policy; High Education Press: Beijing, China, 2009; pp. 189–193. [Google Scholar]
  16. Ding, C.R. The Impact of Urban Spatial Structure and Land Use Pattern on Urban Transportation. Urban Transp. China 2010, 8, 28–35. [Google Scholar]
  17. Zeng, S.; Yang, P.K. A study of the evaluation of an urban road network by relative index. China J. Highw. Transp. 2000, 13, 95–98. [Google Scholar]
  18. Zeng, S.; Yang, P.K.; Fang, D.B. Accessibility Assessment on Structure of Street Network. J. Tongji Univ. Nat. Sci. Ed. 2001, 29, 666–671. [Google Scholar]
  19. The Official Website of Nanjing Hexi New District Development and Construction Commission. Available online: http://www.newtown.gov.cn/ (accessed on 26 April 2007).
  20. Suzuki, H.; Cervero, R.; Iuchi, K. Transforming Cities with Transit: Transit and Land-Use Integration for Sustainable Urban Development; The World Bank: Washington, DC, USA, 2013. [Google Scholar]
  21. Linneker, B.; Spence, N. Road Transport Infrastructure and Regional Economic Development: The Regional Development Effects of the M25 London Orbital Motorway. J. Transp. Geogr. 1996, 2, 77–92. [Google Scholar] [CrossRef]
  22. Chen, F. Research on Strategy of Low Carbon City: Shanghai Empirical Analysis; China Architecture & Building Press: Beijing, China, 2010. [Google Scholar]
  23. Huang, J.N.; Du, N.R.; Liu, P.; Han, S.S. An Exploration of Land Use Mix Around Residence and Family Commuting Caused Carbon Emission: A Case Study of Wuhan City in China. Urban Plan. Int. 2013, 28, 25–30. [Google Scholar]
  24. Mercado, R.; Paez, A. Determinants of distance traveled with a focus on the elderly: A multilevel analysis in the Hamilton CMA, Canada. J. Transp. Geogr. 2009, 17, 65–76. [Google Scholar] [CrossRef]
  25. Cervero, R.; Kockelman, K. Travel demand and the 3Ds: Density, diversity and design. Transp. Res. Part D Transp. Environ. 1997, 2, 199–219. [Google Scholar] [CrossRef]
  26. Dang, Y.X.; Dong, G.P.; Yu, J.H.; Zhang, W.Z.; Chen, L. Impact of land-use mixed degree on resident’s home-work separation in Beijing. Acta Geogr. Sin. 2015, 70, 919–930. [Google Scholar]
  27. Ma, Q. Vanishing Local Roadways: Consideration of Problem of Local Street System Planning. Planners 2009, 25, 5–10. [Google Scholar]
  28. Maoh, H.; Tang, Z. Determinants of normal and extreme commute distance in a sprawled midsize Canadian city: Evidence from Windsor, Canada. J. Transp. Geogr. 2012, 25, 50–57. [Google Scholar] [CrossRef]
  29. Hansen, W.G. How Accessibility Shapes Land Use. J. Am. Plan. Assoc. 1959, 25, 73–76. [Google Scholar] [CrossRef]
  30. Maćkiewicz, A.; Ratajczak, W. Towards a new definition of topological accessibility. Transp. Res. Part B Methodol. 1996, 30, 47–79. [Google Scholar] [CrossRef]
  31. Pooler, J.A. The use of spatial separation in the measurement of transportation accessibility. Transp. Res. Part A 1995, 29, 421–427. [Google Scholar] [CrossRef]
  32. Nie, W.; Shao, C.F. Research on Accessibility Calculating Method of Regional Transportation. Technol. Econ. Areas Commun. 2008, 4, 85–87. [Google Scholar]
  33. Siksna, A. The Effects of Block Size and Form in North American and Australian City Centres. Urban Morphol. 1997, 1, 19–33. [Google Scholar]
  34. Deutsche Gesellschaft für Technische Zusammenarbeit (GTZ). Sustainable Transport: A Sourcebook for Policy-Makers in Developing Cities; People Communications Press: Beijing, China, 2005. [Google Scholar]
  35. Cai, J.; Lu, X.D. Impact of Road Network Density on Promoting Bus Traffic Development. Urban Transp. China 2016, 14, 1–9. [Google Scholar]
  36. Chen, X.H. Research on Classification System of Urban Roads in Shanghai. Urban Transp. China 2004, 2, 39–45. [Google Scholar]
Figure 1. The location of Nanjing city and the research area.
Sustainability 09 02166 g001
Figure 2. Block scale distribution of Hexi new city central area.
Sustainability 09 02166 g002
Figure 3. Public transport distribution in Hexi new city central area.
Sustainability 09 02166 g003
Figure 4. Distribution of public bicycle in Hexi new city central area.
Sustainability 09 02166 g004
Figure 5. Station distribution of public transport in Hexi new city central area. (Note: Red for bus station, Yellow for metro station, Green for tramcar station).
Sustainability 09 02166 g005
Figure 6. The division of the TAZs.
Sustainability 09 02166 g006
Figure 7. The distribution of different land use.
Sustainability 09 02166 g007
Figure 8. Stack the distribution of the commercial and business facilities with the distribution of public transport.
Sustainability 09 02166 g008
Figure 9. Statistics of travel mode.
Sustainability 09 02166 g009
Figure 10. Survey on residents’ awareness of travel.
Sustainability 09 02166 g010
Figure 11. Frequency data of bus shifts.
Sustainability 09 02166 g011
Figure 12. Bus station accessibility based on the average walking time.
Sustainability 09 02166 g012
Figure 13. OD (Origin and Destination) demands of residents’ travel.
Sustainability 09 02166 g013
Figure 14. Visualization model of walking accessibility.
Sustainability 09 02166 g014
Figure 15. Proportion of the average traveling time.
Sustainability 09 02166 g015
Figure 16. Visualization model of walking accessibility: 25 m × 25 m.
Sustainability 09 02166 g016
Figure 17. Optimization of urban road network.
Sustainability 09 02166 g017
Figure 18. Comparison of walking accessibility before- and after-road network optimization and adjustment.
Sustainability 09 02166 g018
Figure 19. Optimization of bus routing.
Sustainability 09 02166 g019
Figure 20. Usage of public green space in Hexi new city central area.
Sustainability 09 02166 g020
Figure 21. Recommended exclusive bicycle lanes.
Sustainability 09 02166 g021
Table 1. The block scale of the Hexi new city central area.
QuantityLength of North–South Sides of Block (m)
≤150 m150–200 m200–250 m250–300 m300–350 m≥350 m
Length of East–West sides of block (m)≤150 m8341103
150–200 m323311
200–250 m681427913
250–300 m0141025
300–350 m1231131
≥350 m0117313
Sustainability 09 02166 i001
Statistic chart of block size distribution (Corresponding to Table 1)
Table 2. Public transport in Hexi new city central area.
Traffic CategoryTransport Line
MetroMetro Line 2, Metro Line 10
Bus1, 7, 14, 16, 21, 39, 41, 48, 56, 57, 61, 62, 63, 85, 86, 92, 96, 110, 111, 113, 126, 127, 128, 129, 133, 134, 153, 158, 160, 161, 166, 170, 186, 301, 303, 305, 306, 319, 512, 513, 552, 703, 707, Y3, Y7, Y8, Y16, Y18, Y20, D4, D9
TramThe tram line 1 (Planning: the tram line 2, Jiangxinzhou tram line)
Table 3. Statistics of the land use mixed degree.
TAZPercentage of Residential BuildingsPercentage of Administrative and Public Service BuildingsPercentage of Commercial and Business FacilitiesPercentage of Business Office BuildingsLandusemixi
No. 10.760.170.040.020.47
No. 20.870.040.070.020.37
No. 30.750.150.090.020.57
No. 40.800.090.090.010.47
No. 50.800.050.150.56
No. 60.550.100.260.090.81
No. 70.750.090.070.090.6
No. 80.800.040.120.040.5
No. 90.760.090.150.00380.52
No. 100.530.100.180.190.86
No. 110.710.200.090.71
No. 120.010.340.050.560.63
No. 130.770.230.78
No. 141.000
No. 150.760.060.140.050.58
No. 160.620.000320.230.150.66
No. 170.150.190.450.210.93
No. 180.920.050.040.32
No. 190.0020.030.900.27
No. 200.060.350.590.77
No. 210.670.080.070.190.7
No. 220.050.010.110.830.43
No. 230.590.150.020.240.73
No. 240.420.190.390.95
No. 250.030.150.820.5
No. 260.530.440.030.73
No. 270.0030.9970.04
No. 280.610.120.070.140.75
No. 290.030.010.030.930.23
Sustainability 09 02166 i002
Statistical chart of building types distribution and landusemixi value (Corresponding to Table 3)
Note: Red means three types of land use, Blue means two types of land use.

