Article

Detecting Sustainability of Desertification Reversion: Vegetation Trend Analysis in Part of the Agro-Pastoral Transitional Zone in Inner Mongolia, China

1
Northwest Institute of Eco-Environment and Resources, Chinese Academy of Sciences, Lanzhou 730000, China
2
Naiman Desertification Research Station, Northwest Institute of Eco-Environment and Resources, Chinese Academy of Sciences, Tongliao 028300, China
3
CAS Center for Excellence in Tibetan Plateau Earth Sciences, Beijing 100101, China
4
Jiangsu Province Academy of Agricultural Sciences, Nanjing 210014, China
*
Author to whom correspondence should be addressed.
Sustainability 2017, 9(2), 211; https://doi.org/10.3390/su9020211
Submission received: 29 October 2016 / Revised: 26 January 2017 / Accepted: 31 January 2017 / Published: 4 February 2017

Abstract

:
Vegetation dynamics are an important topic in the field of global environment change, which is of great significance to monitor temporal–spatial variability of desertification at regional or global scales. Following the reported desertification reversion in the late 1990s in the Horqin Sandy Land, an issue was concerned for desertification control by decreased water availability. To detect the desertification process, MODIS Normalized Difference Vegetation Index (NDVI) sequences were investigated to analyze the effect on vegetation over the 2000–2015 growing season. Results showed that: (1) NDVI sequences exhibited a positive trend in most of the significant pixels (19.1%–44.7% of the total), particularly in the southeastern part of Horqin, while showing a negative trend of 2.2%–4.3%; (2) NDVI was weakly related to precipitation since 2000, because intensified anthropogenic activities have obscured the impacts of climate variables, with a rapid decrease in grassland, and increase in cropland and woodland; and (3) the improved NDVI was interpreted by expanding cropland and excessive groundwater irrigation, according to the positive effect of grain yield on NDVI all over the Horqin area. For persistent desertification reversion, a land use strategy should be more adaptive to the carrying capacity in this agro-pastoral transitional zone, particularly with respect to water capacity.

1. Introduction

Desertification is one of the major environmental issues, and seriously threatens water-constrained habitat covering 40% of the global land surface [1,2,3]. Building on earlier efforts, the United Nations Rio+20 have developed concrete sustainable development goals (SDGs) for worldwide prevention of desertification, as the Target 3 of Goal 15 mentions: “By 2020, combat desertification, restore degraded land and soil, including land affected by desertification, drought and floods, and strive to achieve a land-degradation-neutral world” [4]. Vegetation dynamics are an important aspect of the desertification process. However, it is controlled latitudinally and elevationally by global environmental change [5,6], or nutrient availability and rainfall seasonality at regional scales [7]. Changes in vegetation composition and structure influence ecosystem stabilization, and further the native access of ecosystem services [8], for instance, forage for herbivores, considerable biomass carbon stocks [9], soil nutrient enrichment [10], and protecting soils and crop seedlings from risks of wind erosion [11]. Therefore, productive land has been closely related to welfare of local populations, particularly household income and health. In desertified areas, vegetation establishment is always a core and effective element for ecosystem restoration [12]. It is of great significance to detect the complex process in perspectives of sustainable development.
The Horqin area (HQA) is located on the vast plain of the West Liaohe River in the southeast of Inner Mongolia between semi-arid and semi-humid regions. Due to disorderly firewood collection, reclamation, and heavy grazing within the last 50–100 years, the primitive landscape was widely desertified from a tree-scattered grassland to a deteriorated sandy ecosystem [13,14]. Recent research shows that artificial vegetation systems have played a remarkable role in land desertification control in Northern China [12,15]. The degree of land desertification was initially mitigated in Horqin Sandy Land according to the reduction of the area of mobile and semi-mobile sand land. However, people’s aspiration for better living standards have not decoupled from simple and economic incentives, and transferred more well-vegetated land into irrigated cropland and overloaded grassland. Simultaneously, this presents a challenge to sustainability of vegetation and soil restoration, coupled with the society and economy in this area. Long-term and effective desertification monitoring is definitely in need. As an important biophysical index, the Normalized Difference Vegetation Index (NDVI) can be widely used to monitor vegetation processes or land use/cover change [16,17,18,19], particularly in the agro-pastoral transitional zone.
Globally, vegetation dynamics have demonstrated a widespread enhancement, which are mainly explained by the CO2 fertilization effect for 70% since the 1980s [20]. In addition, either vegetation degradation or restoration is driven by combined elements of climate change and anthropogenic activity, specifically linked with land use. In the HQA, increasing land use intensity and precipitation variability consistently enhances the fragility of the local ecosystem and become obstacles to sustainable land restoration. Thus, the purpose of this study is: (1) to monitor the vegetation change over 2000–2015 by a spatio-temporal analysis based on MODIS NDVI in the HQA; (2) to explore the effect of climatic variables and anthropogenic activity on vegetation cover; and (3) to detect the sustainability of desertification reversion.

2. Materials and Methods
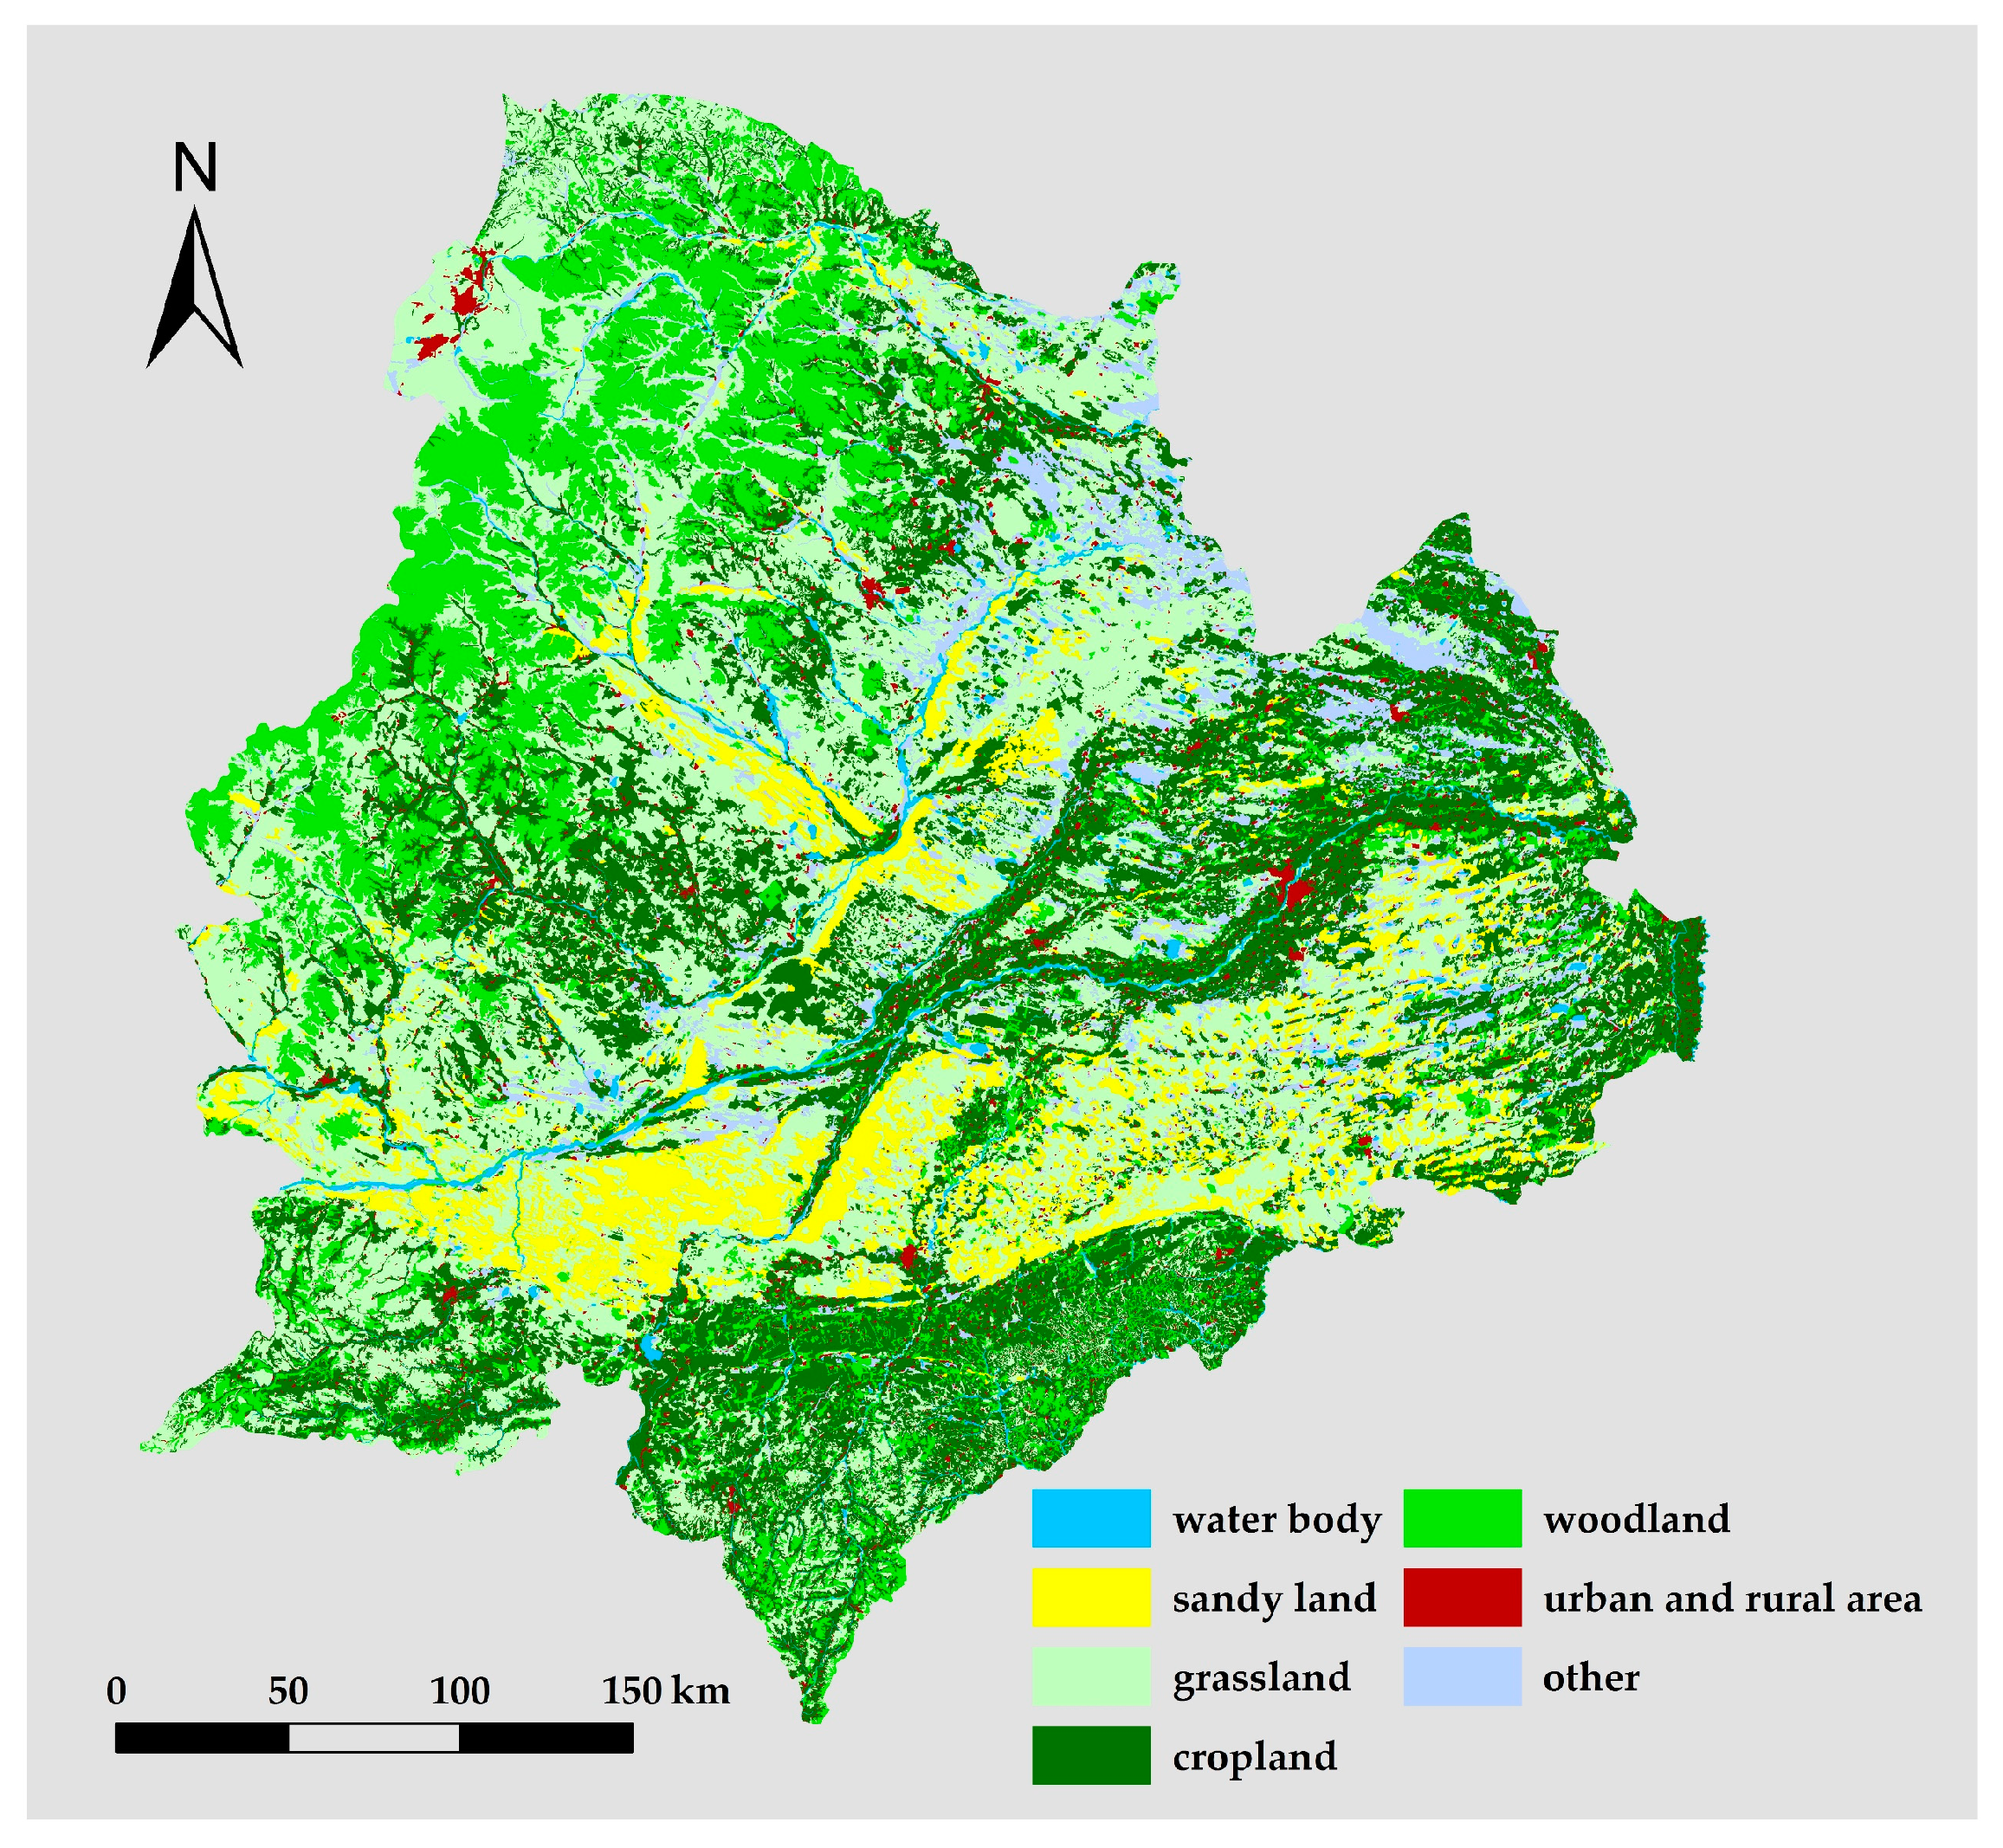
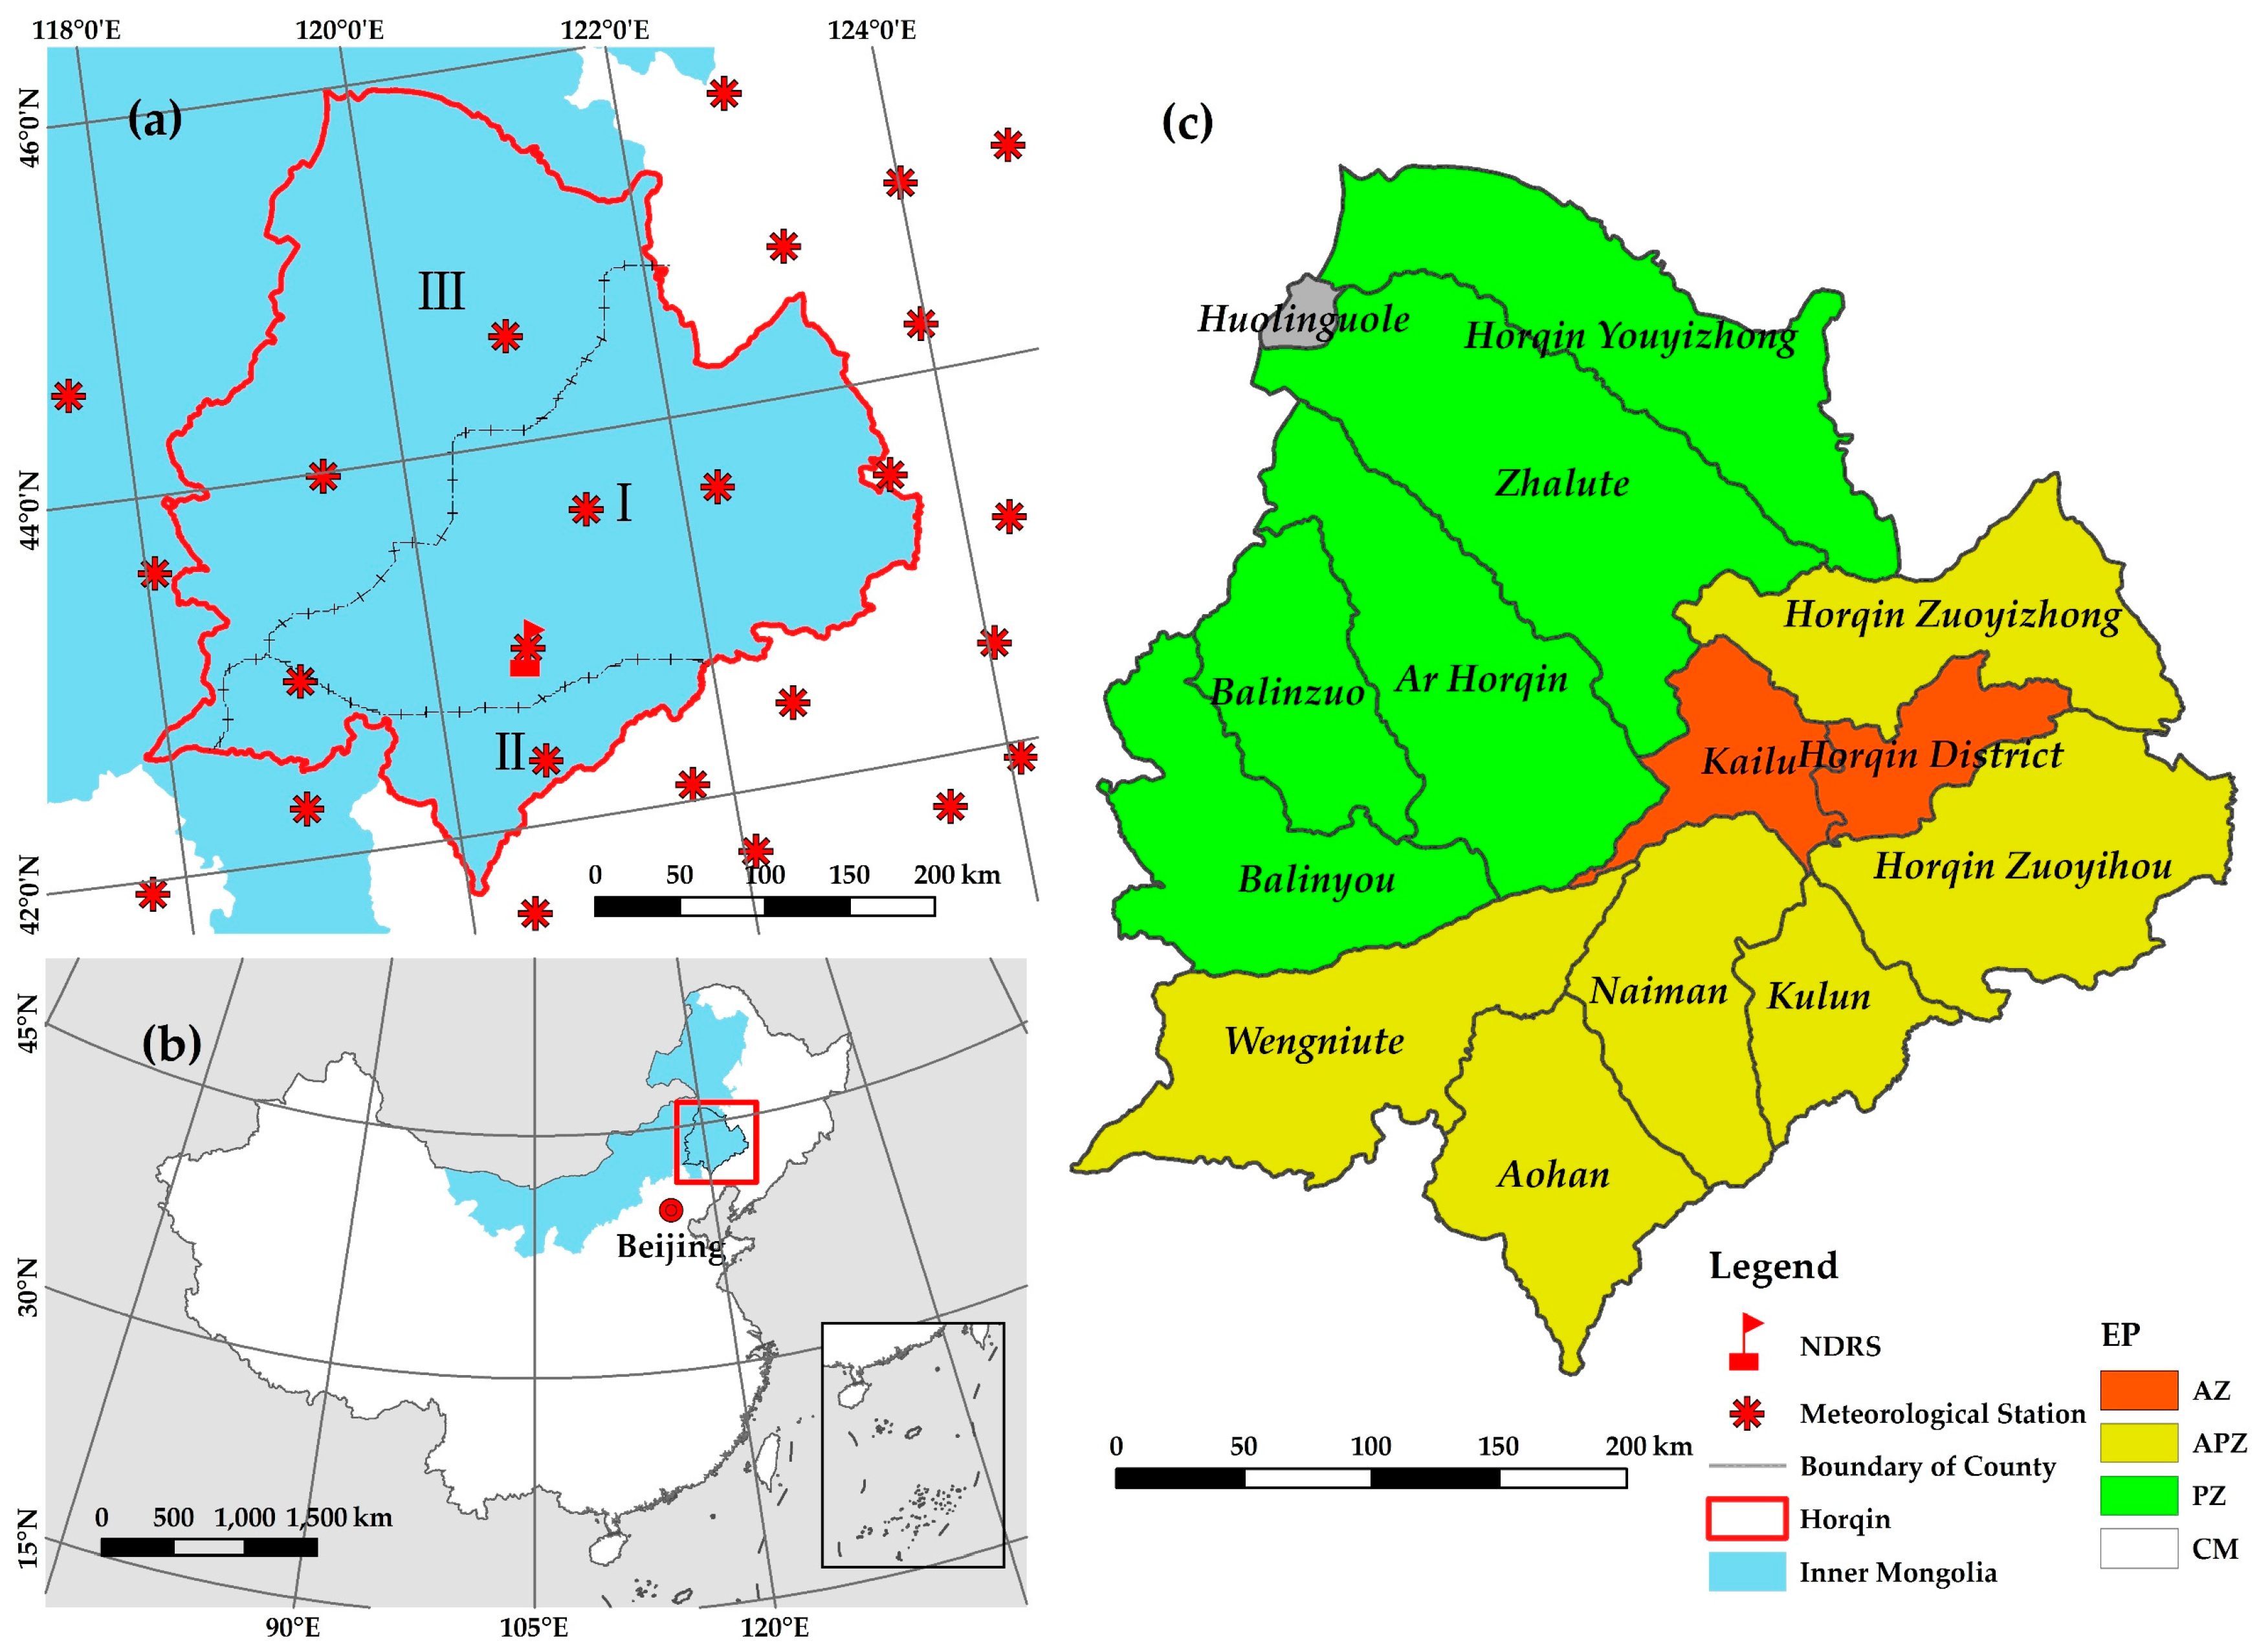
2.1. Study Area

This study was investigated in the HQA, part of the agro-pastoral transitional zone in Inner Mongolia, China (Figure 1). The area has a temperate continental semi-arid monsoonal climate, receiving annual mean precipitation of 350–450 mm, with 75% of the total in the growing season from June to September. The annual mean potential evaporation is 1800–2000 mm and the annual mean temperature is 5.4–6.8 °C. The average annual wind speed is in the range of 3.2–4.5 m·s−1 and the prevailing wind direction is northwest in winter and spring and southwest to south in summer and autumn [21]. Soils include marsh soil in wetlands and flood plain grasslands, meadow soil in meadow habitats and sandy soil in sand lands [22].
The HQA is located in a triangle zone of about 120,000 km2 between the Greater Khingan Mountains and northern mountain area of Hebei Province. The terrain is lower in the central and eastern regions, and higher in the south, north, and west, with the West Liaohe River running through the sandy plain. Traditionally, the HQA can be divided into four sections by different proportions of farming and grazing, or coal-mining industry. It is a comprehensive judgment and different from absolute land use types, and based on agricultural history, climate adaptability, governmental orientation, and population proportion of the Han and Mongol nationality in individual counties. To match the statistical data in this study, we divided 14 administrative counties into the above sections (Figure 1c), including agricultural zones (AZ), semi-agricultural and semi-pasturing zones (APZ), pasturing zones (PZ), and coal mining zones (CM).

2.2. Materials

2.2.1. MODIS 16-Day Composite NDVI Product

The selected NDVI dataset is one subset of the MODIS/Terra Vegetation Indices (MOD13Q1), and has a 16-day repeat cycle at 250 m spatial resolution in the Sinusoidal projection. It is designed to provide global and consistent comparisons of vegetation conditions. A detailed explanation of MOD13Q1 data can be found at Land Processes Distributed Active Archive Center [23]. Annual NDVI sequences were derived from monthly values of the growing season (the warmest five months: May to September) for the period of 2000–2015.

2.2.2. Land Use/Cover and Desertification Data

The monitoring data of land use/cover was provided by Data Center for Resources and Environmental Sciences, Chinese Academy of Sciences [24], including water body, grassland, cropland, and woodland, and based on Landsat image in the late 1980s, 2000, 2005, 2010, and 2015. Mobile, semi-mobile, semi-fixed, and fixed are four grades of sand land corresponding to extremely severe, severe, moderate, and slight degrees of desertification [25]. The types and areas of sand land were provided by previous investigation [15,26].

2.2.3. Meteorological Data and Groundwater Record

Monthly precipitation and temperature were observed by NDRS (Naiman Desertification Research Station) and the China meteorological data sharing service system of the China Meteorological Administration (Figure 1a) over the years 1960–2015. Climatological parameters of warmth and wetness are derived from the Warmth Index (WI) in Kira’s 1948 study and the Humidity Index (HI) in Xu’s 1985 study on vegetation [27,28], as shown in the following formula:
W I = i ( t i 5 )
H I = P / W I
where ti is the monthly mean air temperature exceeding 5 °C and P is the annual precipitation. To focus on the growing season, WI was analyzed instead of air temperature. The annual P and WI were interpolated by site observation data from 49 meteorological stations by the Kriging method [29], and the mean value in individual counties was calculated for a multivariate analysis. Data of the groundwater depth was observed through phreatic wells by NDRS and the Institute of water conservancy survey and designing, Tongliao City, Inner Mongolia.

2.2.4. Socioeconomic Data

Data of primary industries (PI), consumption of chemical fertilizers (CCF), electricity consumed in rural areas (ECRA), and yield of grain (YG) were excerpted from Inner Mongolia Statistical Yearbooks (statistical data from 2000 to 2015) [30,31,32,33,34,35,36,37,38,39,40,41,42,43,44,45]. As the northward movement of farming boundary in the HQA, the four indicators had a close relationship with farming. The indicator of sheep and goats (SG), as well as large animals (LA) such as cattle and horses, was used in a multivariate analysis.

2.3. Method

2.3.1. Trend Analysis

A linear regression method is always used to detect variation within a sequence of data. In this study, the change rates of NDVI were analyzed for individual counties or pixels, as shown in the following formula:
Θ s l o p e = n × i = 1 n i × N D V I i ( i = 1 n i ) ( i = 1 n N D V I i ) n × i = 1 n i 2 ( i = 1 n i ) 2
where Θslope is the slope of unary linear regression equation; NDVIi is the annual mean value of the growing season in the ith year; n is the number of years between 2000–2015. In addition, the annual maximum NDVI is also used in the above equation by maximum value compositing (MVC) method [16,18]. When Θslope < 0, it indicates a decrease in NDVI for the period, and vice versa. The significance of slope is calculated by the Student’s t-test.
The nonparametric Mann–Kendall (MK) test was performed for testing the significance of change [46,47]. The trends of P, WI, and HI were detected as site observation data by the MK method.

2.3.2. Path Analysis

Path analysis was developed by Sewall Wright in the 1920s [48]. The approach is a standard multiple linear regression model. It is widely used to describe direct and indirect factors to dependent variable. More detailed explanation can be found in the investigation [49]. The coefficient of determination (CD) (0 ≤ R2 ≤ 1) can be subdivided into the direct CD ( i = 1 p R i 2 ) and indirect CD ( i < j p 1 R i j 2 ). For a specified pathway (xixj→y, j = 1, 2, …, p), the direct path coefficient (4), the total of indirect path coefficient (5), and the decision coefficient (DC) (6) are shown in the following formula:
R i = b i
j i R i j = j i r i j b j
R ( i ) 2 = R i 2 + j i R i j 2 = ( b i ) 2 + 2 j i b i r i j b j = 2 b i r i y b i 2
where y is dependent variable NDVI; rij is the correlation coefficient between xi and xj; riy is the correlation coefficient between xi and y. When DC ( R ( i ) 2 ) > 0, it demonstrates that xi will strengthen the decision capacity on y; on the contrary (DC < 0), it shows that xi will weaken the decision capacity on y.

3. Results and Discussion

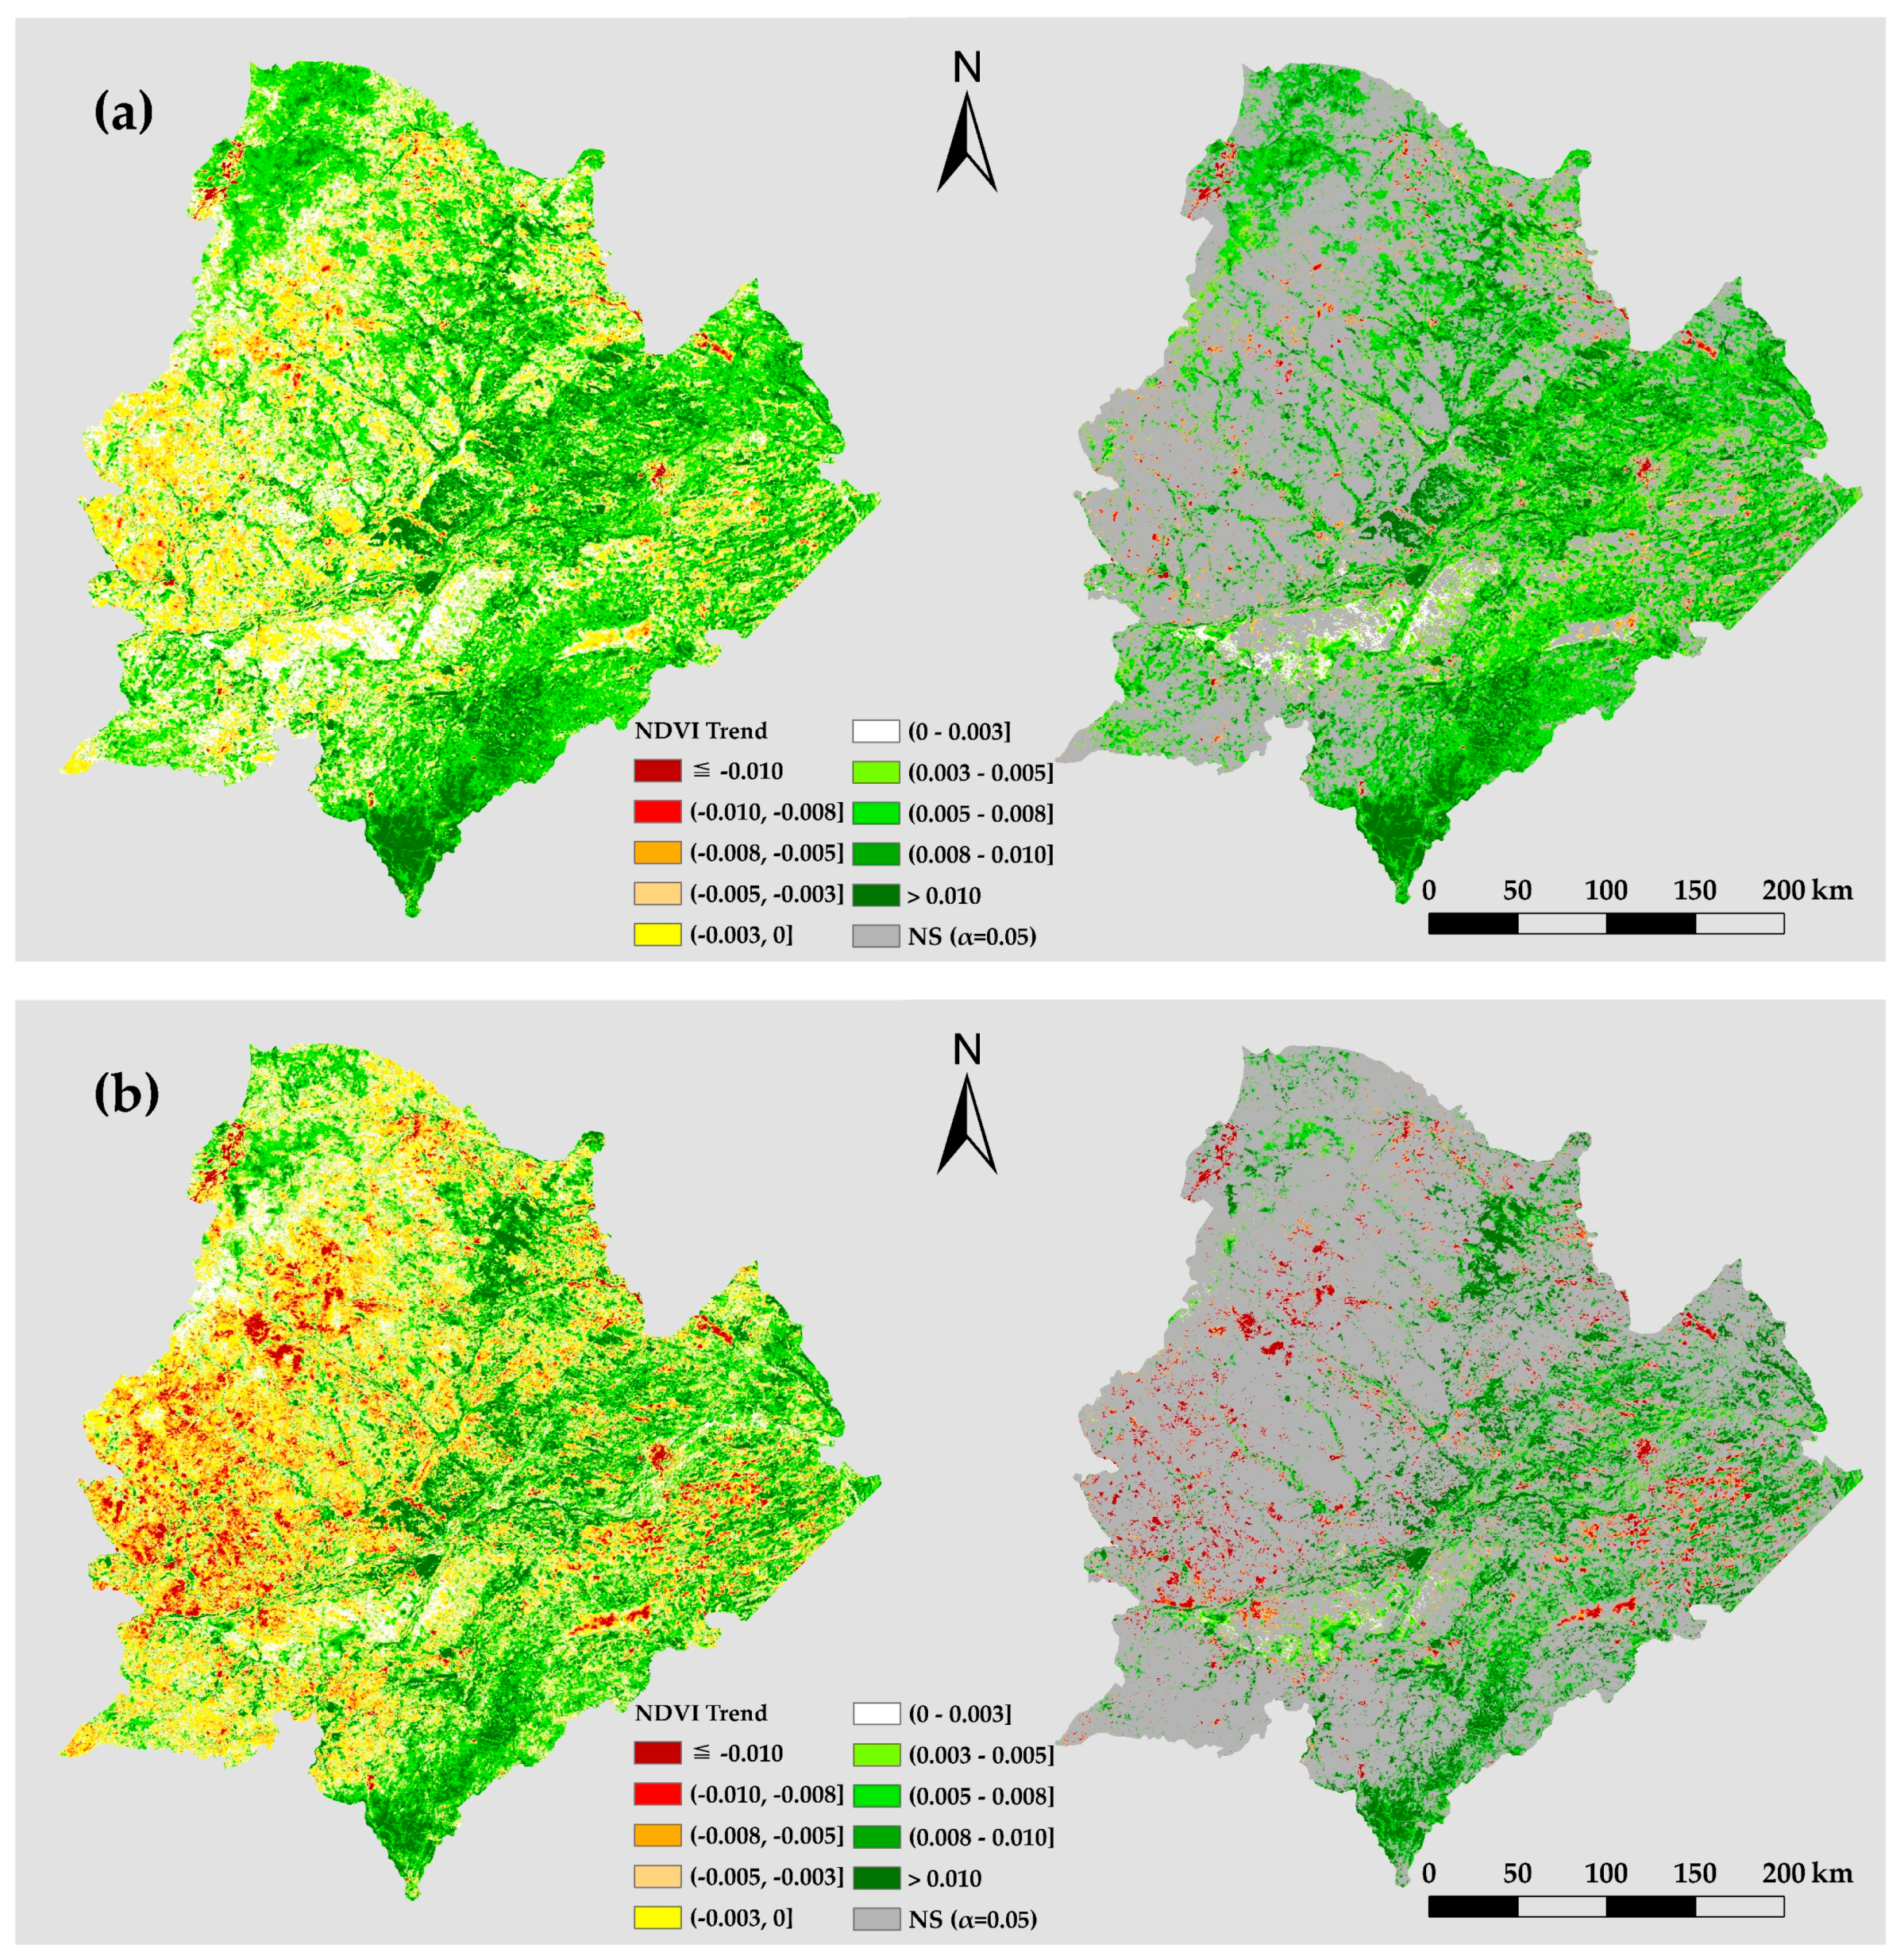
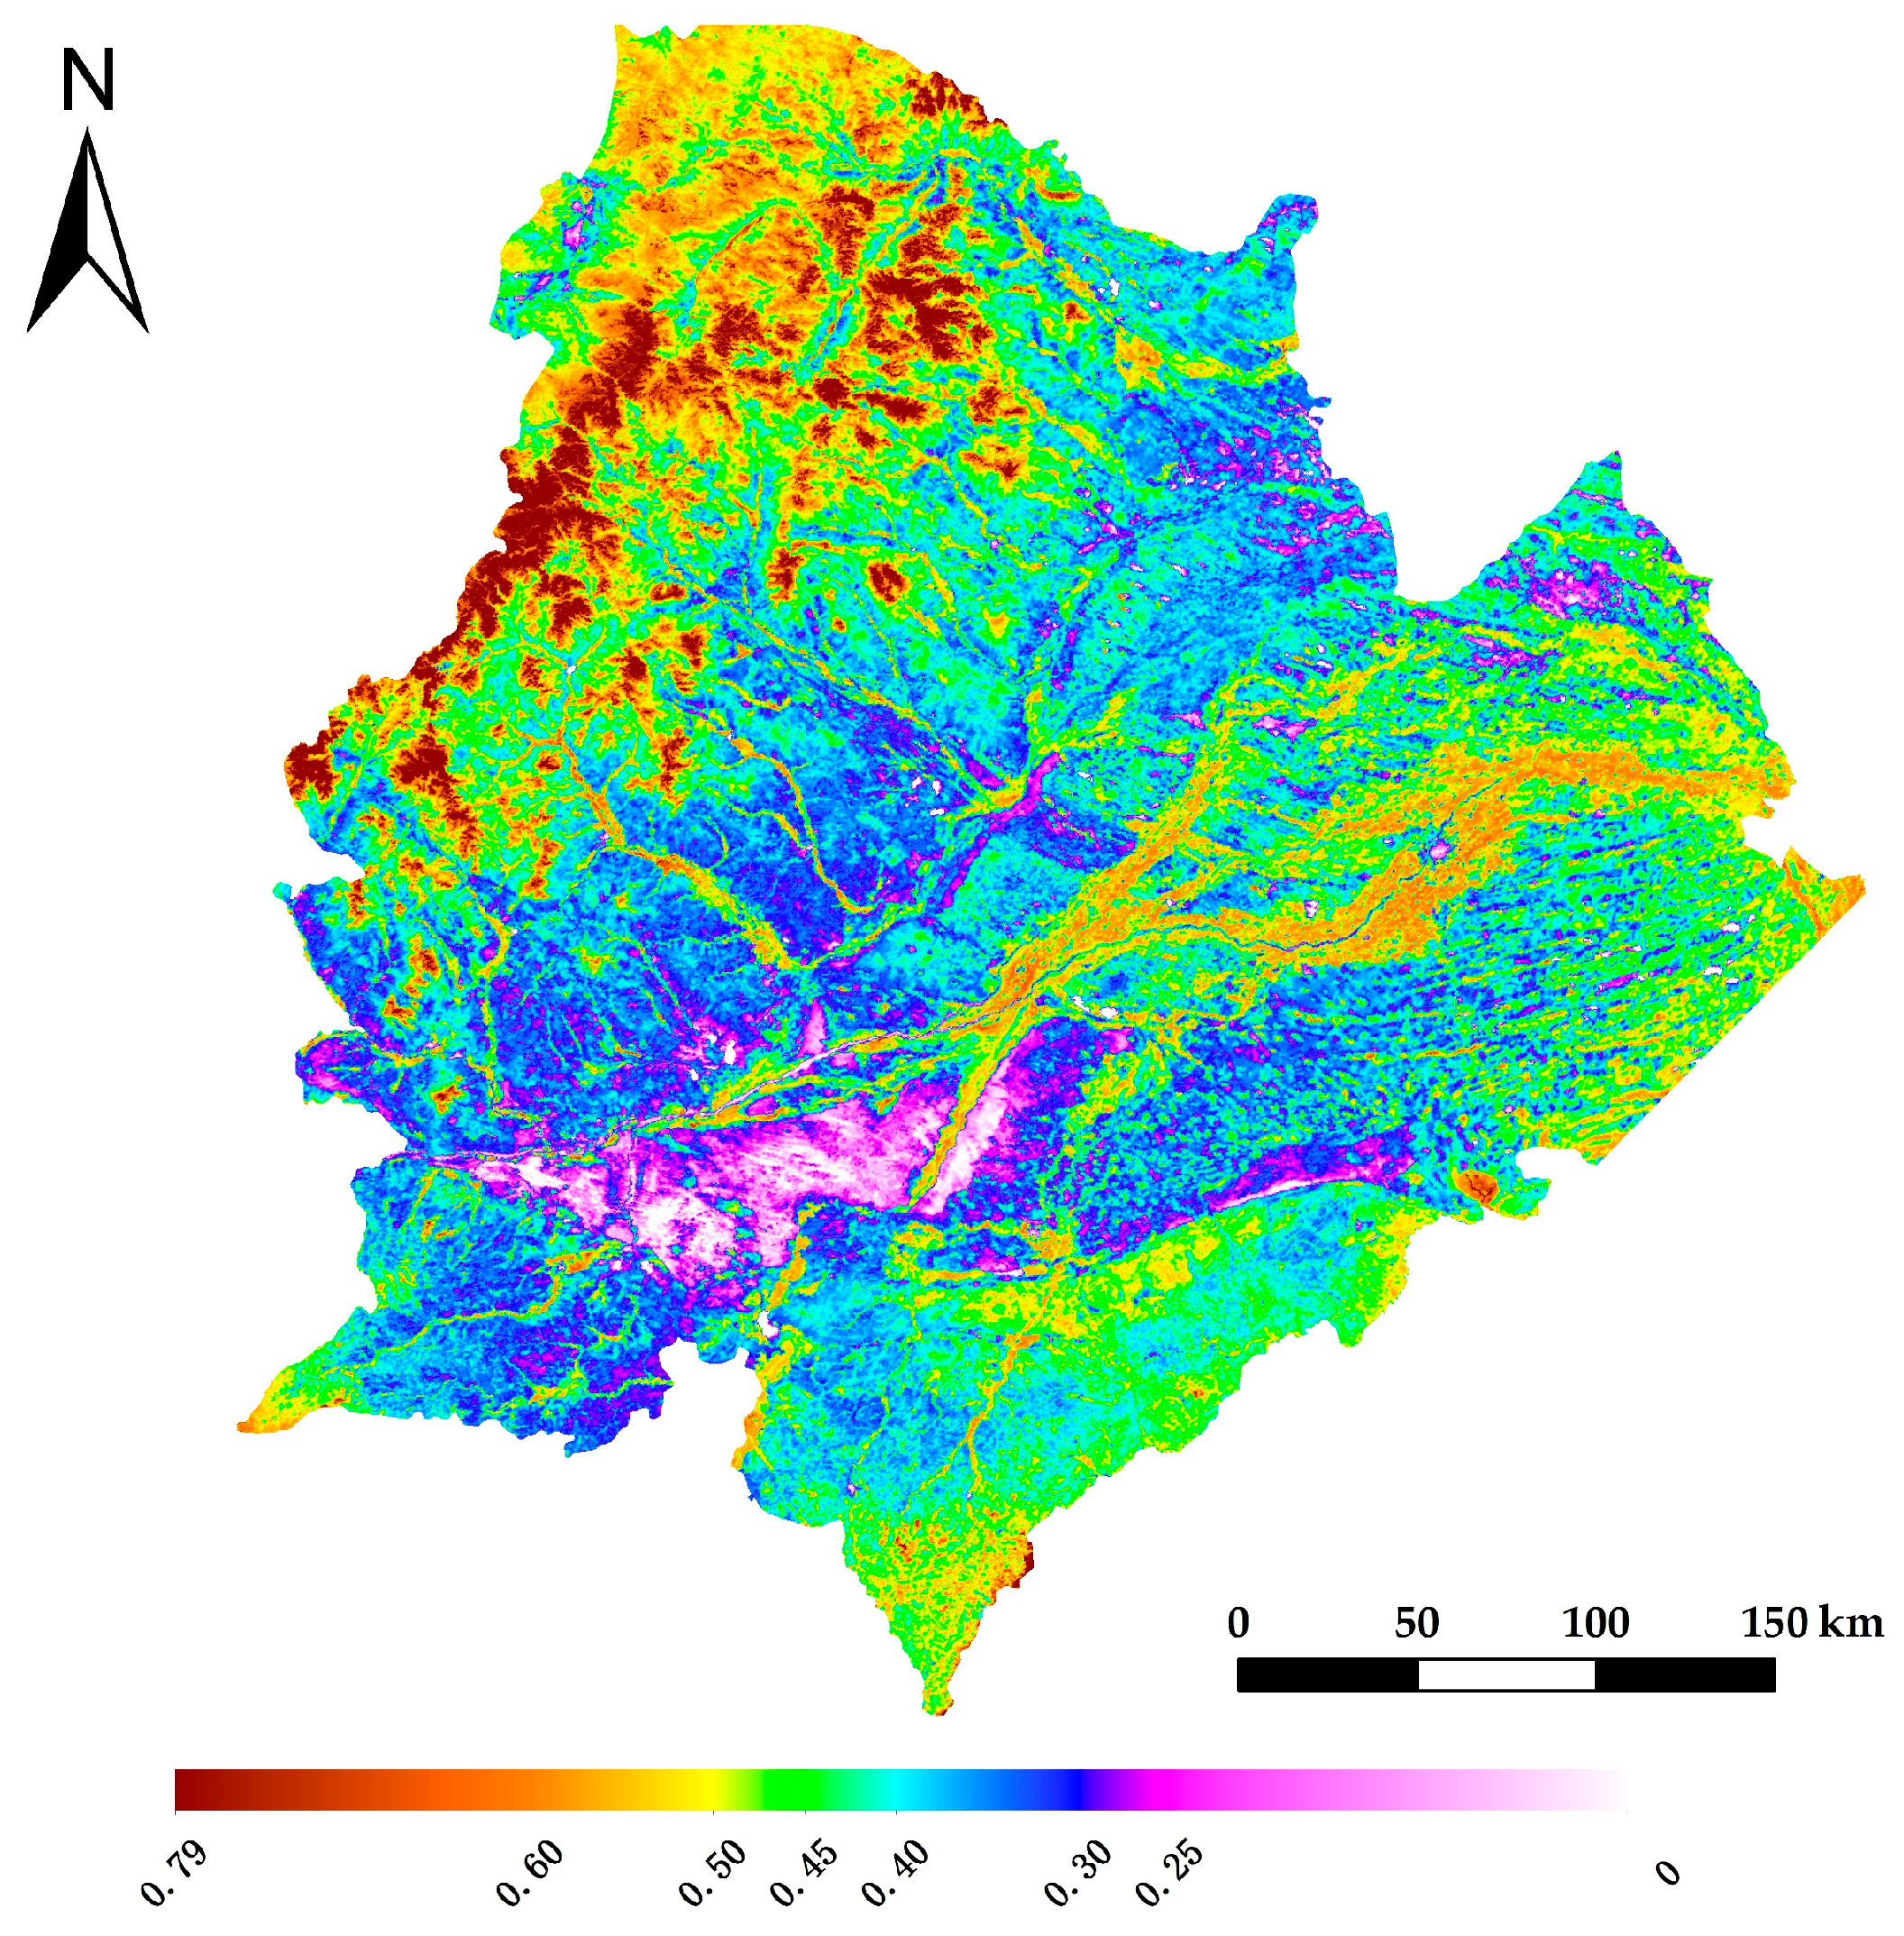
3.1. Spatial-Temporal Process of Annual NDVI

As an effect of the phenological phase, variation of monthly NDVI usually presents a unimodal curve within a year [50,51]. In the HQA, the top five months are mostly in May–September, with an annual maximum value in July or August. For the inter-annual change in individual counties (Table 1), it had positive and significant trends in more than half of the counties by the mean method. The trends were consistently greater and characterized by higher R2 than that of the MVC method, for instance, in Horqin District (66.7% to 41.0%), Naiman (76.2% to 44.0%), as well as Kailu County (86.2% to 66.0%).
For aggregated pixels (Figure 2), positive trends appeared in most parts of the HQA. In Figure 2a, greatly improved pixels were mainly in the south and center, accounting for 15.9% of the total, while 41.7% were slightly improved according to the statistics in Table 2. Negative trends were mainly in the north and west, accounting for 4.7% of the total, and only 0.6% of pixels were greatly degraded. By contrast, results of Figure 2b show that greatly improved pixels were lessened to 13.6%, while slightly improved pixels were 27.4%. The significant pixels took up an area of 46.9% and 23.4% in Figure 2a,b, respectively, including 44.7% and 19.1% characterized by improvement. It showed that the mean method was more comprehensive to grazing or agricultural activities than that of MVC, because it involved all monthly information of the growing season. However, the method had a disadvantage in that the possibility was increased for disturbances of phenological phase or clouds.
Generally, it is better to monitor NDVI variation based on the same sensor, because differences exist among various datasets [18,52]. At global and continental scales, the MODIS NDVI trend showed a total of significant pixels of 11.8% and 10.1% by the MVC method, respectively, including 5.4% and 7.9% characterized by positive trends in 2000–2010 [52]. Globally, leaf area index also showed a persistent and widespread increase in 25%–50% of vegetated area, while no more than 4% decreased [20]. In China, a significant trend was also demonstrated in 31.7% of the pixels, including 25.4% characterized by positive trend. Therefore, vegetation enhancement has been observed in many regions. This suggests that the vegetation restoration has effectively controlled desertified areas compared with the past.

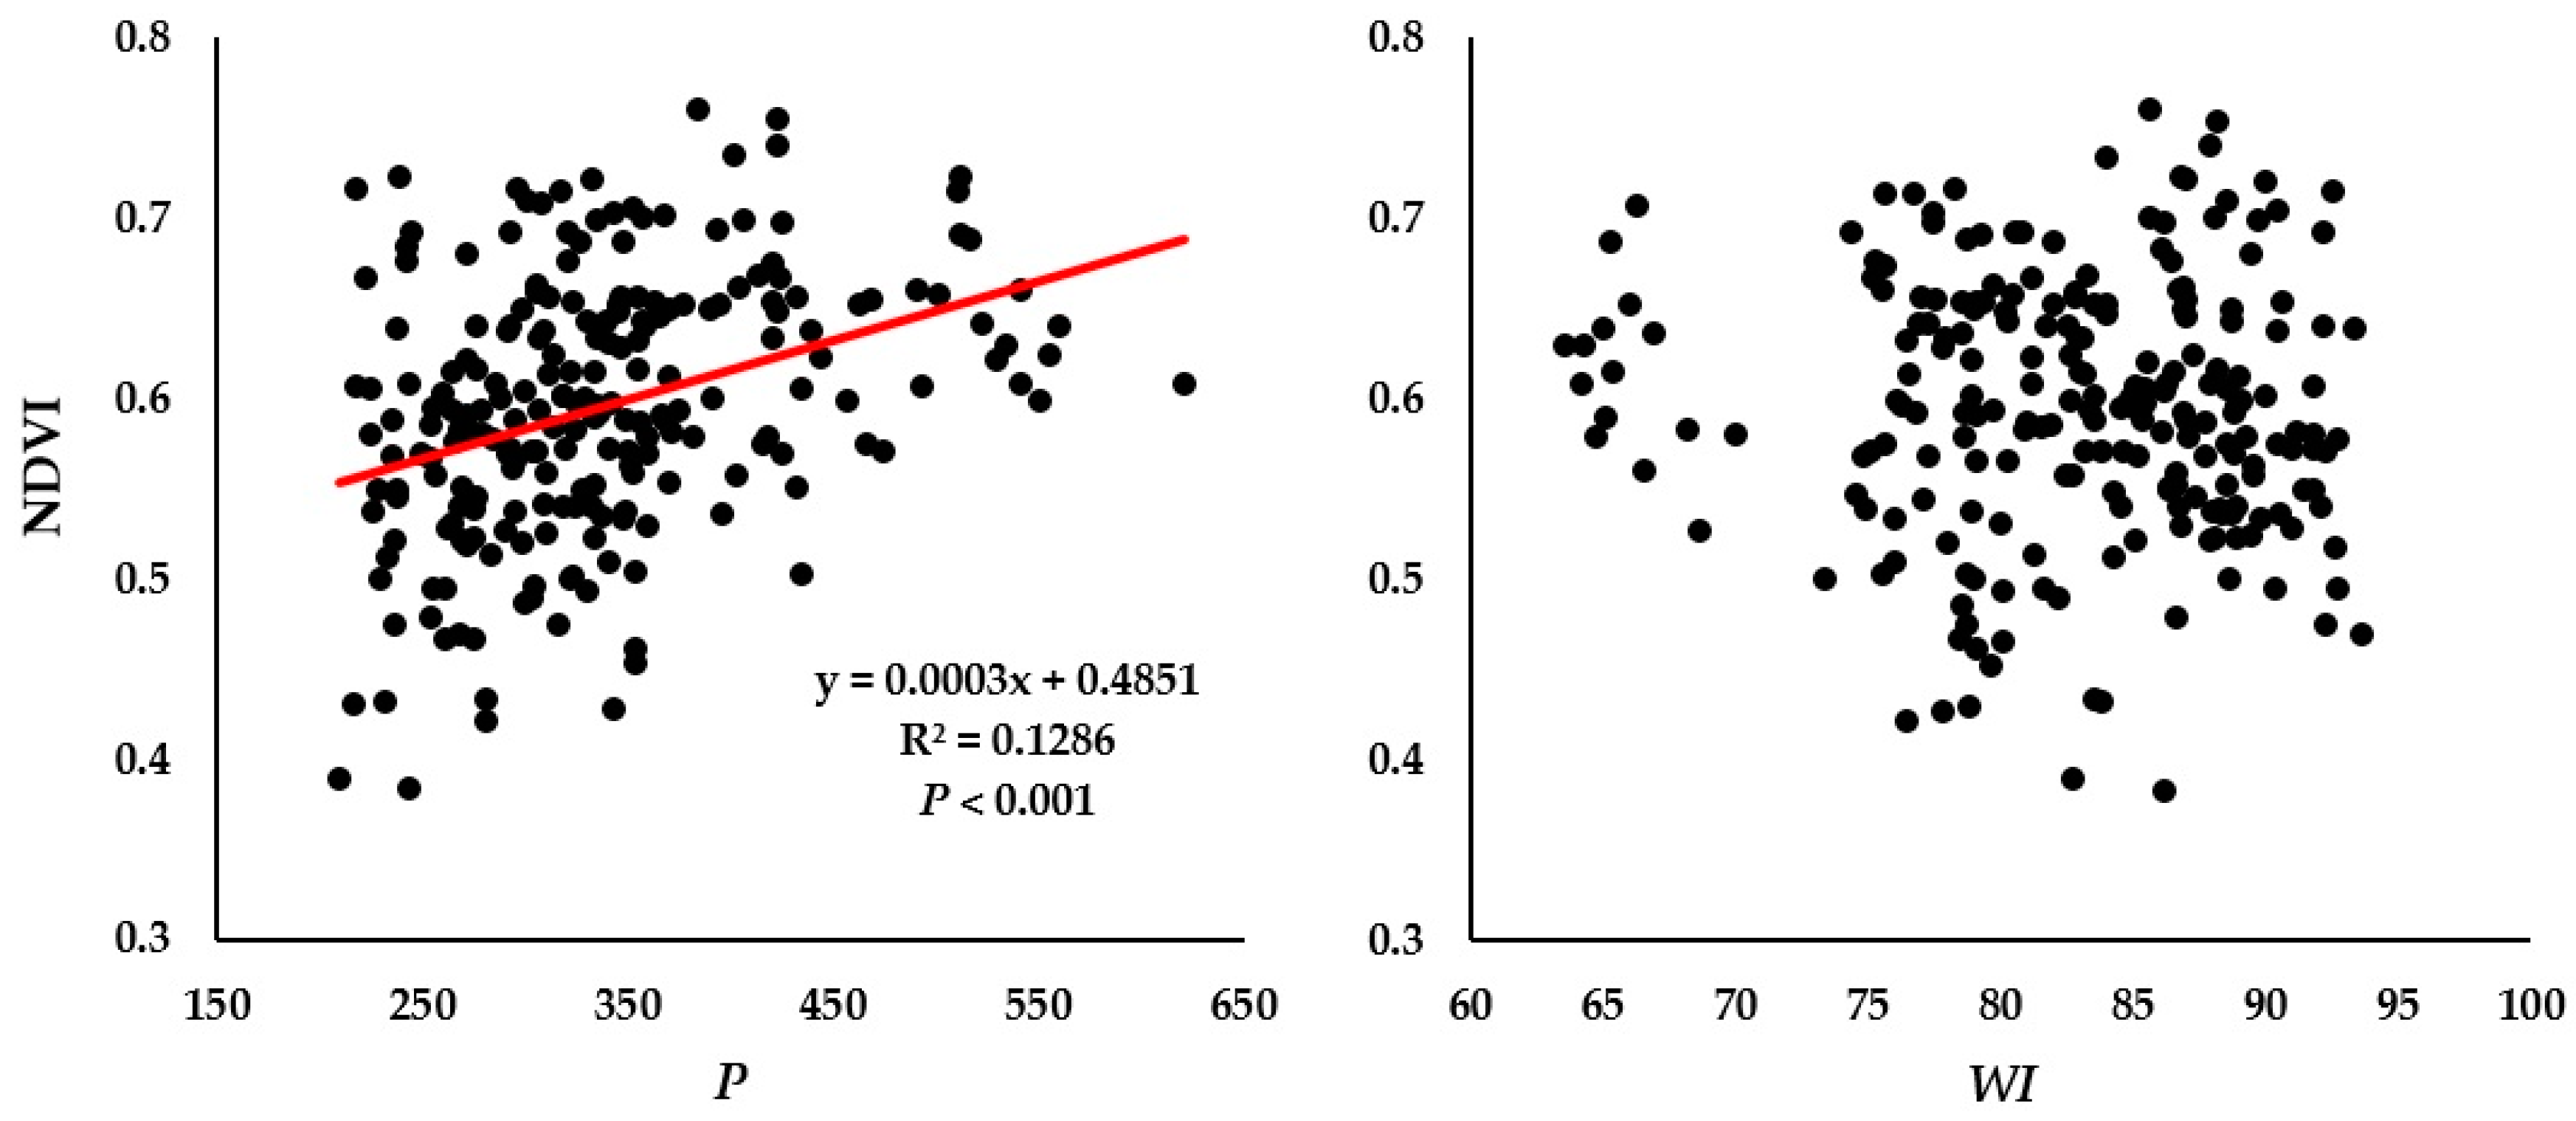
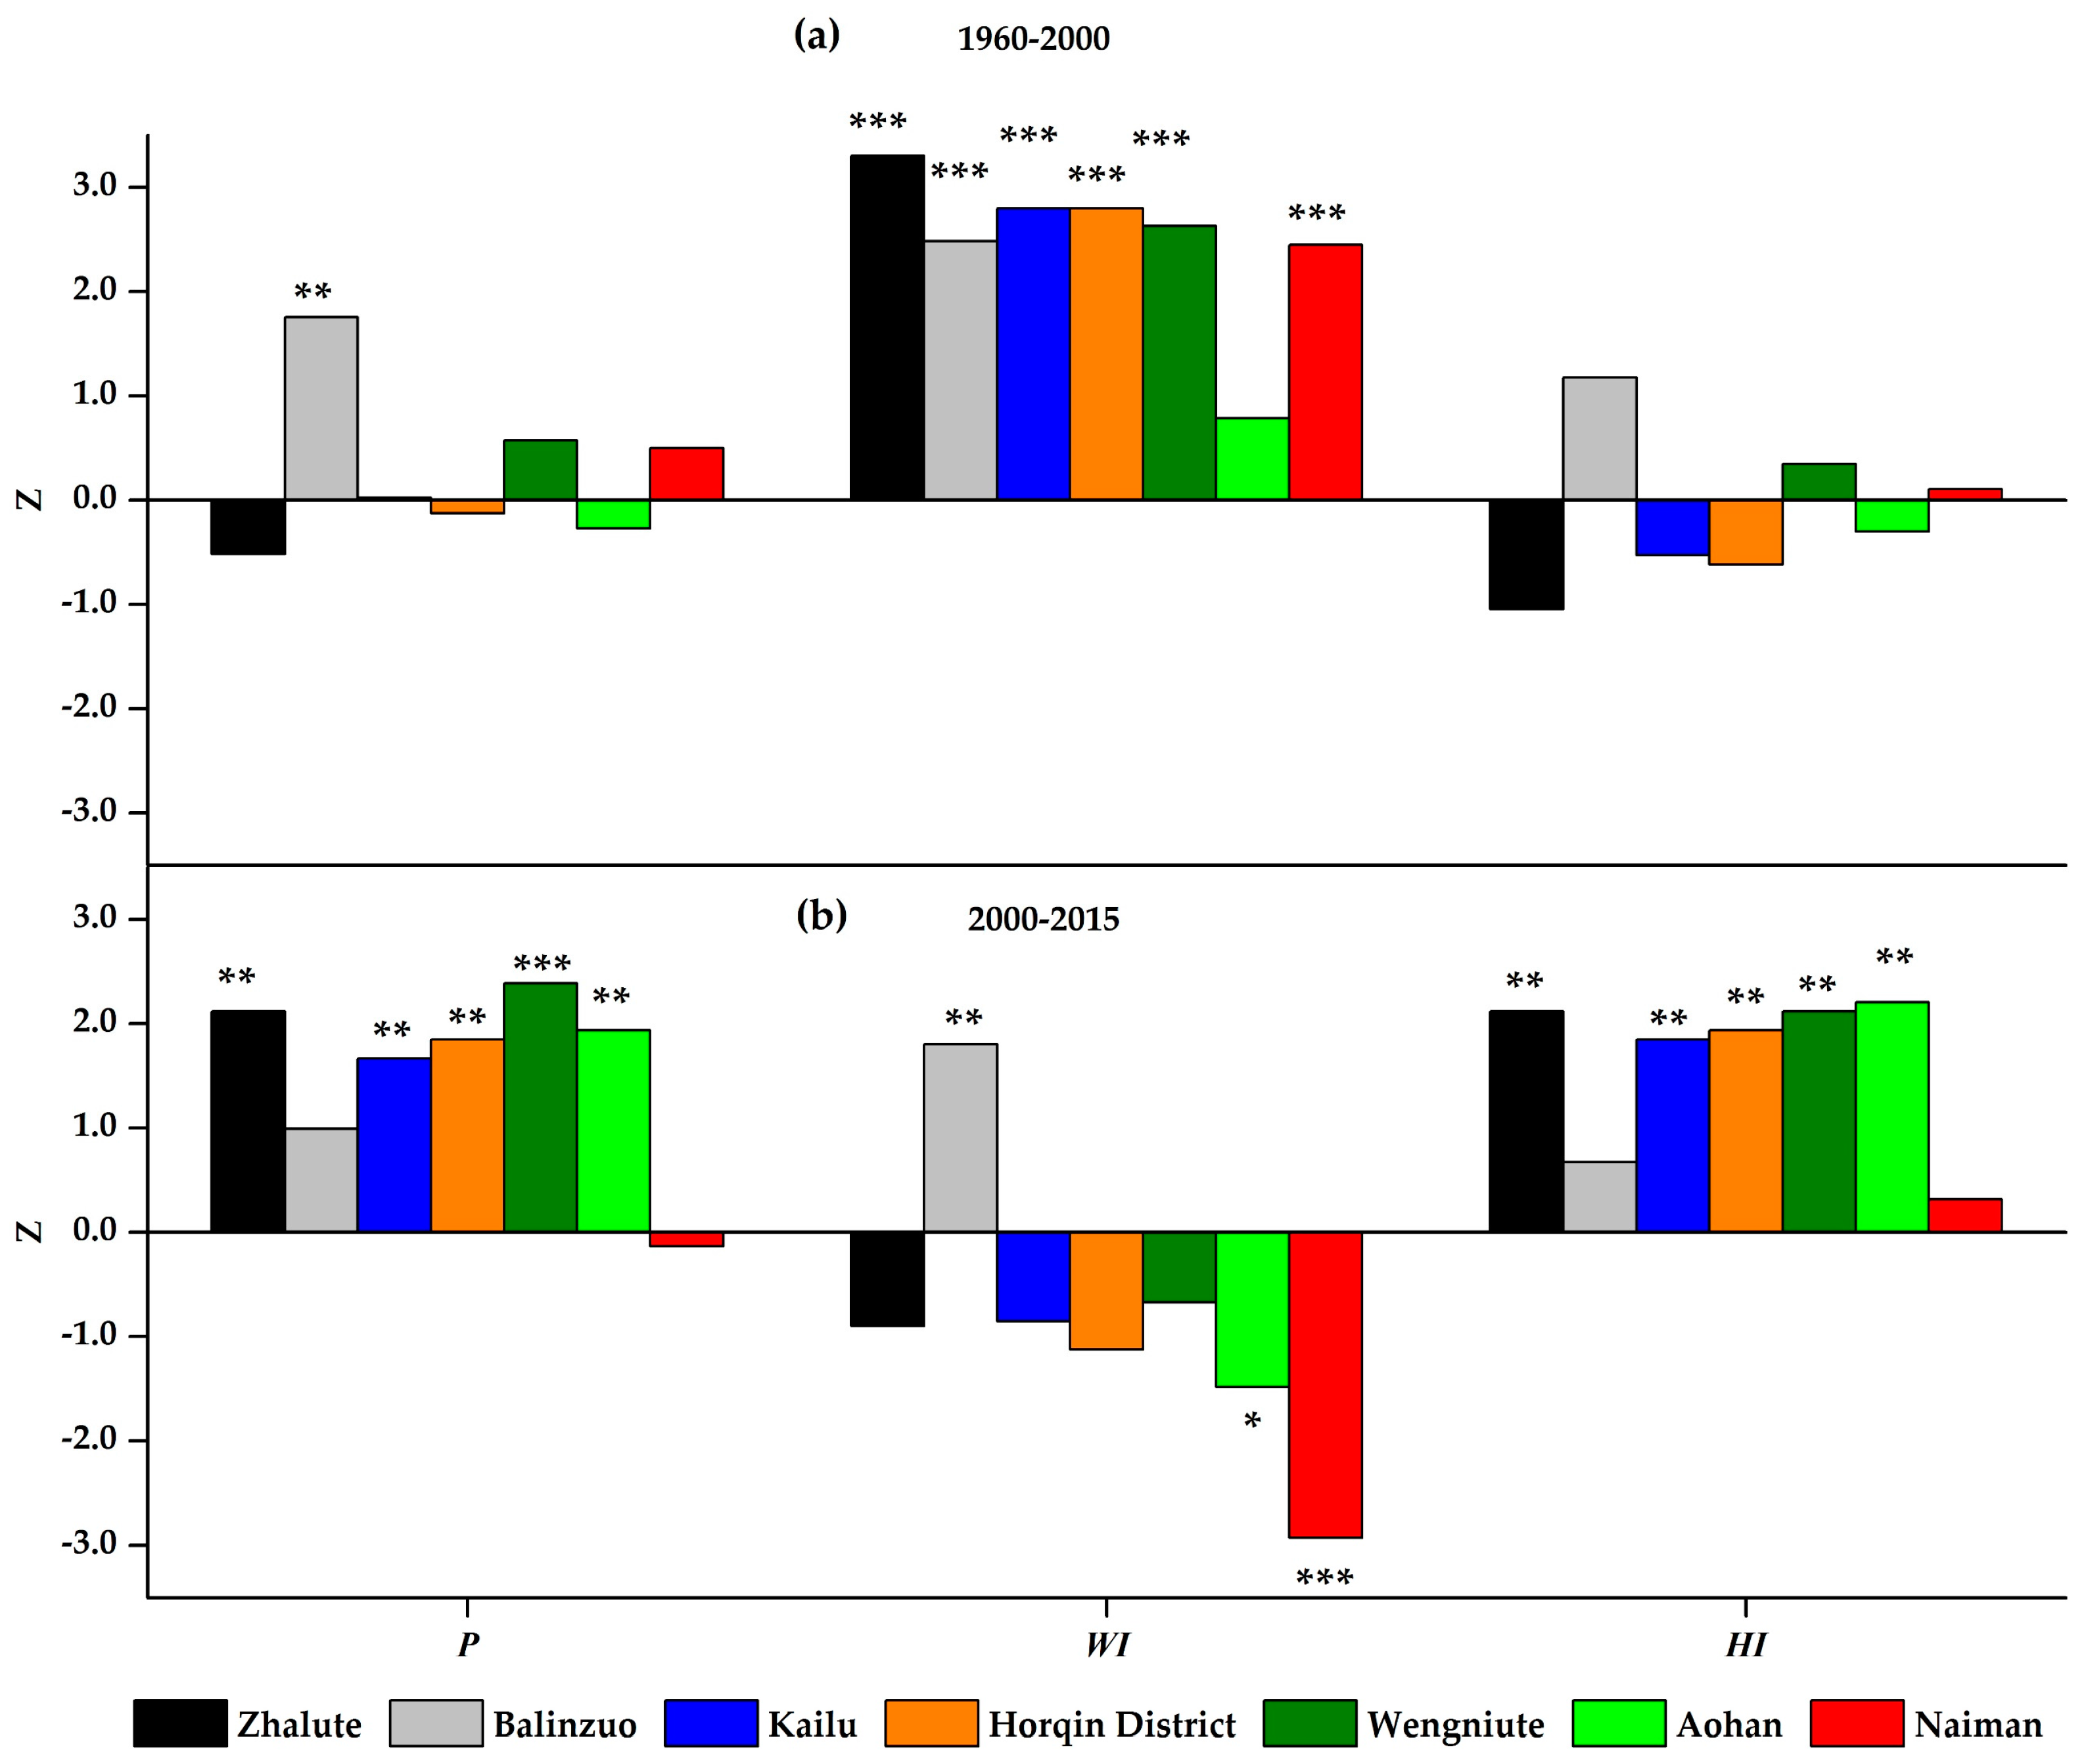
3.2. Effect of Climate Variables on NDVI

In Figure 3, the climate variables were tested in two periods since 1960. Significantly, it demonstrated a warming process over the period (a) of 1960–2000. Since 2000, the trend of WI turned into the negative, while P and HI showed positive and significant trends at most stations. The two-stage comparison showed an effect of interdecadal climatic fluctuation, which mitigated water limitation by increasing rainfall in the period (b) of 2000–2015, though it began at an extremely low level around 2000 [53]. As shown in previous research, over the last half-century, the annual mean temperature, precipitation, and relative humidity suggested a warming and drying trend in the Horqin Sandy Land [54]; over 1979–2010, the soil moisture of land surface was significantly decrease in the Liaohe Basin [55]; after 1997, a national “warming hiatus” and increase in “flash droughts” were observed in Northeastern China [56]. Thus, the trend of climate still involved uncertainties and gaps among increased rainfall, droughts, and vegetation enhancement in the HQA.
From the microscale to macroscale, the feedback was not consistent between vegetation and climate variables. As revealed from global NDVI or LAI change, water dominated middle and low latitudes, while warmth dominated high latitudes and the Tibetan Plateau [20,27]; apart from global regimes, the relationship was also diversified and determined by vegetation type and pattern [57,58]. However, NDVI was weakly related to P (R2 = 12.9%) and had a non-significant relationship with WI by county (Figure 4). The first reasonable explanation may be an increase in total rainfall, extreme rainfall events [59], and no rain days, which brought about aggravated drought or secondary effects on vegetated and cropped areas, such as frequent hails, and widespread locust plagues in recent years; secondly, due to desertification, restoration, and cultivation for decades, the HQA had a highly fragmented landscape, which obscured the effects of climate on vegetation. In addition, warmth limitation was obviously weaker than water constraints on vegetation in desertified area.

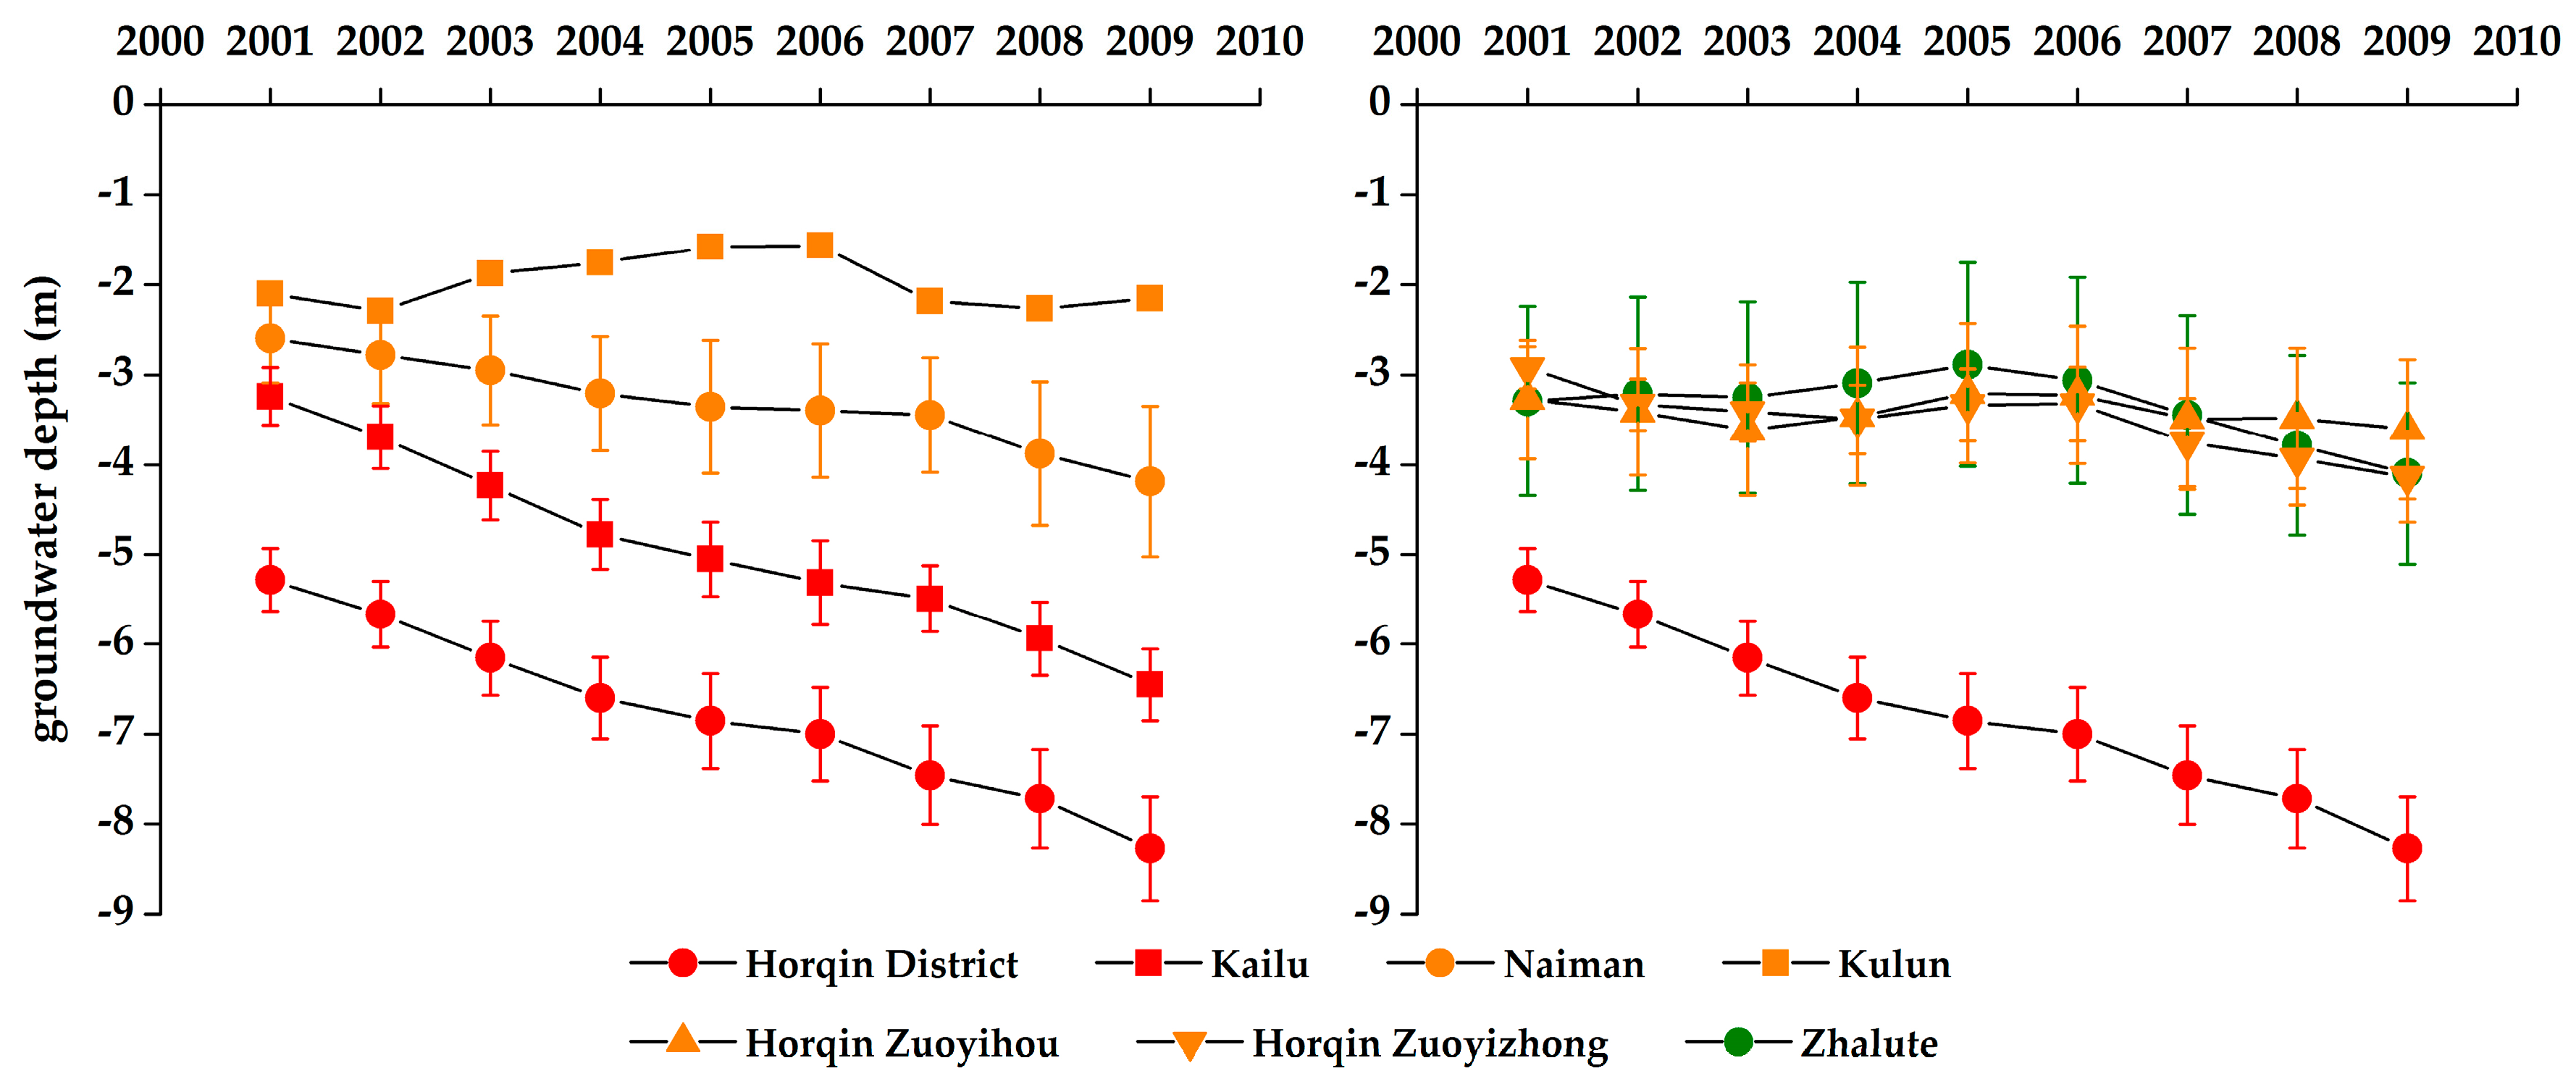
3.3. Effect of Human Activities on NDVI

According to Figure 5 and Figure 6, NDVI was a credible and quantitative index coupling with land cover information. It suggests a clear spatial pattern of NDVI values that are strongly linked with land cover types. For instance, the lowest area was mainly of severely desertified land (0–0.30); in the northwest, the highest area was comprised of arboreal forests and shrub patches on stretching branches of the Greater Khingan Mountains (0.60–0.79); areas of medium values were mainly irrigated cropland along rivers (0.50–0.60).
In Table 3, it showed that the water bodies accounted for an area of 956 km2 in the late 1980s and decreased by 44.8% to 527 km2 in 2015. Expectedly, the areas of mobile, semi-mobile, and semi-fixed sand land showed a downward change after 2000. Many studies have reported the two stages of desertification development and reversion due to vegetation establishment and protective policy in the HQA [26,54,60]. Grassland, cropland, and woodland were the three main land cover types in the agro-pastoral transitional zone. In spite of the desertification reversion and the national “Grain to Green” program that began in 1999, total grassland area rapidly declined from 46.8% to 37.8%; and cropland and woodland substantially increased by 2.2% and 5.9%, respectively. Overall, the land cover change has shown a process that the desertification degree was mitigated and has gradually reversed since 2000.
In AZ and some counties in APZ, the correlation was much stronger between NDVI and the four indicators, while no relationship in PZ (Table 4). Because maize cultivation played a dominant role in the agricultural industry in the HQA. Due to high FVC in maize fields through its jointing to mature stages, NDVI was substantially increased when the land was reclaimed, for instance, in dried lake or well-vegetated grassland. Particularly, an indicator of ECRA can indirectly reflect consumed water amounts by ground water withdrawals as well as reduced firewood collection by electric appliances in rural areas.

3.4. The Sustainability of Desertification Reversion in the HQA

The groundwater level was deepest and decreased sharply in Horqin District and Kailu County, respectively, as well as in Naiman County (Figure 7), in the order of Kailu County (0.36 m/a) > Horqin District (0.33 m/a) > Naiman County (0.18 m/a). During the same period, the depth was just slightly fluctuated in some APZ and PZ. In the early stage, crops were mainly irrigated by river water or rainfall; since the late 1990s, the deficit of water demand became more serious. In recent years, irrigation facilities have been widely used in flat areas, and irrigation water can be easily applied by submerged pumps only at the expense of the charge for electricity. Due to local droughts and irrigation in the upper reaches, the surface runoff decreased, and the lake shrank. In the research of the Mongolian Plateau [61], and inland basin of Heihe River [62] and Minqin Oasis [63], water constraint was also primarily attributed to increased irrigation demand or decreased rainfall. It was the most common conflict related to water usage in semi-arid or arid river basins [64]. However, utilization of water-saving equipment is quite limited, just a few center pivot irrigation systems [65] in artificial pastures or movable sprinklers in peanut fields. On the other hand, afforestation caused increased water consumption in the deep soil layer, while native herbaceous plants used less rainfall in the surface soil layer [12]. Although important achievements in artificial revegetation have been made, high density and inappropriate species of afforestation may cause serious concerns over groundwater shortage [66]. In summary, intensified anthropogenic activities are seriously challenging the carrying capacity of irrigation agriculture and afforestation, particularly water capacity.
To reveal the relationship of NDVI with multiple climate and anthropogenic variables (P, WI, CCF, ECRA, YG, LA, and SG), the path analysis was used to decouple direct and indirect effect (Table 5), based on a step-wise linear regression model in the same dimension for AZ (7), APZ (8), and PZ (9), respectively:
NDVI = −3.586 × 10⁻¹⁶ + 1.036 × YG − 0.559 × SG       R2 = 0.827
NDVI = −1.012 × 10⁻¹⁵ + 0.443 × P + 0.293 × YG + 0.305 × WI + 0.197 × ECRA  R2 = 0.432
NDVI = 9.653 × 10⁻¹⁶ + 0.307 × P + 0.596 × YG − 0.349 × CCF      R2 = 0.354
In the AZ, YG had the strongest and direct effect of 1.036 on NDVI and an indirect and negative effect of 0.270 (YGSGNDVI). In the APZ, NDVI was successively and directly affected by P, WI, YG, and ECRA (from 0.443 to 0.197), and the total indirect effects were particularly weak (from 0.003 to 0.163). This result can be interpreted by rain-fed crop–grass–tree mosaics in the southern mountain areas, and expanding irrigated cropland in the central sandy plain. In the PZ of Northwestern HQA, NDVI was affected by P, YG, and CCF. The total indirect effect of CCF (0.649) was stronger than that of P (0.212) and YG (−0.094). In the summary of DC, it showed that YG had an enhancement effect on NDVI all over the HQA, as well as P in APZ and PZ, while SG, WI, and CCF had effects of limitation in AZ, APZ, and PZ, respectively. This provided important evidence that the farming boundary had moved northward into the PZ section in recent decades. The rural people of Han nationality depend on farming, while the Mongols are no longer nomadic and have gradually transferred to annual farming on the more fertile grassland. However, the crop growth condition has still been limited by rainfall because planting technologies have not been well implemented by the people whose livelihood is accustomed to grazing.

4. Conclusions

Based on the above analysis, it is clear that desertification control has achieved successful reversion in the HQA. Due to precipitation instability and excessive groundwater irrigation, water consumption has been far beyond the regional water capacity for decade. For the local populations, the northward farming boundary and water-stressed grassland will potentially change the mode of production in an unsustainable way. Without effective land and water management, persistent desertification reversion cannot be realized under the framework of SDGs. More scientific effort and reasonable eco-compensation should be performed to strengthen the prevention and control of desertification in this agro-pastoral transitional zone.

Acknowledgments

This study was financially supported by Pioneer Hundred Talents Program of the Chinese Academy of Sciences (Y551821002), the National Science Foundation of China (91425303 and 41541003), and the Science and Technology Service Network Initiative Project of the Chinese Academy of Sciences (51Y651661). We are grateful to the anonymous reviewers for their constructive comments on the manuscript.

Author Contributions

All co-authors assisted with manuscript writing. Jie Lian processed and analyzed the NDVI data, and wrote this paper. Xueyong Zhao and Xin Li conceived and designed the experiment, and modified the manuscript. Tonghui Zhang and Shaokun Wang contributed economic and social materials of each county, and focused on the interpretation of results. Yongqing Luo, Yangchun Zhu, and Jing Feng were responsible for data observation, collection, and processing of the materials.

Conflicts of Interest

The authors declare no conflict of interest.

References

  1. Reynolds, J.F.; Smith, D.M.S.; Lambin, E.F.; Turner, B.L.; Michael, M.; Batterbury, S.P.J.; Downing, T.E.; Hadi, D.; Fernández, R.J.; Herrick, J.E. Global Desertification: Building a Science for Dryland Development. Science 2007, 316, 847–851. [Google Scholar] [CrossRef] [PubMed]
  2. D’Odorico, P.; Bhattachan, A.; Davis, K.F.; Ravi, S.; Runyan, C.W. Global desertification: Drivers and feedbacks. Adv. Water Resour. 2013, 51, 326–344. [Google Scholar] [CrossRef]
  3. Verón, S.R.; Paruelo, J.M.; Oesterheld, M. Assessing desertification. J. Arid Environ. 2006, 66, 751–763. [Google Scholar] [CrossRef]
  4. Open Working Group Proposal for Sustainable Development Goals. Available online: https://sustainabledevelopment.un.org/focussdgs.html (accessed on 7 January 2015).
  5. Murphy, B.P.; Bowman, D.M.J.S. What controls the distribution of tropical forest and savanna? Ecol. Lett. 2012, 15, 748–758. [Google Scholar] [CrossRef] [PubMed]
  6. Elmendorf, S.C.; Henry, G.H.; Hollister, R.D.; Björk, R.G.; Bjorkman, A.D.; Callaghan, T.V.; Collier, L.S.; Cooper, E.J.; Cornelissen, J.H.; Day, T.A.; et al. Global assessment of experimental climate warming on tundra vegetation: Heterogeneity over space and time. Ecol. Lett. 2012, 15, 164–175. [Google Scholar] [CrossRef] [PubMed]
  7. Lehmann, C.E.R.; Archibald, S.A.; Hoffmann, W.A.; Bond, W.J. Deciphering the distribution of the savanna biome. New Phytol. 2011, 191, 197–209. [Google Scholar] [CrossRef] [PubMed]
  8. Hessburg, P.F.; Reynolds, K.M.; Salter, R.B.; Dickinson, J.D.; Gaines, W.L.; Harrod, R.J. Landscape Evaluation for Restoration Planning on the Okanogan-Wenatchee National Forest, USA. Sustainability 2013, 5, 805–840. [Google Scholar] [CrossRef]
  9. Fang, J.; Yang, Y.; Ma, W.; Mohammat, A.; Shen, H. Ecosystem carbon stocks and their changes in China’s grasslands. Sci. China Life Sci. 2010, 53, 757–765. [Google Scholar] [CrossRef] [PubMed]
  10. Li, X.R. Influence of variation of soil spatial heterogeneity on vegetation restoration. Sci. China Earth Sci. 2005, 48, 2020–2031. [Google Scholar] [CrossRef]
  11. Yan, Y.; Xin, X.; Xu, X.; Wang, X.; Yang, G.; Yan, R.; Chen, B. Quantitative effects of wind erosion on the soil texture and soil nutrients under different vegetation coverage in a semiarid steppe of northern China. Plant Soil 2013, 369, 585–598. [Google Scholar] [CrossRef]
  12. Li, X.; Zhang, Z.; Huang, L.; Wang, X. Review of the ecohydrological processes and feedback mechanisms controlling sand-binding vegetation systems in sandy desert regions of China. Chin. Sci. Bull. 2013, 58, 1483–1496. [Google Scholar] [CrossRef]
  13. Zhao, X.; Zuo, X.; Huang, G.; Huang, Y.; Wang, S.; Luo, Y.; Huang, W.; Qu, H.; Mao, W.; Lian, J. Desertification Reversion in Relation to Land Use Change and Climate in Naiman County, Inner-Mongolia, China. Sci. Cold Arid Reg. 2010, 2, 15–20. [Google Scholar]
  14. Zuo, X.; Zhao, X.; Zhao, H.; Zhang, T.; Guo, Y.; Li, Y.; Huang, Y. Spatial heterogeneity of soil properties and vegetation-soil relationships following vegetation restoration of mobile dunes in Horqin Sandy Land, Northern China. Plant Soil 2009, 318, 153–167. [Google Scholar] [CrossRef]
  15. Wang, T. Atlas of Sandy Desert and Aeolian Desertification in Northern China; Science Press: Beijing, China, 2014. [Google Scholar]
  16. Mao, D.; Wang, Z.; Luo, L.; Ren, C. Integrating AVHRR and MODIS data to monitor NDVI changes and their relationships with climatic parameters in Northeast China. Int. J. Appl. Earth Obs. 2012, 18, 528–536. [Google Scholar] [CrossRef]
  17. Fu, X.; Tang, C.; Zhang, X.; Fu, J.; Jiang, D. An improved indicator of simulated grassland production based on MODIS NDVI and GPP data: A case study in the Sichuan province, China. Ecol. Indic. 2014, 40, 102–108. [Google Scholar] [CrossRef]
  18. Brown, M.E.; Pinzón, J.E.; Didan, K.; Morisette, J.T.; Tucker, C.J. Evaluation of the consistency of long-term NDVI time series derived from AVHRR, SPOT-Vegetation, SeaWiFS, MODIS, and Landsat ETM+ sensors. IEEE Trans. Geosci. Remote Sens. 2006, 44, 1787–1793. [Google Scholar] [CrossRef]
  19. Maselli, F.; Papale, D.; Chiesi, M.; Matteucci, G.; Angeli, L.; Raschi, A.; Seufert, G. Operational monitoring of daily evapotranspiration by the combination of MODIS NDVI and ground meteorological data: Application and evaluation in Central Italy. Remote Sens. Environ. 2014, 152, 279–290. [Google Scholar] [CrossRef]
  20. Zhu, Z.; Piao, S.; Myneni, R.B.; Huang, M.; Zeng, Z.; Canadell, J.G.; Ciais, P.; Sitch, S.; Friedlingstein, P.; Arneth, A.; et al. Greening of the Earth and its drivers. Nat. Clim. Chang. 2016, 6, 791–795. [Google Scholar] [CrossRef]
  21. Zhao, H.; He, Y.; Zhou, R.; Su, Y.; Li, Y.; Drake, S. Effects of desertification on soil organic C and N content in sandy farmland and grassland of Inner Mongolia. Catena 2009, 77, 187–191. [Google Scholar] [CrossRef]
  22. Liu, X.M.; Zhao, H.L.; Zhao, A.F. Wind-Sandy Environment and Vegetation in the Horqin Sandy Land, China; Science Press: Beijing, China, 1996. (In Chinese) [Google Scholar]
  23. Land Processes Distributed Active Archive Center. Available online: https://lpdaac.usgs.gov/dataset_discovery/modis/modis_products_table/mod13q1 (accessed on 14 April 2014).
  24. National Land Cover Dataset. Available online: http://www.resdc.cn/ (accessed on 12 January 2016).
  25. Zhu, Z.; Liu, S. Desertification and Its Control in China; Science Press: Beijing, China, 1989. (In Chinese) [Google Scholar]
  26. Duan, H.C.; Tao, W.; Xian, X.; Liu, S.L.; Jian, G. Dynamics of aeolian desertification and its driving forces in the Horqin Sandy Land, Northern China. Environ. Monit. Assess. 2014, 186, 6083–6096. [Google Scholar] [CrossRef] [PubMed]
  27. Suzuki, R.; Xu, J.; Motoya, K. Global analyses of satellite-derived vegetation index related to climatological wetness and warmth. Int. J. Climatol. 2006, 26, 425–438. [Google Scholar] [CrossRef]
  28. Xu, W. Kira’s Temperature Indices and Their Application in the Study of Vegetation. Chin. J. Ecol. 1985, 4, 35–39. (In Chinese) [Google Scholar]
  29. Mishra, U.; Lal, R.; Slater, B.; Calhoun, F.; Liu, D.S.; Meirvenne, M.V. Predicting soil organic carbon stock using profile depth distribution functions and ordinary kriging. Soil Sci. Soc. Am. J. 2009, 73, 614–621. [Google Scholar] [CrossRef]
  30. Inner Mongolia Autonomous Regional Bureau of Statistics. Inner Mongolia Statistical Yearbook 2001; China Statistics Press: Beijing, China, 2001. (In Chinese)
  31. Inner Mongolia Autonomous Regional Bureau of Statistics. Inner Mongolia Statistical Yearbook 2002; China Statistics Press: Beijing, China, 2002. (In Chinese)
  32. Inner Mongolia Autonomous Regional Bureau of Statistics. Inner Mongolia Statistical Yearbook 2003; China Statistics Press: Beijing, China, 2003. (In Chinese)
  33. Inner Mongolia Autonomous Regional Bureau of Statistics. Inner Mongolia Statistical Yearbook 2004; China Statistics Press: Beijing, China, 2004. (In Chinese)
  34. Inner Mongolia Autonomous Regional Bureau of Statistics. Inner Mongolia Statistical Yearbook 2005; China Statistics Press: Beijing, China, 2005. (In Chinese)
  35. Inner Mongolia Autonomous Regional Bureau of Statistics. Inner Mongolia Statistical Yearbook 2006; China Statistics Press: Beijing, China, 2006. (In Chinese)
  36. Inner Mongolia Autonomous Regional Bureau of Statistics. Inner Mongolia Statistical Yearbook 2007; China Statistics Press: Beijing, China, 2007. (In Chinese)
  37. Inner Mongolia Autonomous Regional Bureau of Statistics. Inner Mongolia Statistical Yearbook 2008; China Statistics Press: Beijing, China, 2008. (In Chinese)
  38. Inner Mongolia Autonomous Regional Bureau of Statistics. Inner Mongolia Statistical Yearbook 2009; China Statistics Press: Beijing, China, 2009. (In Chinese)
  39. Inner Mongolia Autonomous Regional Bureau of Statistics. Inner Mongolia Statistical Yearbook 2010; China Statistics Press: Beijing, China, 2010. (In Chinese)
  40. Inner Mongolia Autonomous Regional Bureau of Statistics. Inner Mongolia Statistical Yearbook 2011; China Statistics Press: Beijing, China, 2011. (In Chinese)
  41. Inner Mongolia Autonomous Regional Bureau of Statistics. Inner Mongolia Statistical Yearbook 2012; China Statistics Press: Beijing, China, 2012. (In Chinese)
  42. Inner Mongolia Autonomous Regional Bureau of Statistics. Inner Mongolia Statistical Yearbook 2013; China Statistics Press: Beijing, China, 2013. (In Chinese)
  43. Inner Mongolia Autonomous Regional Bureau of Statistics. Inner Mongolia Statistical Yearbook 2014; China Statistics Press: Beijing, China, 2014. (In Chinese)
  44. Inner Mongolia Autonomous Regional Bureau of Statistics. Inner Mongolia Statistical Yearbook 2015; China Statistics Press: Beijing, China, 2015. (In Chinese)
  45. Inner Mongolia Autonomous Regional Bureau of Statistics. Inner Mongolia Statistical Yearbook 2016; China Statistics Press: Beijing, China, 2016. (In Chinese)
  46. Sayemuzzamana, M.; Jhab, M.K. Seasonal and annual precipitation time series trend analysis in North Carolina, United States. Atmos. Res. 2014, 137, 183–194. [Google Scholar] [CrossRef]
  47. Ay, M.; Kisi, O. Investigation of trend analysis of monthly total precipitation by an innovative method. Theor. Appl. Climatol. 2014, 120, 617–629. [Google Scholar] [CrossRef]
  48. Wright, S. The Method of Path Coefficients. Ann. Math. Stat. 1934, 5, 161–215. [Google Scholar] [CrossRef]
  49. Du, J.; Li, M.; Yuan, Z.; Guo, M.; Song, J.; Xie, X.; Chen, Y. A decision analysis model for KEGG pathway analysis. BMC Bioinform. 2016, 17, 407. [Google Scholar] [CrossRef] [PubMed]
  50. Zhang, J.; Zhang, L.; Xu, C.; Liu, W.; Qi, Y.; Wo, X. Vegetation variation of mid-subtropical forest based on MODIS NDVI data—A case study of Jinggangshan City, Jiangxi Province. Acta Ecol. Sin. 2014, 34, 7–12. [Google Scholar] [CrossRef]
  51. Duan, H.; Yan, C.; Tsunekawa, A.; Song, X.; Li, S.; Xie, J. Assessing vegetation dynamics in the Three-North Shelter Forest region of China using AVHRR NDVI data. Environ. Earth Sci. 2011, 64, 1011–1020. [Google Scholar] [CrossRef]
  52. An, Y.; Gao, W.; Gao, Z.; Liu, C.; Shi, R. Trend analysis for evaluating the consistency of Terra MODIS and SPOT VGT NDVI time series products in China. Front. Earth Sci. 2015, 9, 125–136. [Google Scholar] [CrossRef]
  53. Lian, J.; Zhao, X.; Zuo, X.; Wang, S.; Wang, X.; Luo, Y. Land cover changes and the effects of cultivation on soil properties in Shelihu wetland, Horqin Sandy Land, Northern China. J. Arid Land 2013, 5, 71–79. [Google Scholar] [CrossRef]
  54. Wang, T.; Xue, X.; Zhou, L.; Guo, J. Combating Aeolian Desertification in Northern China. Land Degrad. Dev. 2015, 26, 118–132. [Google Scholar] [CrossRef]
  55. Chen, X.; Su, Y.; Liao, J.; Shang, J.; Dong, T.; Wang, C.; Liu, W.; Zhou, G.; Liu, L. Detecting significant decreasing trends of land surface soil moisture in eastern China during the past three decades (1979–2010). J. Geophys. Res. Atmos. 2016, 121, 5177–5192. [Google Scholar] [CrossRef]
  56. Wang, L.; Yuan, X.; Xie, Z.; Wu, P.; Li, Y. Increasing flash droughts over China during the recent global warming hiatus. Sci. Rep. 2016, 6, 30571. [Google Scholar] [CrossRef] [PubMed]
  57. Chuai, X.W.; Huang, X.J.; Wang, W.J.; Bao, G. NDVI, temperature and precipitation changes and their relationships with different vegetation types during 1998–2007 in Inner Mongolia, China. Int. J. Climatol. 2013, 33, 1696–1706. [Google Scholar] [CrossRef]
  58. Stefanc, D.; Max, R.; Marcfp, B. Coupling microscale vegetation-soil water and macroscale vegetation-precipitation feedbacks in semiarid ecosystems. Glob. Chang. Biol. 2007, 13, 671–678. [Google Scholar]
  59. Yue, X.; Zhang, T.; Zhao, X.; Liu, X.; Ma, Y. Effects of rainfall patterns on annual plants in Horqin Sandy Land, Inner Mongolia of China. J. Arid Land 2016, 8, 389–398. [Google Scholar] [CrossRef]
  60. Xu, D.; Li, C.; Xiao, S.; Ren, H. The dynamics of desertification in the farming-pastoral region of North China over the past 10 years and their relationship to climate change and human activity. Catena 2014, 123, 11–22. [Google Scholar] [CrossRef]
  61. Tao, S.; Fang, J.; Zhao, X.; Zhao, S.; Shen, H.; Hu, H.; Tang, Z.; Wang, Z.; Guo, Q. Rapid loss of lakes on the Mongolian Plateau. Proc. Natl. Acad. Sci. USA 2015, 112, 2281–2286. [Google Scholar] [CrossRef] [PubMed]
  62. Cheng, G.D.; Xin, L.I. Integrated research methods in watershed science. Sci. China Earth Sci. 2015, 58, 1159–1168. [Google Scholar] [CrossRef]
  63. Huo, Z.; Feng, S.; Kang, S.; Li, W.; Chen, S. Effect of climate changes and water-related human activities on annual stream flows of the Shiyang river basin in arid north-west China. Hydrol. Process. 2008, 22, 3155–3167. [Google Scholar] [CrossRef]
  64. Cheng, G.; Xin, L.; Zhao, W.; Xu, Z.; Qi, F.; Xiao, S.; Xiao, H. Integrated study of the water–ecosystem–economy in the Heihe River Basin. Natl. Sci. Rev. 2014, 1, 413–428. [Google Scholar] [CrossRef]
  65. Waller, P.; Yitayew, M. Center Pivot Irrigation Systems. In Irrigation and Drainage Engineering; Springer International Publishing: Cham, Switzerland, 2016; pp. 209–228. [Google Scholar]
  66. Cao, S.; Chen, L.; Shankman, D.; Wang, C.; Wang, X.; Zhang, H. Excessive reliance on afforestation in China’s arid and semi-arid regions: Lessons in ecological restoration. Earth Sci. Rev. 2011, 104, 240–245. [Google Scholar] [CrossRef]
Figure 1. Location and introduction of the Horqin area (HQA). (a) Two national ecological function protected area of (I) Horqin Sandy Land, (II) the Source Region of the West Liaohe River, and (III) stretching branches of the Greater Khingan Mountains; (b) The area is located in the southeast of Inner Mongolia, and is part of the Agro-pastoral Transitional Zone in Northern China; and (c) it was divided into agricultural zones (AZ), semi-agricultural and semi-pasturing zones (APZ), pasturing zones (PZ), and coal mining zones (CM) in this study.
Sustainability 09 00211 g001
Figure 2. NDVI trend and significance (Student’s t-test, α = 0.05) for individual pixels during 2000–2015: (a) mean method and (b) MVC method. Pixels were expressed completely in the left figures; the pixel was replaced by gray in the right figures when the trend was statistically non-significant (NS).
Sustainability 09 00211 g002
Figure 3. Mann–Kendall test of site observed P (precipitation), WI (warmth index), and HI (humidity index) in the HQA for two periods of (a) 1960–2000 and (b) 2000–2015, respectively. The sign of Z indicates a positive or negative trend. *, **, and *** indicate the significance at 90%, 95%, and 99% confidence intervals.
Sustainability 09 00211 g003
Figure 4. Relationships between P, WI, and NDVI. Each point represented a mean value in individual county of a certain year (N = 224, 14 counties during 2000–2015).
Sustainability 09 00211 g004
Figure 5. Mean NDVI for the warmest five months: pixel value was acquired by averaging monthly NDVI of 16 years. The range was demonstrated by hue as shown in the legend.
Sustainability 09 00211 g005
Figure 6. Land cover pattern of the HQA in 2015. This data was interpreted on the basis of Landsat 8 images at a scale of 1:10,000.
Sustainability 09 00211 g006
Figure 7. Change of groundwater depth in part of the HQA in 2001–2009. The symbols in red, orange, and green represented the mean with standard error in AZ, APZ, and PZ, respectively.
Sustainability 09 00211 g007
Table 1. Normalized Difference Vegetation Index (NDVI) trend and significance for individual counties during 2000–2015.
County(a) Mean Method(b) MVC Method
SlopeR2F ValueSlopeR2F Value
Horqin District0.0050.667 **28.0340.0040.410 **9.732
Kailu 0.0070.862 **87.1070.0060.660 **27.226
Naiman0.0060.762 **44.8320.0050.440 **11.002
Kulun0.0050.605 **21.4790.0030.1833.130
Aohan0.0060.572 **18.7310.0040.1873.224
Horqin Zuoyihou0.0040.529 **15.6970.0030.1532.528
Horqin Zuoyizhong0.0060.550 **17.0870.0040.2213.976
Horqin Youyizhong0.0040.2364.3280.0020.0891.374
Zhalute0.0040.251 *4.6820.0020.0270.394
Ar Horqin0.0030.1492.4490.0000.0000.005
Balinzuo0.0010.0390.569−0.0030.0490.729
Balinyou0.0010.0160.229−0.0030.0470.693
Wengniute0.0030.293 *5.8070.0010.0280.403
Huolinguole0.0020.0650.9750.0000.0050.071
Student’s t-test: * indicates a significant trend at the 0.05 level and ** indicate a significant trend at the 0.01 level. MVC: maximum value compositing.
Table 2. Statistics for the MODIS NDVI linear trend analysis for 2000–2015.
ImprovedDegraded
GreatlySlightlySignificantlyGreatlySlightlySignificantly
Per-pixel slope>0.008(0.003, 0.008] ≤−0.008(−0.008, −0.003]
(a) Mean method15.9%41.7%44.7%0.6%4.2%2.2%
(b) MVC method13.6%27.4%19.1%4.6%14.4%4.3%
The proportions (%) of pixel numbers were derived from Figure 2. The positive and negative slope (more than 0.003 a−1) was corresponding to NDVI improvement and degradation, respectively.
Table 3. Land cover area and percentage in the HQA from the late 1980s to 2015 (km2).
PeriodWater BodyMobile Sand LandSemi-Mobile Sand LandSemi-Fixed Sand LandGrasslandCroplandWoodland
the late 1980s95626738884620460,43326,96411,239
0.8%2.2%7.4%5.2%50.2%22.4%9.6%
200089134908902709356,35731,42311,927
0.7%2.9%7.4%5.9%46.8%26.1%9.9%
200581530039296642356,06531,93111,964
0.7%2.5%7.7%5.3%46.6%26.5%9.9%
201081425938064622555,75632,11812,014
0.7%2.2%6.7%5.2%46.3%26.7%10.0%
2015527///45,47834,07218,995
0.4%///37.8%28.3%15.8%
Table 4. Pearson’s correlation between MVC NDVI and statistical data [30,31,32,33,34,35,36,37,38,39,40,41,42,43,44,45].
CountyEconomic PatternPICCFECRAYG
Horqin DistrictAZ0.605 *0.548 *0.516 *0.622 *
KailuAZ0.793 **0.804 **0.731 **0.830 **
NaimanAPZ0.617 *0.633 **0.561 *0.640 **
KulunAPZ0.3880.529 *0.4300.495
AohanAPZ0.581 *0.3480.2790.620 *
WengniuteAPZ0.1820.1470.2770.476
Horqin ZuoyihouAPZ0.4110.2790.3440.440
Horqin ZuoyizhongAPZ0.499 *0.3960.4870.337
Horqin YouyizhongPZ0.3200.2530.2820.381
ZhalutePZ0.2210.050−0.2040.489
Ar HorqinPZ0.075−0.052−0.0090.239
BalinzuoPZ−0.188−0.096−0.3870.171
BalinyouPZ−0.139−0.426−0.1960.387
Huolinguole CityCM−0.140−0.361−0.145−0.414
* Correlation is significant at the 0.05 level; ** Correlation is significant at the 0.01 level (two-tailed).
Table 5. Path analysis between MVC NDVI and indicators over 2000–2015.
Path xi to yCorrelation CoefficientDirect Path CoefficientIndirect Path CoefficientTotalDC
AP YGSG
YG0.7661.036 −0.270 −0.2700.514
SG−0.059−0.5590.500 0.500−0.247
APZ PYGWIECRA
P0.5020.443 0.096−0.0510.0130.0580.249
YG0.4330.2930.145 −0.0400.0340.1400.168
WI0.1420.305−0.074−0.039 −0.050−0.163−0.006
ECRA0.2000.1970.0300.051−0.078 0.0030.040
PZ PYGCCF
P0.5190.307 0.383−0.172 0.2120.224
YG0.5020.5960.197 −0.292 −0.0940.243
CCF0.300−0.3490.1510.498 0.649−0.331
All variables were standardized to the same dimension.

