1. Introduction
Water resources are essential for human existence as well as for agricultural irrigation [
1]. It is widely acknowledged that irrigated agriculture uses almost 70% of the global freshwater [
2]. In many developing countries, growing demand for irrigation, as well as increased population and limited management are placing increasing pressure on water resources. To maintain sustainable water use in agriculture and ensure food security, a substantial improvement in agriculture water use efficiency is required [
3].
In general, agriculture water use efficiency is low in China, especially in the Heihe River Basin [
4]. As the second largest inland river basin in the arid regions of Northwest China, the Heihe River Basin provides 95% of the water resources for agriculture development. However, low agriculture water use efficiency leads to severe mismatch between water supply and demand [
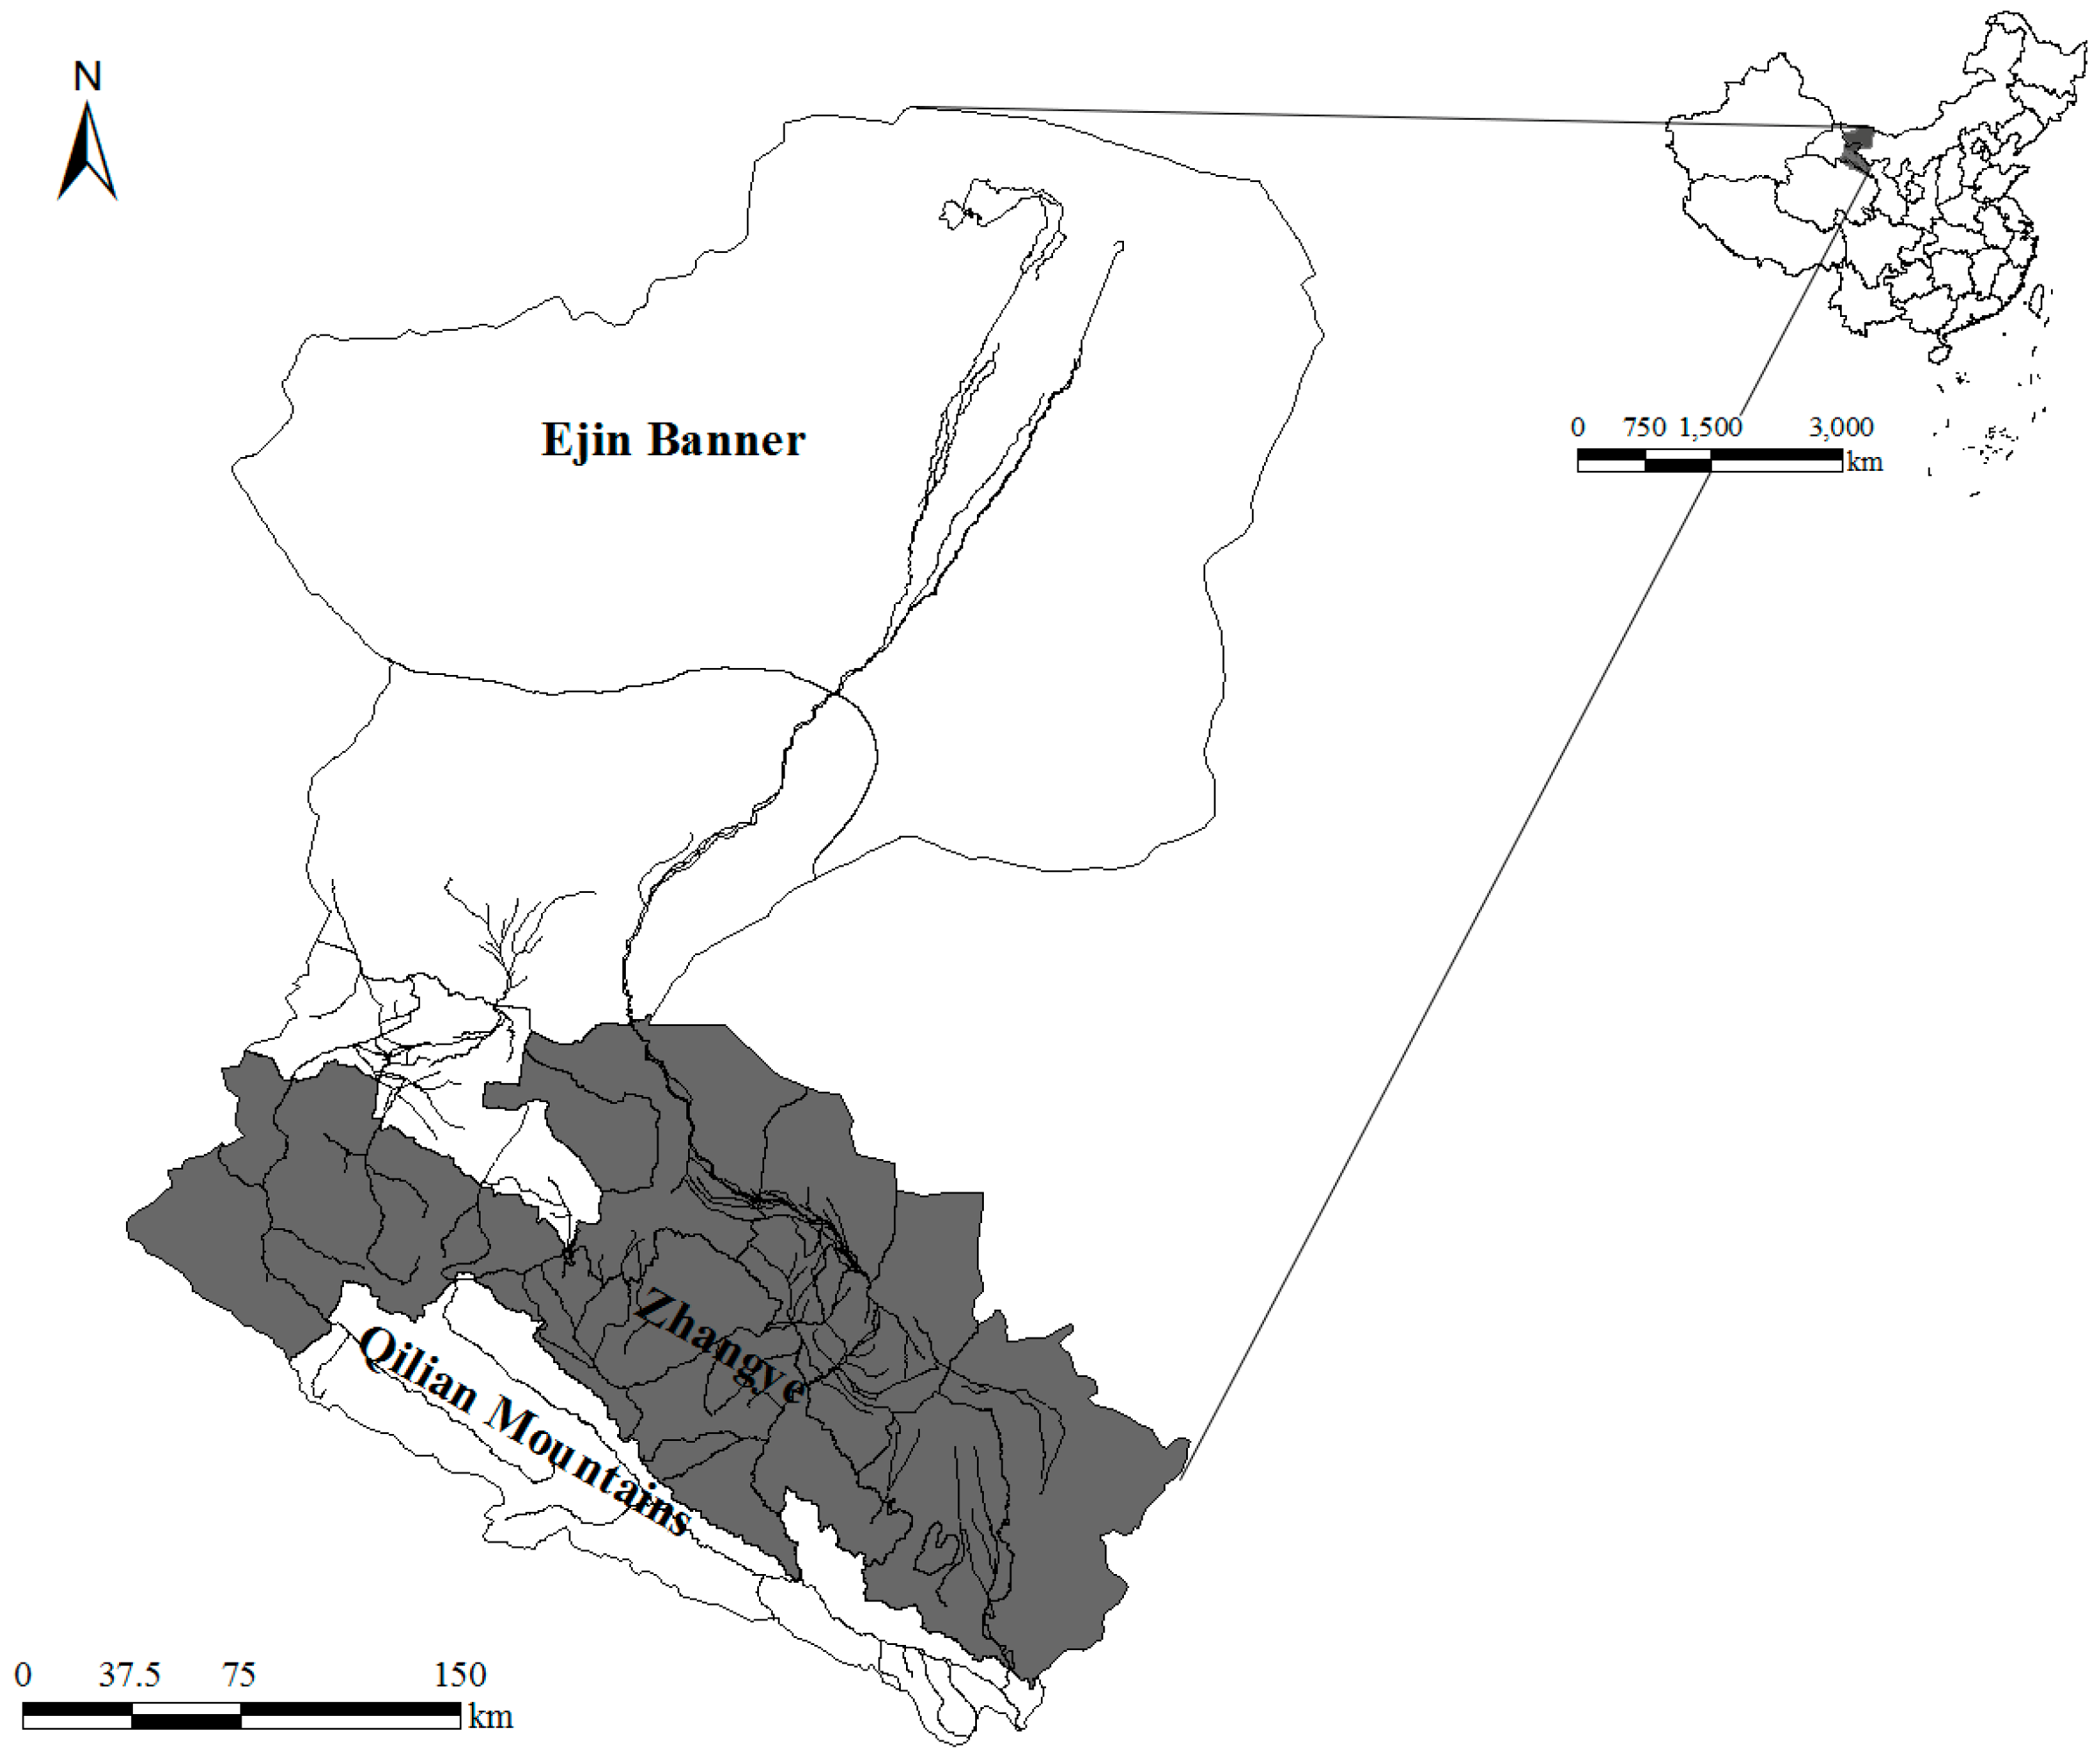
5]. For example, according to the 2015 national economy and social development statistics of Zhangye City (see
Figure 1), located in the midstream of the Heihe area, Zhangye City had a GDP of 37.353 billion yuan and a per capita GDP of 30,704 yuan, with the latter value being 62% of the national average. The low water use efficiency is revealed by the water consumption of 580 m
3 per unit of GDP, about six times greater than the national average. Wu et al. (2014) also get the same results [
6]. Moreover, according to a population sampling survey, Zhangye City, like virtually all urban centers, is undergoing urbanization. Its urbanization rate is about 41.88%, much lower than the national average of 56.1%. Along with the urbanization process, Zhangye City is experiencing a reduction in agricultural land and an increase in land used for other purposes, thereby intensifying the contradiction between agricultural land and water. That is, with less agricultural land available, the low efficiency of agricultural water aggravates waste of water resources. In order to improve water use efficiency in agriculture, Zhangye City has set up many rules in its 13th Five-Year Plan for Economic and Social Development, including: enhancing highly efficient water-saving irrigation technology such as pipeline irrigation, drip irrigation and sprinkling irrigation; promoting agricultural water right or water pricing; advancing a small farmland property rights system of water conservancy facilities; and establishing an effective water-saving incentive mechanism [
7]. Whether these rules can save agriculture water resources in Zhangye City and how these rules affect macro outcomes need to be carefully studied.
Because of the high proportion of water used for agricultural purposes and low water use efficiency, increasing attention has been paid to the efficiency of water use in agriculture. Many studies have explored the potential of improving water use efficiency in agriculture. Taheripour et al. (2016) point out that there are two ways to increase water use efficiency in irrigation: reduction of water loss in delivery, and improvements in water use by plants [
8]. Studies on delivery improvement have covered a variety of topics such as process chains [
9]; irrigation method [
10,
11,
12]; manure and cropping frequency [
13]; irrigation regimes [
14,
15]; cropping management [
16]; and furrow and plant spacing [
17,
18]. On the other hand, Amanullah (2015) propose that crop competition affect water use efficiency markedly based on prospect of water use by plants [
19]. These studies also show that there is significant potential for improving water use efficiency in agriculture, especially in arid and semi-arid areas where the need is the greatest [
20].
Besides agriculture technologies and cropping regimes, water regulations also play a crucial role in water conservation. Water regulations include water supply management and water demand management [
21]. The existing literature indicates that demand side management is more efficient and could save more water compared with supply side management [
22]. Calzadilla et al. (2009) employ a Computable General Equilibrium (CGE) model to investigate the economic impact of sustainable water use [
23]. Dixon et al. (2011) use TERM-H
2O to analyze the effects of the government buying back water from irrigators in the Southern Murray-Darling Basin [
24]. Shi et al. (2014) find that a water quota is a more efficient choice for the purpose of reducing agriculture water use compared with water price reform [
25]. In addition, Taheripour et al. (2016) examine how improving water use efficiency in South Asia affects macro-economic outcomes, production and trade [
8].
In China, the efficiency of agricultural water use is low, especially in the western provinces [
26,
27]. Most previous research on the water resources of the Heihe River Basin have focused on agricultural water use in the basin. Various studies have identified the unbalanced development in downstream of the Heihe River Basin [
28,
29]. To help address the shortage of water caused by population growth and local economic development, Chen et al. (2005) investigate the status of water supply and demand in the Heihe River Basin and formulate a demand-oriented water management approach in the irrigated agricultural sector [
4]. Sun et al. (2010) select 20 indexes to measure the health of agricultural water in the Heihe River Basin and conclude that agricultural water use efficiency is not sufficiently high [
30]. Various studies have used the CGE model for examining aspects of water resources in the Heihe River Basin [
31,
32,
33]. Researchers have also used various other methods for investigating water resources in the Heihe River Basin, including the head-and-tail calculation method, the DEA model, the MALMQUIST index model, and a complete decomposition model for the change in water use driven by urbanization, a projection pursuit classification model, and input–output tables [
34,
35,
36,
37,
38,
39,
40,
41,
42].
However, existing research on agricultural water use efficiency in Zhangye City is characterized by the following issues: (1) most of the literature lacks sector disaggregation within the agricultural sector. The amount of water use for various plants are different, which means that water-saving potential for each plant could not be investigated if we did not divide agriculture into several specific sectors; (2) previous studies have not examined the effect of the efficiency of agricultural water use on the economy or sector production. Even though the necessity of improving agriculture water use efficiency is well acknowledged, the quantitative effect of improving agriculture water use efficiency on economy is still underexplored, which is essential for scientific policy making; and (3) there has been no distinction made between different types of water resources, such as surface water, underground water, and other water sources. According to the 2011 water resources census, in the Zhangye City, the surface water accounts for approximate 67% of the total water amount, and underground water accounts for 30%. In general, the existing studies have focused only on the calculation of agricultural water use efficiency, and have not discussed the relationship between the improvement in agricultural water use efficiency and the economy. The present study therefore aims to assess the impact of an improvement in the agricultural water use efficiency on water conservation, land allocation as well as economic activities, in Zhangye City, covering both the macro and sector aspects.
To do so, we use a static CGE model. The CGE model includes 48 sectors, various agricultural sectors including wheat, corn, oilseeds, cotton, fruit, vegetables, and other agriculture; four primary inputs (labor, capital, land, and water) and six economic agents (production, investment, households, government, inventory, and other regions). The model also considers three types of margins, which are transport warehousing, insurance, and trade [
43]. Additionally, we introduce water and land resource accounts as primary factors based on the constant elasticity of substitution (CES) in the model, which can analyze the water and land allocation when facing the price adjustment. Furthermore, according to the different sources of water, water resources are divided into surface water, underground water, and other water resources with a CES relationship, in order to study different types of water resource allocation across sectors.
2. Materials and Methods
This paper uses the CGE model developed jointly by the Chinese Academy of Sciences’ Institutes of Policy and Management (Beijing, China), and Victoria University’s Centre of Policy Studies (Melbourne, Australia). It incorporates economic characteristics and data of Zhangye City. The economic data for the model is derived from the 2012 input–output tables of Zhangye City, the water resource data is taken from the first national census for water organized by the Ministry of Water Resources in 2011, and the land use data is obtained from remote sensing image data produced by the Heihe River project group in 2012. The CGE model assumes that when the economy reaches a general equilibrium state, it is a perfectly competitive market, for which the ORANI model would suffice.
In this paper, the short-term closure is used to analyze the impact of improving the agricultural water use efficiency on the economy of Zhangye City. The specific short-term closure assumptions are as follows. In the labor market, real wages are fixed and employment endogenous. In the capital market, capital stocks are fixed and the rate of return on capital endogenous. Government spending and the tax rate are exogenous. Labor growth, technological progress, and capital accumulation jointly drive economic growth. The total amount of land supply is constant and sectors with increasing land returns attract more land. In Zhangye City, the price of water is controlled by the government, so the model assumes that the price of water is exogenous.
In the following three sub-sections, the detail information about the structure of the CGE model is introduced. In
Section 2.1, the description about the production module is provided, which includes how produce pursues optimal output at the constraint of cost. In
Section 2.2, the demand module is introduced, which includes how private consumption and government consumption proceed. In
Section 2.3, we introduce the scenario design according to goal setting by the local government.
2.1. Production Module
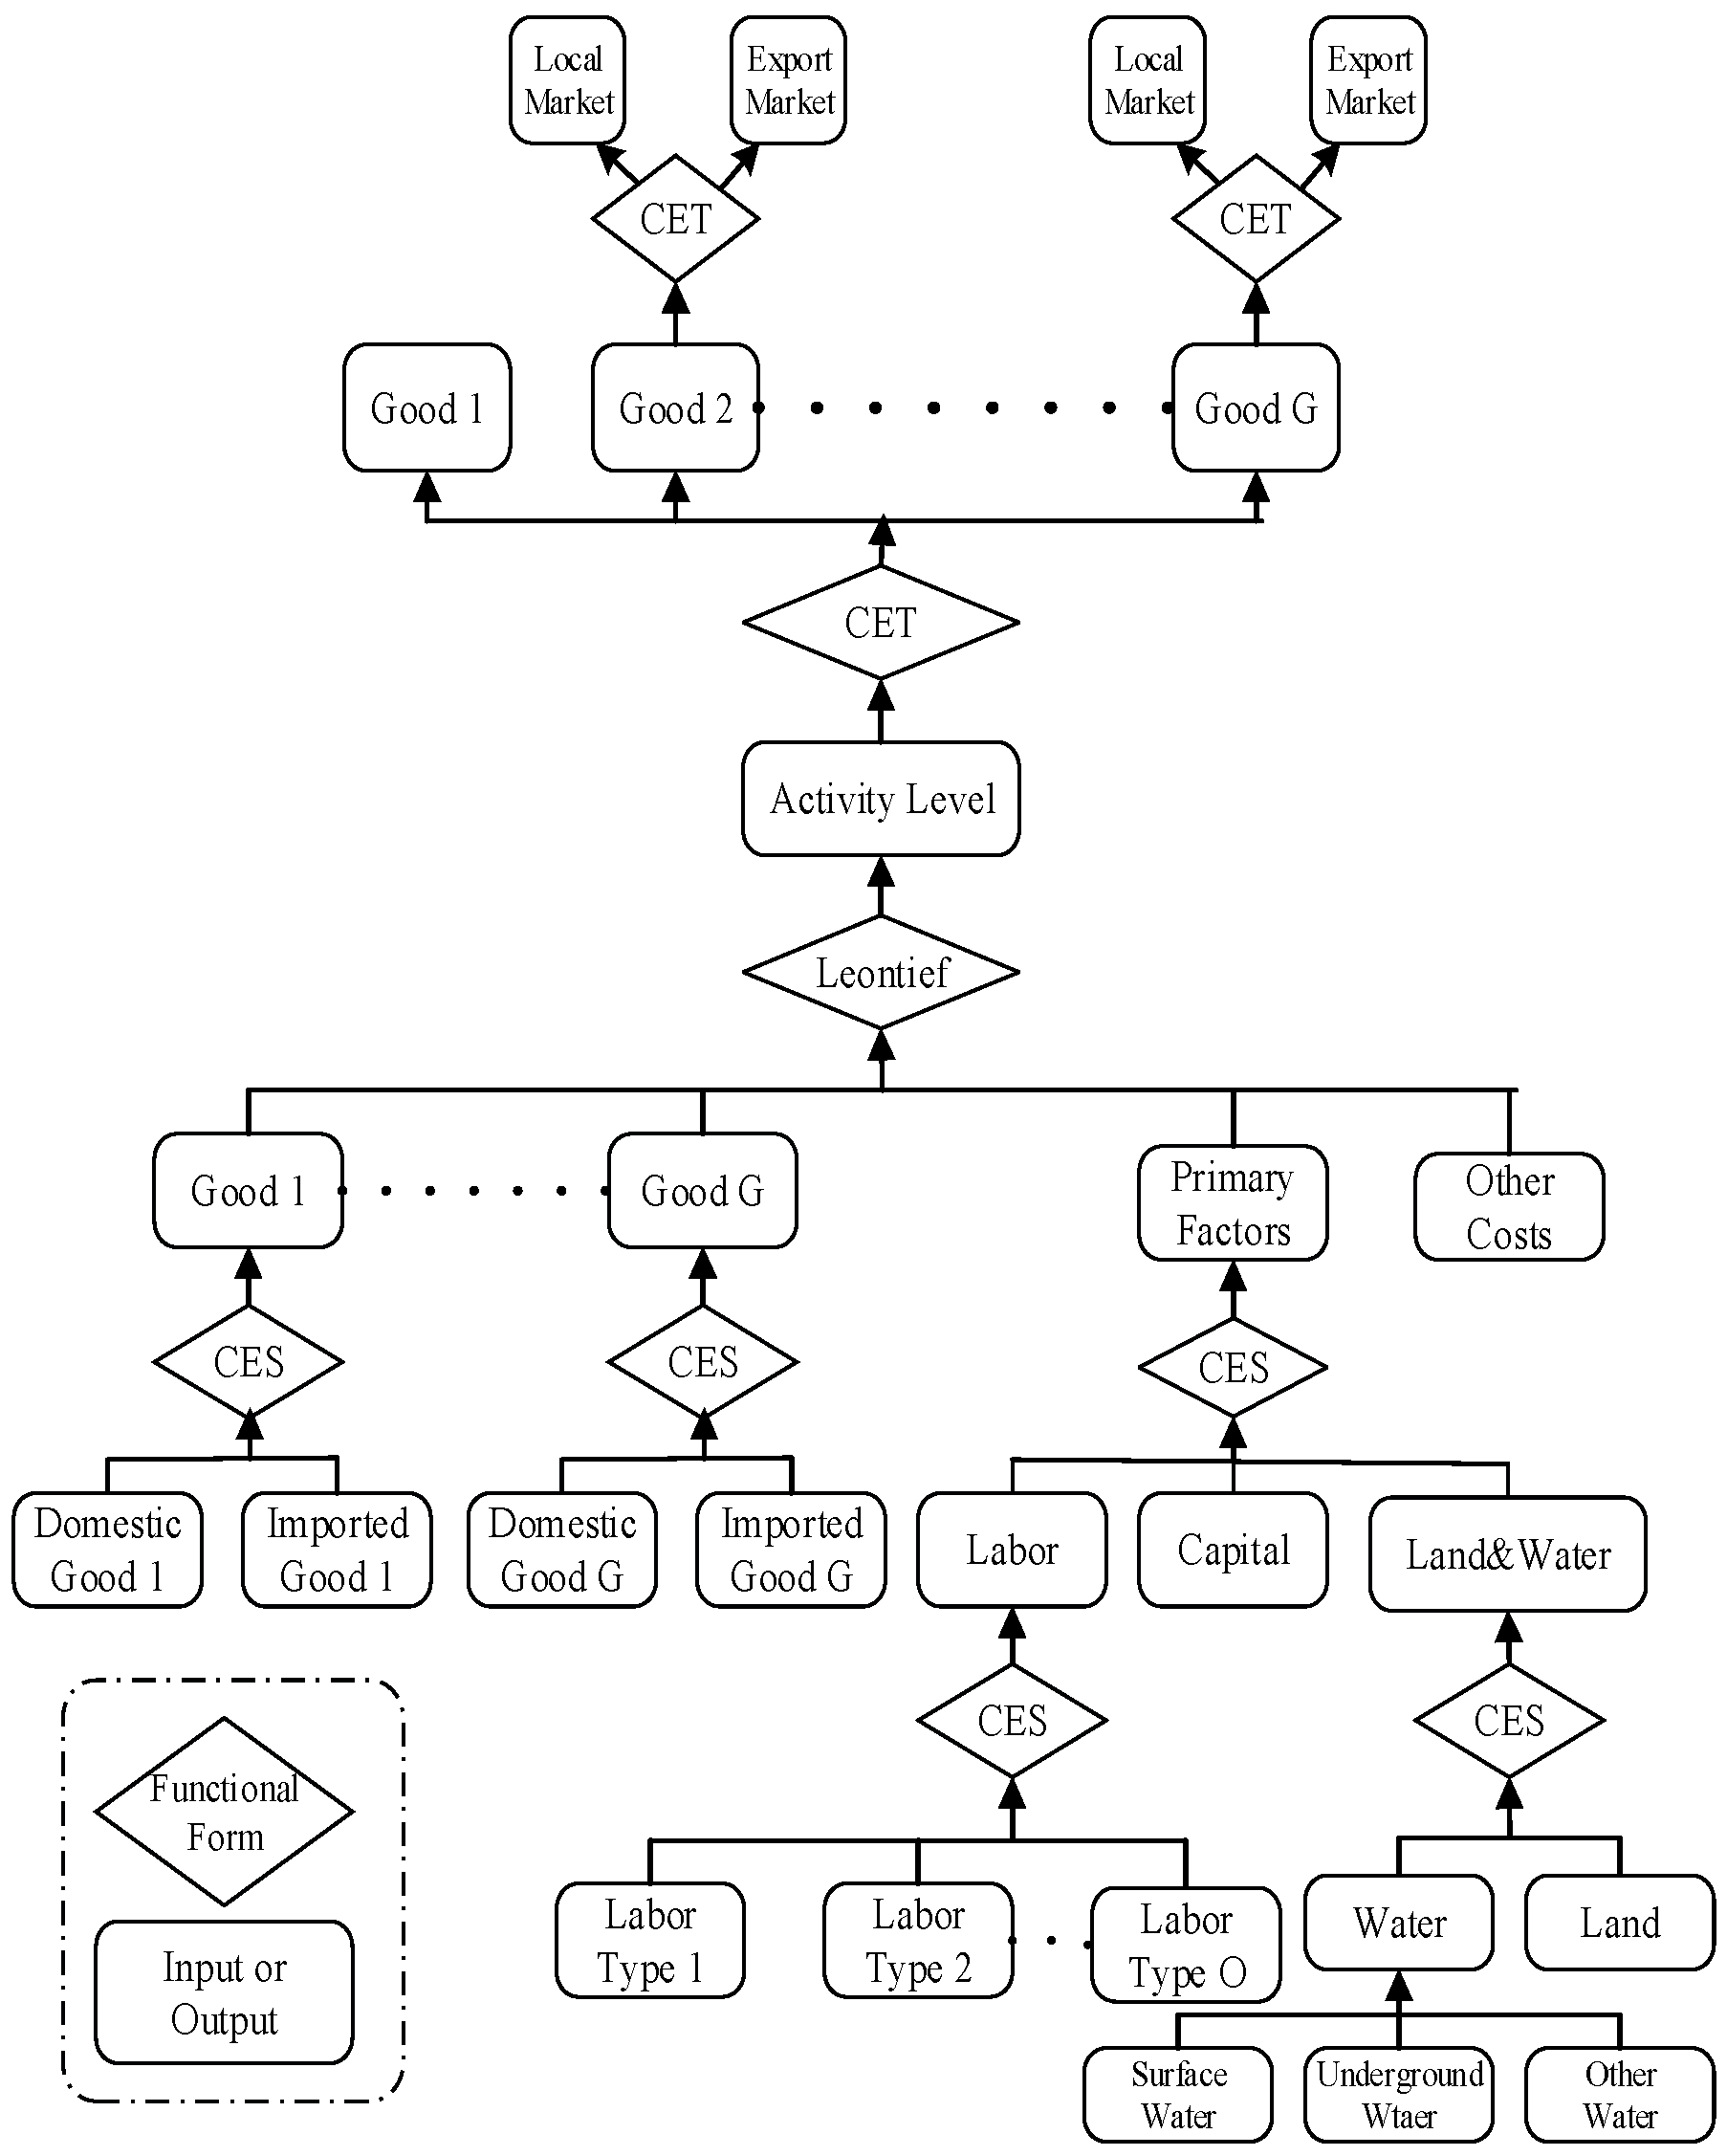
The production module describes input decisions and output distribution in the production sector (see
Figure 2). According to the principle of cost minimization, the manufacturer determines the optimal input, and outputs are assigned to the local market and to export according to the principle of profit maximization.
In the model, a multilayer nested structure is used to describe the input decisions. The top layer contains the intermediate inputs, the primary factors inputs, and other costs based on the Leontief production relationship, as represented by Equation (1):
where
represents the output of sector
j,
i,
j = 1, …, 48;
is the intermediate input of sector
j for product
i in the process of production, which is composed of product
i from local and foreign products based on the CES function;
is the primary factor input, which comprises four elements (namely, capital, labor, water and land) based on the composition of the CES function;
represents other costs;
represents all input-augmenting technical change of sector
j;
represents the technical change of intermediate input
i which bundles local and foreign products based on the CES function for sector
j;
represents all factor augmenting technical change of sector
j;
represents other cost augmenting technical change of sector
j.
An improvement of our model is to introduce the land accounts and land-water nesting in the designed model in this study. As shown in
Figure 2, from the bottom layer, surface water, underground water, as well as other water resources, a CES nest of water resources is formed. Water resources and land then form a middle layer, a CES bundle of water−land.
The equation of land supply is as follows:
where
represents the rental price of the land of sector
j;
represents the land supply of sector
j; L is the (fixed) total land supply of the economy.
The equation of land demand is as follows:
where
is the water price of sector
j, which is exogenous;
is the land rental rate of sector
j;
and
are the demand for water and land of sector
j;
is the substitution elasticity, which is negative;
is the composited demand for land and water.
The market clearing condition for land by sector is:
In terms of output, the Constant Elasticity of Transformation (CET) function is used to determine the supply of the product in the local market and the output of export:
where
and
are the export price and local price of product
j, respectively,
and
are, respectively, the corresponding export and local supply, and
is the CET substitution elasticity of the supply between local output and exporting output.
2.2. Demand Module
The final demand for commodities includes household consumption, government consumption, export, investment, margins, and inventory. Of these, the household demands follow the Linear Expenditure System (LES).
Government consumption and inventory are set to be exogenous. The investment demand procedure is similar to the input-sourcing decisions in production. The optimum is achieved by cost minimization. Margin demand depends on the basic demand of commodities and the coefficient of margin technical change.
There are two kinds of export products, namely, traded and non-traded goods. The demand curve for traded goods is downward-sloping with fixed-demand elasticity of price:
where
. represents the foreign demand of product
j,
is the price of the product
j in the foreign market,
and
describe the shift of the demand curve in the export quantity direction and the export price direction, respectively, and
is the demand elasticity, which is negative.
2.3. Scenario Design
The improvement in the agricultural water use efficiency plays a key role in the water conservation in Zhangye City. In 2016, “The 13th Five-Year Plan for Economic and Social Development of Zhangye City” proposed a goal for 2020: that the effective utilization coefficient of agricultural irrigation water, defined as the ratio of the net agricultural irrigation water over gross agricultural irrigation water in an irrigation period, should reach 0.60, which means the goal for improving agriculture water use efficiency in Zhangye City in 2020 can be interpreted as only 40% of total irrigation water being wasted in the process of transfer and irrigation. The effective utilization coefficient of agricultural irrigation water in Zhangye City is unknown, but the effective utilization coefficient of agricultural irrigation water in 2014 in Gansu Province was estimated to be 0.537 (data from Zhangye City municipal government website
http://www.zhangye.gov.cn/Item/56056.aspx). In the present paper, the effective utilization coefficient of agricultural irrigation water in Zhangye City is assumed to be approximately the average level of the Gansu province. With more than 95% of water resources used for agriculture in Zhangye City, an improvement in agricultural water use efficiency is critical to the city’s overall water use efficiency. Therefore, in our model, the agricultural water use efficiency is assumed to increase by 12%, which is an increase from 0.537 to 0.60.
3. Results and Discussion
We summarize the CGE model simulation results from the perspectives of macroeconomics, sectorial transformation, and water−land reallocations. In
Section 3.1, the change of GDP, CPI, export and import, employment, and total water use is introduced. In
Section 3.2, we focus on the top ten beneficial and harmful sectors and analyze the underlying reasons. In
Section 3.3, analysis of water and land resource reallocations across sectors is provided. In
Section 3.4, we discuss the results and limitations of the work highlighted.
3.1. Macroeconomic Impact
An improvement in the agricultural water use efficiency in Zhangye City would affect the economy in two main ways. First, improving the efficiency of agricultural water use should reduce the production costs of agriculture. This cost reduction in the agriculture sector would then be channeled to other sectors through upstream−downstream production linkages, causing changes in the cost of other sectors. Second, because agricultural land accounts for 99% of the total area in Zhangye City and the total land amount is constant, the expansion of agricultural production leads to a substantial increase in the demand for land. The rental price of land then increases, and given the CES relationships between land, water, capital, and labor, rising land prices will lead to a substitution in the factor market, such as away from land to other primary factors. The following analysis is based on these two points.
(1) An improvement in the agricultural water use efficiency in Zhangye City will increase GDP of the city by 0.10% (see
Table 1). The model database shows that agricultural water use of Zhangye City accounts for 97% of the total water consumption of the whole economy; therefore, improving the efficiency of agricultural water use generating increases in the average technical level will impart a small expansion of the economy. The expanding economy should then lead to higher consumption and investment, which increase by 0.06% and 0.13% (see
Table 1), respectively.
(2) An improvement in the efficiency of agricultural water use increases the consumer price index (CPI) of Zhangye City by 0.02% (see
Table 1). Although an improvement in the efficiency of agricultural water use reduces the cost of wheat, cotton, oilseeds, fruit, and other agricultural products, rising capital prices (0.09%) result in price hikes in real estate, which accounts for the largest proportion of consumer goods, leading to an overall small increase in the CPI.
(3) Export and import increase by 0.08% and 0.07% (see
Table 1), respectively. Agriculture is the major exporting output of Zhangye City, and improving the efficiency of agricultural water leads to a direct reduction in the costs of producing corn, fruit, vegetables and wheat, thereby increasing export. The increase in import is mainly due to the rising costs of export-oriented sectors as a result of rising land prices, such as the construction and chemical sectors. As local goods become less competitive, import volumes increase.
(4) Employment increases by 0.05% (see
Table 1). As the ratio of CPI over GDP deflator rises, with real wages fixed, agricultural water technological improvement will increase the average productivity of the economy, which will make the marginal product of labor fall. Moreover, since the capital stock is exogenous, employment therefore increases. According to 2015 Zhangye City statistics, 0.74 million people were employed, so employment increased by only 592 people. Under the premise that the short-term real wage level remains unchanged, the price level rise will cause the pressure of the labor price to rise (0.02%).
(5) An improvement in the efficiency of agricultural water use can save water resources. Simulation results show that improving the efficiency of agricultural water use can save total water consumption by 5.17%, including surface water by 5.32%, underground water by 4.93%, and other water by 4.08%(see Talble 1). The water consumption saving reflects the water use structure of Zhangye City, with surface water being 67%, underground water being 30%, and other water being 3%.
In summary, improving the efficiency of agricultural water use leads to growth in the Zhangye City’s GDP, as well as water conservation. Simulations using Zhangye City’s 2015 economic output and total water consumption data show that GDP increases by 37 million yuan, 592 more people are employed, and total water consumption decreases by 122 million m
3 (surface water 85 million m
3, underground water 35 million m
3, and other water 3 million m
3). In addition, improving the efficiency of agricultural water use also promotes an improvement of water use efficiency in the whole economy, with GDP output per unit of water increasing by 5.52%, reaching 16.64 yuan/m
3 (see
Table 2).
3.2. Impact on Sectors
Following an improvement in the efficiency of agricultural water use in Zhangye City, in addition to the large-scale expansion in agricultural sectors such as corn, cotton, fruit and vegetables, different degrees of expansion or contraction are found in different sectors. Among all sectors, outputs of 20 sectors increased, with corn benefiting the most (1.65%). Outputs of 28 sectors decreased, with metal products suffering the most (−0.10%). To simplify the analysis, this section focuses only on the top ten sectors of the increase or decrease in output. Benefiting sectors are found mostly in the agricultural sector, mainly because of the cost advantage thanks to the higher efficiency in agricultural water use. Land-intensive sectors show mainly reductions in output because of the increase in land rental prices. Other sectors such as residential service, electric power, water production and supply, and non-metallic mineral products are affected by the impact of the upstream and downstream linkages, leading to changes in output.
3.2.1. Benefiting Sectors
Table 3 lists the top ten benefiting sectors, which are mainly export-oriented sectors. Corn output expansion is the largest, at 1.65%, followed by cotton (1.23%, the data is the percentage change of the sector’s output after simulation), fruit (1.19%), wheat (0.92%), vegetables (0.43%), and oilseeds (0.04%). The different changes in output of the various agricultural sectors are mainly due to the different intensities of water use; the higher the water intensities, the larger the change of output. The database of the model shows that 99% of these six agricultural products are for export, and water costs account for a high proportion of the production cost, so an improvement in the efficiency of agricultural water use leads to a reduction in cost and an increase of competitiveness in regional trade, thus resulting in export-led output expansion in these agricultural sectors. The expansion of output in the agricultural sector leads to an increase in demand for the residential service and electric power, prompting a small increase in the output of the two sectors. In addition, 99% and 53% of wholesale and retail trade and finance are for margins, respectively, and the margin of the wholesale and retail trade is used mainly for export, so the expansion in the output of the agricultural sectors directly stimulate wholesale and retail trade’s export. Also, the margin of the finance is used mainly for consumption, and the increase in consumption demand leads to an increase in output (see
Table 3).
3.2.2. Damaged Sectors
Table 4 lists the ten most damaged sectors. The changes are fairly small, with the metal products suffering the most by having a reduction in output of 0.10% (see
Table 4). The ten most damaged sectors tend to be those in which land availability falls as the rent prices of land rise: some sectors are affected by export demand reduction, and some sectors are affected through the upstream and downstream production chain. The specific reasons are as follows.
(1) Increased costs for export-oriented sectors with high land and labor shares. In metal products (59%, the data is the percentage of the sector’s output affected by export) , postal (28%), other agriculture (99%), stationery manufacturing (57%), general and special equipment manufacturing (21%) and research and development (56%), land accounts for 39%, 34%, 5%, 15%, 20% and 7% of total factor inputs, respectively. Because of the rising rental price of land, the cost of these sectors increases, thus export prices rise and export demands fall. The contraction in management of public facilities (99%) is due to a decrease in export demand as a result of rising labor costs (see
Table 4).
(2) The pull effect of the downstream sector construction. A total of 83% of the construction’s input is imported; rising land rental prices reduces the sector’s competitiveness in trade and therefore its export demand, leading to shrinkage in sector output. The output of water production and supply (43%, the data is the proportion of the flow of the sector’s output to the construction), non-metallic minerals (83%), and non-metallic ore-mining (87%) are mainly used by the construction. Hence the reduction in the output of the latter reduces demand for the former sectors’ products (see
Table 4).
3.3. Allocation of Water and Land Resources across Sectors
The changes in the output of sectors, resulting in demand for primary factors’ change can cause market price adjustment, leading to the reallocation of primary factors in the economy. The simulation results show that an improvement in the efficiency of agricultural water use leads to a reduction in total water use of 122 million m
3 (see
Table 2), achieved mainly through reduced surface water consumption by agricultural sectors with high water use intensities. The water consumption of corn and wheat in grain crops (57%) is reduced more than that of economic crops (43%) such as fruit and vegetables. In addition, the expansion in the output of the agricultural sector leads to an increase in the total demand for land by 257.43 hectares (summed by the
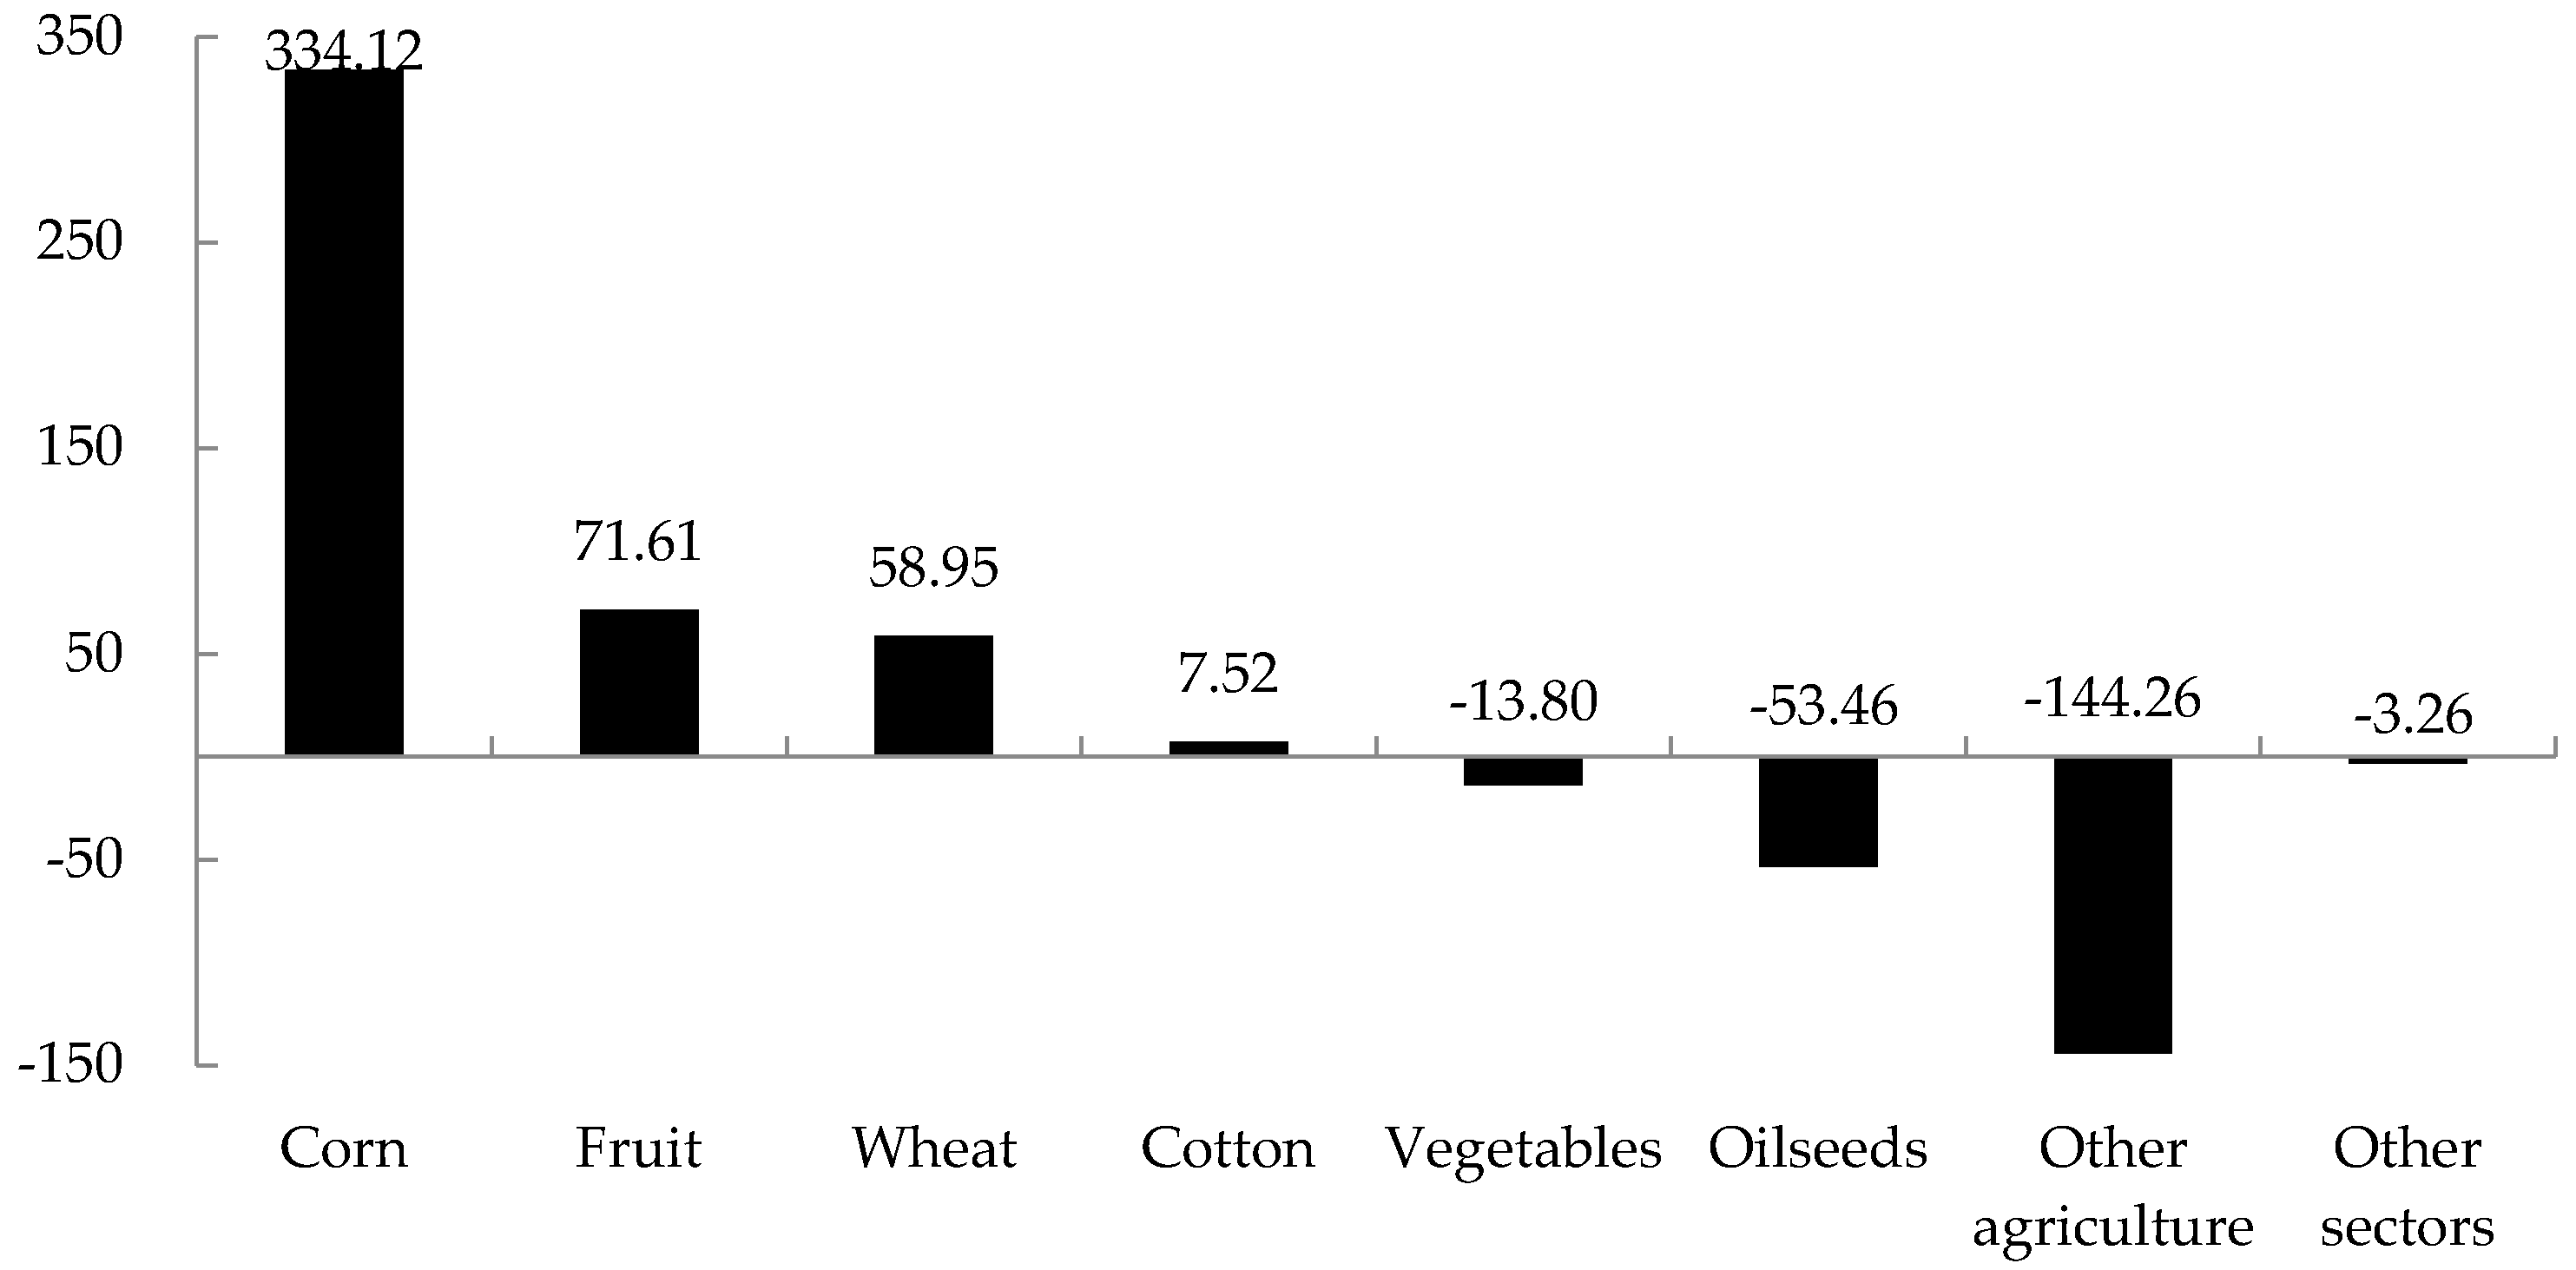
Figure 3), while land circulates mainly within the agricultural sector, with land for oilseeds, vegetables, and other agriculture being transferred to land for corn, fruit, wheat, and cotton. Of these, the largest increase in land demand, 334.12 hectares, is by corn, and the largest reduction in demand, 144.26 hectares, is by other agriculture (see
Figure 3). To some extent, the improvements in water efficiency may slow down the urbanization rate, at which agricultural land is turned over to various urban development purposes.
3.3.1. Total Demand for Land Increases, and Land Transfer Within the Agricultural Sector
Figure 3 shows the main sector changes in Zhangye City’s land demand after an improvement in the efficiency of agricultural water use. The simulation results show that the demand for land in Zhangye City increases overall by 257.43 hectares, although it should be noted that this value reflects both increases and decreases in land demand across sectors. Land demand increases for corn (334.12 hectares), fruit (71.61 hectares), wheat (58.95 hectares), and cotton (7.52 hectares) by a total of 472.20 hectares (see
Figure 2). The land use of these four agricultural sectors accounts for 30%, 12%, 18%, and 1%, respectively, of the total amount of land used in Zhangye City, with a high intensity of land use, being at 29%, 18%, 30%, and 44%, respectively, so the demand for land increases.
Except for the aforementioned sectors, the demand for land in other sectors is reduced. Of these, other agriculture (−144.26 hectares), oilseeds (−53.46 hectares), and vegetables (−13.80 hectares) contribute the most to the reduction in land demand, and the reduction in other sectors’ total land demand is about 3.26 hectares (see
Figure 3)—a result of the increase in land rental prices. The rate of land use by other agriculture is 21%, and outputs shrink, resulting in a decrease in the demand for land. With the expansion in the output of oilseeds and vegetables the demand for land of these two sectors decreases. Occurring mainly because the proportion of land in the primary factor inputs is much greater than that of water, the rental price of land becomes more sensitive, thus reducing the demand for land.
In summary, after an improvement in the efficiency of agricultural water, the overall land demand increases by 257.43 hectares. Corn, fruit, wheat, and cotton contribute the most to land demand (an increase of 472.20 hectares). Other agriculture, oilseeds, and vegetables contributed the most to the reduction in the demand for land (a decrease of 211.52 hectares). The overall reduction in demand for land of other sectors is only 3.26 hectares. Therefore, the land is mainly circulated within the agricultural sector, that is, the increased demand for land for producing corn, fruit, wheat, and cotton is transferred mainly from the reduction in land demand for other agriculture, oilseeds, and vegetables.
3.3.2. The Water-Saving Contribution of Surface Water in the Agricultural Sector Is the Most Substantial
Improving the efficiency of agricultural water use can save water resources. The modeling shows that with respect to 2015 data for water use, the total water consumption reduces by 122 million m
3, with surface water consumption reducing by 85 million m
3 (69% of the total water consumption reduction), underground water consumption by 35 million m
3 (28%), and other water consumption by 3 million m
3 (less than 3%) (see
Table 2). At the sector level, the total amount of water resources saved by the agricultural sector plays by far the leading role, accounting for nearly 100% of the total water saved.
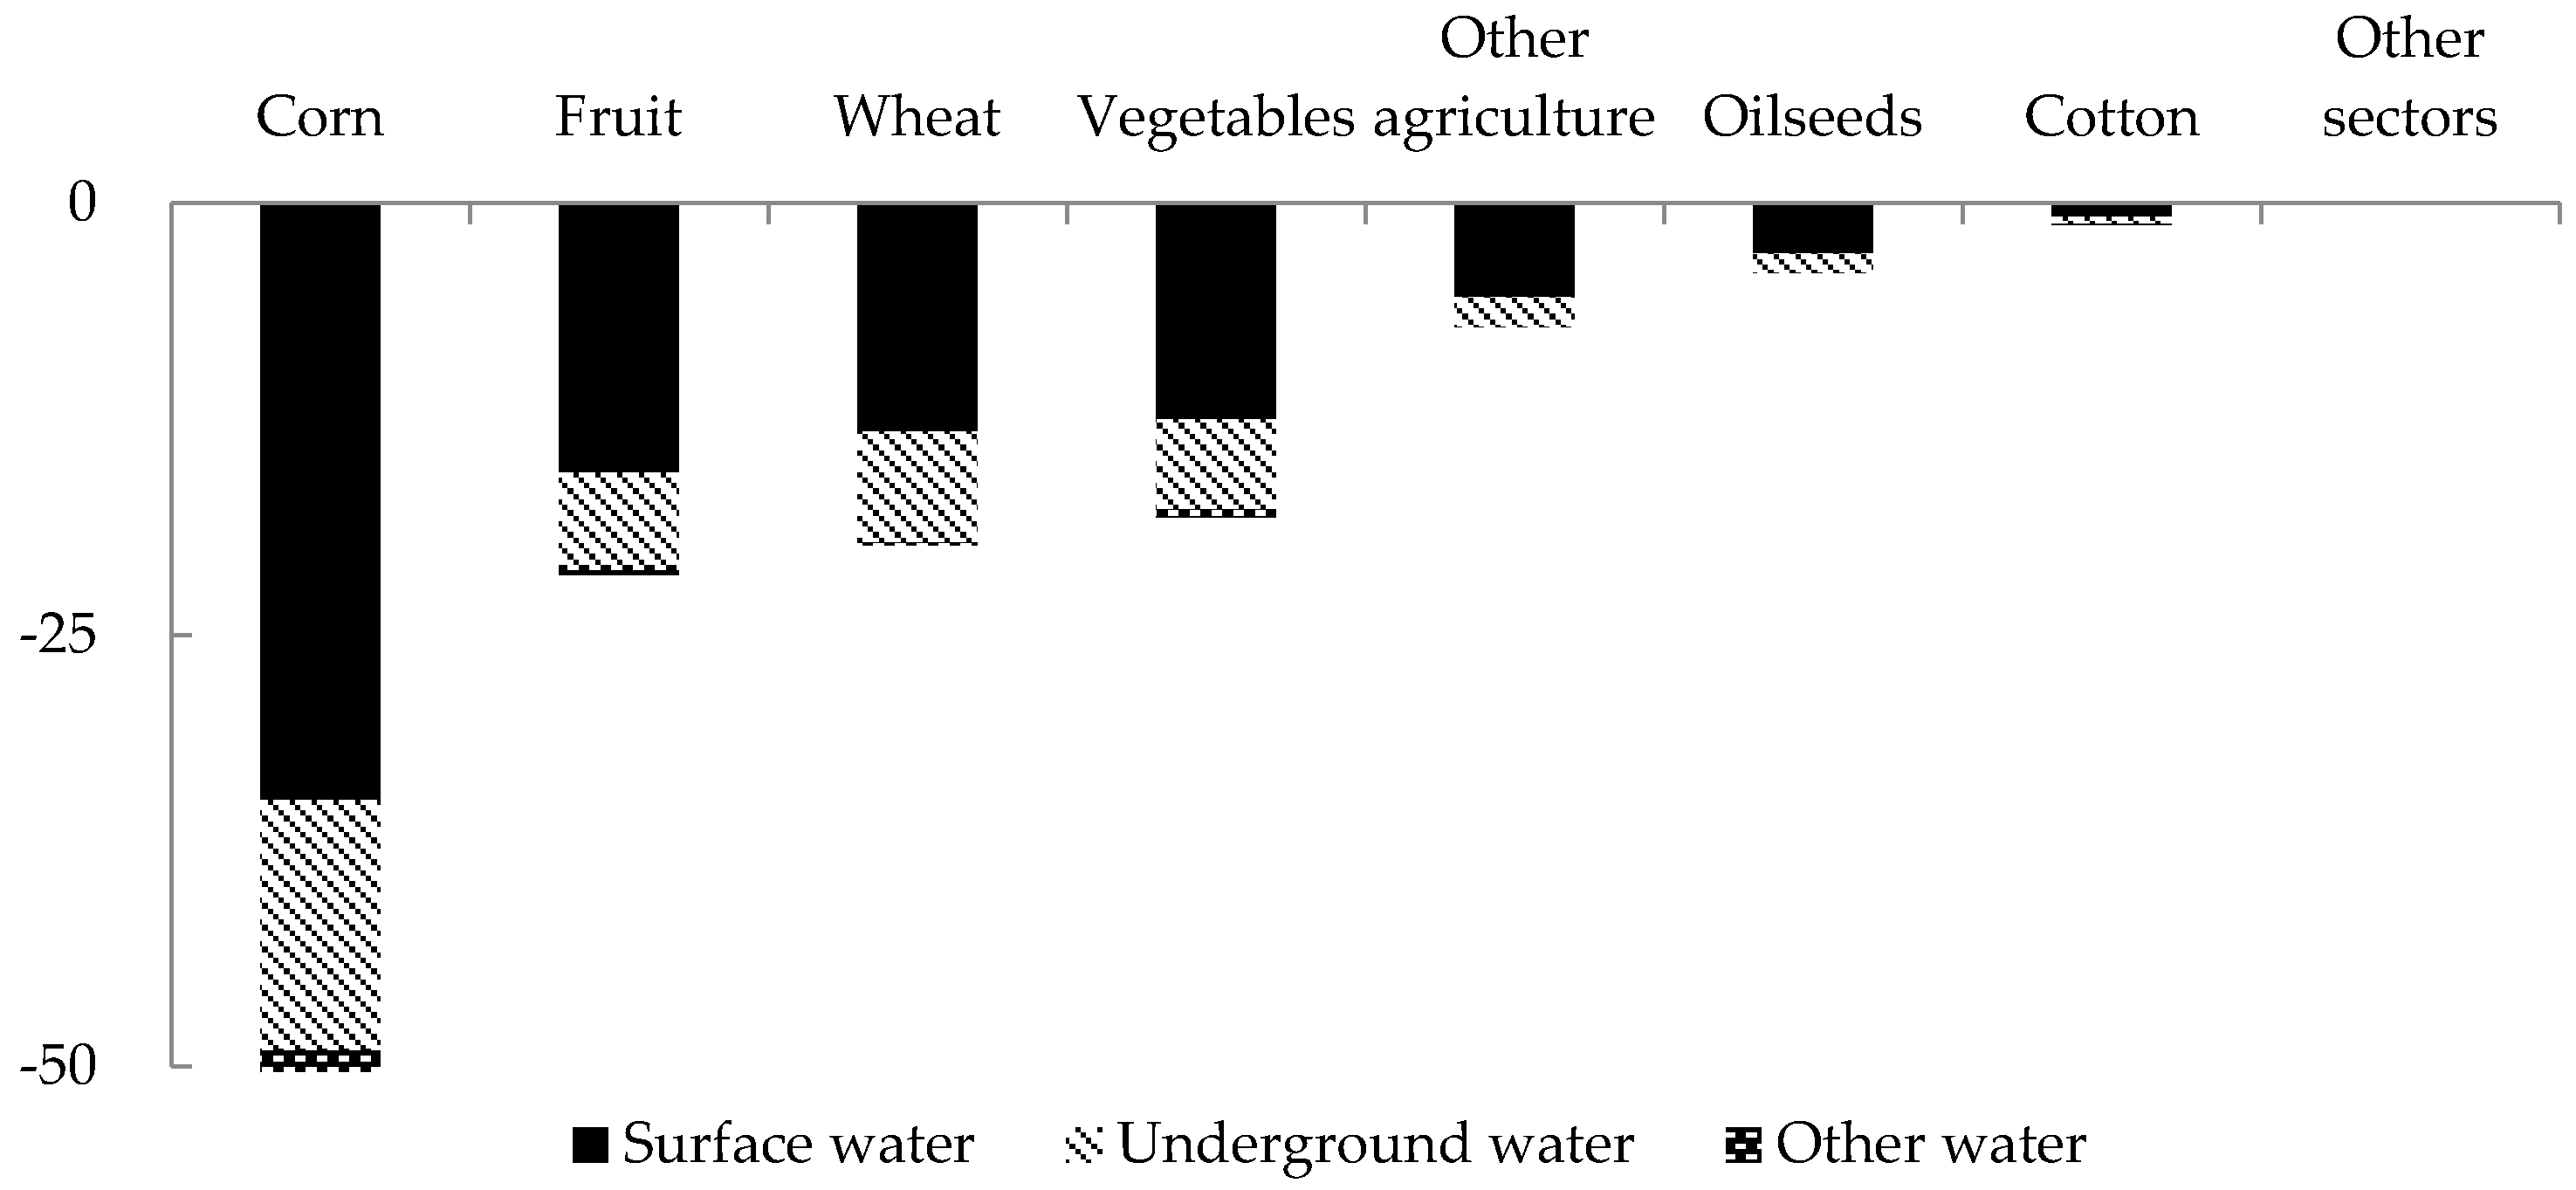
Figure 4 shows the major changes in water demand by sector as modeled using 2015 water data. With respect to different crop types, the water-saving effect of grain crops is the best, accounting for about 57% of the total water savings. Among these, the contribution of corn is the most significant (50.50 million m
3), followed by wheat (19.81 million m
3). Economic crops account for about 43% of the total reduction in water use, of which the reduced water consumption of fruit production is the largest (21.55 million m
3), followed by vegetables (18.17 million m
3). Other agriculture, oilseeds, and cotton saved 7.18, 4.04, and 1.21 million m
3 of water, respectively. The agricultural sector accounts for 97%, which is calculated by total water use of Zhangye City in 2015 based on 2011 water resources census, of the total water consumption of Zhangye City, and the intensities of these agricultural sectors are high; therefore, improving the water use efficiency of agricultural sector should lead to a significant reduction in overall water demand.
Through the three types of water supply—i.e., the use of surface water, underground water, and other water—improvements in efficiency of agricultural water use can be observed with reductions of 85.03 million m
3, 34.68 million m
3, and 2.75 million m
3, respectively (see
Table 2). The contribution of surface water to water savings is the largest, accounting for about 69%, followed by underground water, accounting for about 28%. This reflects mainly the percentages contributed by the three different water supply sources to the total amount of water currently used in Zhangye City. In addition, of the three types of water resources, the demand of surface water is reduced the most, as the reduction in surface water use in the agricultural sector is the largest among the three types.
3.4. Discussion
This study, based on the CGE model, aims to analyze the impact of the agricultural water technology improvement on the economy and water−land implications in Zhangye City. The results have shown that the agricultural water technology improvement, on the one hand, is beneficial to Zhangye City’s GDP and agricultural water conservation. On the other hand, the expansion of some agricultural sectors will increase the demand for land, which will make land availability fall in some other sectors, i.e., to some limited extent, inhibiting the urbanization pace of Zhangye City. That is to say, enhancing agricultural water efficiency has not only positive but also negative implications. Its influences need to be evaluated comprehensively by the government. Moreover, among the agricultural sectors, some products will expand and some will contract. This could result in transitional costs to farmers. As the data is limited, the efficiency of three kinds of water is difficult to calculate in the mechanism of the CGE model. Instead, this study only simulates the improvement of raw water in agricultural sectors. Moreover, we did not distinguish the land types, such as contaminated land, or land with special geographical features, spatial characteristics, and the natural climate, which may not be suitable for planting. In future research, therefore, more studies could be conducted to differentiate the efficiency of three kinds of water and land types providing convenience for choosing sectors in which land is not mobile into agriculture.
4. Conclusions and Policy Implications
Taking Zhangye City as an example, this paper analyzed the likely impact of an improvement in the agricultural water use efficiency on the economy, water conservation and land reallocation in Zhangye City. To do so, we apply a Computable General Equilibrium (CGE) model and incorporated a water and land resources account. The results showed that improving the efficiency of agricultural water use raises the GDP of Zhangye City by 0.10% (see
Table 1) while conserving water resources of 122 million m
3 (see
Table 2)—of which surface water contributes 69% of the reduction in consumption and underground water 28%. Improvement in the efficiency of agricultural water use also increases the efficiency of water use in the economy as a whole, with GDP output per unit of water increasing by 5.52%.
With respect to different sectors, the changes in output are positive and fairly large in the export-oriented sectors, with the main benefiting sectors being in the agricultural sector with high water use intensities, whereas the damaged sectors are those that are more affected by high land input factors, although such changes in output are negative and fairly small. Considering the allocation of land and water resources, the reduction in surface water consumption of the agricultural sector with high water use intensity has the greatest contribution to water savings, with grain crops (including corn and wheat) contributing more to the reduction in consumption than economic crops such as fruit and vegetables. Furthermore, the expansion in the output of the agricultural sector leads to an increase in the demand for land, with land being transferred from oilseeds, vegetables, and other agriculture to corn, fruit, wheat, and cotton, internally in the agricultural sector.
Based on the results of this study and the current situation of economic development in Zhangye City, we propose the following policy recommendations. First, a targeted water conservation plan should be developed with particular regard to the usage pattern of surface water, underground water, and other water sources. According to the simulation results, three kinds of water all decrease, and the savings in use of surface water accounted for the largest proportion. Therefore, agricultural technologies should be promoted more for surface water to save agriculture water resources.
Second, adjusting the agricultural planting structure should not only pay attention to the relative output prices, but also the nature of water conservation in the sector. Based on the simulation results for the total amount of water savings, the water-saving effect of grain crops like corn and wheat is superior to that of economic crops such as fruits and vegetables. This is mainly because the water consumption of grain crops is much greater than that of economic crops. To achieve the optimal allocation of water resources, Zhangye City should pay more attention to the nature of plants in water-saving conservation in the process of adjusting agricultural production structure, such as enlarging the planting area of low-water-consumption economic crops.
Third, the transfer of agricultural land and non-agricultural land needs to be considered. Zhangye City is one of the country’s top ten largest commodity-grain-producing areas, and agriculture is the city’s major output. An expansion in the output of agricultural sectors increases demand for land but reduces land availability for other sectors, thus inhibiting urbanization. The influences of the improvement in the agricultural water efficiency need to be evaluated comprehensively by the government.
Fourth, the negative spillover effect of the improvement in the efficiency of agricultural water use should not be ignored. An improvement in such efficiency leads to increases in the market prices of capital, labor and land. Higher factor input costs affect export-oriented sectors negatively, particularly those with large output shares such as construction and food processing. The government should take heed and thus appropriate measures to reduce the negative impact on these leading sectors.


