
The Development of the Renewable Energy Power Industry under Feed-In Tariff and Renewable Portfolio Standard: A Case Study of China’s Photovoltaic Power Industry


Abstract
:1. Introduction
1.1. Background
1.2. Literature Review
1.3. Rationale and Structure of the Paper
2. Methodology
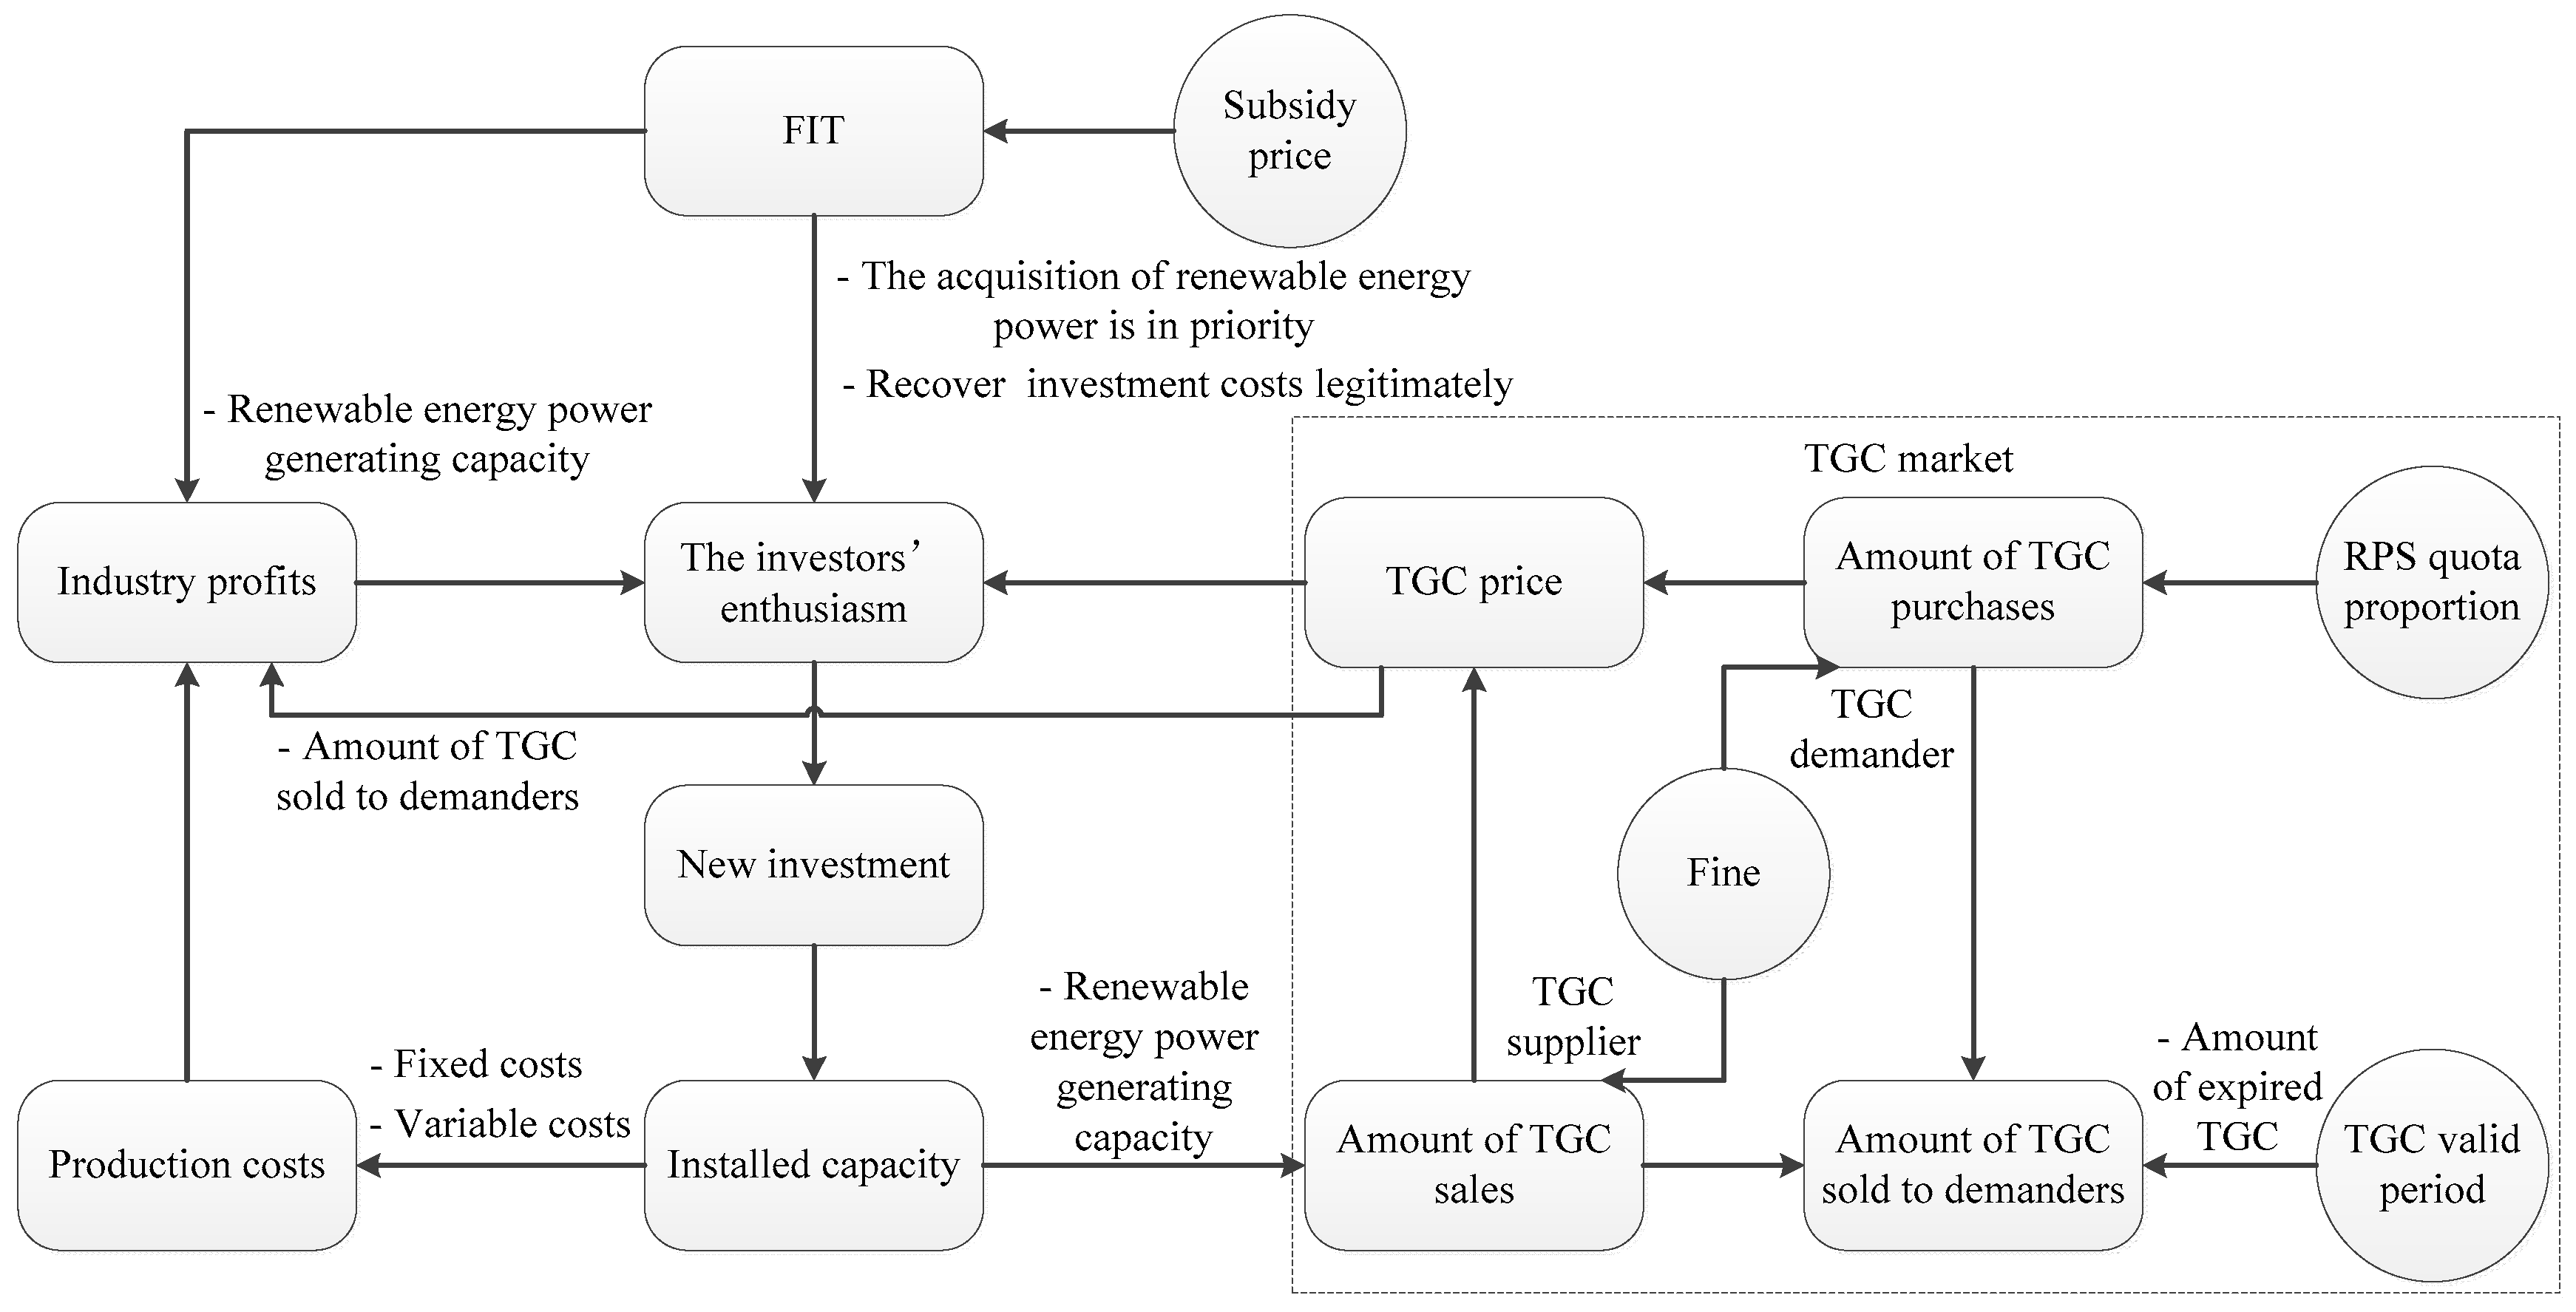
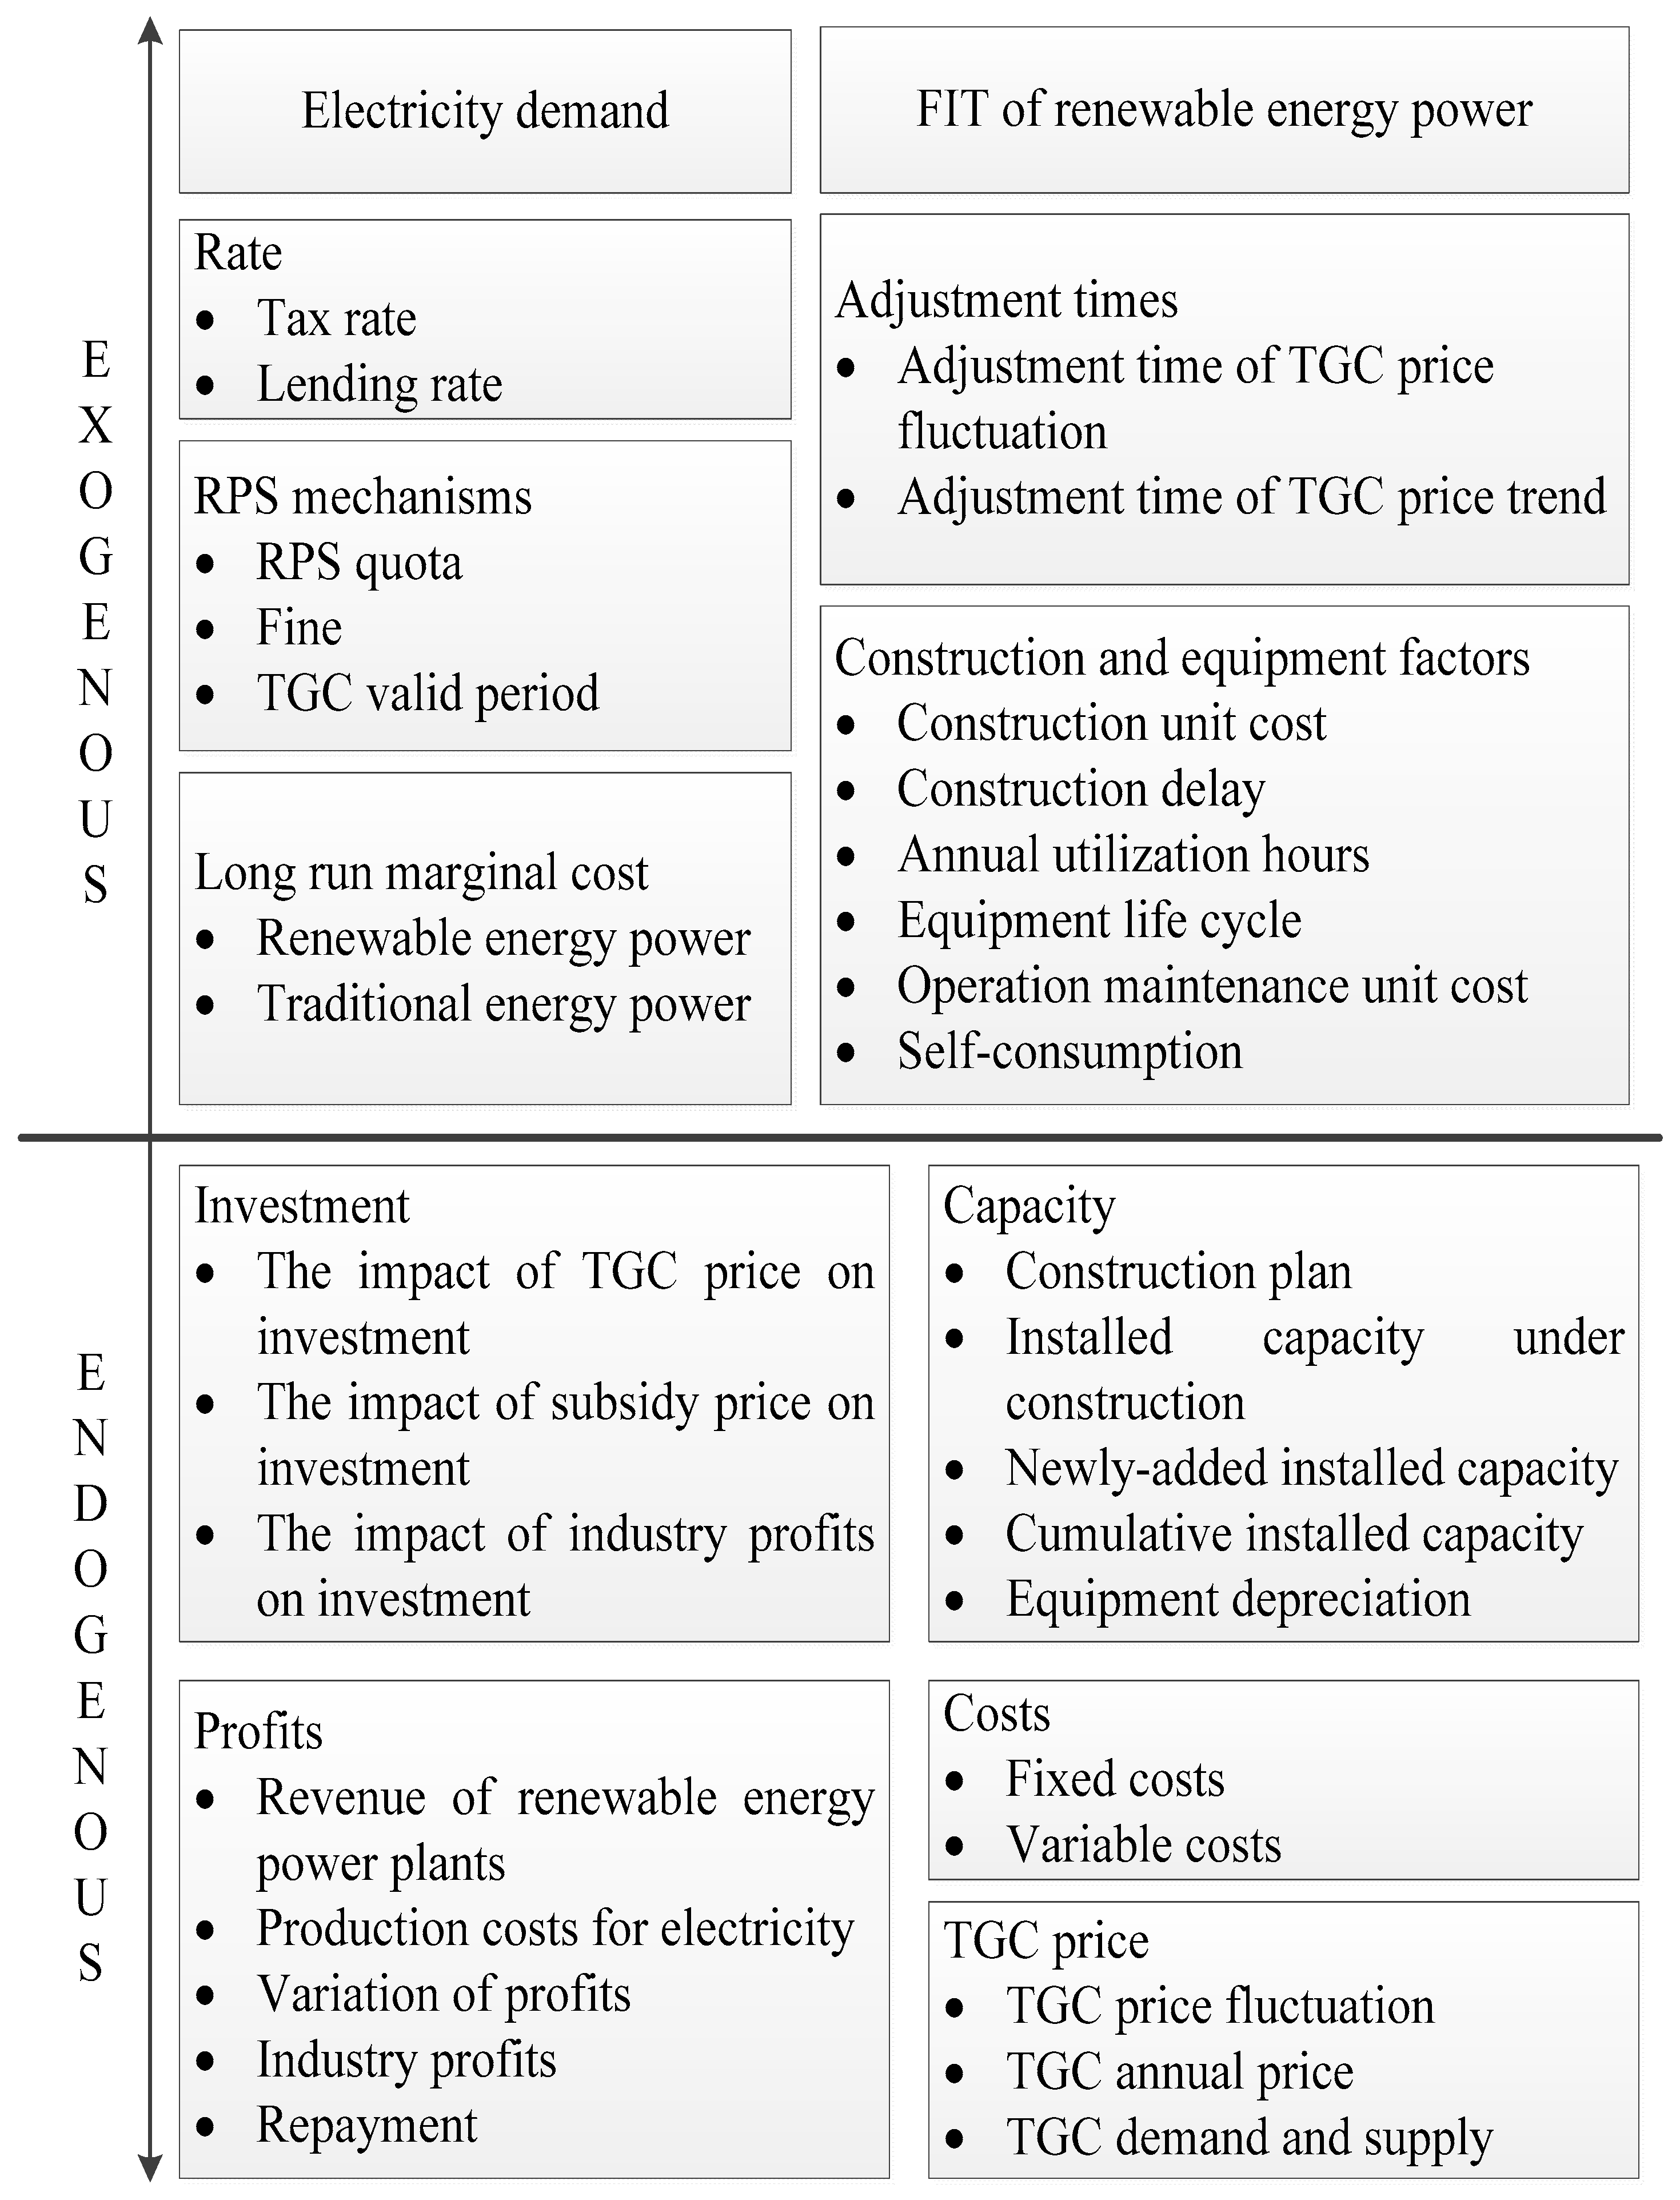
2.1. Theoretical Framing Analysis
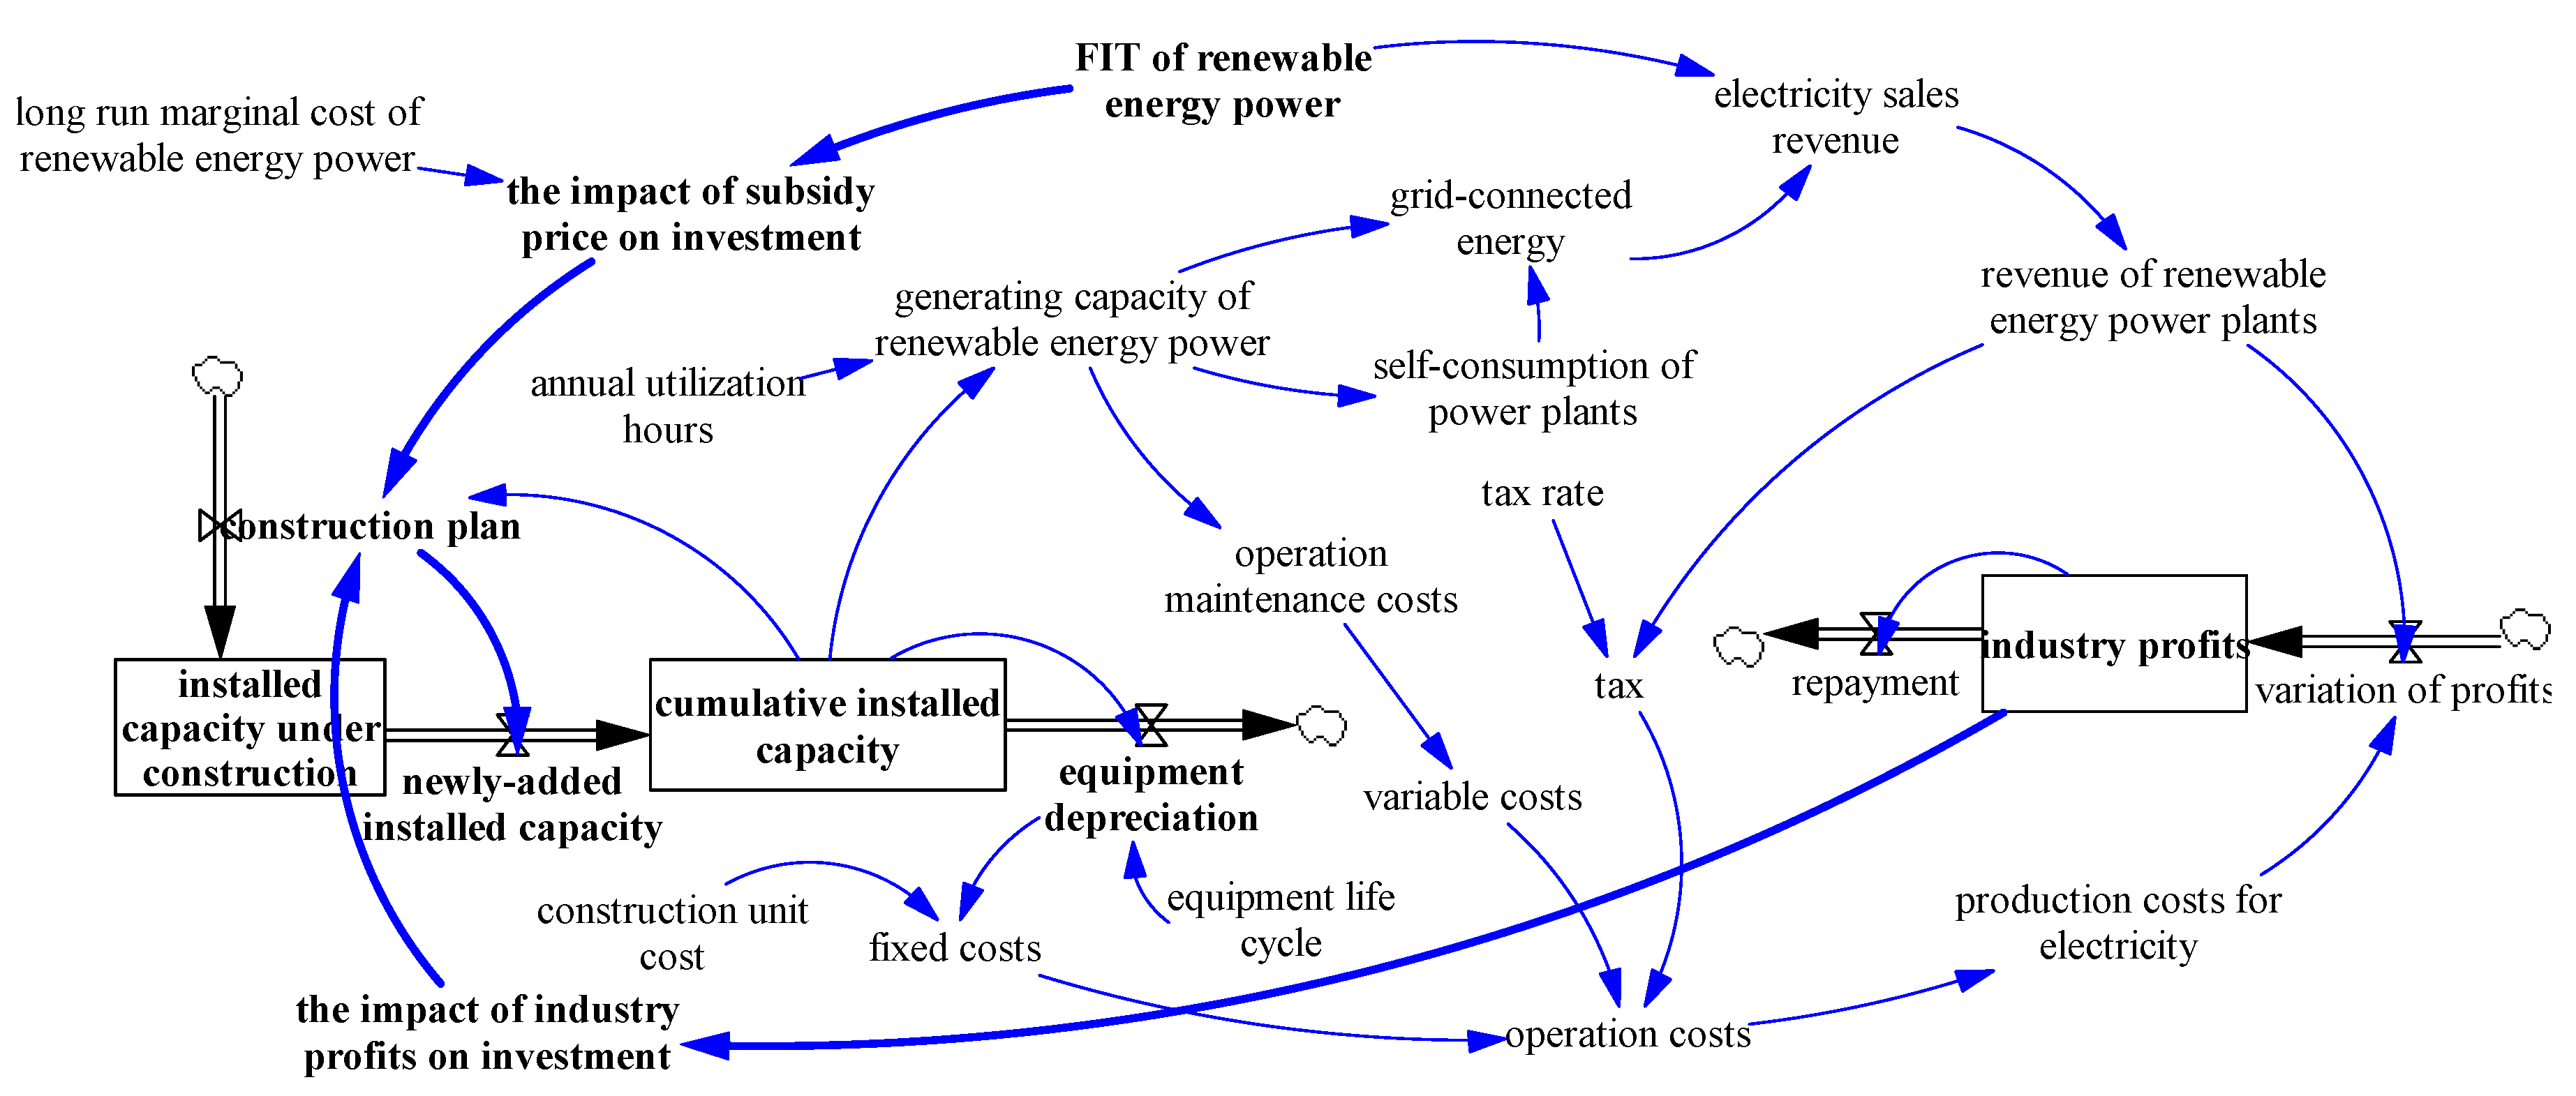
2.1.1. FIT Module
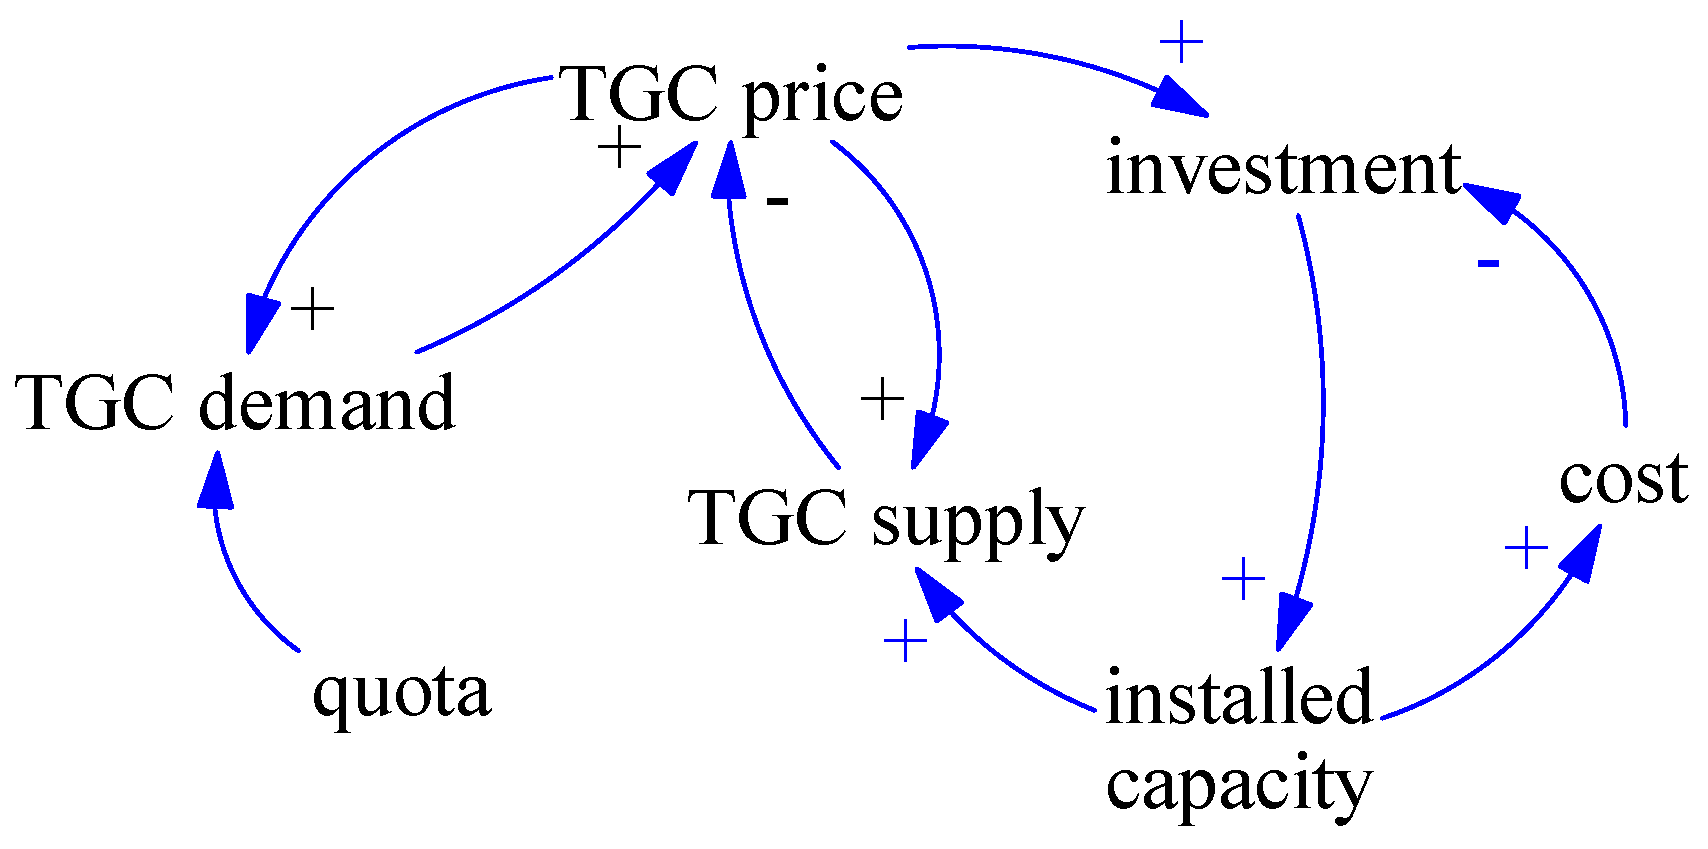
2.1.2. RPS Module
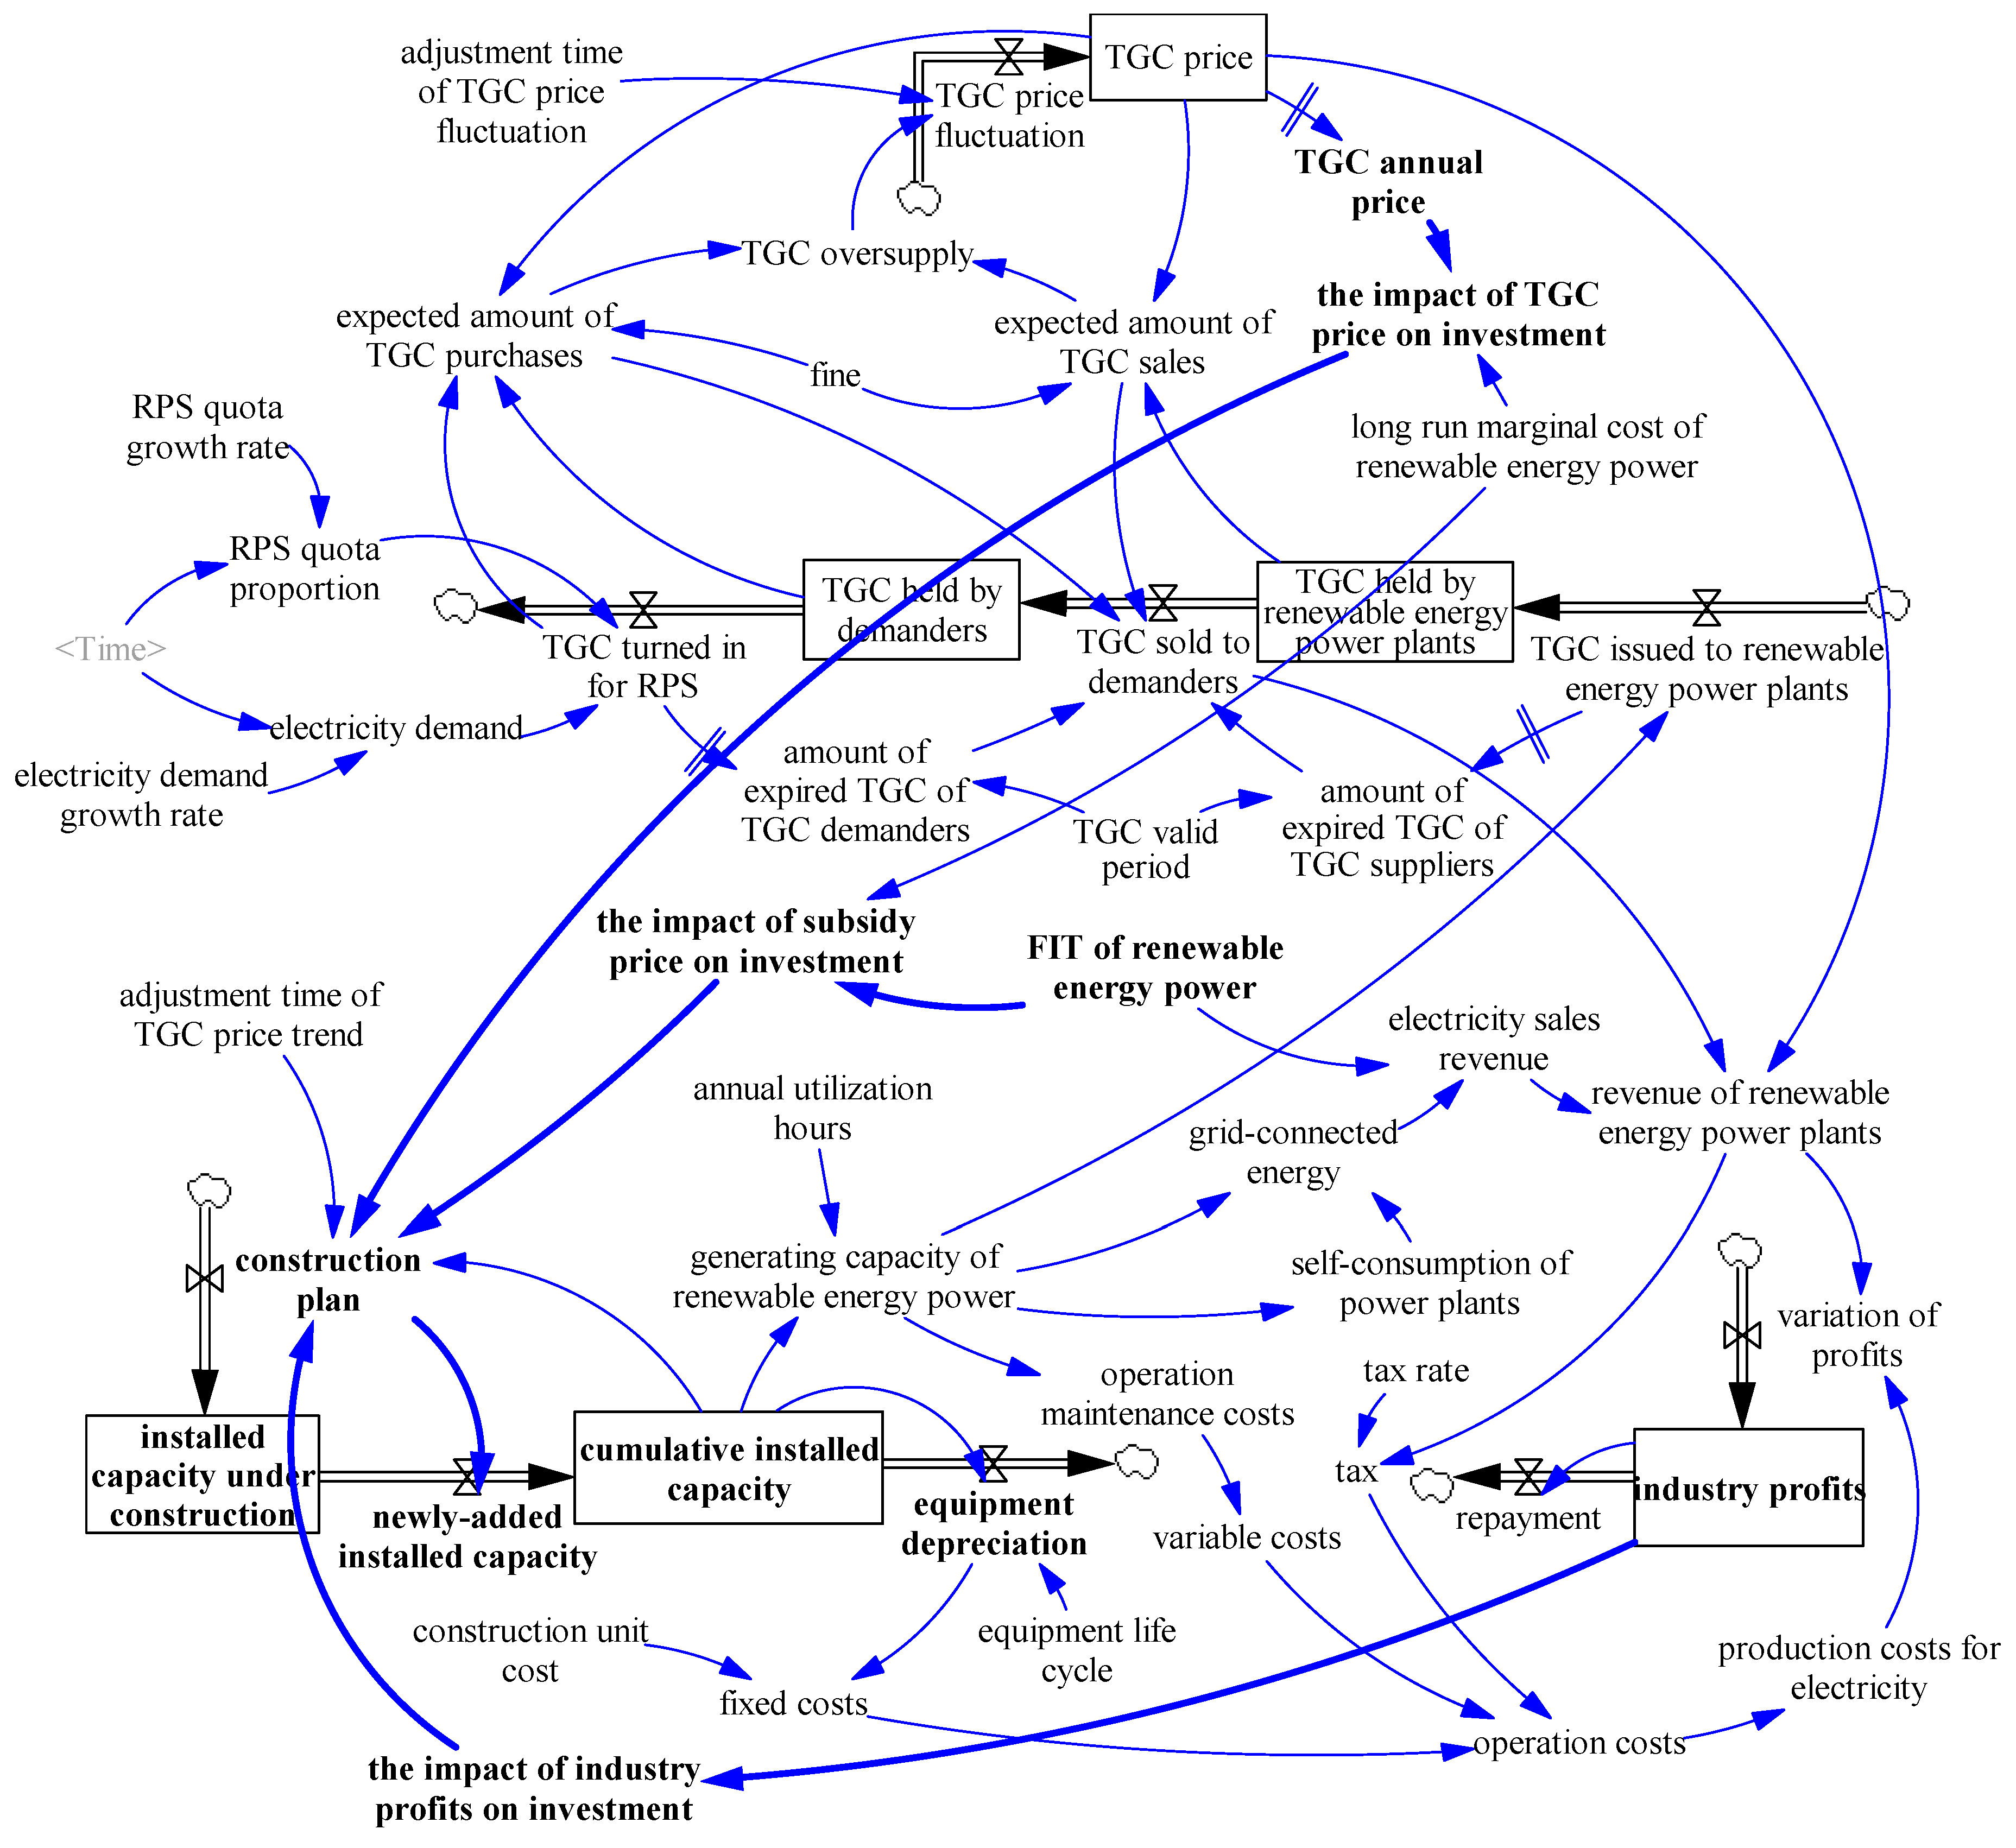
2.2. Model Design
2.2.1. Model under FIT Scheme
2.2.2. Model under RPS Scheme
2.3. Validation of Dynamic Models
2.3.1. Boundary Adequacy
2.3.2. Structure Verification
2.3.3. Dimensional Consistency
2.3.4. Parameter Verification
2.3.5. Extreme Condition Test
2.3.6. Structurally Oriented Behavior Test
3. Data, Simulation Results and Analysis
3.1. Data
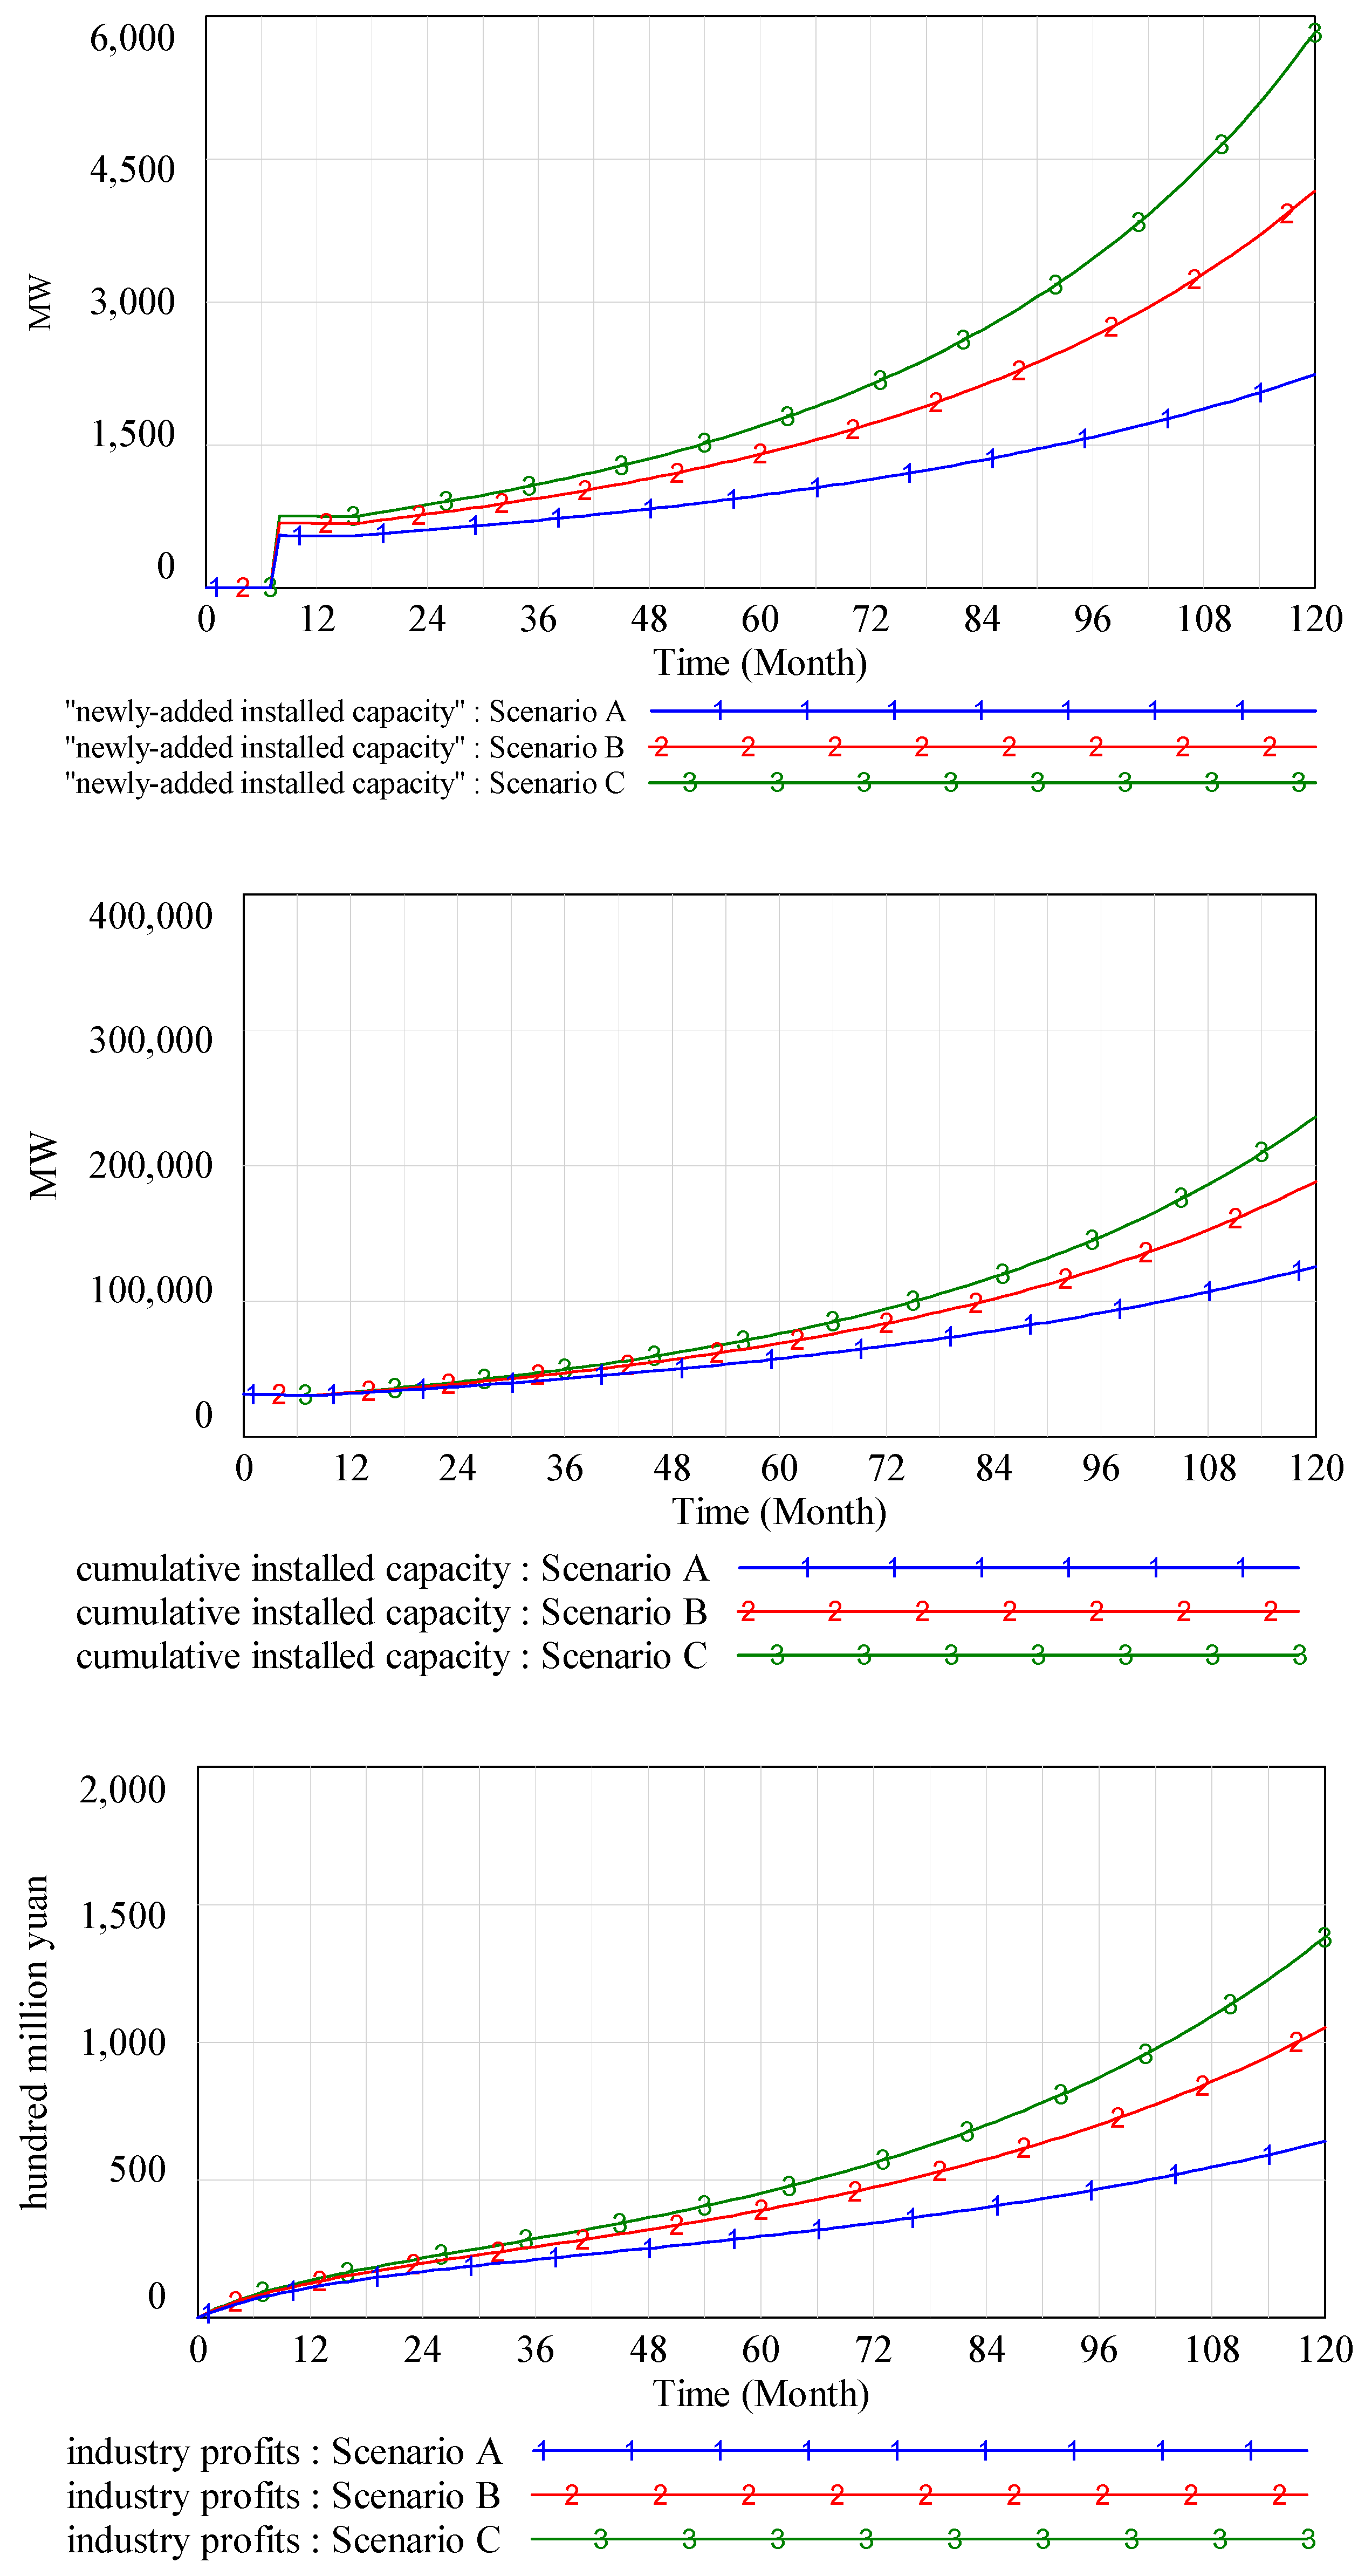
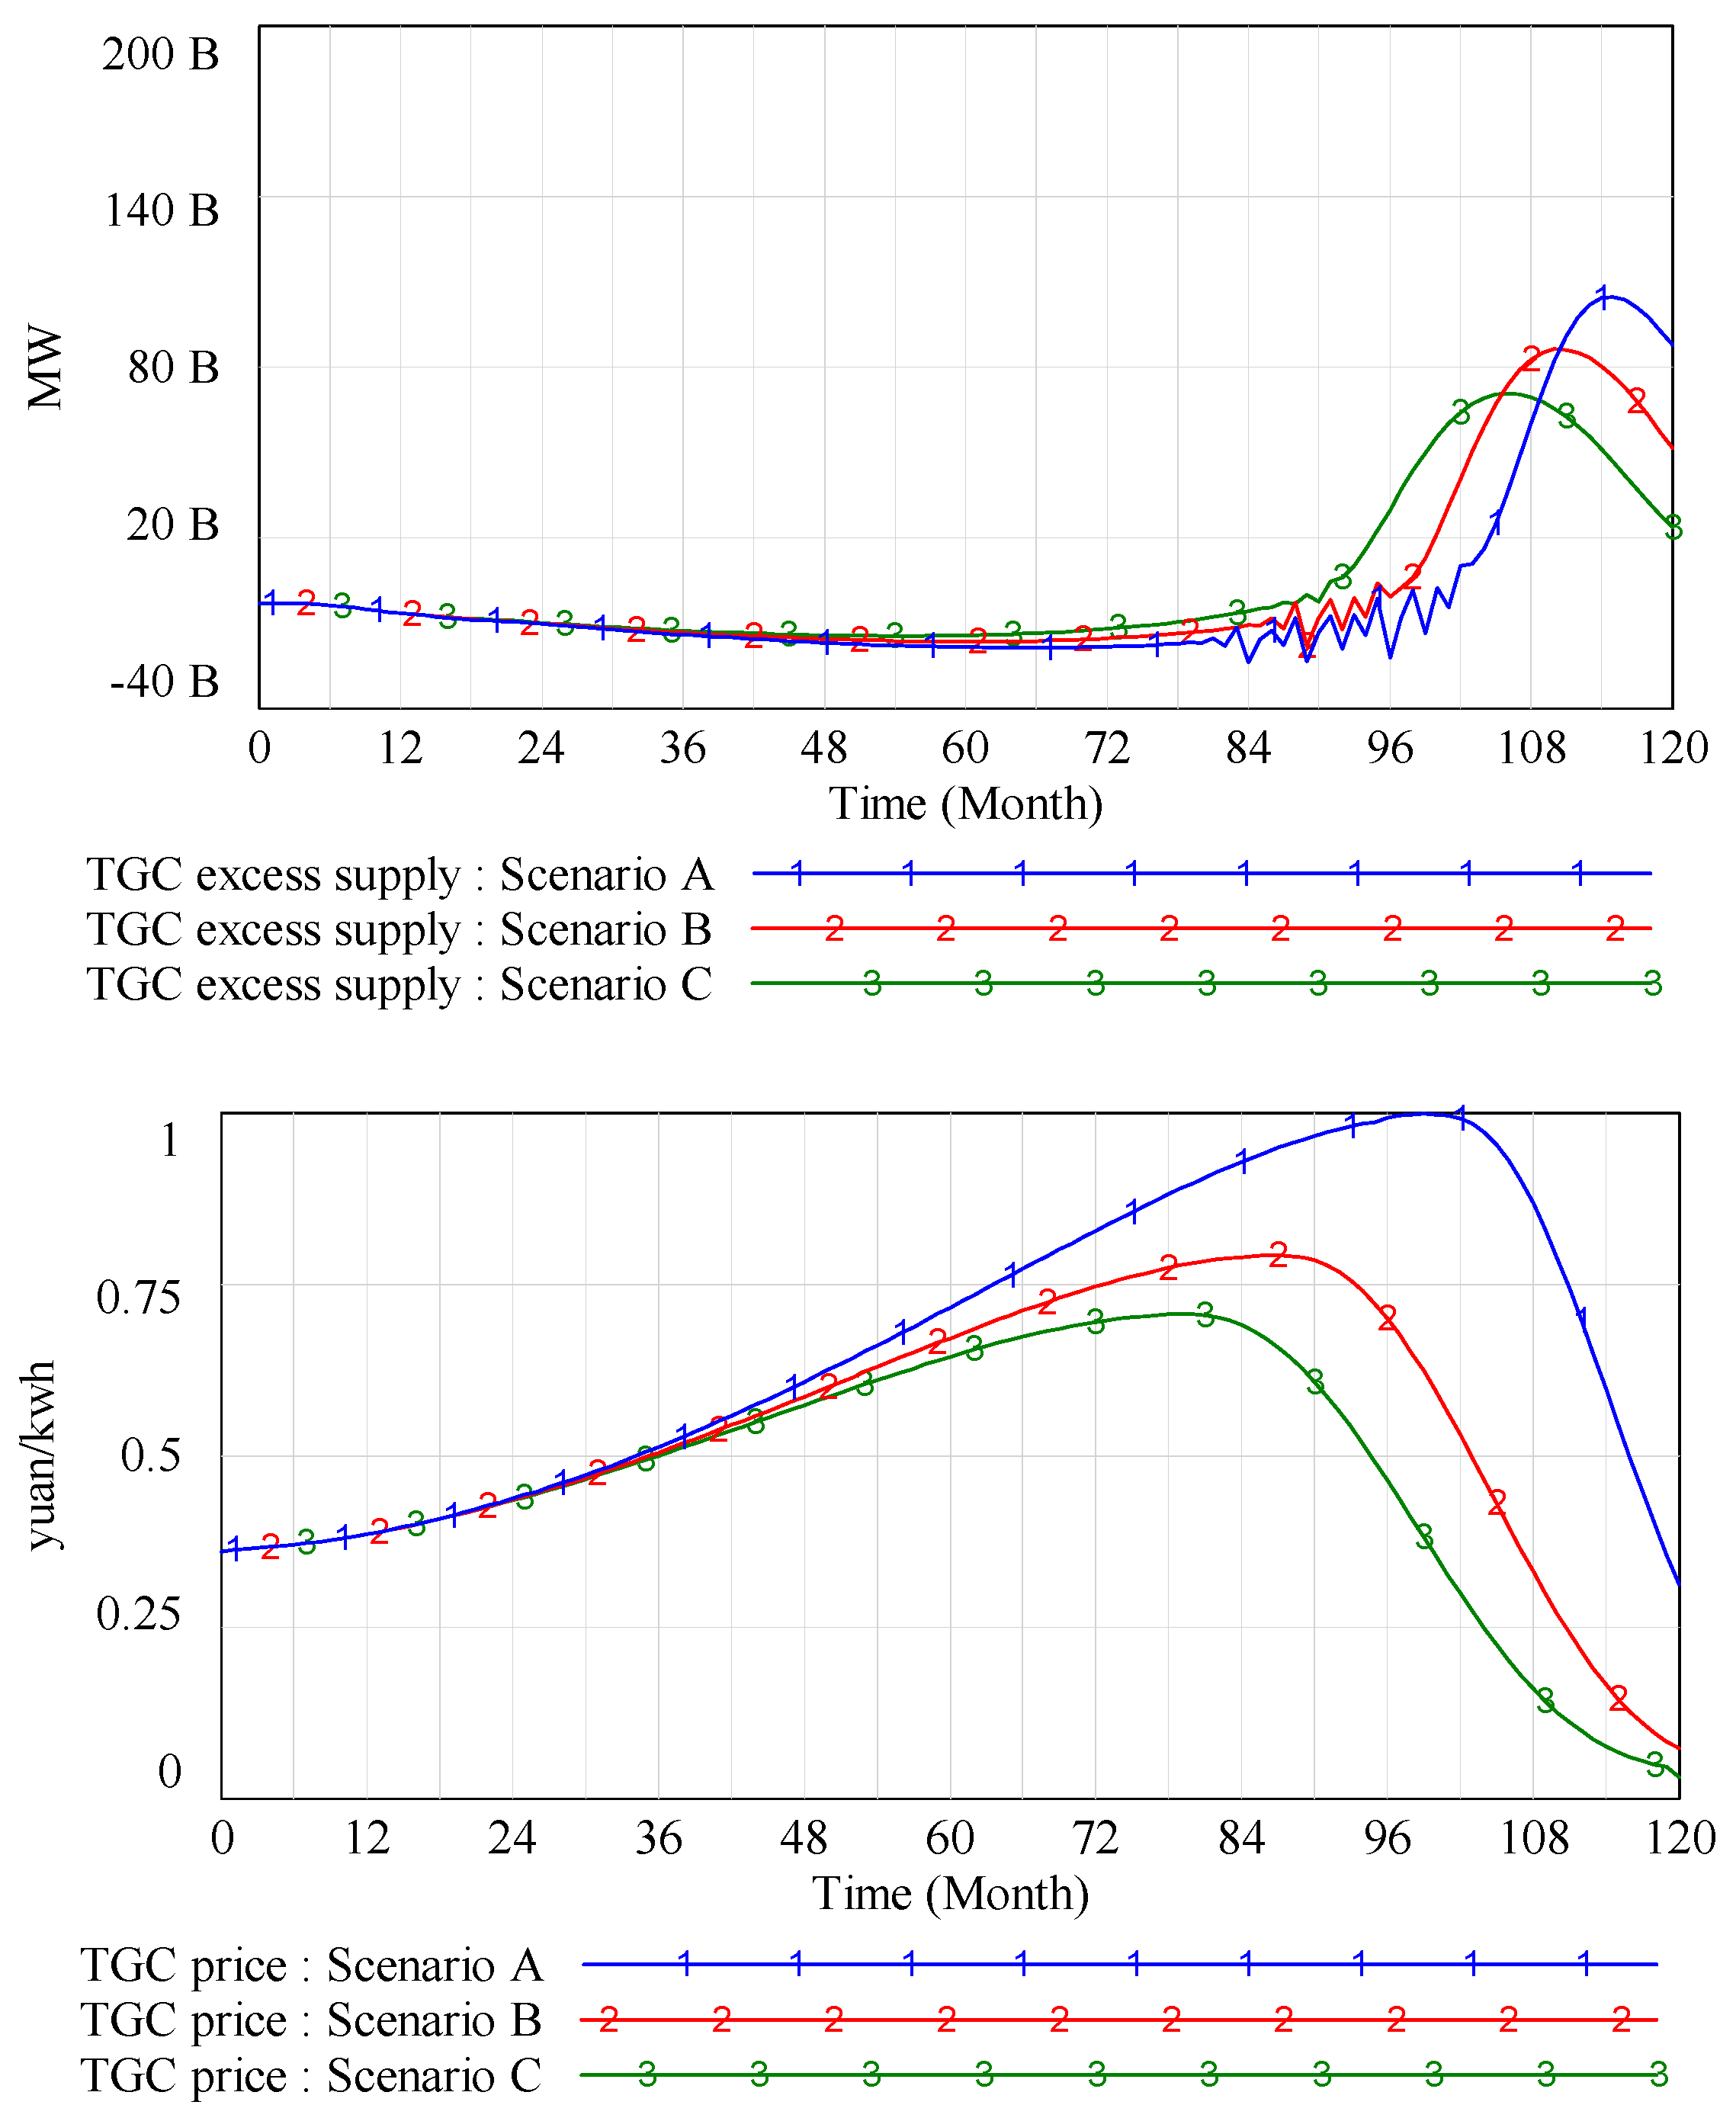
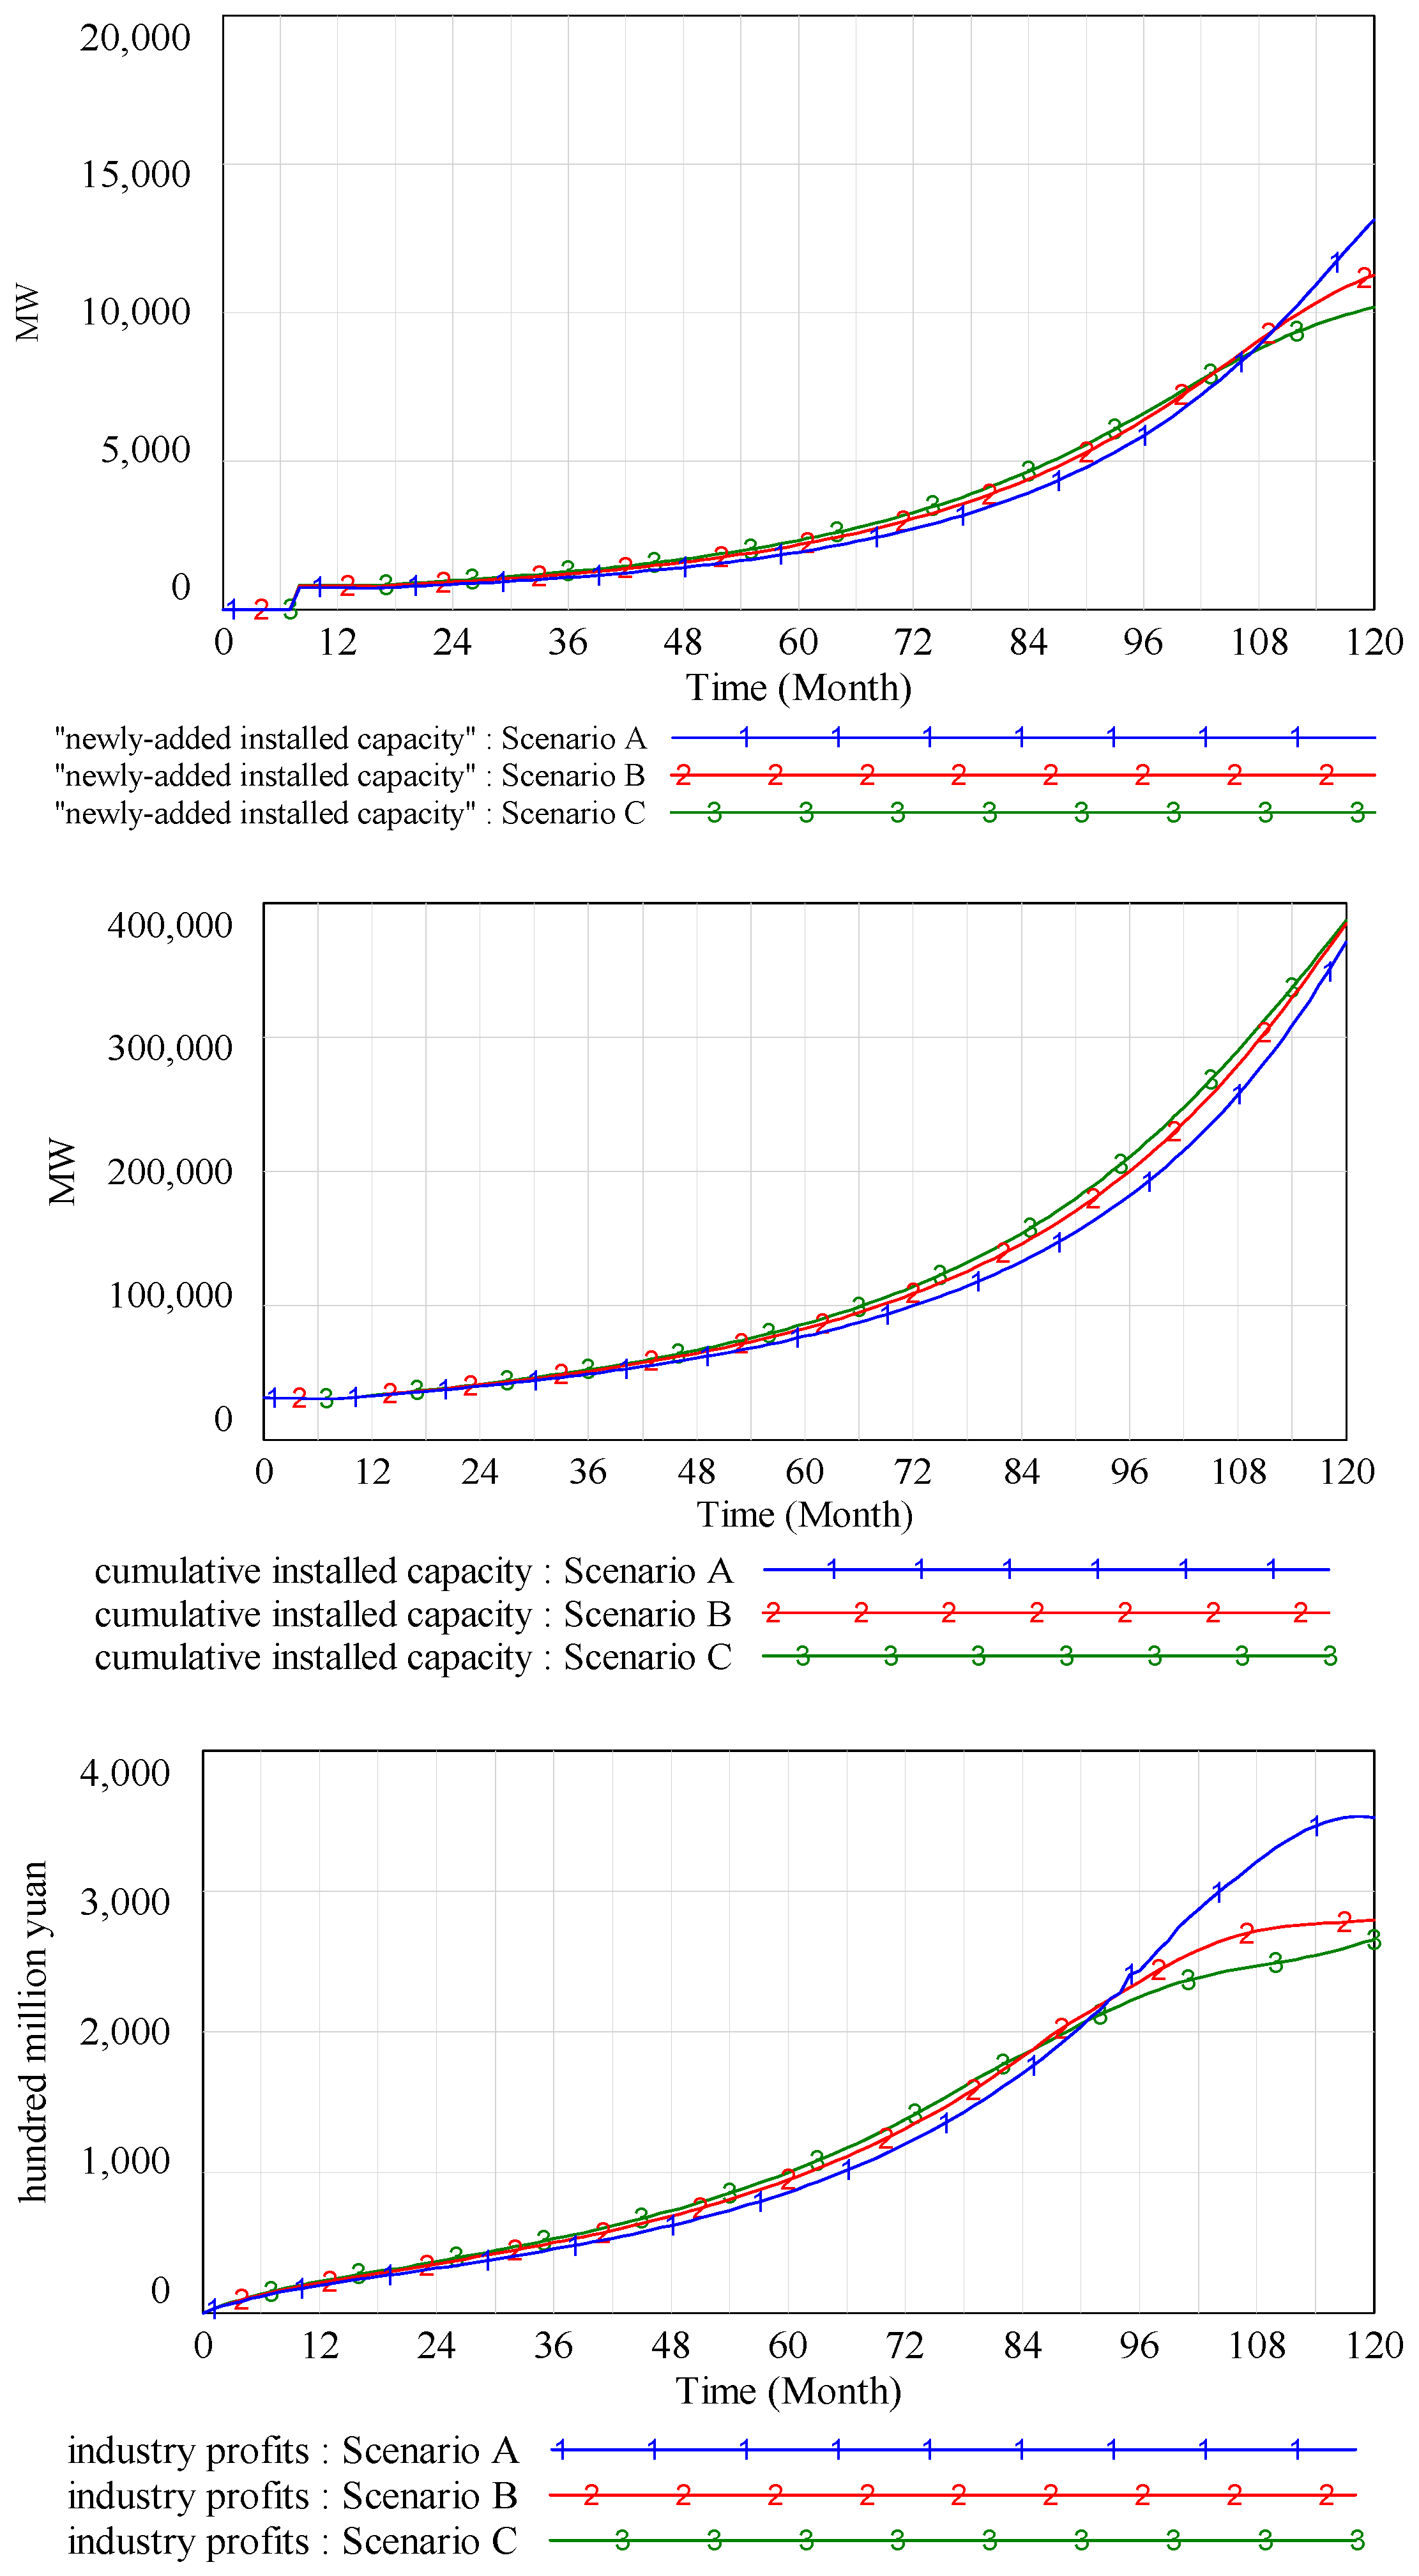
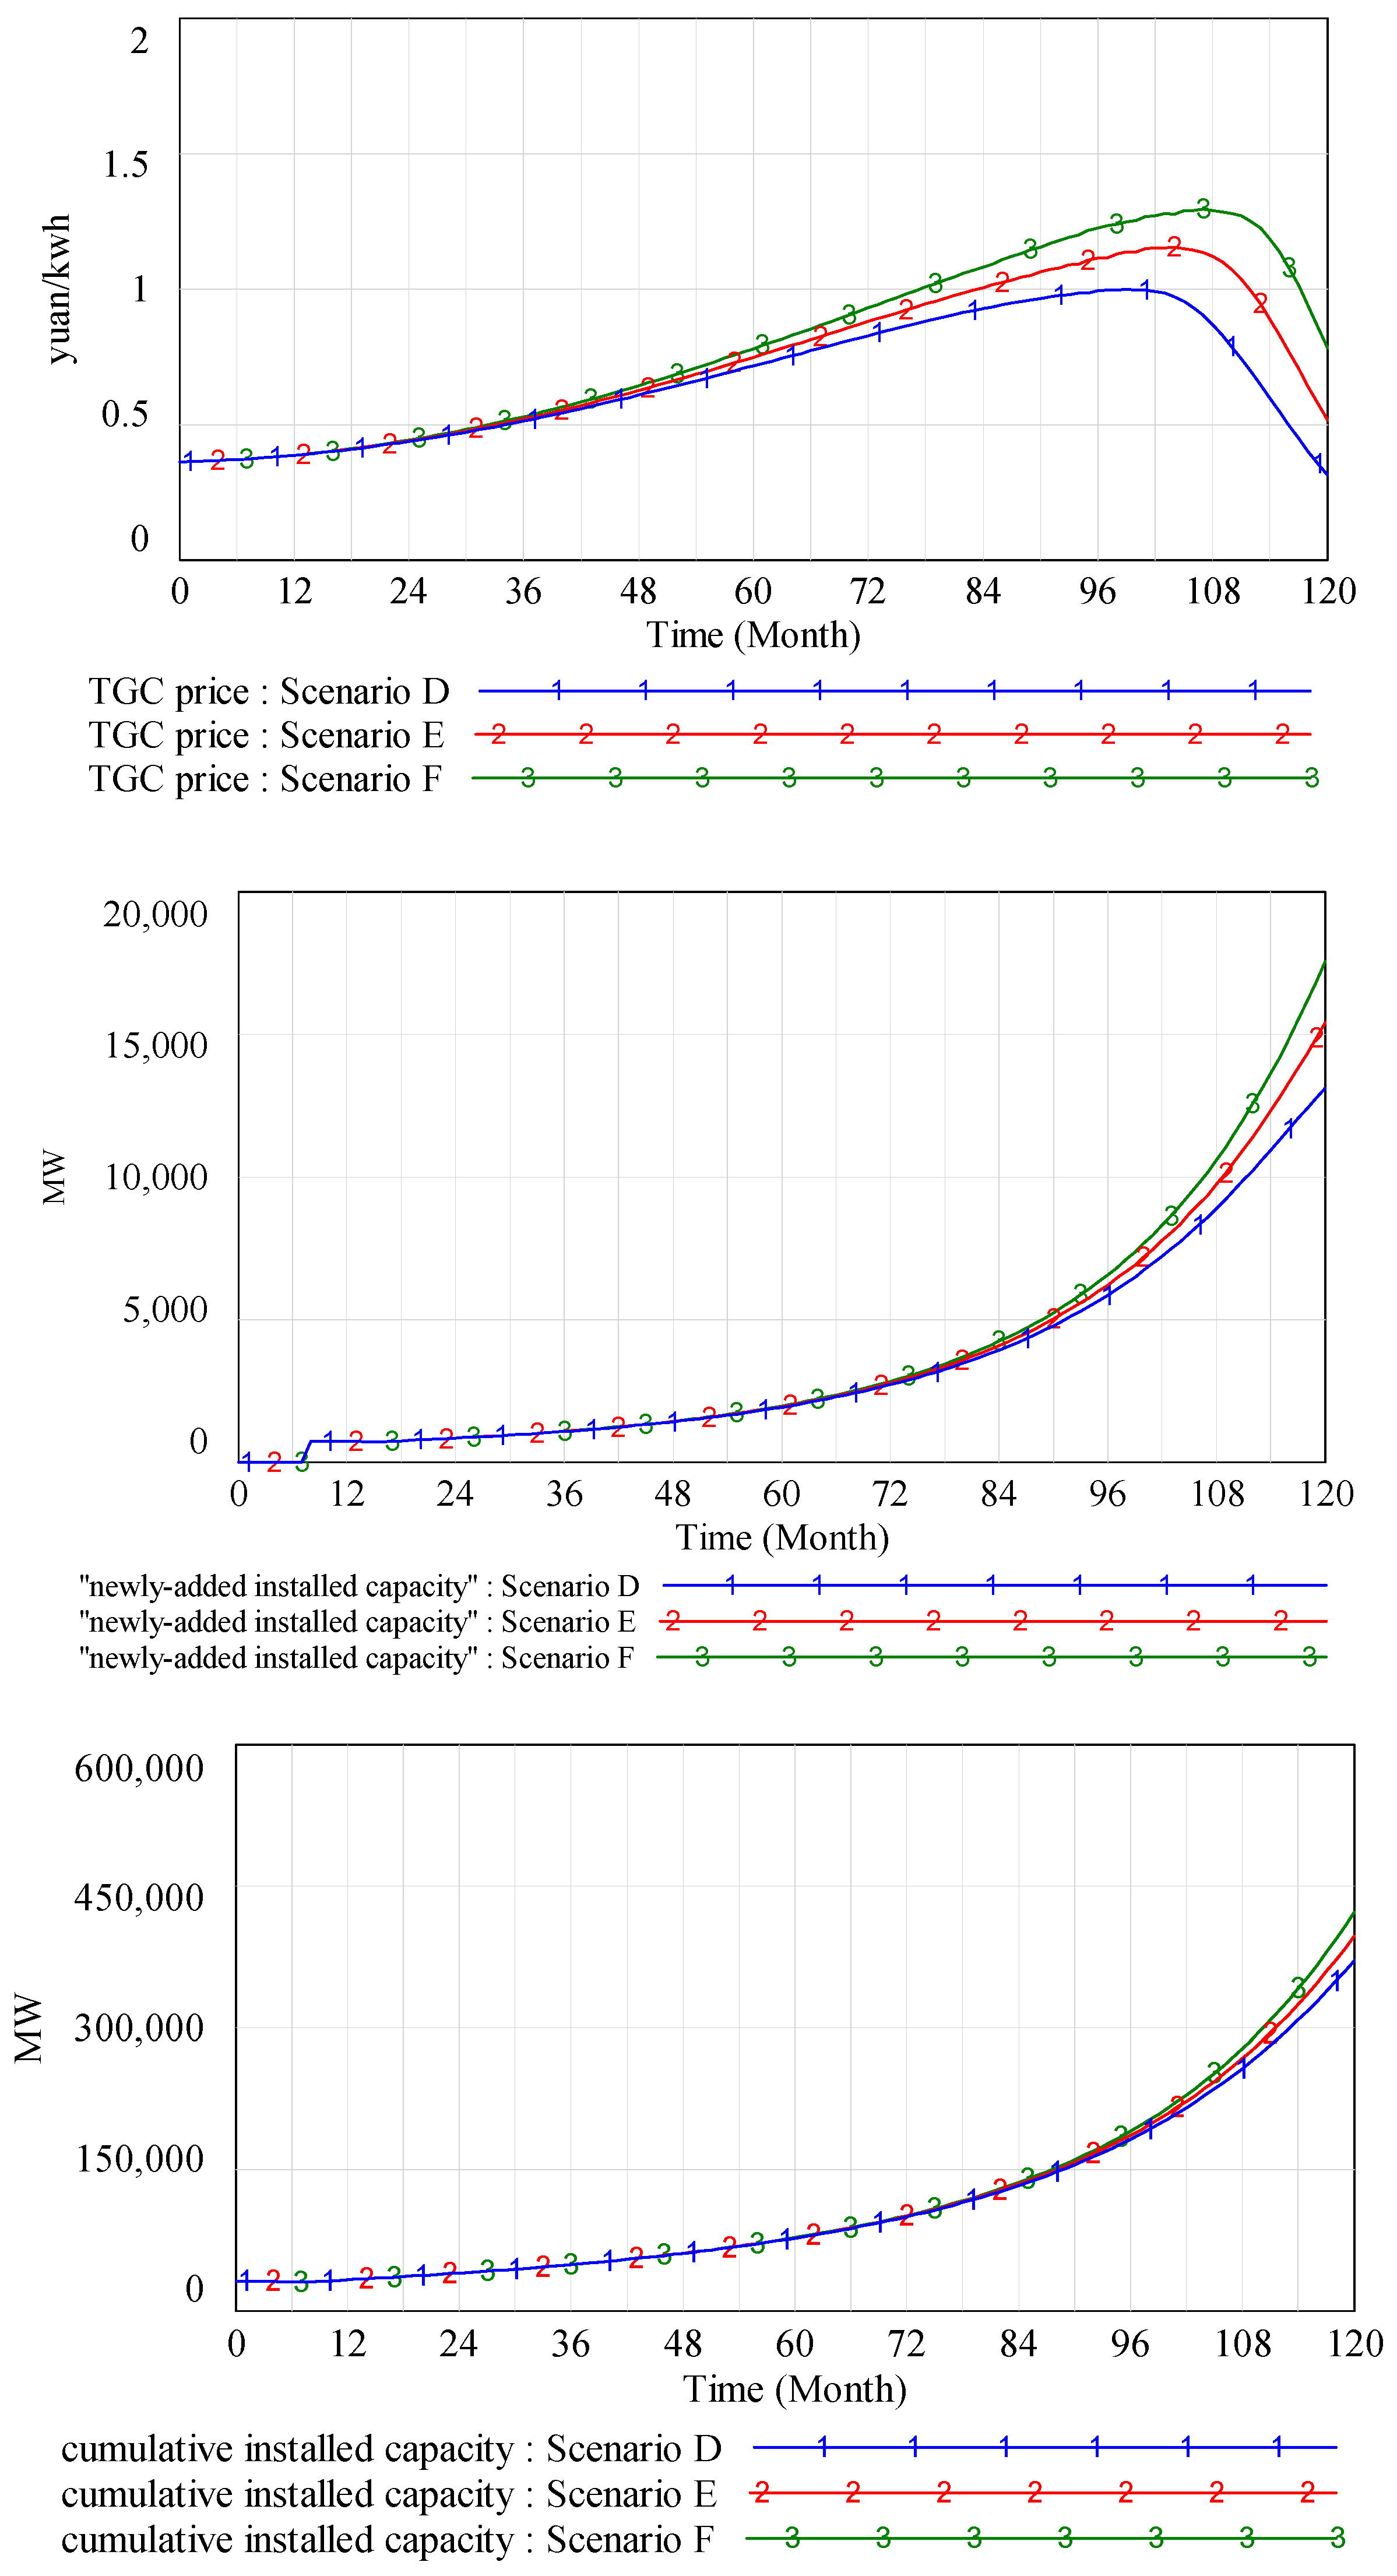
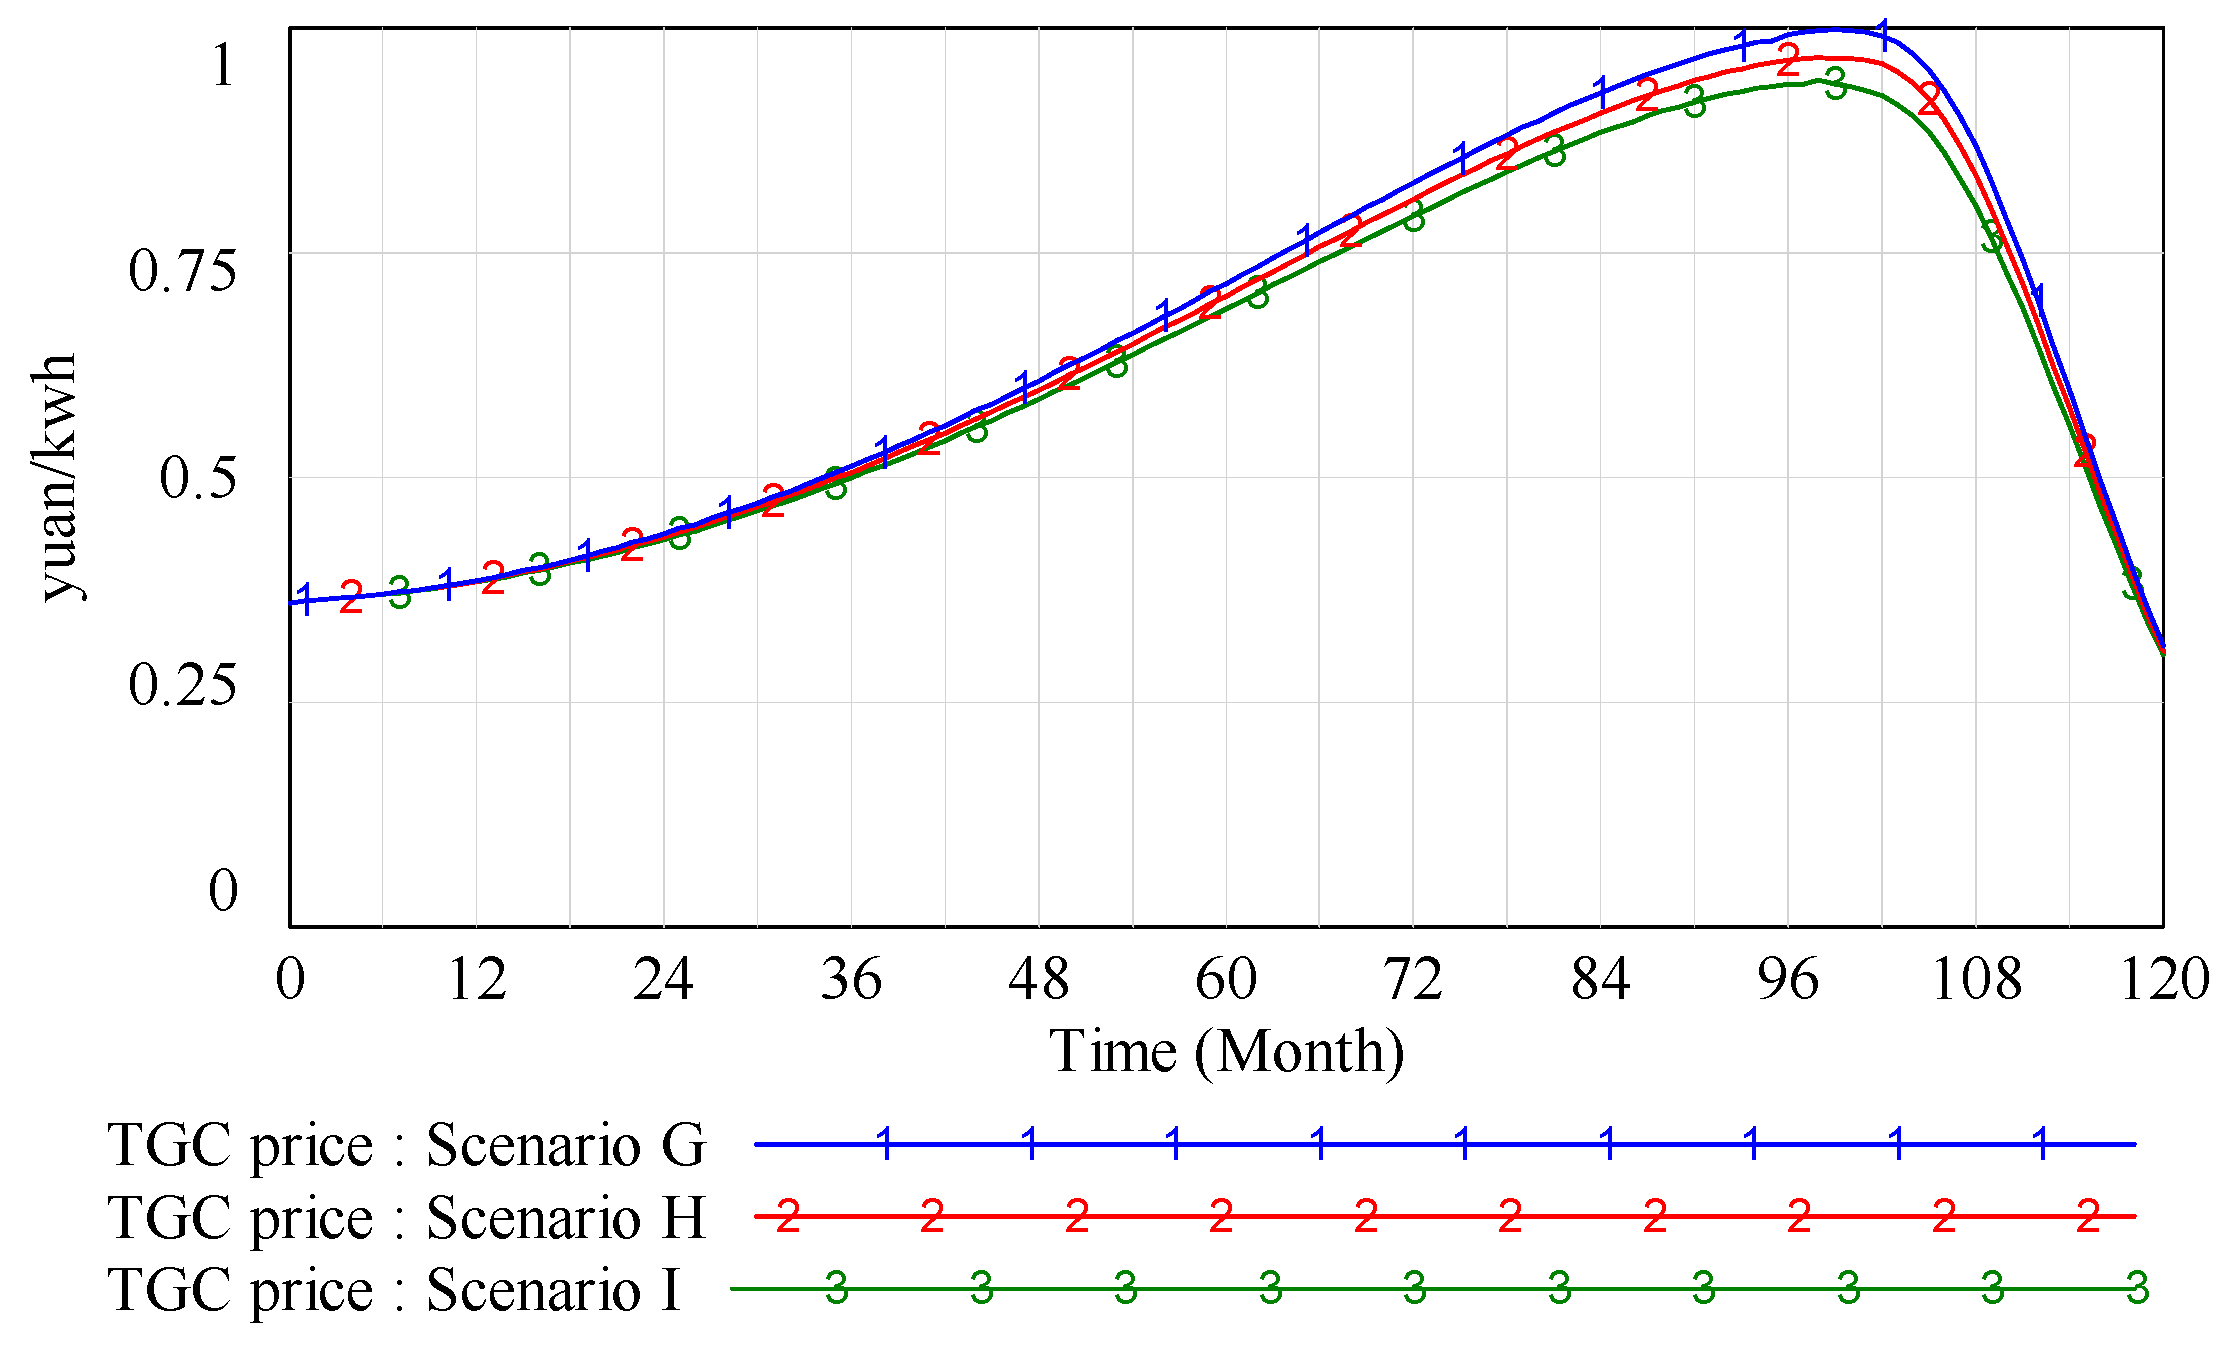
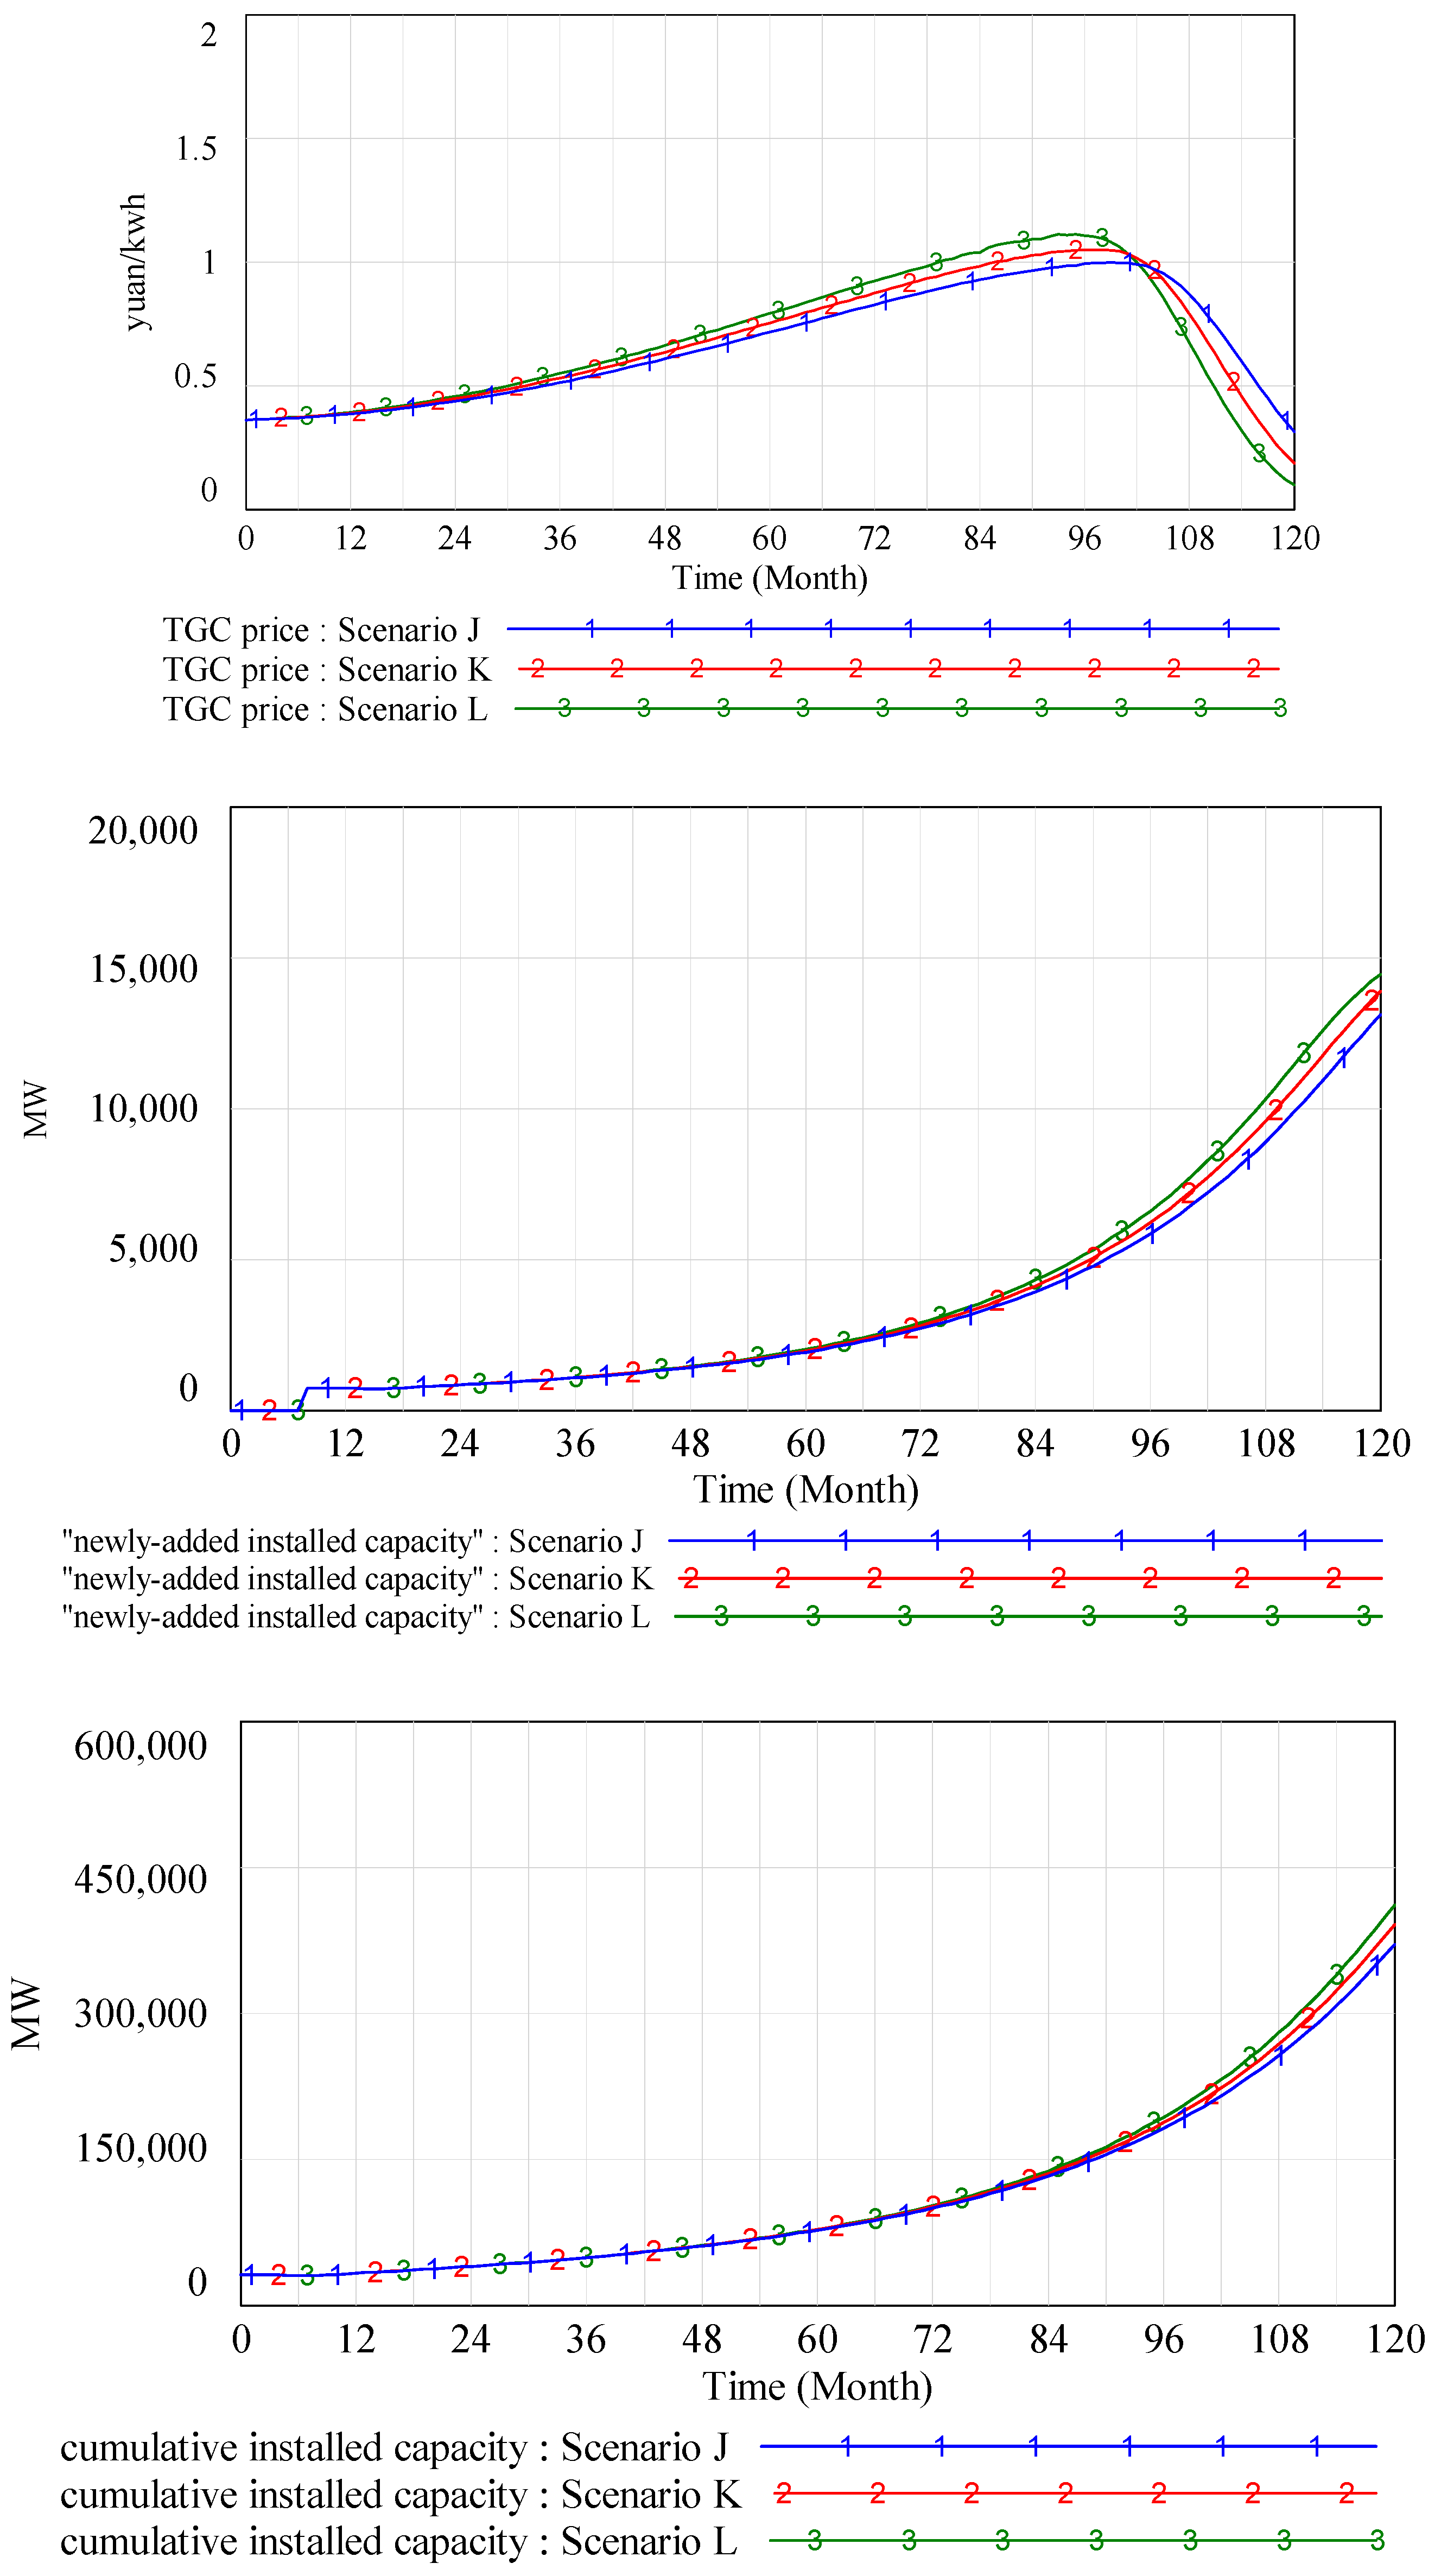
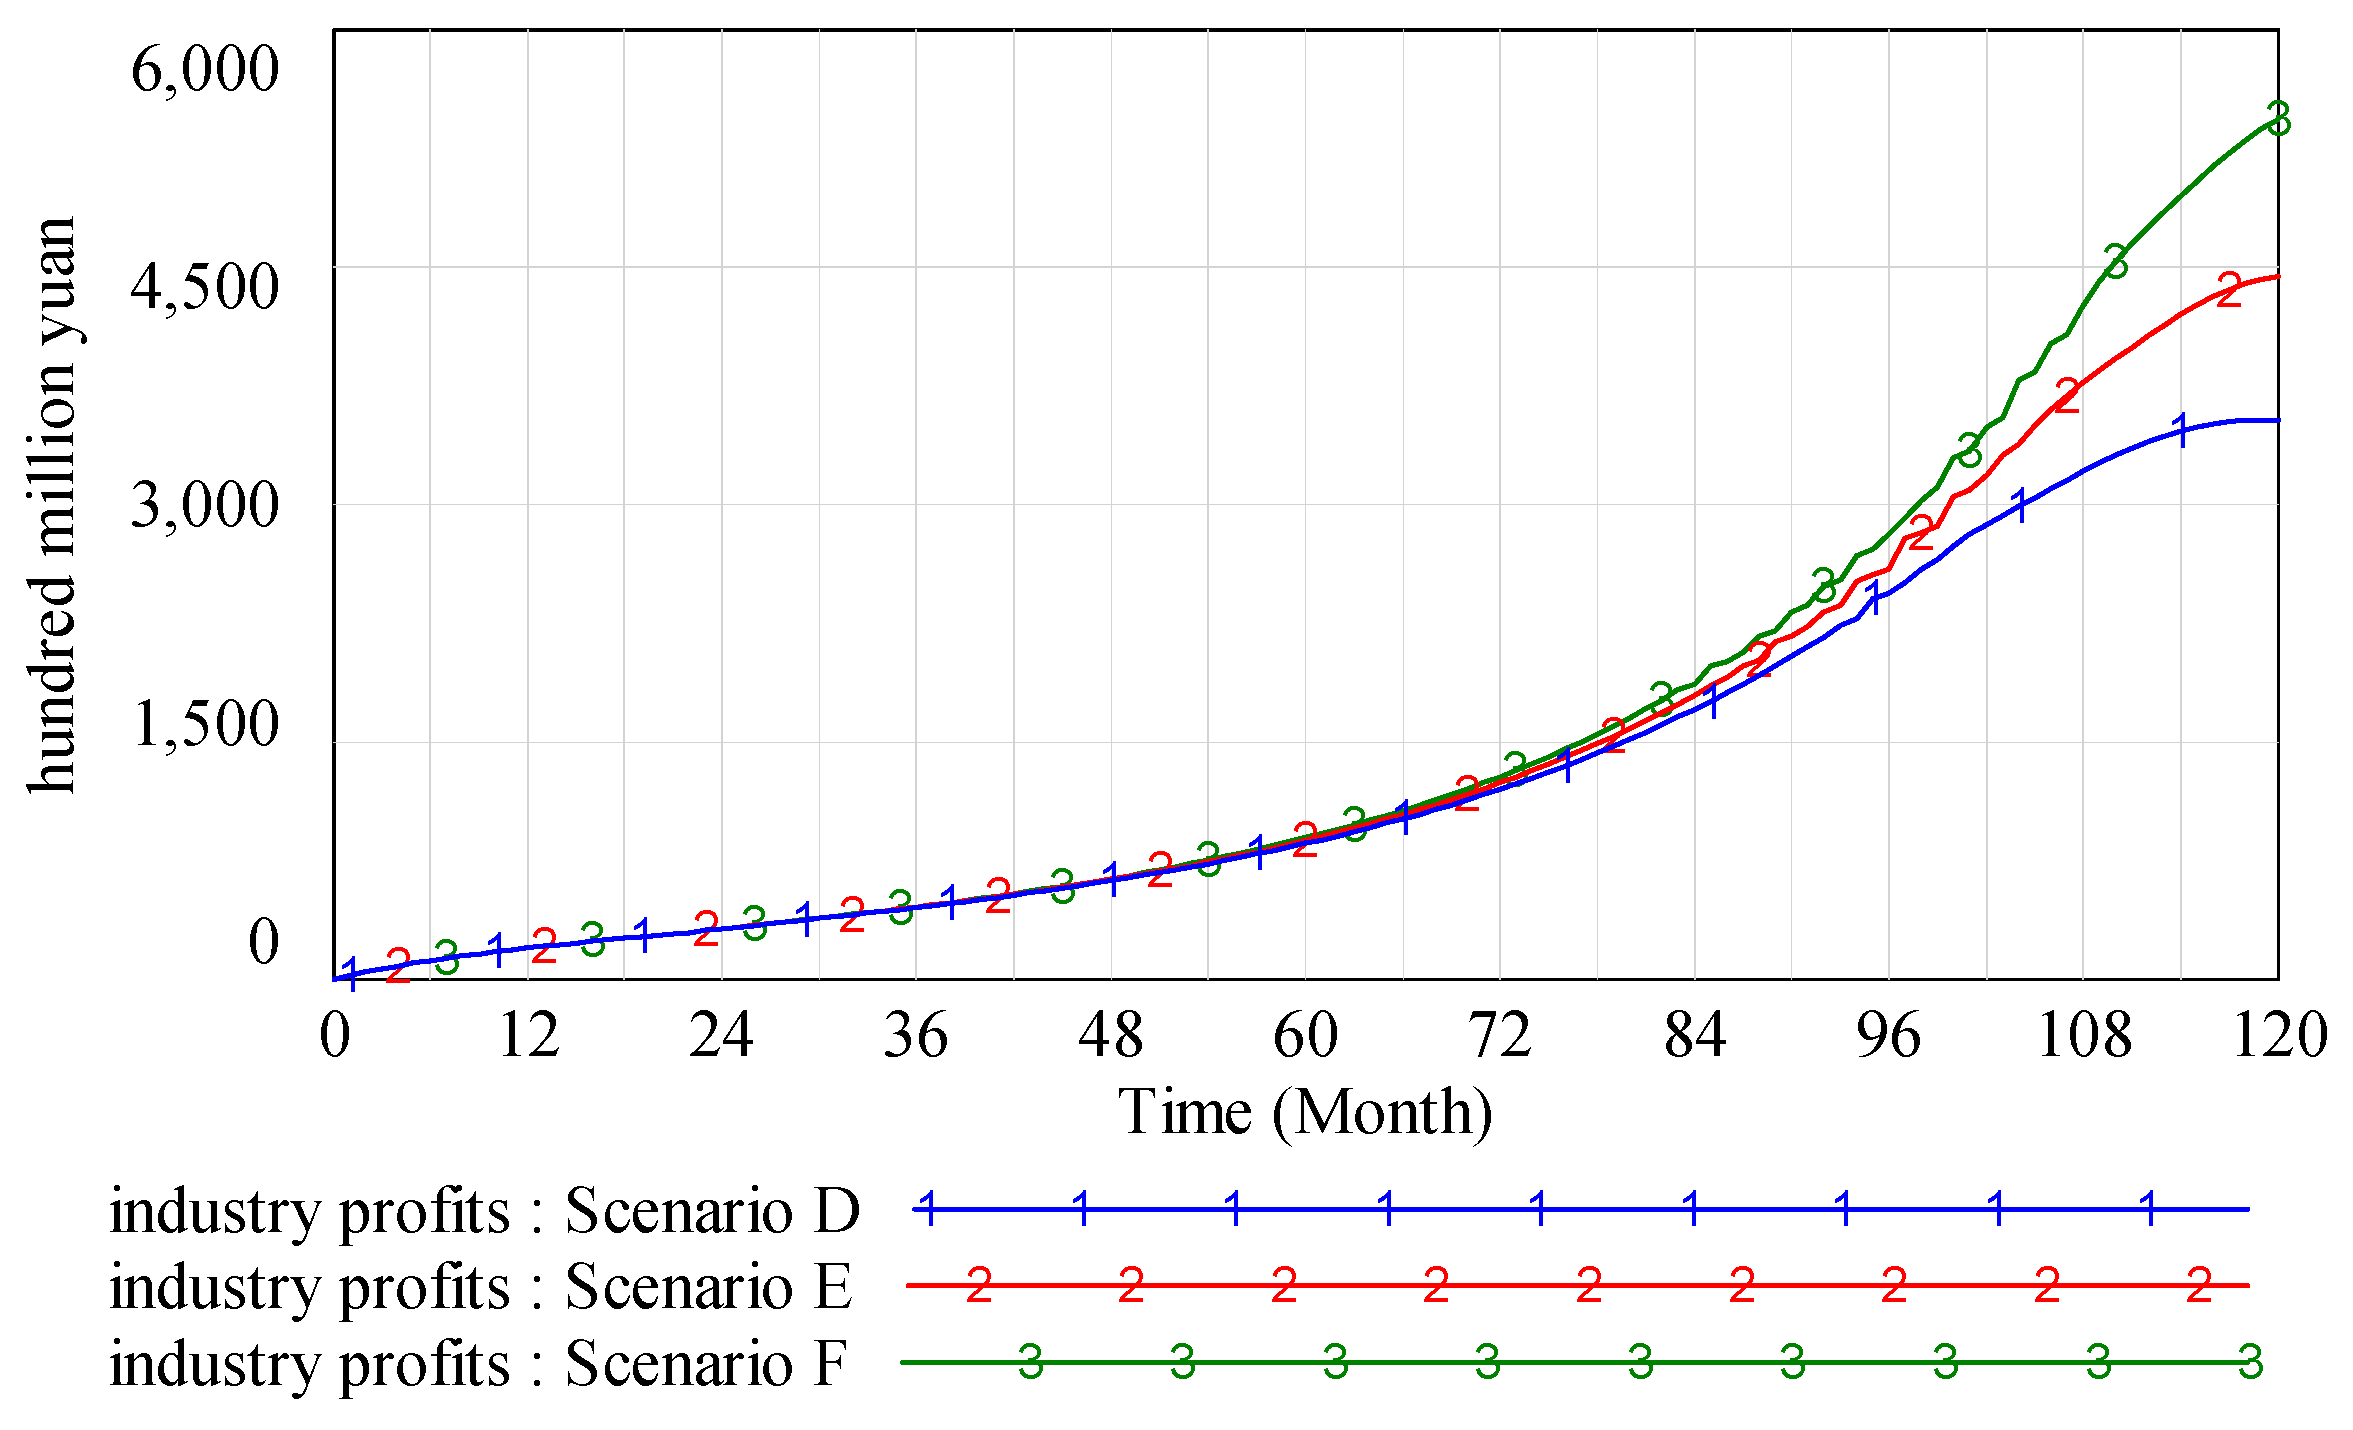
3.2. Simulation Results
- Scenario A: FIT is 0.89 Yuan/kWh.
- Scenario B: FIT is 0.96 Yuan/kWh.
- Scenario C: FIT is 1 Yuan/kWh.
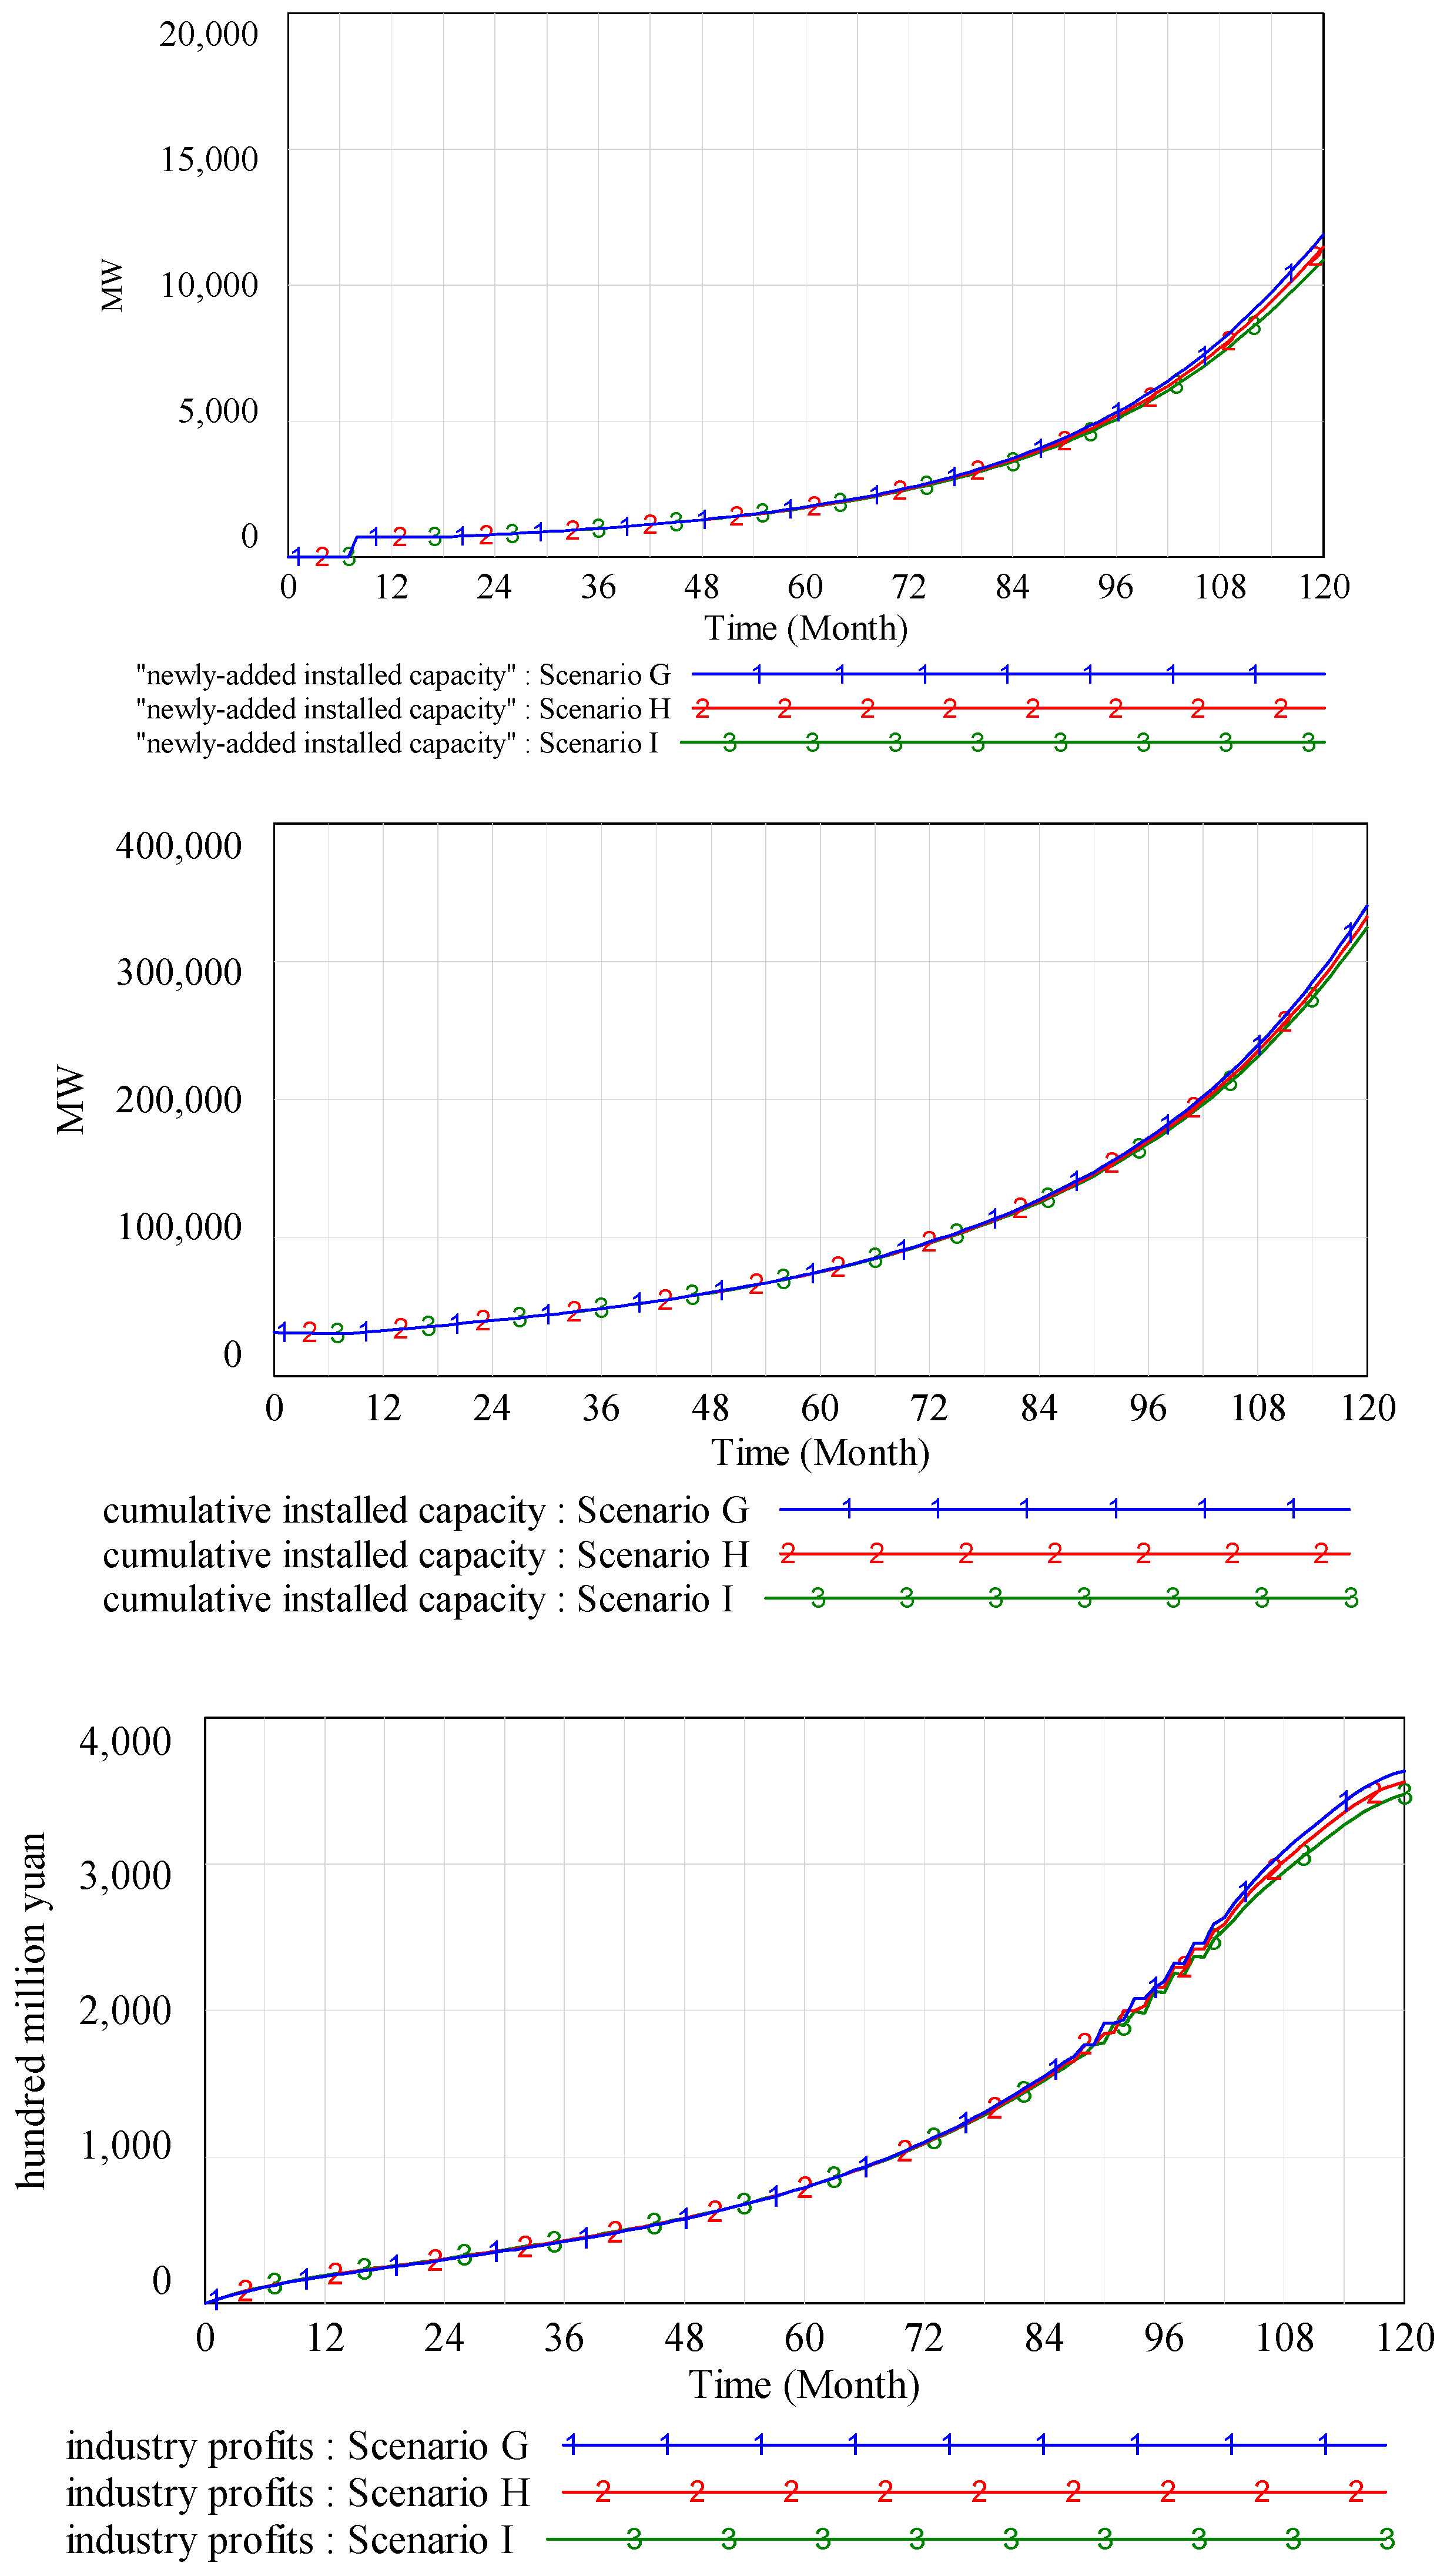
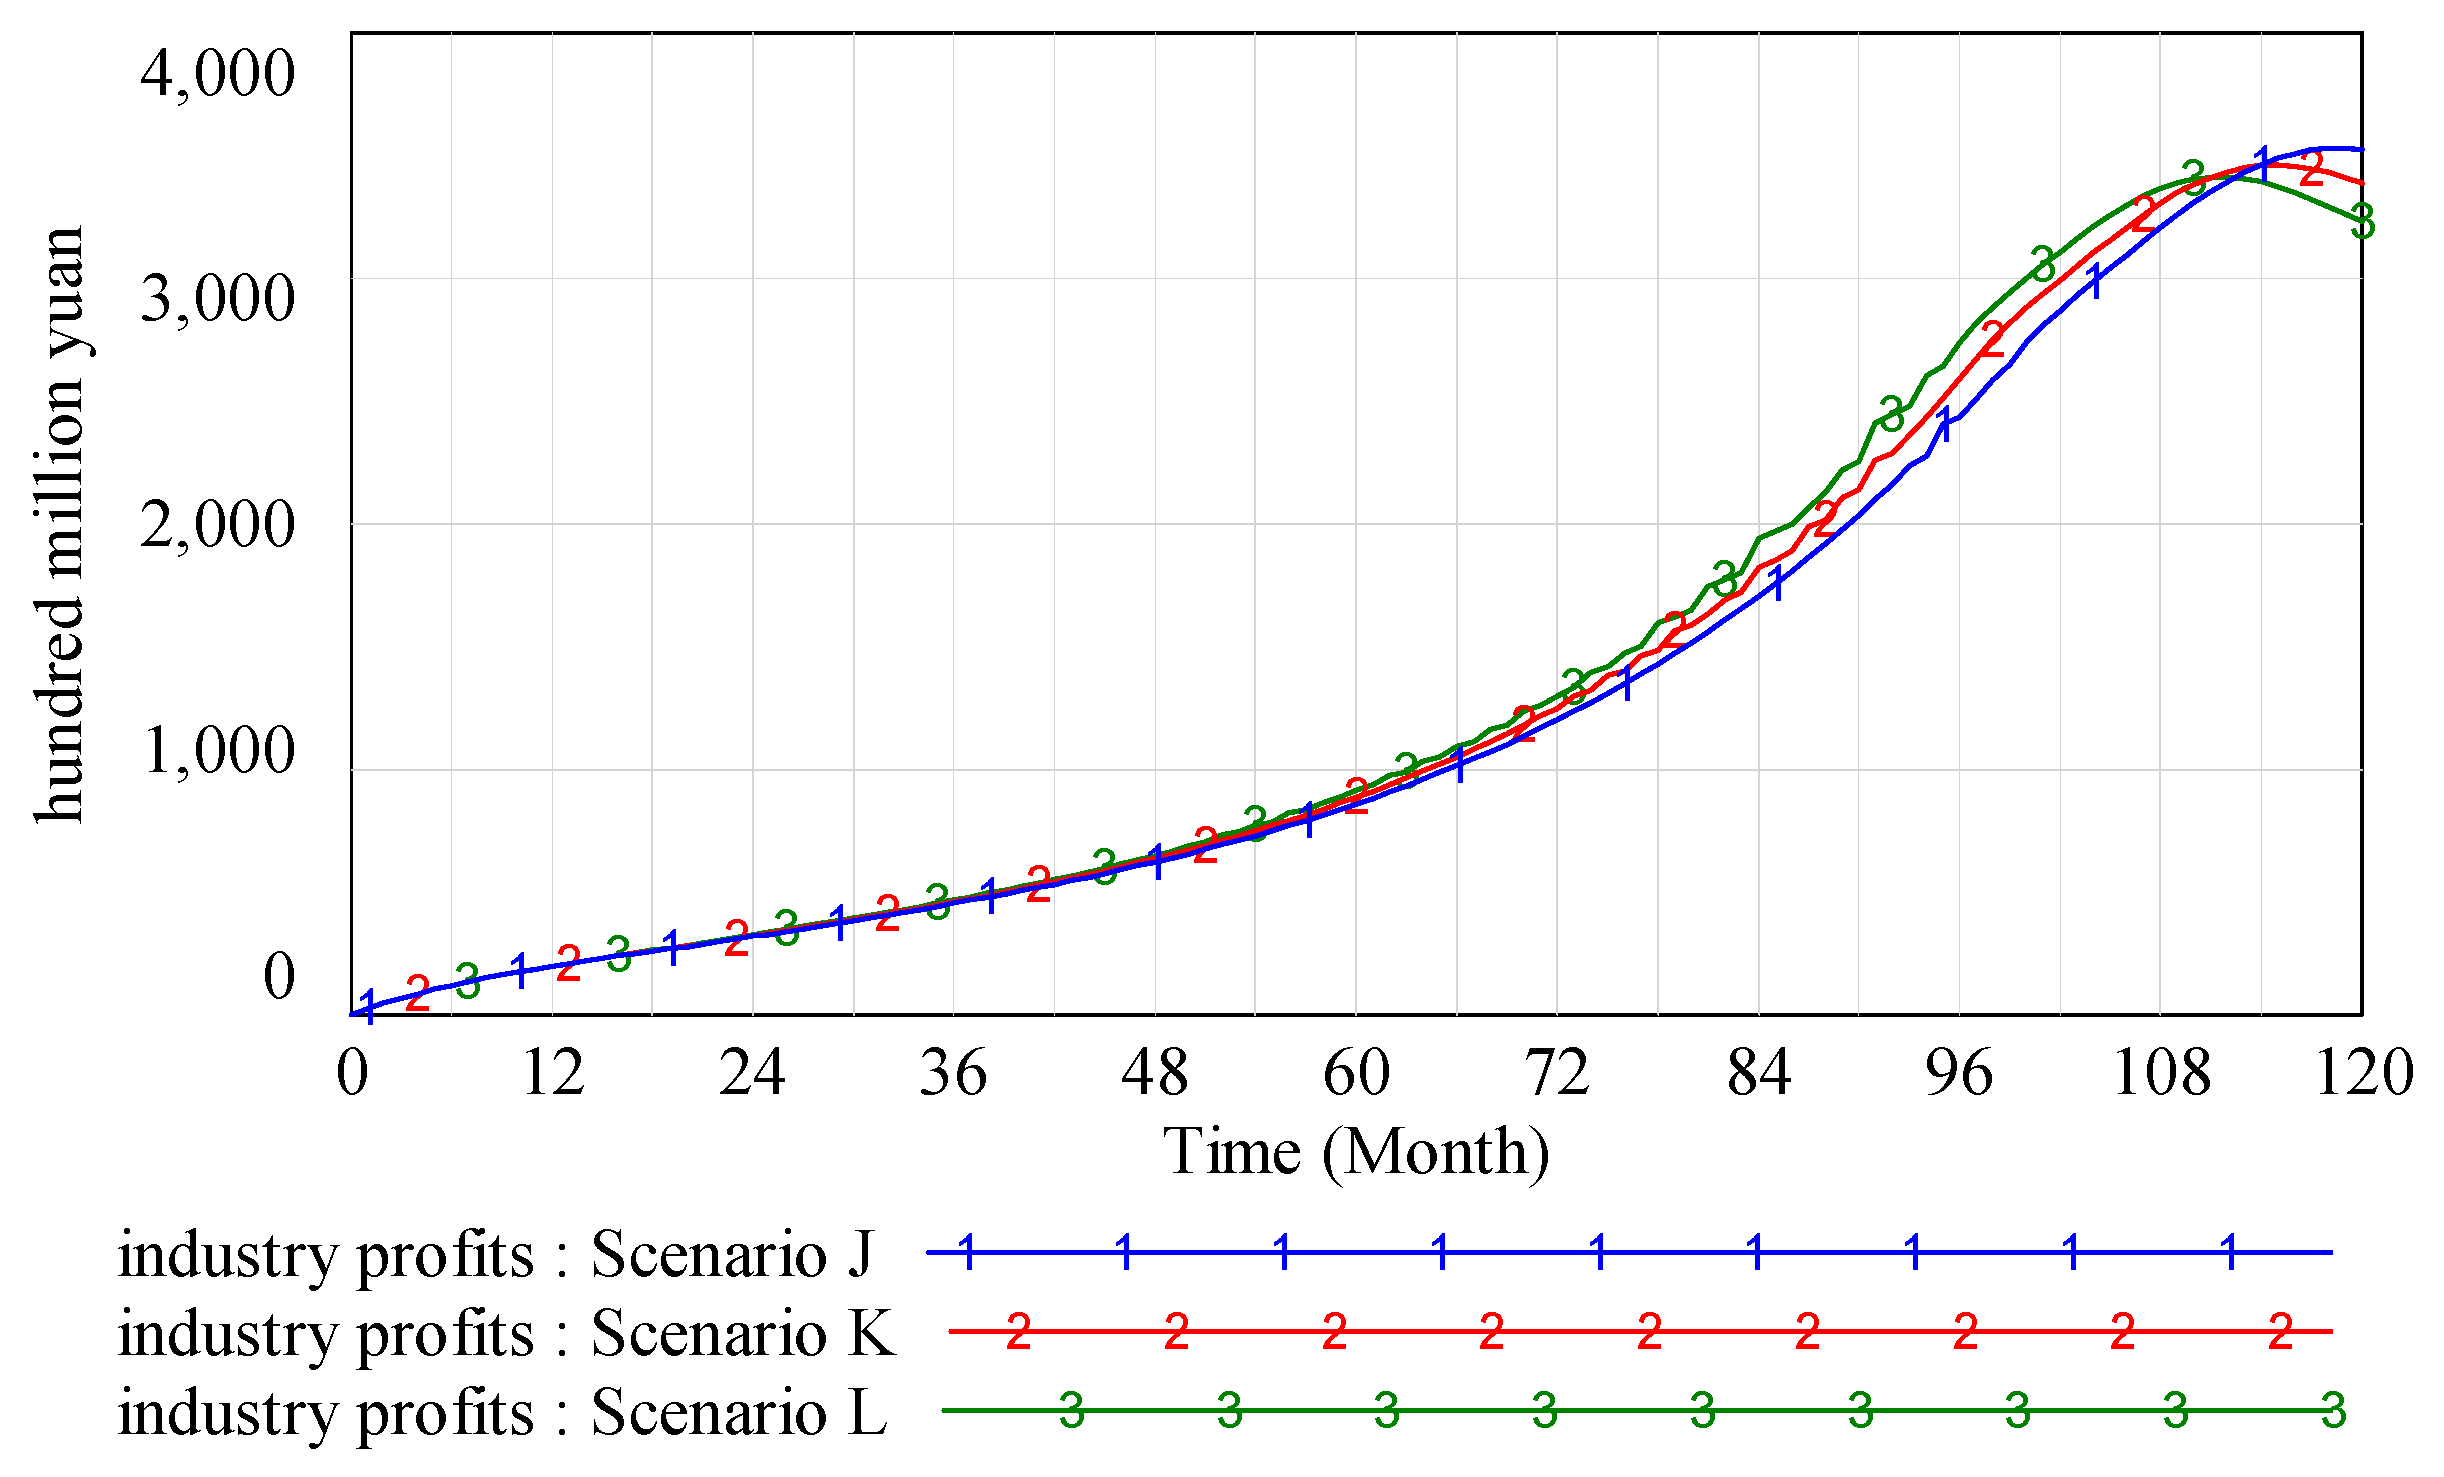
3.3. Sensitivity Analysis
3.3.1. RPS Quota Growth Rate
3.3.2. TGC Valid Period
3.3.3. Fine Level
4. Discussion
4.1. Technological Progress
4.2. Energy Abandonment
4.3. Imperfect Competition Market
5. Conclusion and Policy Implications
Acknowledgments
Author Contributions
Conflicts of Interest
Appendix A

| Parameters | Description |
|---|---|
| the impact of subsidy price on investment | |
| the long run marginal cost of renewable energy power | |
| the impact of industry’s profits on investment | |
| Industry’s profits | |
| the construction plan under FIT | |
| the cumulative installed capacity | |
| equipment depreciation | |
| the initial value of the cumulative installed capacity when time equals zero | |
| the impact of TGC price on investment | |
| TGC annual price | |
| the construction plan under RPS | |
| the impact of TGC price on investment after adjustment | |
| the expected TGC sales amount | |
| fine | |
| the maximum value of probable TGC price | |
| TGC price | |
| the initial value of TGC price when time equals zero | |
| TGC held by renewable energy power plants | |
| the expected amount of TGC purchases | |
| TGC held by demanders | |
| TGC turned in for RPS | |
| TGC price fluctuation | |
| TGC oversupply | |
| adjustment time of TGC price fluctuation | |
| , , , , , and | economic parameters |
References
- Zhang, M.M.; Zhou, D.Q.; Zhou, P.; Liu, G.Q. Optimal feed-in tariff for solar photovoltaic power generation in China: A real options analysis. Energy Policy 2016, 97, 181–192. [Google Scholar] [CrossRef]
- Kang, C.A.; Brandt, A.R.; Durlofsky, L.J. Optimal operation of an integrated energy system including fossil fuel power generation, CO2 capture and wind. Energy 2011, 36, 6806–6820. [Google Scholar] [CrossRef]
- Safdarnejad, S.M.; Hedengren, J.D.; Baxter, L.L. Plant-level dynamic optimization of cryogenic carbon capture with conventional and renewable power sources. Appl. Energy 2015, 149, 354–366. [Google Scholar] [CrossRef]
- Safdarnejad, S.M.; Hedengren, J.D.; Baxter, L.L. Dynamic optimization of a hybrid system of energy-storing cryogenic carbon capture and a baseline power generation unit. Appl. Energy 2016, 172, 66–79. [Google Scholar] [CrossRef]
- Lund, P.D. Effects of energy policies on industry expansion in renewable energy. Renew. Energy 2009, 34, 53–64. [Google Scholar] [CrossRef]
- Sun, P.; Nie, P.Y. A comparative study of feed-in tariff and renewable portfolio standard policy in renewable energy industry. Renew. Energy 2015, 74, 255–262. [Google Scholar] [CrossRef]
- Intelligent Energy Europe. Renewable Energy Policy Country Profiles. Available online: http://www.reshaping-res-policy.eu/downloads/RE-SHAPING_Renewable-Energy-Policy-Country-profiles-2011_FINAL_1.pdf (accessed on 1 March 2011).
- Wesseh, P.K.; Lin, B. A real options valuation of Chinese wind energy technologies for power generation: Do benefits from the feed-in tariffs outweigh costs? J. Clean. Prod. 2015, 112, 1591–1599. [Google Scholar] [CrossRef]
- Intelligent Energy Europe. RE-Shaping: Shaping an Effective and Efficient European Renewable Energy Market. Available online: http://www.reshaping-res-policy.eu/downloads/Final%20report%20RE-Shaping_Druck_D23.pdf (accessed on 1 February 2012).
- Dong, C.G. Feed-in tariff vs. renewable portfolio standard: An empirical test of their relative effectiveness in promoting wind capacity development. Energy Policy 2012, 42, 476–485. [Google Scholar] [CrossRef]
- National Development and Reform Commission. Notice on Improving the Feed-In Tariff of Photovoltaic Power Generation. Available online: http://www.sdpc.gov.cn/zcfb/zcfbtz/201108/t20110801_426501.html (accessed on 24 July 2011). (In Chinese)
- National Development and Reform Commission. Notice on Trial Implementation of Renewable Energy Tradable Green Certificate Issuance and Voluntary Subscription Trading System. Available online: http://www.ndrc.gov.cn/gzdt/201702/t20170203_837121.html (accessed on 18 January 2017). (In Chinese)
- Ziaii, S.; Cohen, S.; Rochelle, G.T.; Edgar, T.F.; Webber, M.E. Dynamic operation of amine scrubbing in response to electricity demand and pricing. Energy Procedia 2009, 1, 4047–4053. [Google Scholar] [CrossRef]
- Ritzenhofen, I.; Birge, J.R.; Spinler, S. The structural impact of renewable portfolio standards and feed-in tariffs on electricity markets. Eur. J. Oper. Res. 2016, 255, 224–242. [Google Scholar] [CrossRef]
- Bianco, V.; Manca, O.; Nardini, S. Electricity consumption forecasting in Italy using linear regression models. Energy 2009, 34, 1413–1421. [Google Scholar] [CrossRef]
- Farooq, M.K.; Kumar, S.; Shrestha, R.M. Energy, environmental and economic effects of renewable portfolio standards (RPS) in a developing country. Energy Policy 2013, 62, 989–1001. [Google Scholar] [CrossRef]
- Qudrat-Ullah, H. Green power in Ontario: A dynamic model-based analysis. Energy 2014, 77, 859–870. [Google Scholar] [CrossRef]
- Ford, A.; Vogstad, K.; Flynn, H. Simulating price patterns for tradable green certificates to promote electricity generation from wind. Energy Policy 2007, 35, 91–111. [Google Scholar] [CrossRef]
- Naill, R.A. System dynamics model for natural energy policy planning. Syst. Dyn. Rev. 1992, 8, 1–19. [Google Scholar] [CrossRef]
- Ford, A. System dynamics and the electric power industry. Syst. Dyn. Rev. 1997, 13, 57–85. [Google Scholar] [CrossRef]
- Ochoa, P. Policy changes in the Swiss electricity market: A system dynamics analysis of likely market responses. Socio-Econ. Plan. Sci. 2007, 41, 336–349. [Google Scholar] [CrossRef]
- Ponzo, R.; Dyner, I.; Arango, S.; Larsen, E.R. Regulation and development of the Argentinean gas market. Energy Policy 2011, 39, 1070–1079. [Google Scholar] [CrossRef]
- Olaya, Y.; Dyner, I. Modelling for policy assessment in the natural gas industry. J. Oper. Res. Soc. 2005, 56, 1122–1131. [Google Scholar] [CrossRef]
- Kamarzaman, N.A.; Tan, C.W. A comprehensive review of maximum power point tracking algorithms for photovoltaic systems. Renew. Sustain. Energy Rev. 2014, 37, 585–598. [Google Scholar] [CrossRef]
- Ming, Z.; Zhang, K.; Dong, J. Overall review of China’s wind power industry: Status quo, existing problems and perspective for future development. Renew. Sustain. Energy Rev. 2013, 24, 379–386. [Google Scholar] [CrossRef]
- Guo, X.; Guo, X. China’s photovoltaic power development under policy incentives: A system dynamics analysis. Energy 2015, 93, 589–598. [Google Scholar] [CrossRef]
- Ming, Z.; Chen, L.I.; Chao, L.; Li, S.; Shao, O. Wind power investment decision-making model and policy analysis considering the electricity price subsidies of wind power. Power Syst. Prot. Control 2012, 23, 17–23. (In Chinese) [Google Scholar]
- Li, Q.; Chen, M. Real option theoretical and empirical analysis on feed-in tariff policy of wind electricity in China. Chin. J. Manag. Sci. 2016, 24, 65–73. (In Chinese) [Google Scholar]
- Currier, K.M. A regulatory adjustment process for the determination of the optimal percentage requirement in an electricity market with tradable green certificates. Energy Policy 2013, 62, 1053–1057. [Google Scholar] [CrossRef]
- Zhao, E.; Liu, P. Policy effects of feed-in tariff and tradable green certificate-based on the development of biomass power industry in China. J. Ind. Technol. Econ. 2013, 9, 125–137. (In Chinese) [Google Scholar]
- Moxnes, E. Interfuel substitution in OECO-European electricity production. Syst. Dyn. Rev. 1990, 6, 44–65. [Google Scholar] [CrossRef]
- Shun-Kun, Y.U.; Zhou, L.S.; Chen, L.I. System dynamic model design for green certificate trading based on renewable portfolio standard. East China Electr. Power 2013, 41, 281–285. (In Chinese) [Google Scholar]
- Dyner, I.; Bun, D. A System Simulation Platform to Support Energy Policy in Columbia. Available online: https://www.london.edu/faculty-and-research/academic-research/s/systems-simulation-platform-to-support-energy-policy-in-colombia#.WN20lmex-Uk (accessed on 28 March 2017).
- Tan, Z.; Liu, W.; Liu, P. Policy Effect of Tradable Green Certificate and Carbon Emission Trading on China’s Electric Power Market. Technol. Econ. 2014, 33, 74–84. (In Chinese) [Google Scholar]
- Zhao, X.; Feng, T.; Yang, Y. Impacting Mechanism of Renewable Portfolio Standard on China’s power source structure and its effect. Power Syst. Technol. 2014, 38, 974–979. (In Chinese) [Google Scholar]
- Forrester, J.W. Industrial Dynamics; MIT Press: Cambridge, MA, USA, 1961. [Google Scholar]
- Sterman, J. Business Dynamics: Systems Thinking and Modeling for a Complex World; McGraw Hill Irwin: Boston, MA, USA, 2000. [Google Scholar]
- Qudrat-Ullah, H. On the validation of system dynamics type simulation models. Telecommun. Syst. 2012, 51, 159–166. [Google Scholar] [CrossRef]
- Qudrat-Ullah, H.; BaekSeo, S. How to do structural validity of a system dynamics type simulation model: The case of an energy policy model. Energy Policy 2010, 38, 2216–2224. [Google Scholar] [CrossRef]
- Barlas, Y. Multiple Tests for validation of system dynamics type of simulation models. Eur. J. Oper. Res. 1989, 42, 59–87. [Google Scholar] [CrossRef]
- China Photovoltaic Industry Association. China Photovoltaic Power Development Roadmap. Available online: http://www.miit.gov.cn/n1146290/n4388791/c5494592/part/5494596.pdf (accessed on 28 December 2016). (In Chinese)
- China Electricity Council. China’s Electricity Demand Will Remain Medium-Speed Growth. Available online: http://www.chinaccm.com/22/20150702/221301_2740791.shtml (accessed on 2 July 2015). (In Chinese).
- National Development and Reform Commission. Notice on Improving the Feed-In Tariff of Onshore Wind Power and Photovoltaic Power Generation. Available online: http://www.sdpc.gov.cn/zcfb/zcfbtz/201512/t20151224_768573.html (accessed on 22 December 2015). (In Chinese)
- National Energy Administration. Solar Energy Development in 13th Five-Year Plan. Available online: http://guangfu.bjx.com.cn/news/20161216/797481.shtml (accessed on 16 December 2016). (In Chinese).
- China Intelligent Manufacturing Net. The Installed Capacity of China’s Photovoltaic Power Will Reach 50 GW. Available online: http://www.gkzhan.com/News/Detail/30970.html (accessed on 23 January 2013). (In Chinese).
- Zhao, X.; Zeng, Y.; Zhao, D. Distributed solar photovoltaics in China: Policies and economic performance. Energy 2015, 88, 572–583. [Google Scholar] [CrossRef]
- Yuan, J.; Sun, S.; Zhang, W.; Xiong, M. The economy of distributed PV in China. Energy 2014, 78, 939–949. [Google Scholar] [CrossRef]
- National Development and Reform Commission. Notice on Adjusting the Feed-In Tariff of Onshore Wind Power and Photovoltaic Power Generation. Available online: http://www.sdpc.gov.cn/gzdt/201612/t20161228_833065.html (accessed on 26 December 2016). (In Chinese)
- Bird, L.; Lew, D.; Milligan, M.; Carlini, E.M.; Estanqueiro, A.; Flynn, D.; Gomez, E.; Holttinen, H.; Menemenlis, N.; Orths, A.; et al. Wind and solar energy curtailment: A review of international experience. Renew. Sustain. Energy Rev. 2016, 65, 577–586. [Google Scholar] [CrossRef]
- Li, C.; Shi, H.; Cao, Y.; Wang, J.; Kuang, Y.; Tan, Y.; Wei, J. Comprehensive review of renewable energy curtailment and avoidance: A specific example in China. Renew. Sustain. Energy Rev. 2015, 41, 1067–1079. [Google Scholar] [CrossRef]
- Zeng, M.; Yang, Y.; Wang, L.; Sun, J. The Power Industry Reform in China 2015: Policies, Evaluations and Solutions. Renew. Sustain. Energy Rev. 2016, 57, 94–110. [Google Scholar] [CrossRef]
- NDRC. Opinions on Further Deepening the Electric Power System Reform. Available online: http://www.chinasmartgrid.com.cn/news/20150323/600488.shtml (accessed on 15 March 2015). (In Chinese).
- NDRC. Notice on the Issuance of Supporting Documents for the Electric Power System Reform. Available online: http://www.sdpc.gov.cn/zcfb/zcfbtz/201511/t20151130_760016.html (accessed on 26 November 2015). (In Chinese)
- Tamás, M.M.; Shrestha, S.O.B.; Zhou, H. Feed-in Tariff and Tradable Green Certificate in Oligopoly. Energy Policy 2010, 38, 4040–4047. [Google Scholar] [CrossRef]
- Li-Bo, W.U.; Sun, K.G.; Chen, Y.L. A comparison of renewable energy policies in imperfect competition electricity market. China Popul. Resour. Environ. 2015, 10, 53–60. (In Chinese) [Google Scholar]


| Structures/Concepts | Remarks |
|---|---|
| Investment incentive dynamics [33] | Causal structure was adopted |
| RPS implementation process [18] | Causal structure was adopted |
| Installed capacity structure [31] | Structural formulation was adopted |
| Industry profits module [30] | Structural formulation was adopted |
| Key Parameters | Initial Value | Unit | Data Resource |
|---|---|---|---|
| RPS quota proportion | 1% | - | survey of the data from China Electricity Council |
| RPS quota growth rate | 1.5% | - | National Energy Administration |
| Electricity demand growth rate | 0.25% | - | National Energy Administration |
| Tax rate | 7.5% | - | China Statistical Yearbook |
| Lending rate | 6.9% | - | China Statistical Yearbook |
| Self-consumption of photovoltaic power plants | 2% | - | survey of the data from China Electricity Council |
| Long run marginal cost of photovoltaic power | 0.66 | Yuan/kWh | survey of the data from China Electricity Council |
| Long run marginal cost of traditional power | 0.3 | Yuan/kWh | survey of the data from China Electricity Council |
| FIT of photovoltaic power | 0.89 | Yuan/kWh | National Energy Administration |
| Operation maintenance unit cost | 0.053 | Yuan/kWh | survey of the data from China Electricity Council |
| Annual utilization hours | 1200 | hour/annual | survey of the data from China Electricity Council |
| Construction unit cost | 8000 | Yuan/kW | survey of the data from China Electricity Council |
| Electricity demand | 3 × 10¹¹ | kWh | National Energy Administration |
| Cumulative installed capacity | 31043 | MW | National Energy Administration |
| Construction period | 8 | month | survey of the data from China Electricity Council |
| Equipment life cycle | 20 | year | survey of the data from China Electricity Council |
| Key Parameters | Assumed Value | Unit | References |
|---|---|---|---|
| Maximum value of probable TGC price | 1.3 | Yuan/kWh | [35] |
| Fine | 1.4 | Yuan/kWh | [32] |
| Adjustment time of TGC price trend | 3 | month | [32] |
| Adjustment time of TGC price fluctuation | 2 | month | [34] |
| TGC valid period | 12 | month | [32,35] |
© 2017 by the authors. Licensee MDPI, Basel, Switzerland. This article is an open access article distributed under the terms and conditions of the Creative Commons Attribution (CC BY) license (http://creativecommons.org/licenses/by/4.0/).
Share and Cite
Zhang, Y.; Zhao, X.; Zuo, Y.; Ren, L.; Wang, L. The Development of the Renewable Energy Power Industry under Feed-In Tariff and Renewable Portfolio Standard: A Case Study of China’s Photovoltaic Power Industry. Sustainability 2017, 9, 532. https://doi.org/10.3390/su9040532
Zhang Y, Zhao X, Zuo Y, Ren L, Wang L. The Development of the Renewable Energy Power Industry under Feed-In Tariff and Renewable Portfolio Standard: A Case Study of China’s Photovoltaic Power Industry. Sustainability. 2017; 9(4):532. https://doi.org/10.3390/su9040532
Chicago/Turabian StyleZhang, Yuzhuo, Xingang Zhao, Yi Zuo, Lingzhi Ren, and Ling Wang. 2017. "The Development of the Renewable Energy Power Industry under Feed-In Tariff and Renewable Portfolio Standard: A Case Study of China’s Photovoltaic Power Industry" Sustainability 9, no. 4: 532. https://doi.org/10.3390/su9040532