Article

Spatial Open Data for Monitoring Risks and Preserving Archaeological Areas and Landscape: Case Studies at Kom el Shoqafa, Egypt and Shush, Iran

by
Rosa Lasaponara
1,*,
Beniamino Murgante
2,
Abdelaziz Elfadaly
1,3,4,
Mohamad Molaei Qelichi
5,
Saeed Zanganeh Shahraki
5,
Osama Wafa
6 and
Wael Attia
3
1
Italian National Research Council, C.da Santa Loja, Tito Scalo, Potenza 85050, Italy
2
School of Engineering, University of Basilicata, Potenza 85100, Italy
3
National Authority for Remote Sensing and Space Sciences, Cairo 1564, Egypt
4
Department of European and Mediterranean Cultures, University of Basilicata, Matera 75100, Italy
5
Faculty of Geography, University of Tehran, Tehran 14178, Iran
6
Archaeology Department, Faculty of Arts, University of Kafr el Sheikh, Kafr el Sheikh 1501, Egypt
*
Author to whom correspondence should be addressed.
Sustainability 2017, 9(4), 572; https://doi.org/10.3390/su9040572
Submission received: 28 February 2017 / Revised: 3 April 2017 / Accepted: 5 April 2017 / Published: 9 April 2017

Abstract

:
Instrumental to the concept of sustainability must be the search for feasible ways to implement sustainability, especially connecting heritage and tourism. This should be understood in relationship with the persistence in time and the current and future conception of the human-made environment. This study deals with the spatial characterization over time of the urban sprawl close to and around two important archaeological areas: Kom el Shoqafa, Egypt and Shush, Iran. For both of the investigated sites, change detection analyses have been conducted using satellite declassified Corona and multidate Thematic Mapper (TM) imagery available for free from the USGS Earth Explorer. The study involves the collection of Corona 1964, Landsat TM 1984, Landsat ETM+ 1998 and L8 2016. The past and current urban and agricultural areas have been extracted by using consolidated classification techniques. Analyses and quantification of the spatial dimension of the urban expansion showed that, for both the study sites, urban areas have expanded to a significant percentage. In particular, the analysis of Corona and Landsat TM, ETM+, L8 imagery in Kom el Shoqafa revealed that, for the urban area, the evaluation of the change detection presented generally increasing chronology in both of the study areas, but for the agriculture lands, we can see that the changes sometimes decreased and sometimes increased. As a whole, outputs from our investigations clearly highlight that the current availability free of charge of long term satellite time series provides an excellent low cost tool for several applications including environmental monitoring and change detection to observe and quantify urban and land use changes from a global down to a local scale. We examine the capabilities of integrating remote sensing and GIS and suggest some innovative solutions to preserve the archaeological sites.

1. Introduction

Globally, more people live in urban areas than in rural areas, with 54 per cent of the world’s people residing in urban areas in 2014. In 1950, 30 per cent of the world’s population was urban, and by 2050, 66 per cent of the world’s population is projected to be urban. In particular, Asia and Africa will surpass the value of 50% of the urban population in 2020 and 2035, respectively [1]. This current situation and the expected future scenarios impose the need for a ‘sustainable development’ as a key factor in the programs of many governments, businesses, educational institutions and non-government organizations around the world. Actually, ‘sustainable development’ is a dynamically evolving concept without a unique definition. Historically, it has expressed the need to integrate ecological and economic principles into personal and public decision-making. The Bruntland report, the Rio Conference and the Istanbul Habitat II Conference definitely underlined the importance of social and economic dimension of environmental sustainability [2,3]. Subsequently, a new concept of sustainability has been put forward, which underlines the importance of including environmental criteria in territorial development choices, rather than supporting specific protection policies, indicating boundary thresholds for resource use and consumption. According to this idea, all decisions about new government interventions are taken with the respect to environment carrying capacity [4,5,6,7,8].
Although urban growth is perceived as necessary for a sustainable economy, uncontrolled or sprawling urban growth can cause various problems such as loss of open space, environmental pollution, traffic congestion, infrastructure pressure, landscape alteration, threats and/or destruction of archaeological sites and cultural landscape [9]. It is important to highlight that today cultural heritage is increasingly threatened with destruction not only by the traditional causes of decay, but also by changing social and economic conditions which aggravate the situation with even more formidable phenomena of damage or destruction (from the general conference of the UNESCO meeting in Paris from 17 October to 21 November 1972, at its 17th session, available online) [10]. To face these drawbacks, a continuous monitoring of the urban growth in terms of type and extent of changes over time is essential for supporting planners and decision makers. The analysis of city size distribution deals with different disciplines such as geography, economy, demography, ecology, archaeology, physics, statistics because the evolution of a city is a dynamic process involving a number of different factors. For each of these diverse factors, the main issue of great importance in understanding, modeling and managing urban growth includes estimation of current and future spatial and temporal dynamics as well as the effects of urbanization and man-induced changes [11]. Therefore, for planning and monitoring urban expansion processes in a ‘sustainable development’ approach, a critical point is the availability of information on past and current conditions to estimate potential future scenarios. In this context, satellite data (also available free of charge) can provide both (i) a historical time-series data set; and (ii) timely updated information related to the current urban spatial structure and city edges [12]. The use of satellite imagery along with spatial analysis techniques (see, for example, [13,14]) can be fruitfully used for improving knowledge and documentation of cultural heritage sites (see, for example, [14,15,16,17,18]) as well as for monitoring and planning purpose recording ongoing trends of urban growth [19,20,21] and estimating natural and anthropogenic risks [22] at a detailed level. The analyses of the historical data set of satellite images provide detailed information on the evolution of the size and distribution of urban areas and agricultural lands that constitute key information that is useful for supporting both the management of future city growth and the implementation of strategies to mitigate the negative impacts on environment, ecosystems, cultural sites and archaeological landscape.
A multidisciplinary approach based on the cooperation of diverse scientific communities, as archaeologists, earth and remote sensing experts, and other scientists and engineers, can successfully address the challenge of supporting both the needs related to social and economic development and the preservation of cultural heritage [23,24,25]. As an example, in redeveloping urban areas there is a need to provide adequate foundations for new buildings and structures, while at the same time preserving, as far as possible, sub-surface archaeological remains.
Conservation and protection policy addressed to preserve cultural heritage and landscape is a pressing issue today, especially for sites and areas that significantly represent the cultural identity of a territory, population, country, civilization. Moreover, it is important to highlight that archaeological sites, cultural properties and landscape are non-renewable resources and they hold specific cultural values for mankind that need to be preserved for the present and future generations. These assets are also important economic resources and, in view of increasing public interest, an organized approach to decision making would assure the conservation and preservation of the various values of the archaeological sites and cultural landscape, including their educational and economic potential. In this context, remote sensing technologies [26,27] can offer both useful data to timely update information and documentation and reliable tools for systematic monitoring of cultural properties, for the monitoring of urban sprawl [28], to the estimation of stabilities of ancient buildings [29] and the study of archaeological landscape and buried structure [30,31,32].
Today, the tremendous availability of advanced remote sensing data has opened a new prospective that was unthinkable several years ago. In particular, remote sensing can provide useful data not only for probing the subsurface to unveil unknown sites and artefacts, but also for the management, valorization and preservation, for detecting changes as well as for assessing degradation and emerging threats. A sustainable planning and design can fruitfully find the technical solutions and make it possible to find space for the new preserving the ancient past heritage. Alessandria (Egypt) and Shush, (Iran) were selected as study areas for our investigations.

2. Study Areas

2.1. Kom el Shoqafa, Egypt

Alexandria was an important city of the ancient world. For more than two thousand years, it was the largest city in Egypt and was its capital for almost half of that time [33]. Located in eastern part of the Mediterranean basin (Northern Egypt), it is a place of great historical and religious interest. Numerous catacombs and cemeteries erected in the Greek-Roman and Christian era have been found [34]. The tomb of kom el Shoqafa is one of the most important monuments in the city of Alexandria [35]. The whole complex dates from the 1st to 2nd century AD. [36]. DMS Lat 31°10′42.81″ N, DMS Long 29°53′34.63″ E (Figure 1). The tomb has Hellenistic and early Imperial Rome influences. It begins with a circular staircase that leads you down into a room boasting a mixture of Egyptian and Roman art. At the bottom of the stairs, to the left leads you into a funeral hall where the families and friends sit on stone couches and remember the deceased [37]. The principal hypogeum of a funerary complex dating from the end of the first century of the Christian era and still in use at the beginning of the fourth. It is composed of a ground-level construction that probably served as a funerary chapel a deep spiral stairway, and three underground levels for the funerary rites and burials. These catacombs were accessed via a set of spiraling stairs roughly twenty meters below the surface of Alexandria’s working-class district [38]. The main Tomb is the most luxurious burial unit ever found in Alexandria. It is composed of an anteroom and a main burial chamber that contains three sarcophagi in a cross-shaped arrangement. The sculptured decoration of the main tomb suggests a citizen group of high economic and social status [39]. The rotunda, or circular main chamber, of the catacombs further consisted of a second shaft that led to a deeper subterranean level [36]. A set of six stairs descends into the main tomb in a similar fashion to how descending stairs were designed in Egyptian rock-cut tombs [40] (Figure 2).
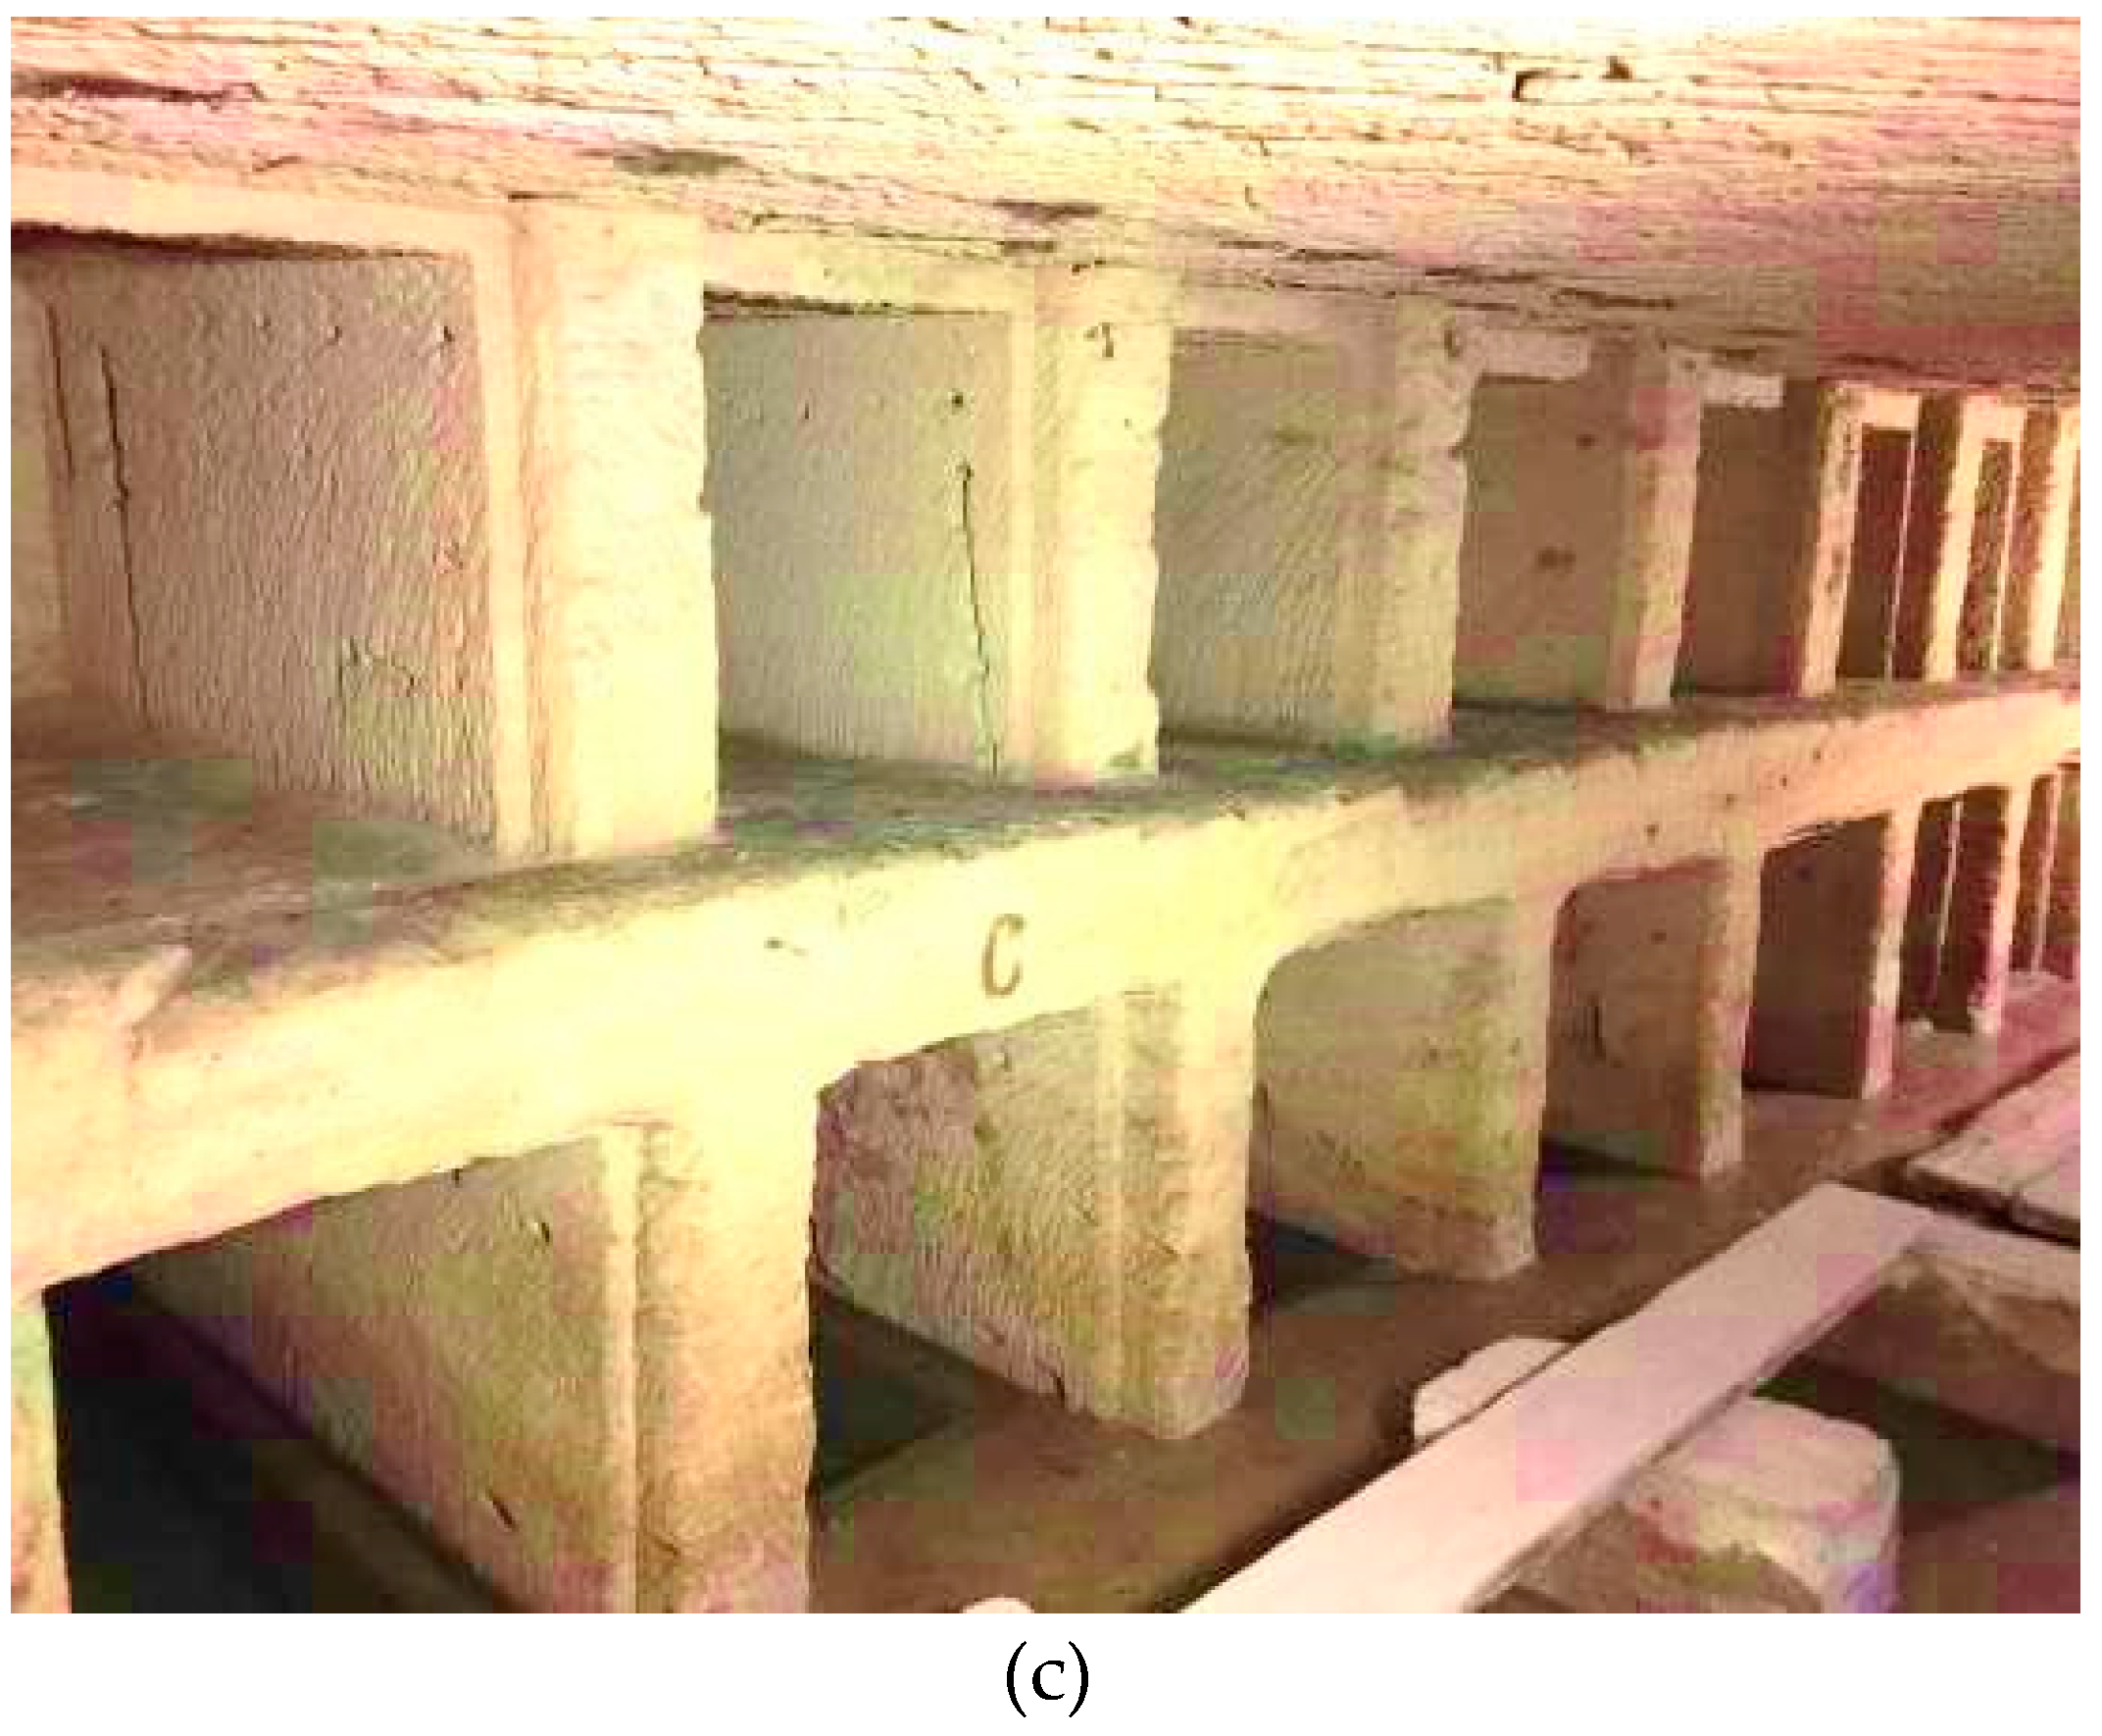
The laboratory study indicated that there are several biological processes causing aging and damage to the limestone and decorative elements in the catacombs, a high groundwater level has led to algae penetrating along the cementing material between the stones, and along fissures and cracks. This type of biological growth provides a wet environment for chemical and biological interaction which increases the rate of weathering. All these factors cause biological growth that has accelerated the catacombs’ stone deterioration [42] (Figure 3).

2.2. Shush, Iran

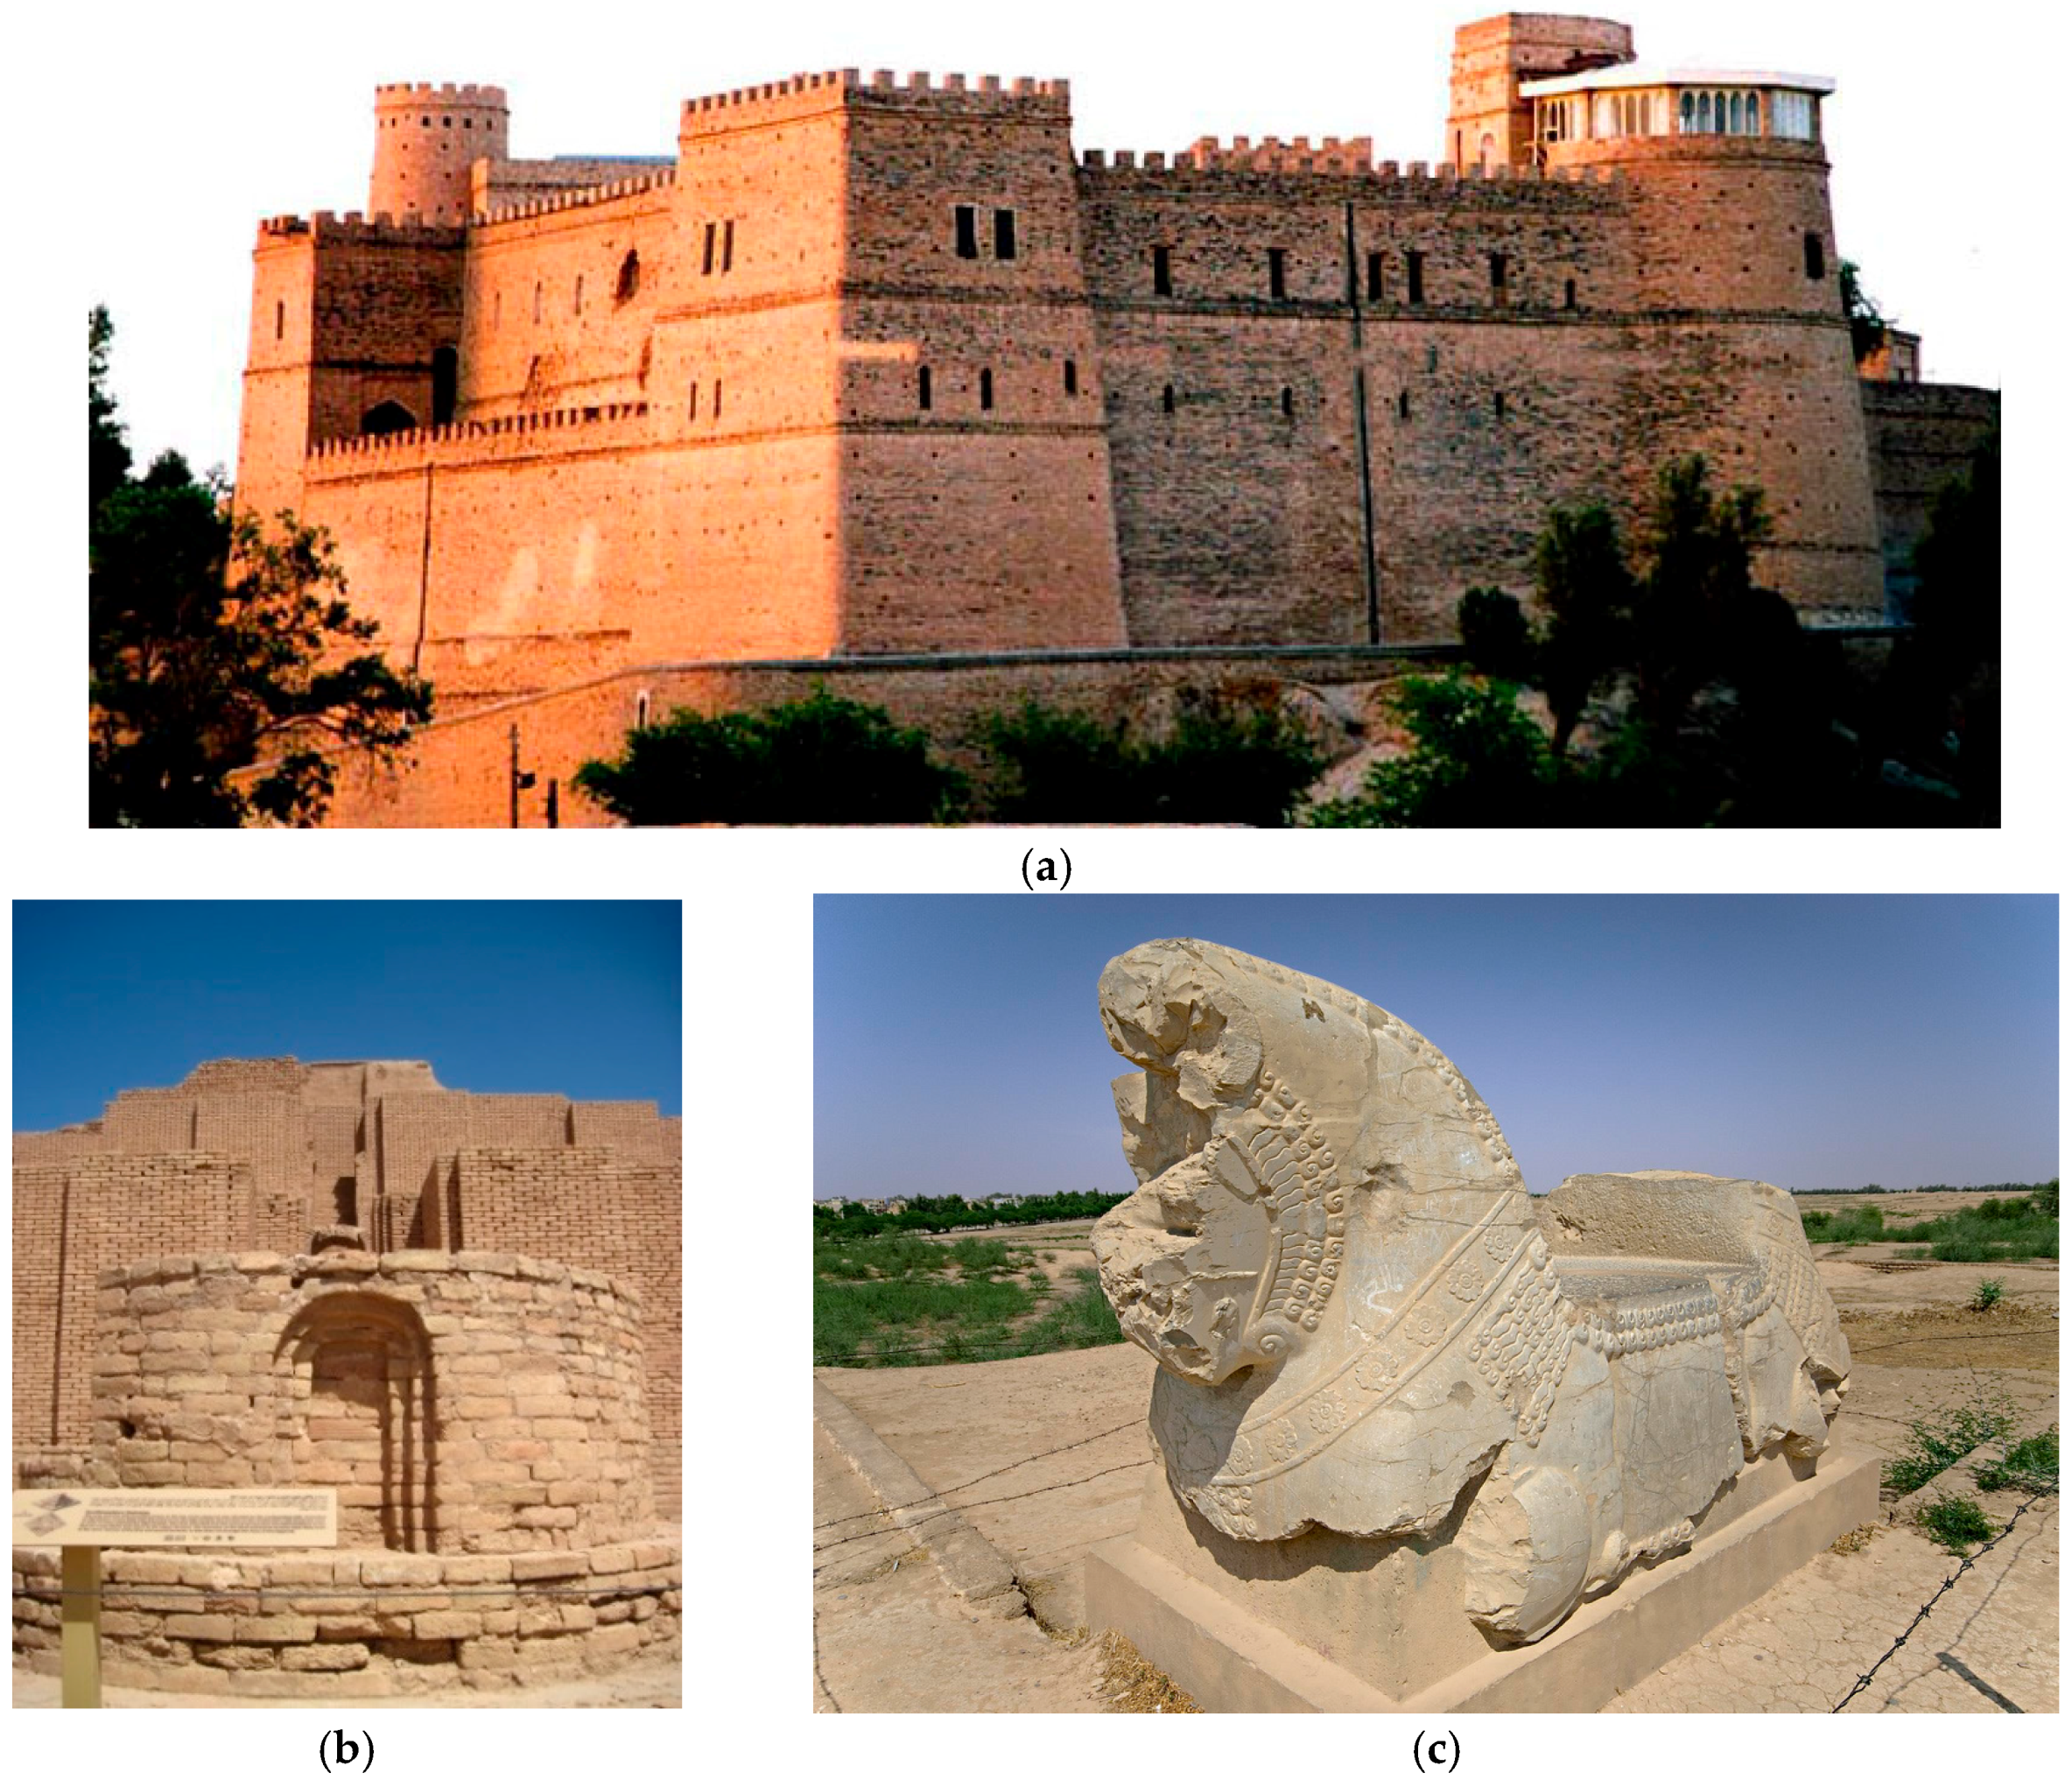
Shush is one of the major and large cities in province of Khuzestan in the southeast of Iran DMS Lat 32°11′39″ N, DMS Long 48°14′37″ E. There are many cultural heritages in the center of Shush. Covering 327 hectares, Shush constitutes one of the world’s largest cultural and archaeological sites [43]. The first-generation Mesopotamian primary state in the Zagros mountain piedmont of southwestern Iran has become known entirely through archaeology. The city of Shush is located about 1,100 km of the Khuzestan province in western Iran [44] (Figure 4). In 1851, Sir William Kenet Loftus, an English man, started the first archaeological activities in historic site of Shush, and finally Jean-Jacques De Morgan’s built Shush castle [45]. However, according to Shahmirzadi, Loftus began excavations in 1850, which lasted four years, in the highly important site of Shush [46]. While passing through Shush, he was faced with the citadel the French had built for their dwelling and archaeological activities, and, finding it to be like a military fortress, enquired about it and, upon learning about the agreement, immediately revoked it [47]. These activities were continued along several decades by de Morgan’s French successors according to this text “Thursday, 29 Rajab, 1345 AH (AD 1897)…the director of the French Mission, in his explorations and excavations of ancient relics throughout the kingdom of Iran, and that, this Mission having obtained the monopoly from the Iranian government, was to begin exploring the ruins of Shush…” [48]. Etemäd-os-Saltaneh mentioned also: “Friday, 1st of Ramazán 1303 AH (25 June 1886)…the French have done excavations in the ancient city of Shush, in Khuzestän, and amassed numerous unearthed precious items, such as gold statues and cups, in the ruins of the monument of Bahman-e Deräz-Dast the Kiäni” [49] (Figure 5).
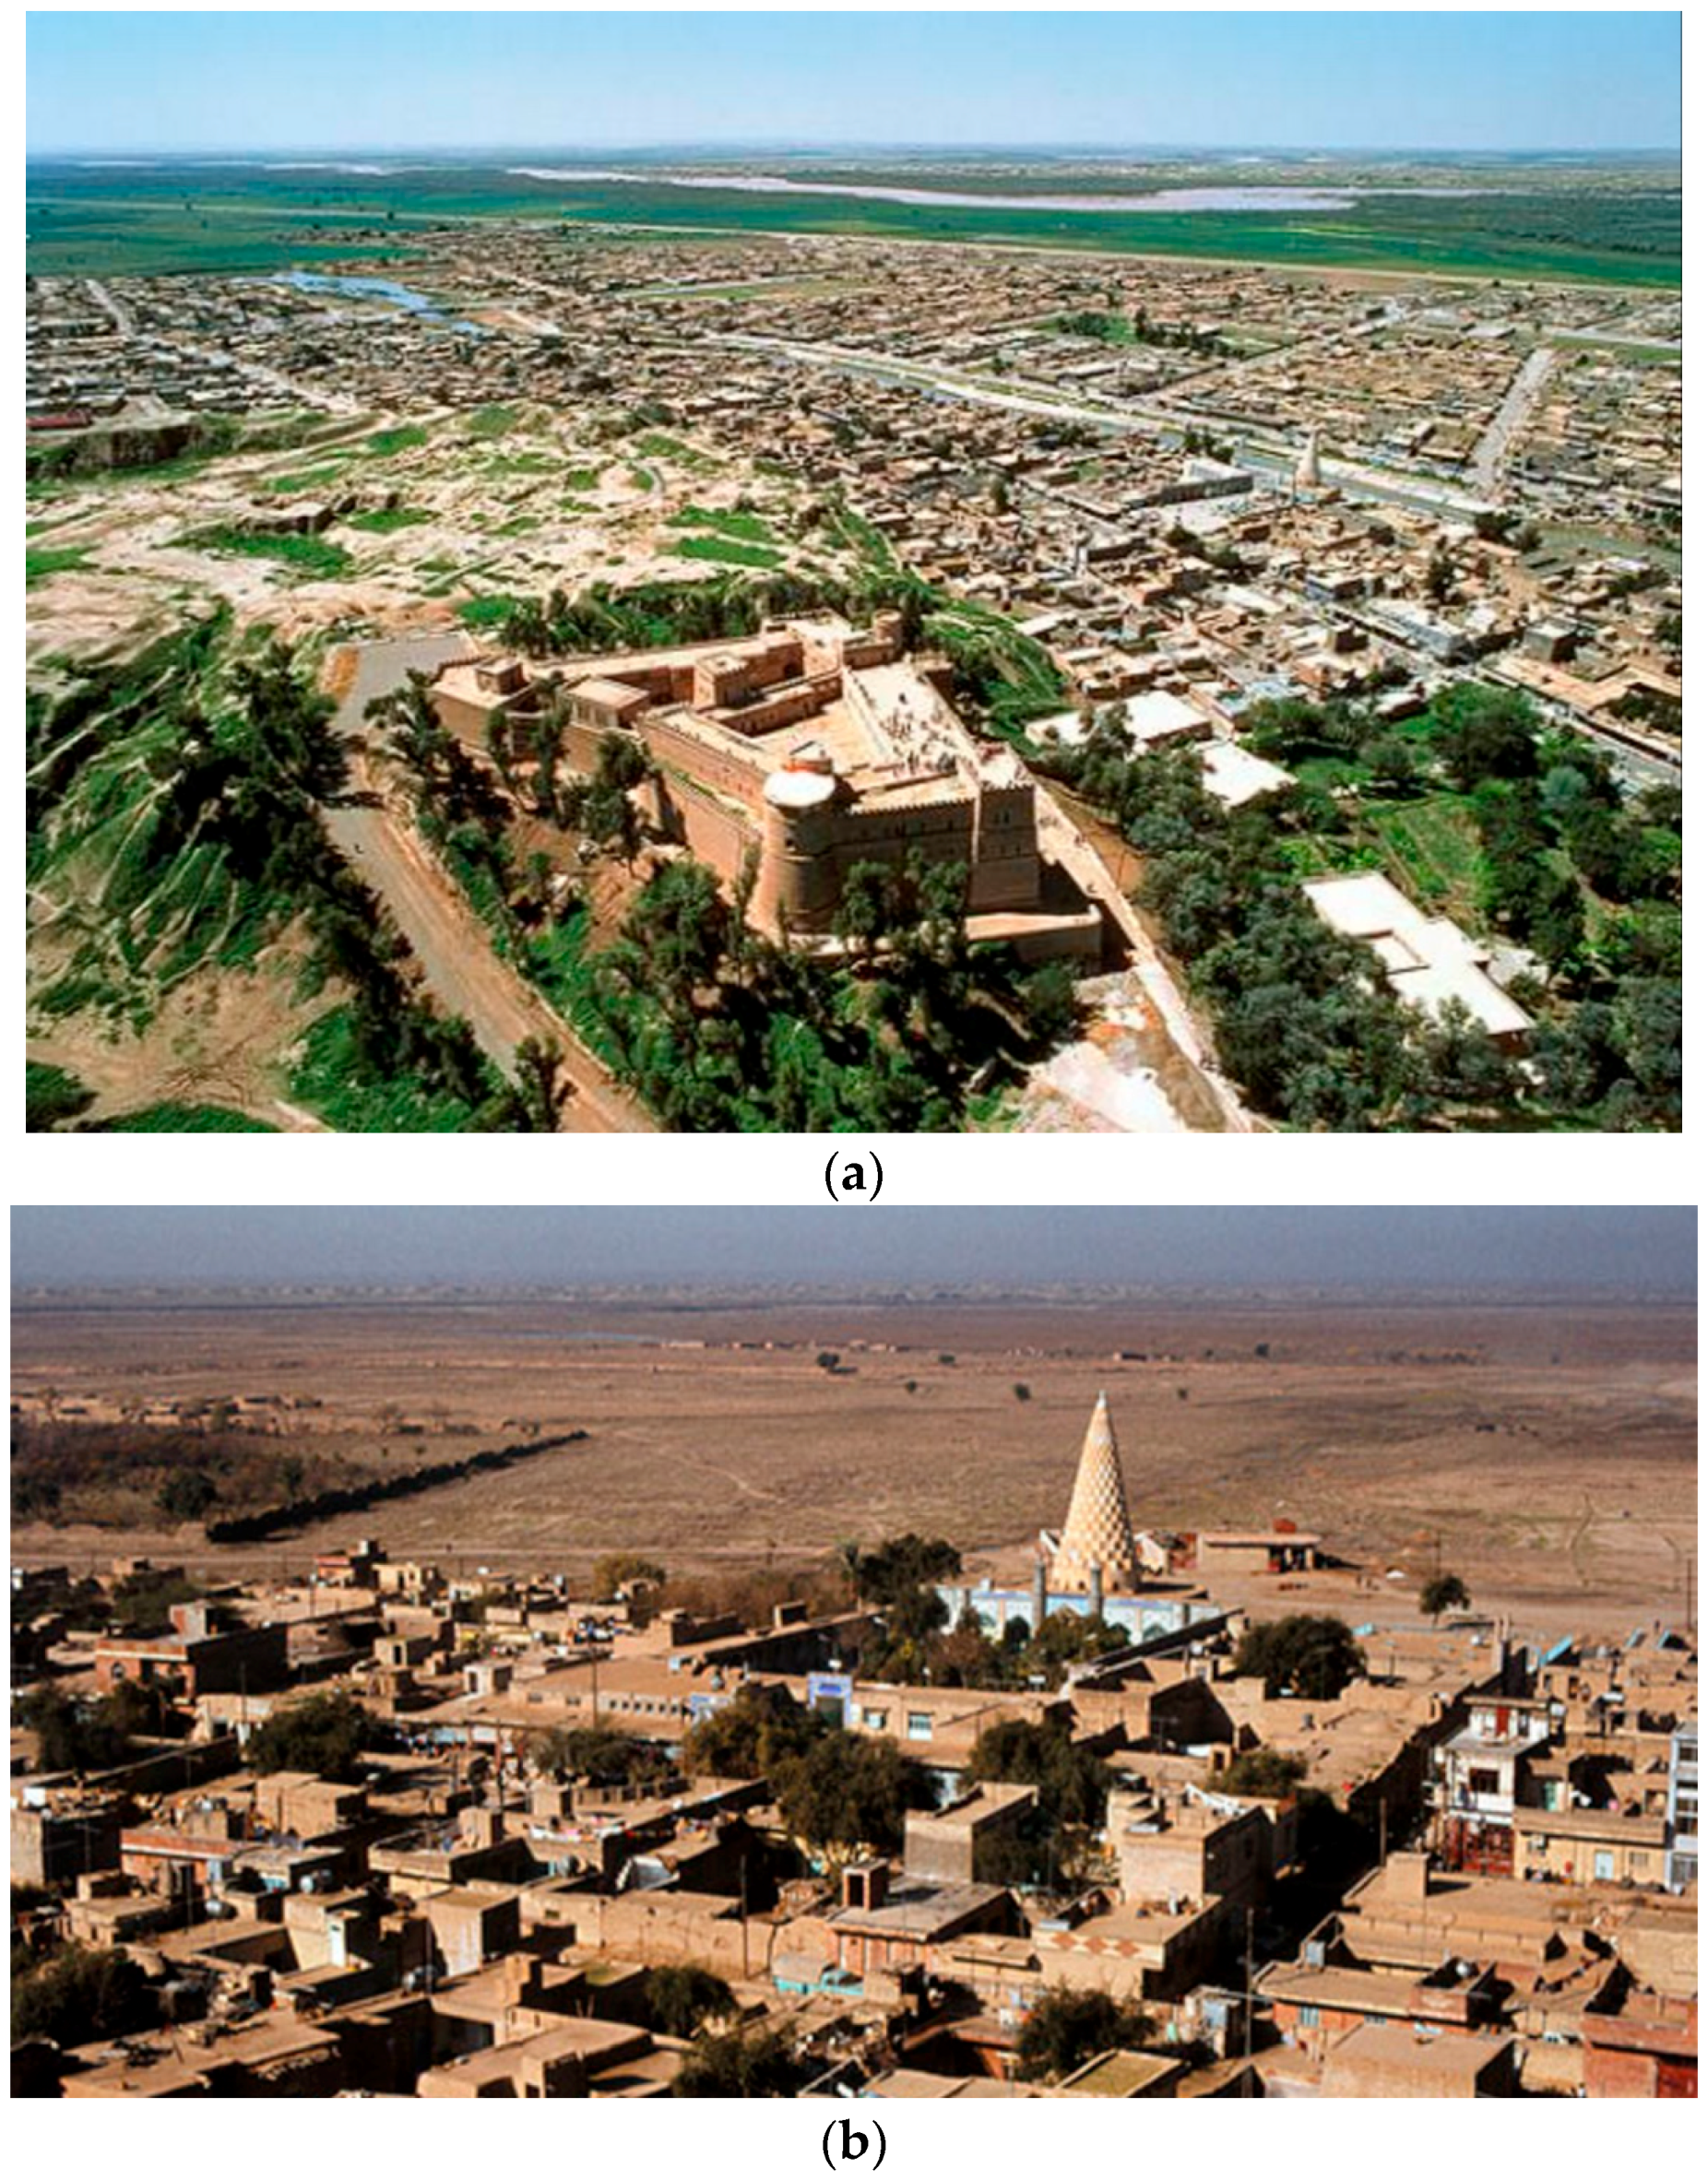
Shush is protected as a National Monument and falls under the responsibility of the ICHHTO (Iran’s Cultural Heritage Handicrafts and Tourism Organization), which protects and manages the property through Shush Base. Their stringent implementation is crucial to guaranteeing the adequate protection and preservation of the buried and unburied archaeological remains of today’s Shush [50]. The counties of Shush have faced different developmental problems and flaws at different times which reflect the lack of coordination in development based on their population. Having administrative, economic and political potentials, and being a growth hub, Ahwaz has maintained its preference over other counties in the province. Development and the level of access to services, facilities and expert labor in this county are due to the surrounding central system [51] (Figure 6).

3. Materials and Methods

3.1. Materials

The study involves the collection of Corona 1964, Landsat TM 1984, Landsat ETM+ 1998 and L8 2016) (Table 1). The required satellite imagery for the study area was downloaded from the USGS Earth Explorer, and GLCF Global Land Cover Facility. Pre-processing including geometric correction and atmospheric correction in the dark object subtraction were done as first step. The image processing was done in Arc GIS 10.3 (Environmental Systems Research Institute, Redlands, CA, USA) and Envi 5.1 (Exelis Visual Information Solutions, Boulder, CO, USA) software. The images were studied and analyzed to detect the changes in the layers extracted for both past and present data. Creating some of the new solutions, like modeling to keep the both archaeological areas using the integration between remote sensing and geographic information system techniques.

3.2. Methodology

3.2.1. Image Processing Rationale

This paper deals with the satellite-based investigations conducted to dynamically assess urban sprawl and its effects on decreasing agricultural areas and conversion into urban use over time close to the outstanding archaeological areas of Kom el Shoqafa (Egypt) and Shush (Iran). Change detection analyses have been conducted using declassified Corona data and multidate Thematic Mapper (TM) satellite images available for free from the USGS Earth Explorer (United States Geological Survey, Reston, VI, USA). The study involves the collection of Corona 1964, Landsat TM 1984, Landsat ETM+ 1998 and L8 2016). Our approach addresses the challenges of using heterogeneous data from multiple data sources for change detection analysis to improve the knowledge and monitoring of a landscape over time with a specific focus on urban sprawl and land use change around archaeological areas. The change detection was performed using a heterogeneous optical imagery data set, made up of satellite declassified corona imagery and the more recent Landsat TM data. There are many techniques nowadays available to capture and record differences in two or more images, that can be summarized as follows: (i) if the images come from the same sensors the change detection is generally based on image differencing, ratios or correlation; (ii) if the data set is made up of heterogeneous images the post classification comparison is generally adopted. Moreover, it is really important to highlight that data preprocessing is important procedure for change detection analysis. In particular, to enable the comparison between satellite images taken for the same scene at different acquisition dates, it is necessary that the images under analysis must be co-registered.

3.2.2. Image Processing

Supervised and Unsupervised Classification of Images

In our cases, due to the heterogeneity of the considered data set, the adopted approached is based on both: (i) unsupervised classification to roughly categorize the investigated areas and assess the statistical distribution of the considered classes; (ii) supervised classification to improve the categorization of the images which will be further analyzed to identify changes. Supervised change detection methods are based on supervised classification methods applied to multitemporal data, and, therefore, require the availability of a suitable training set for the learning process of the classifiers. The adopted approach consists of: (i) geometric correction, to co–register all the images investigated; (ii) unsupervised classification for the identification of the prevailing classes and their statistical distribution; (iii) supervised classification for the detection of urban and agricultural areas for each image; (iv) comparison of the outputs from the diverse images acquired in diverse years (1964, 1984, 1988, 2016) for the extraction and mapping of ongoing environmental changes with particular reference to urban sprawl and agricultural areas.
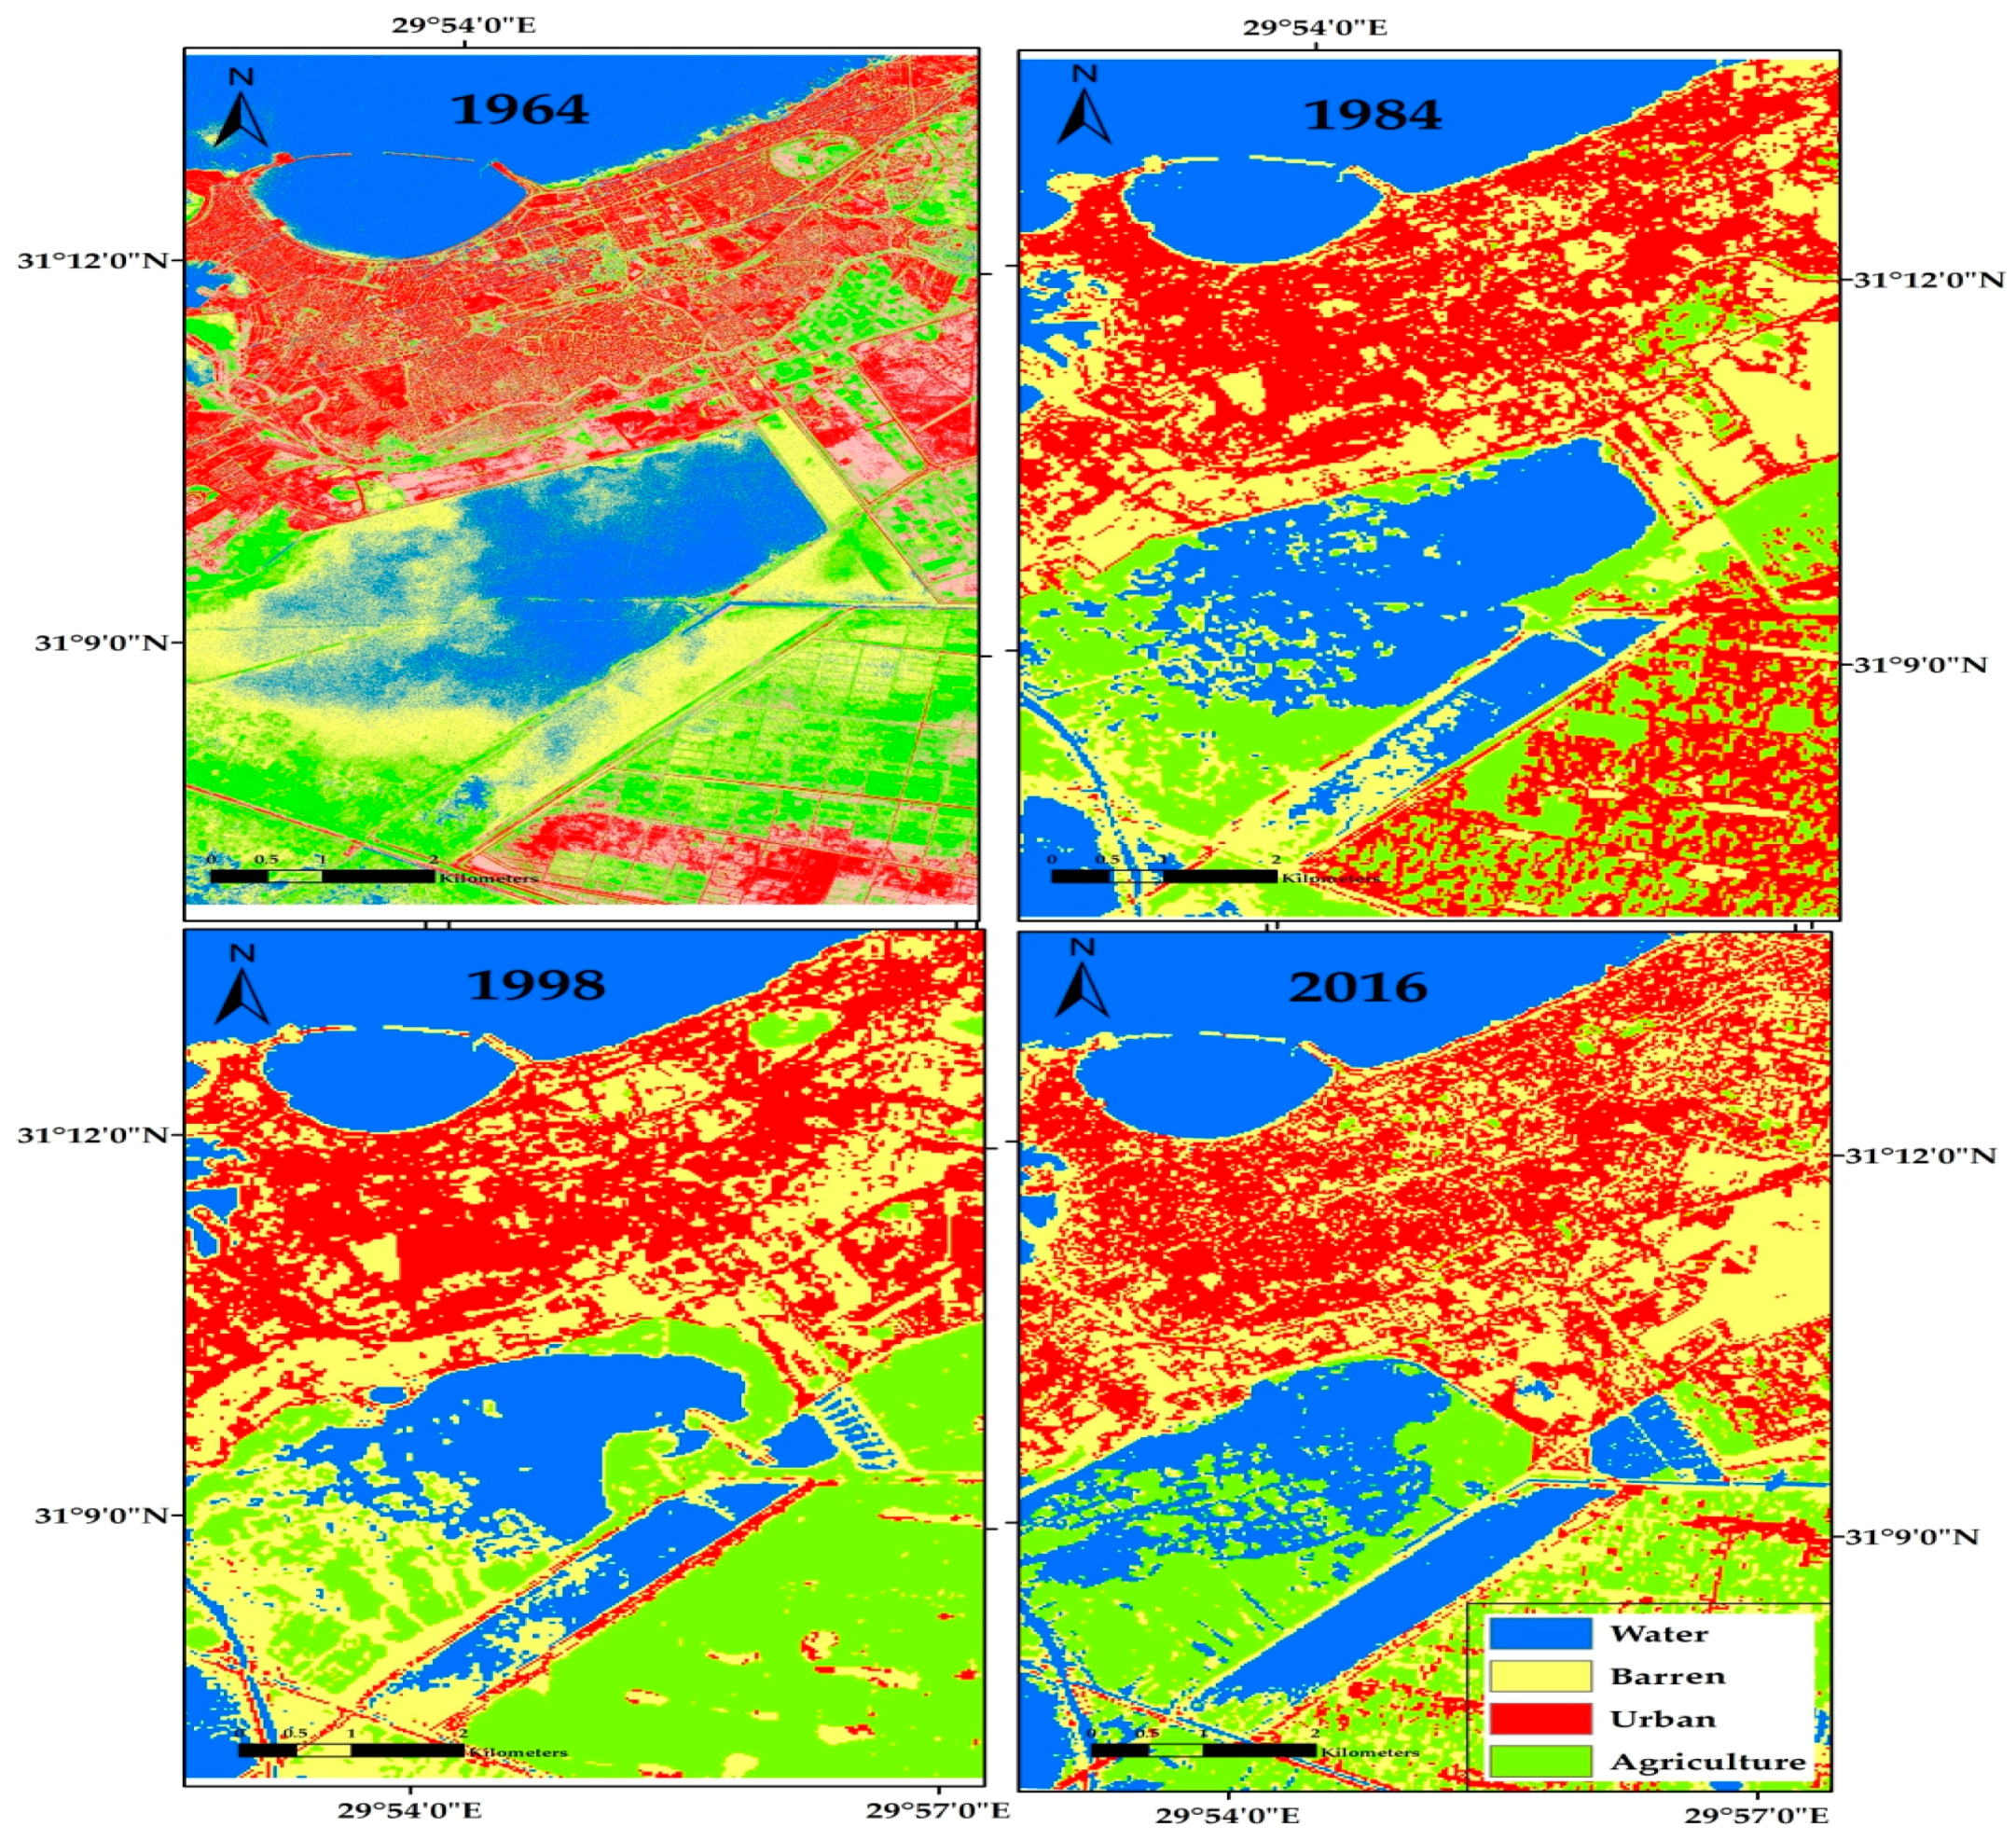
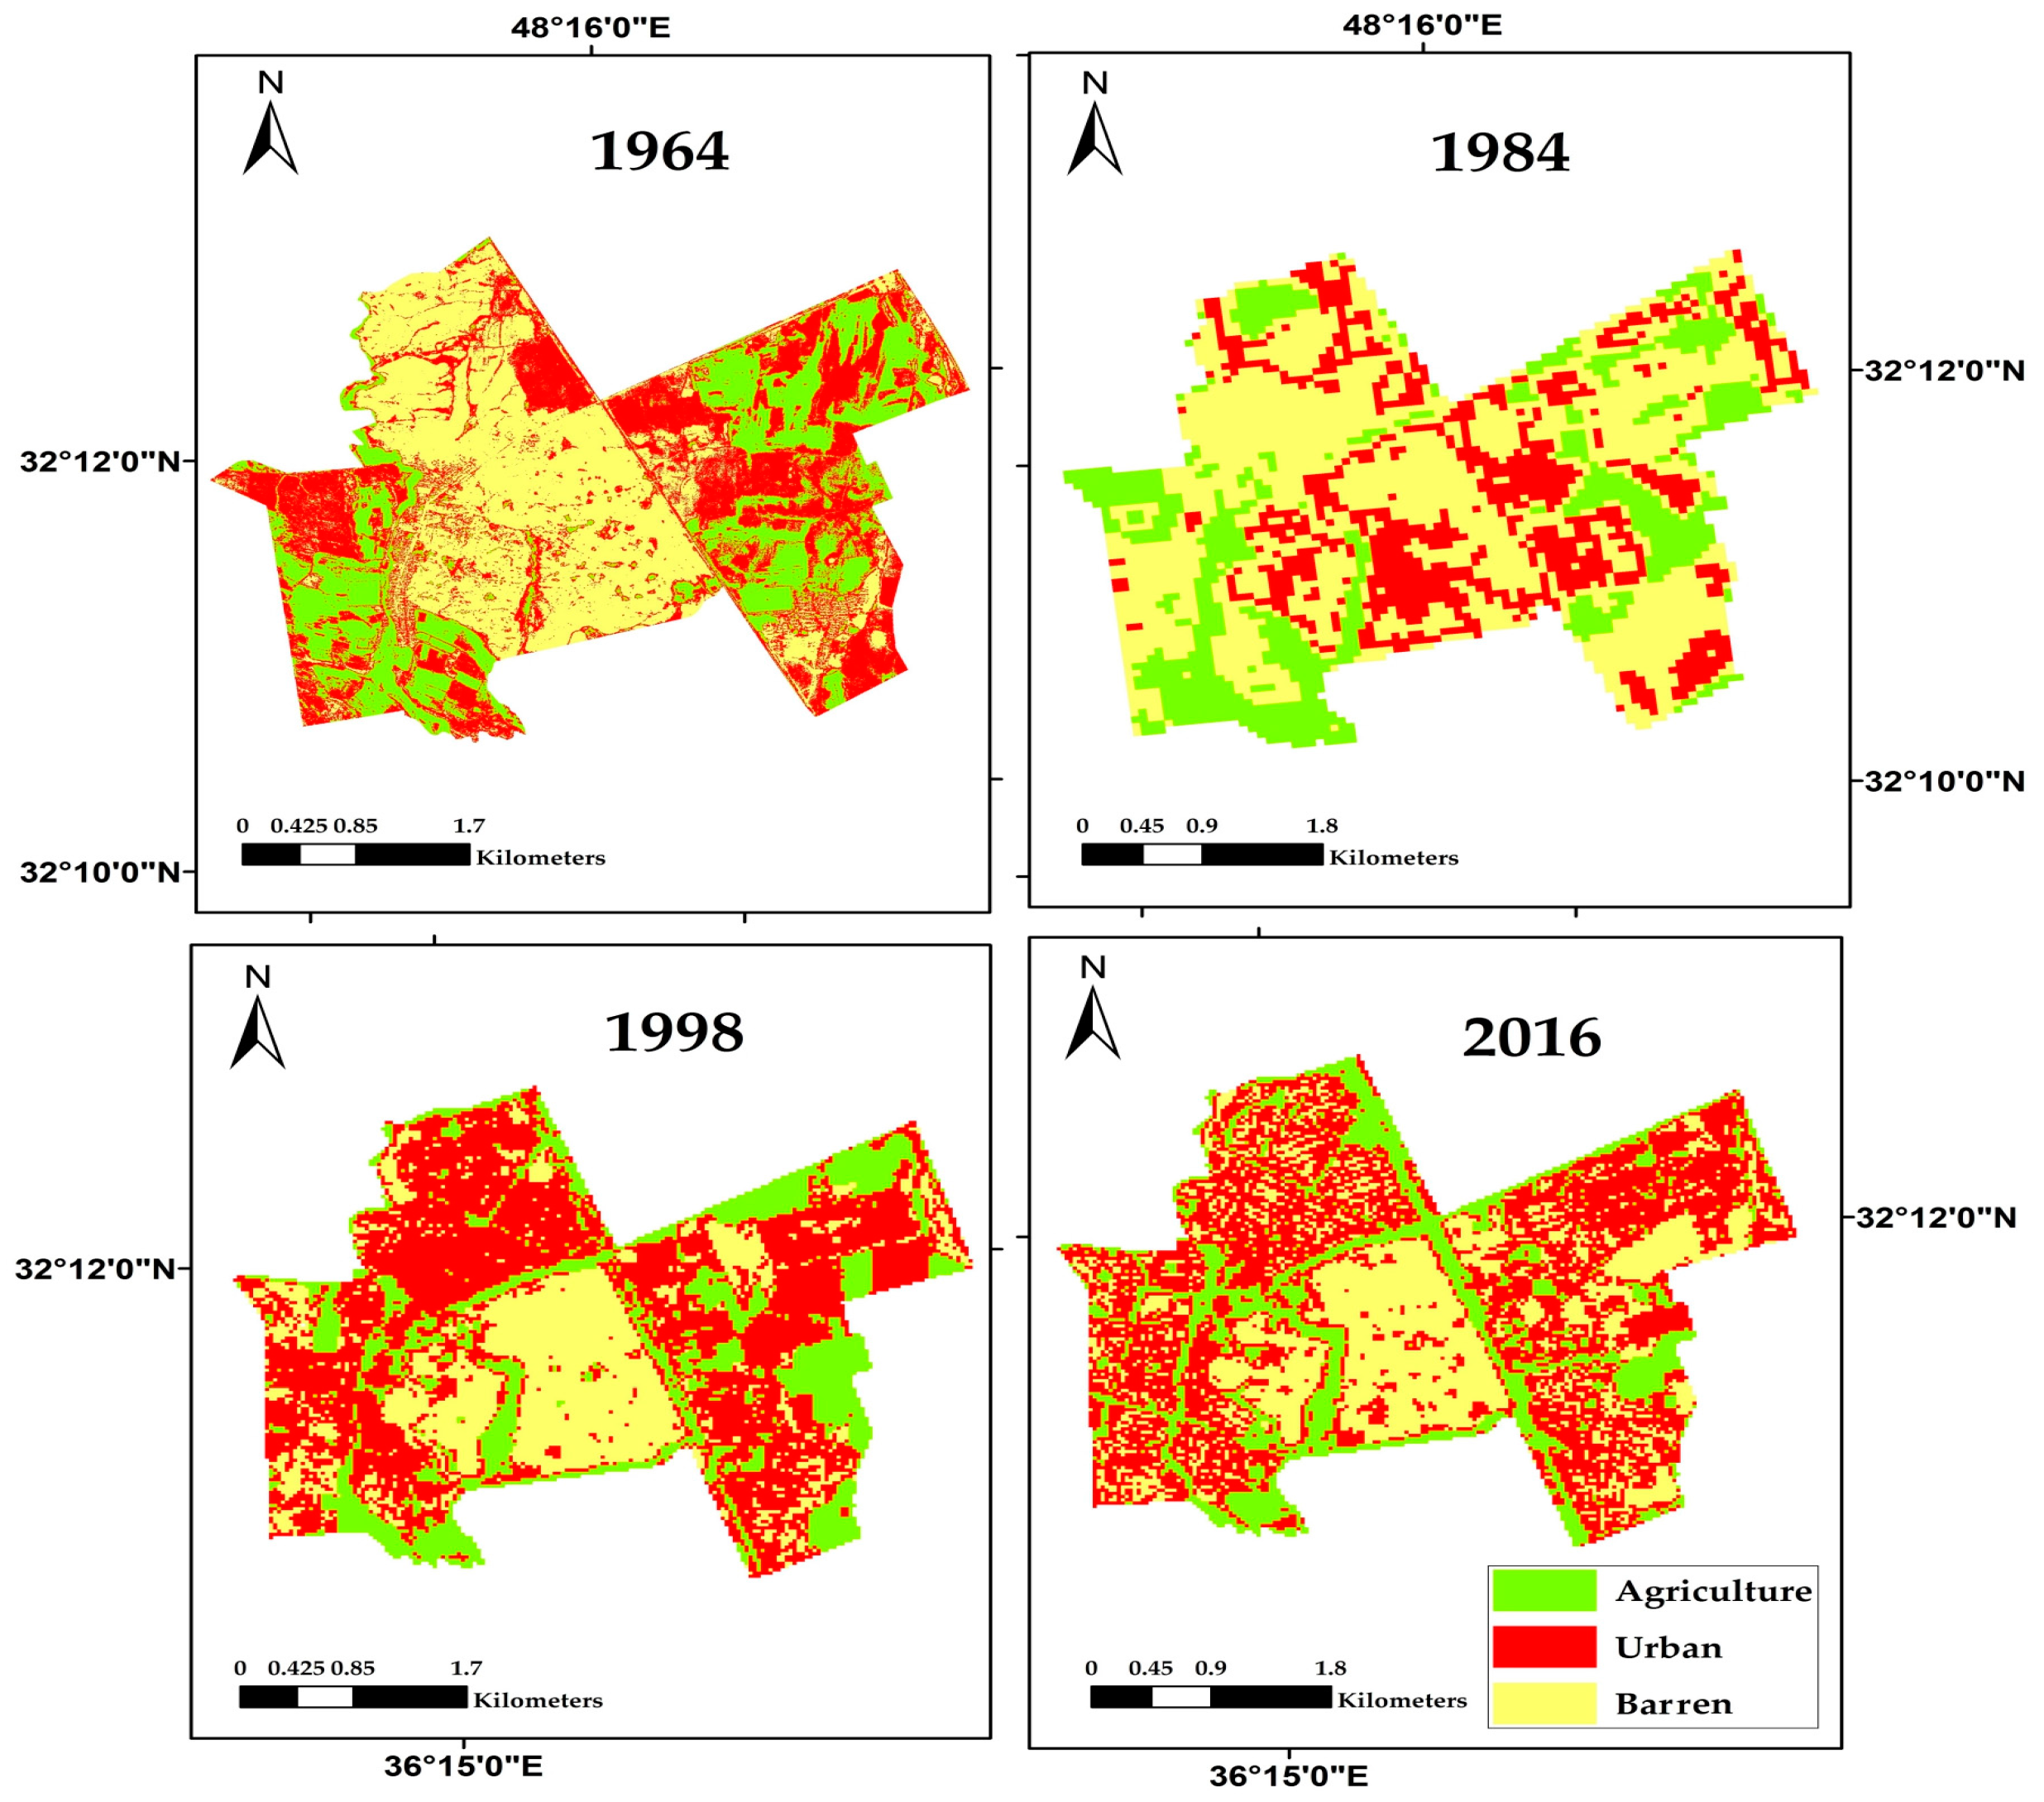
Un-supervised classified image has been used as a preliminary step for reference and for understanding the statistical distribution of pixels with different digital numbers. The ISODATA clustering algorithm using 14 classes were selected and applied by Envi 5.1 software. The procedure provided classification outputs according to the number of classes required and the digital number of the processed pixels. Then, these 14 classes were re-classed to 3 class using ArcMap 10.3 according to the numbers of required classes (Figure 7 and Figure 8).
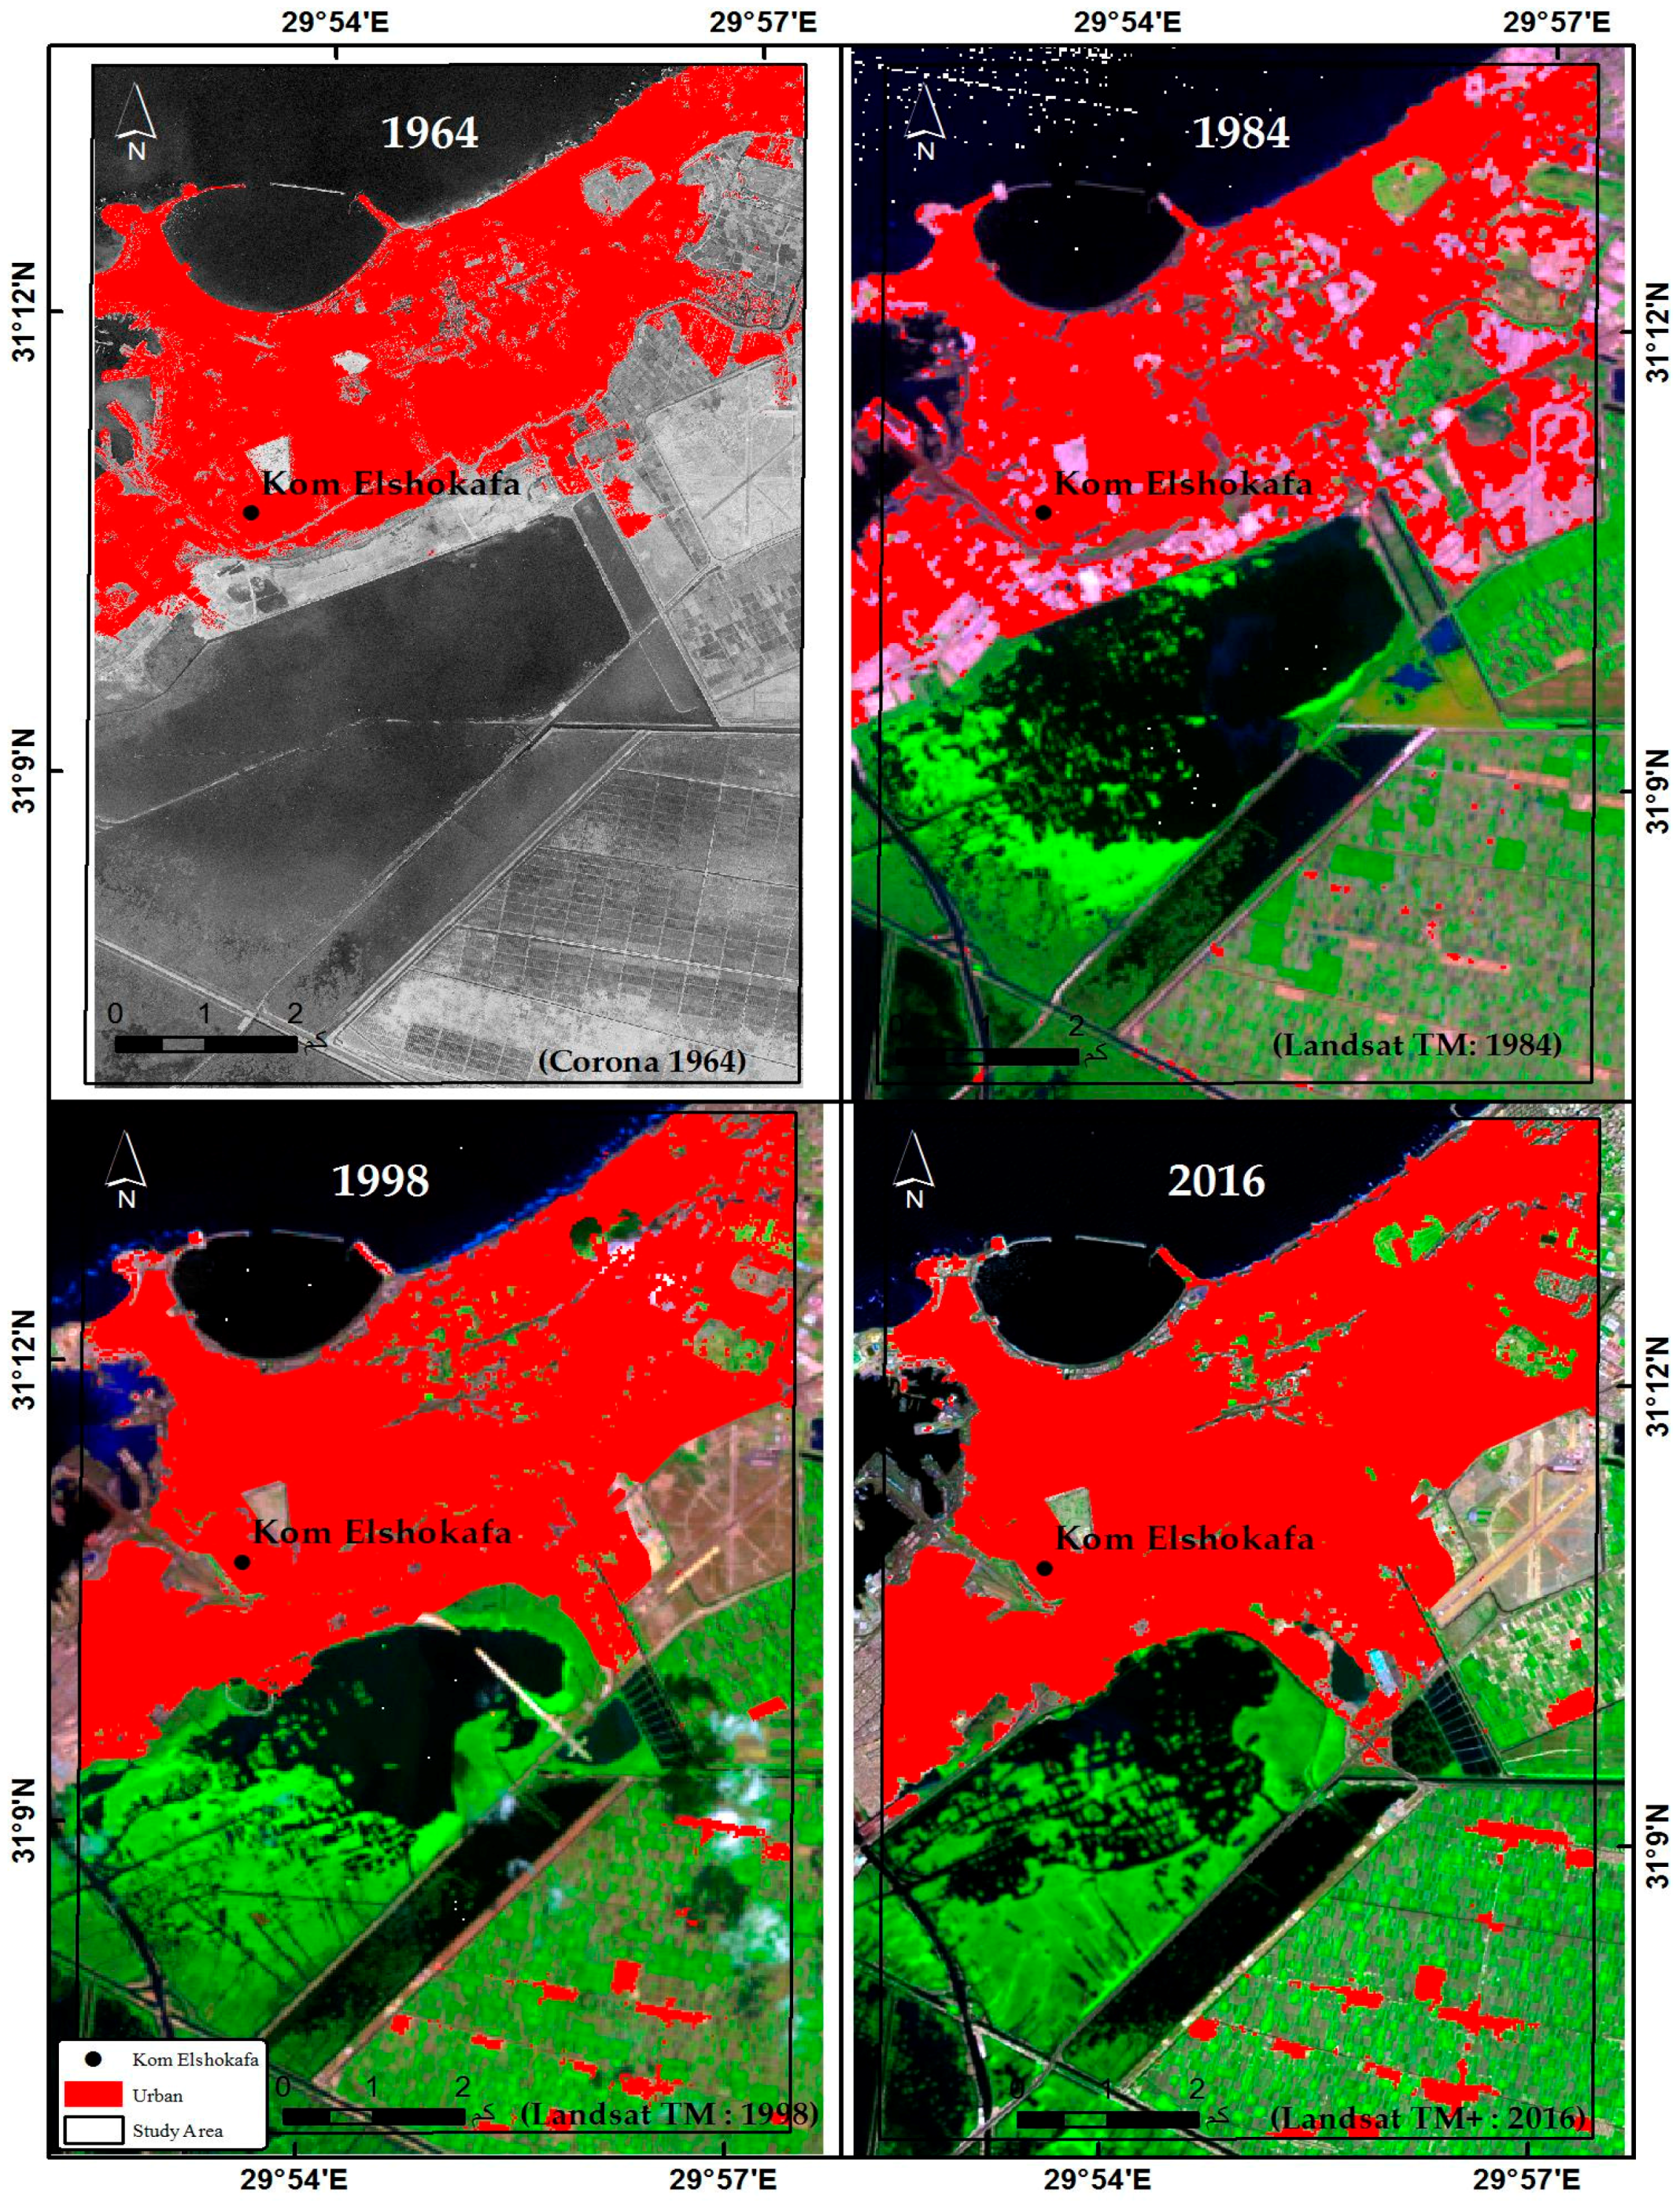
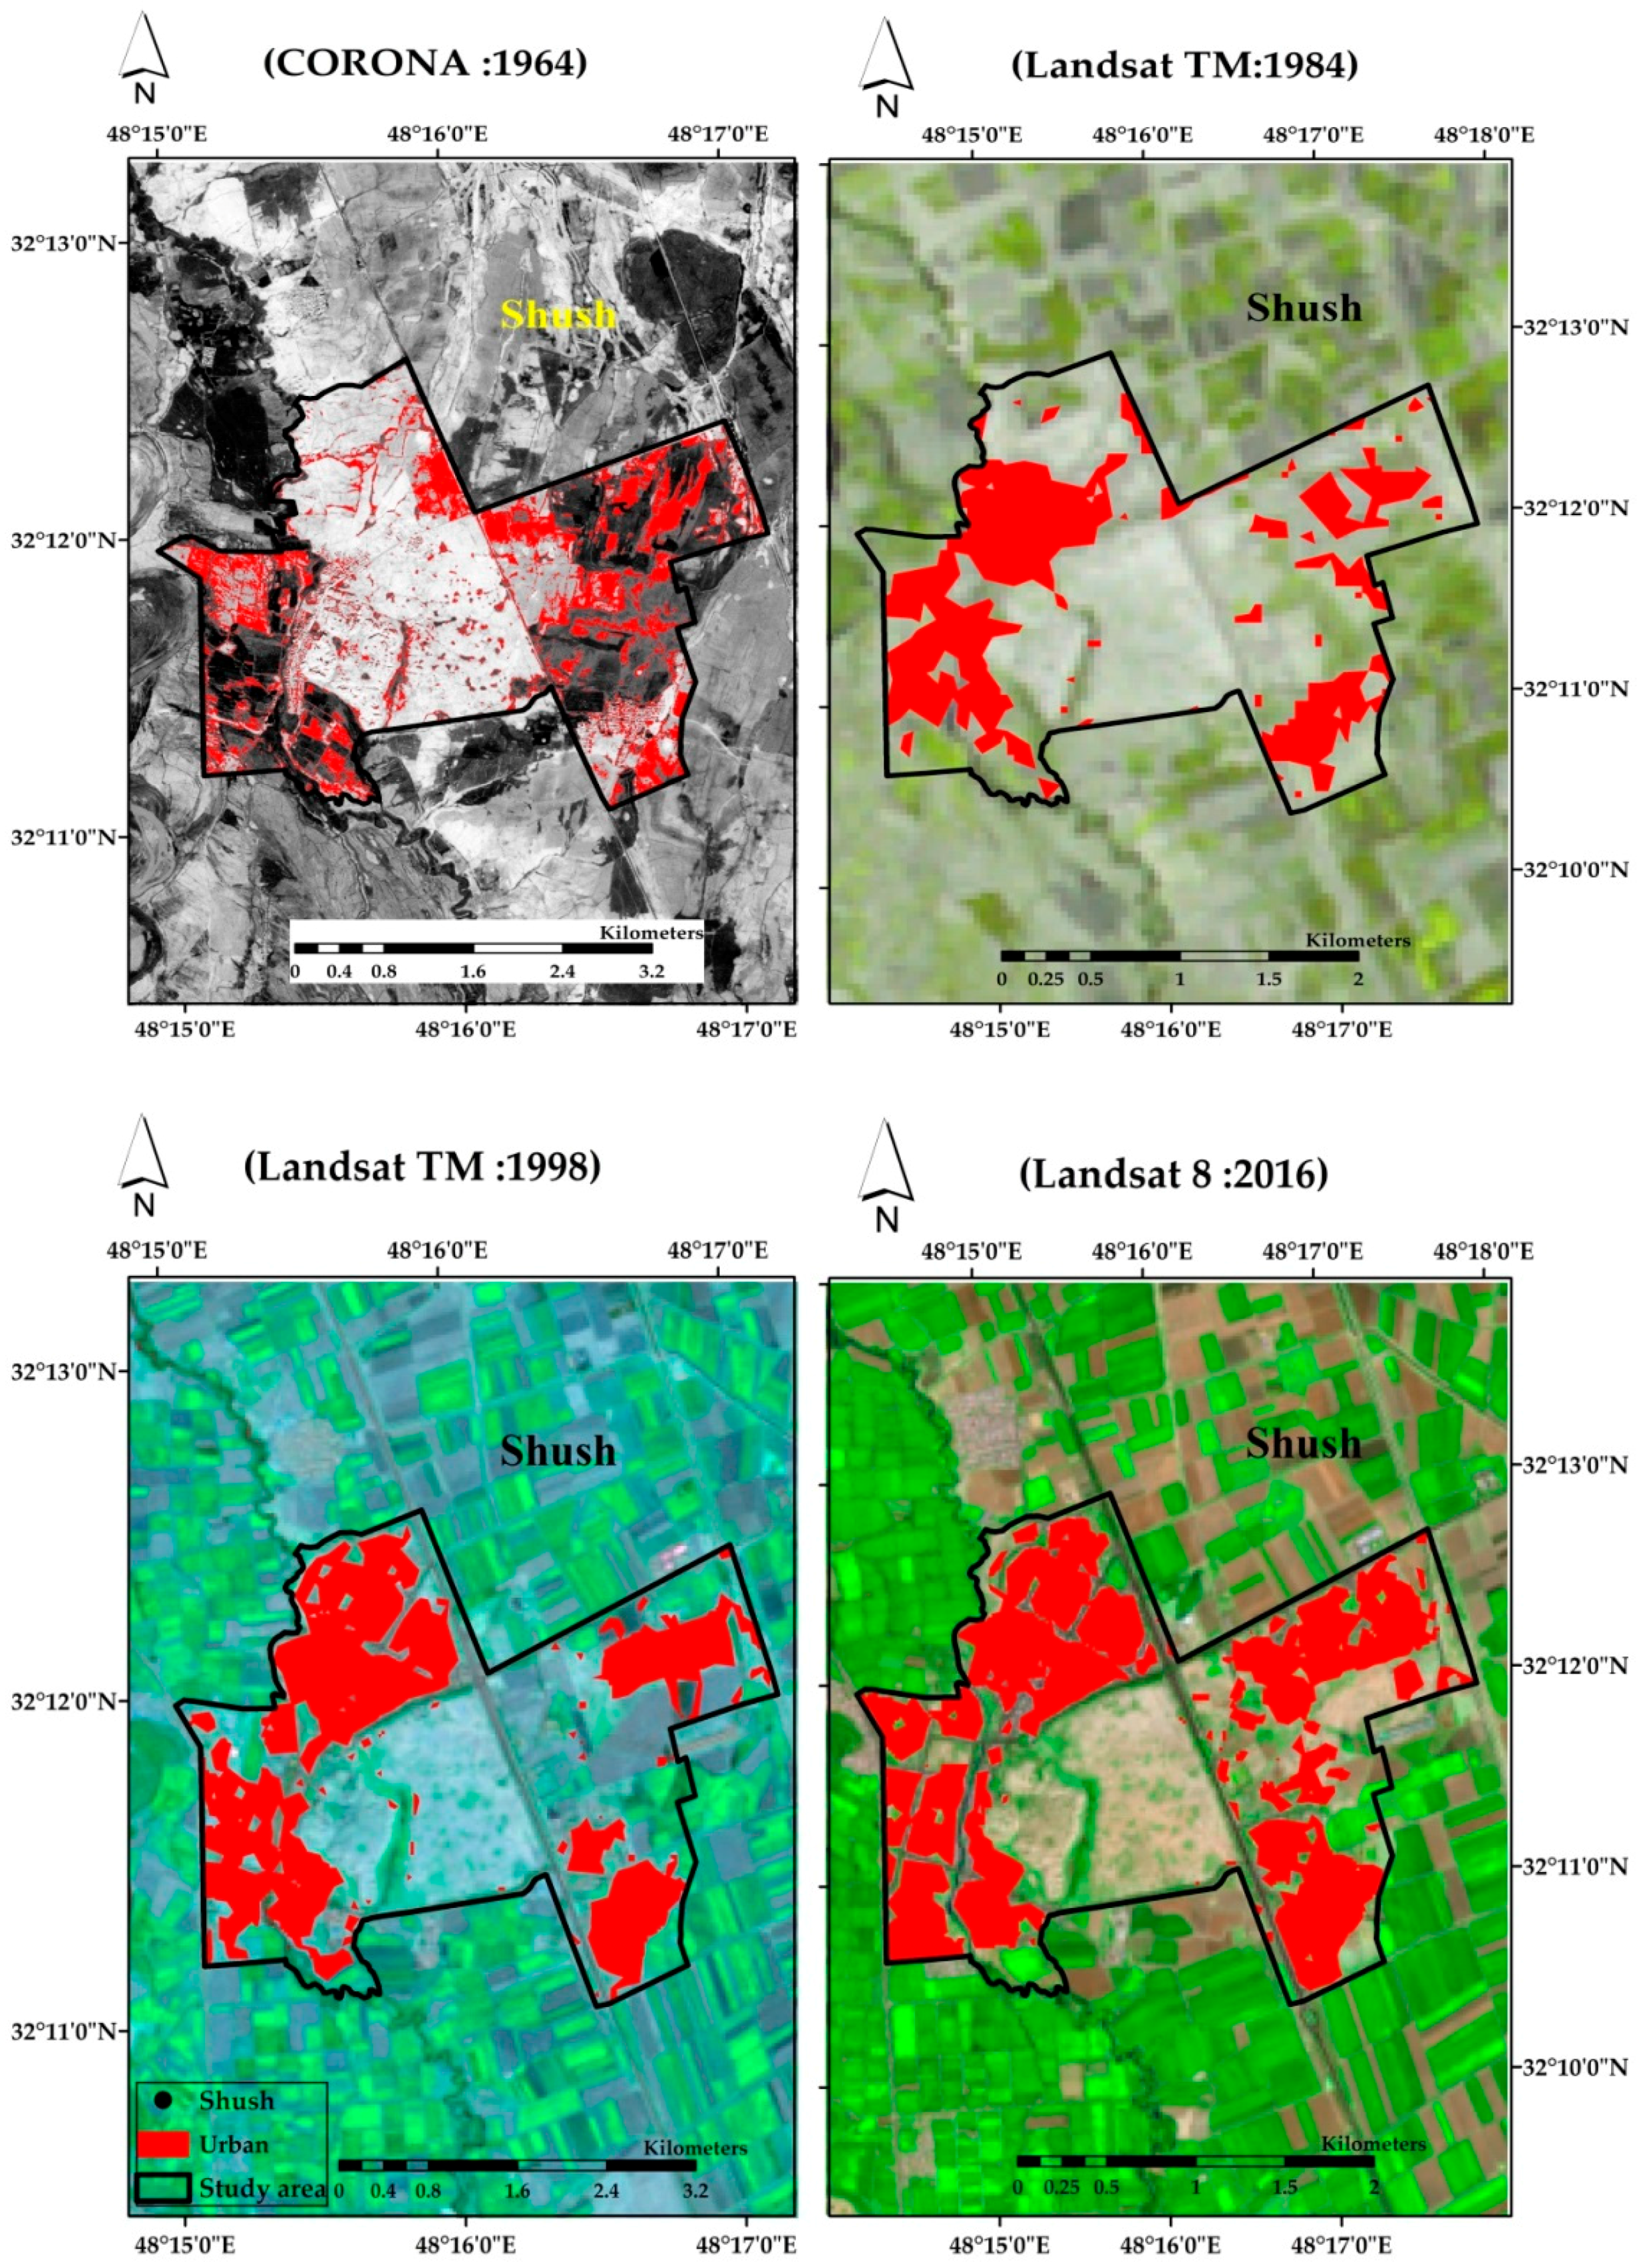
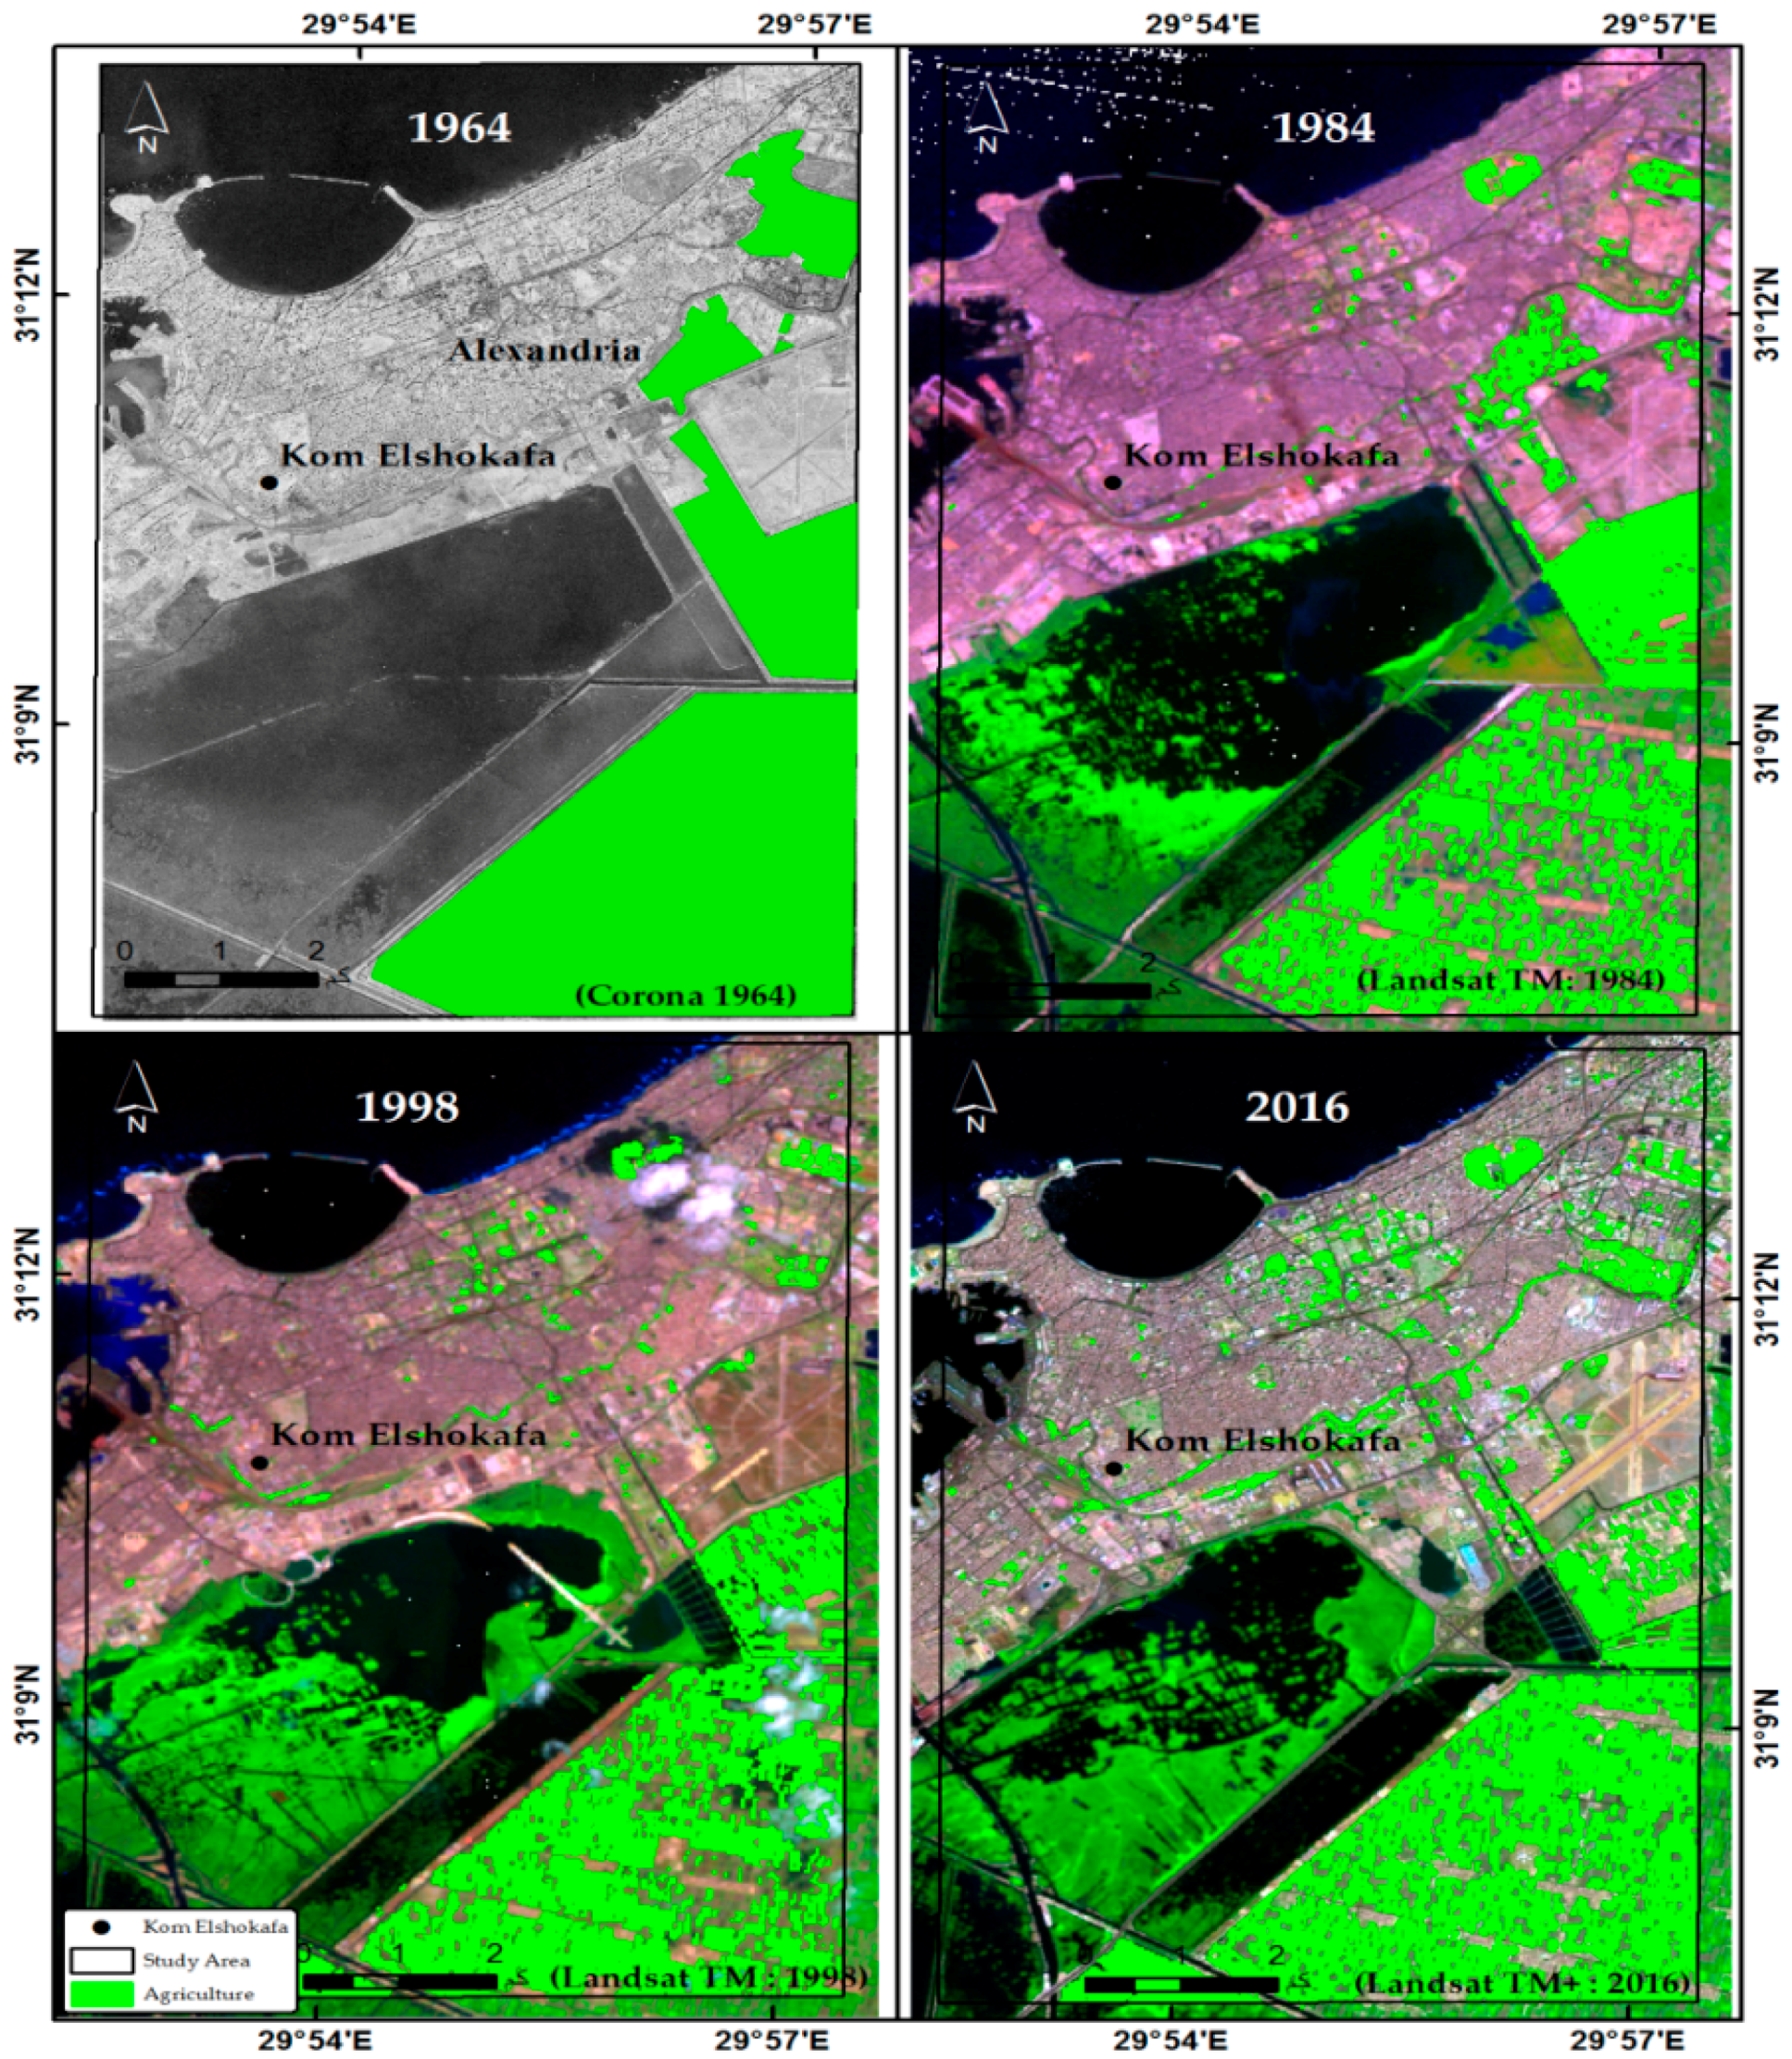
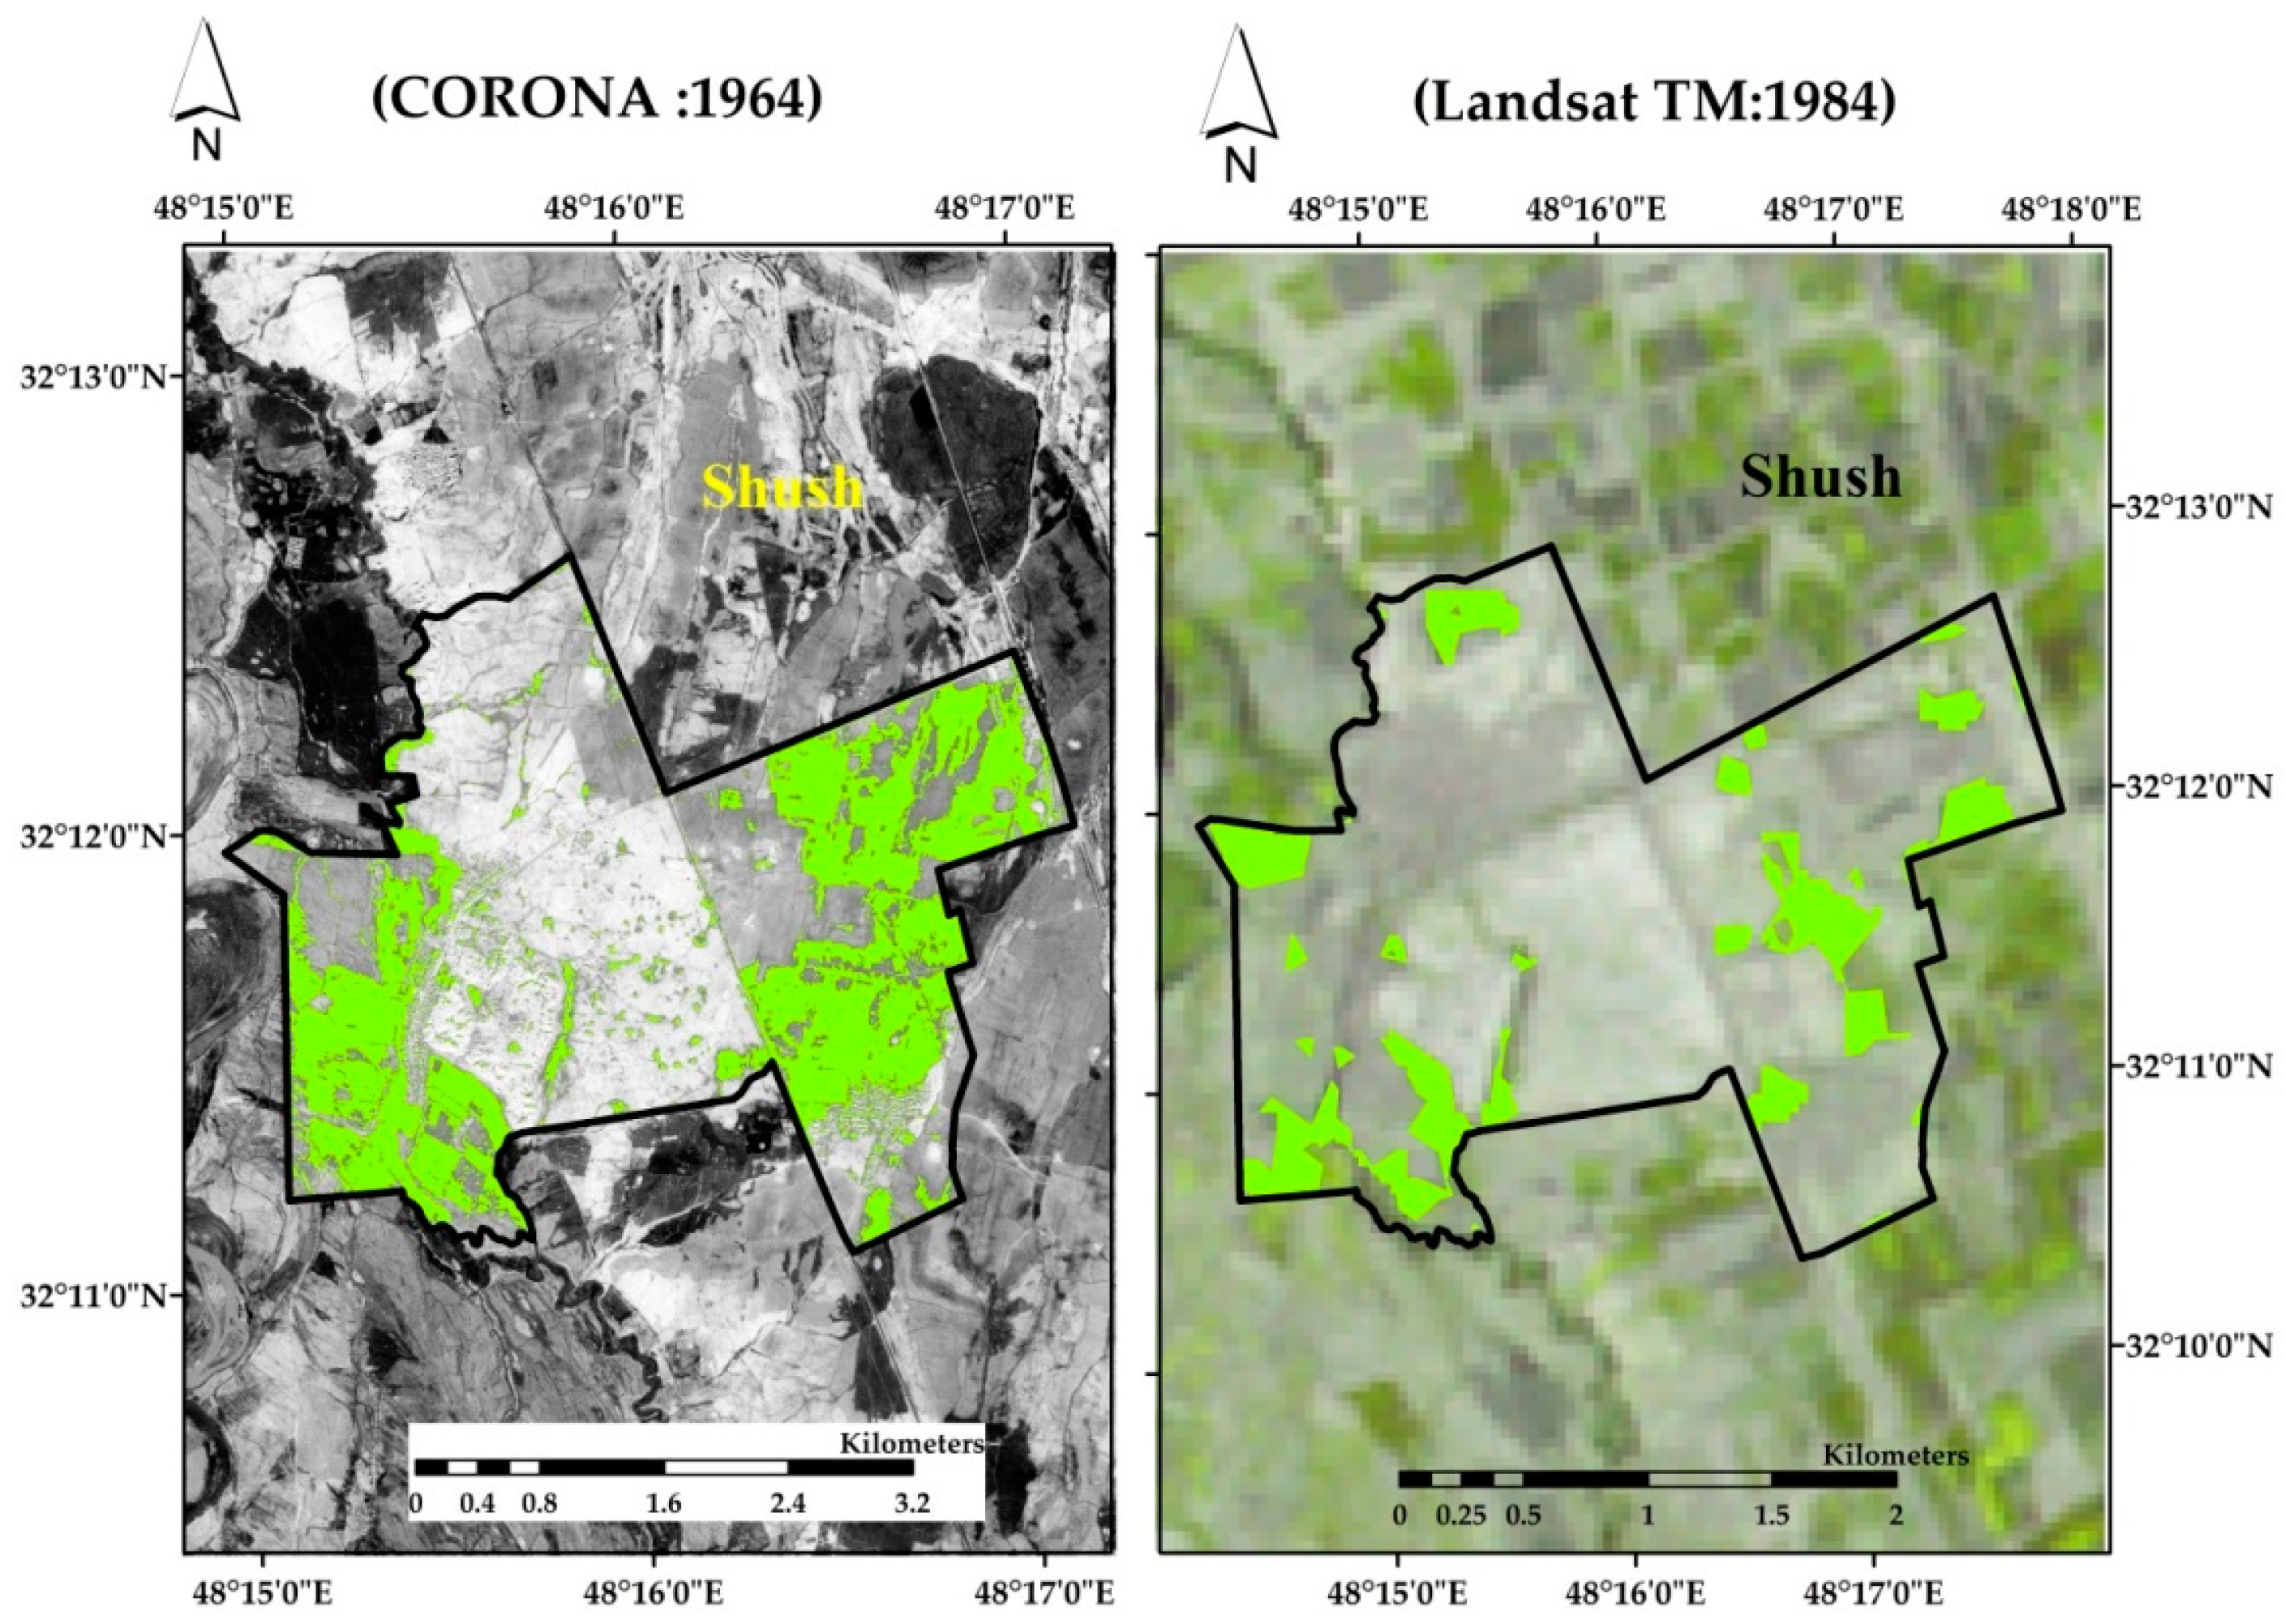
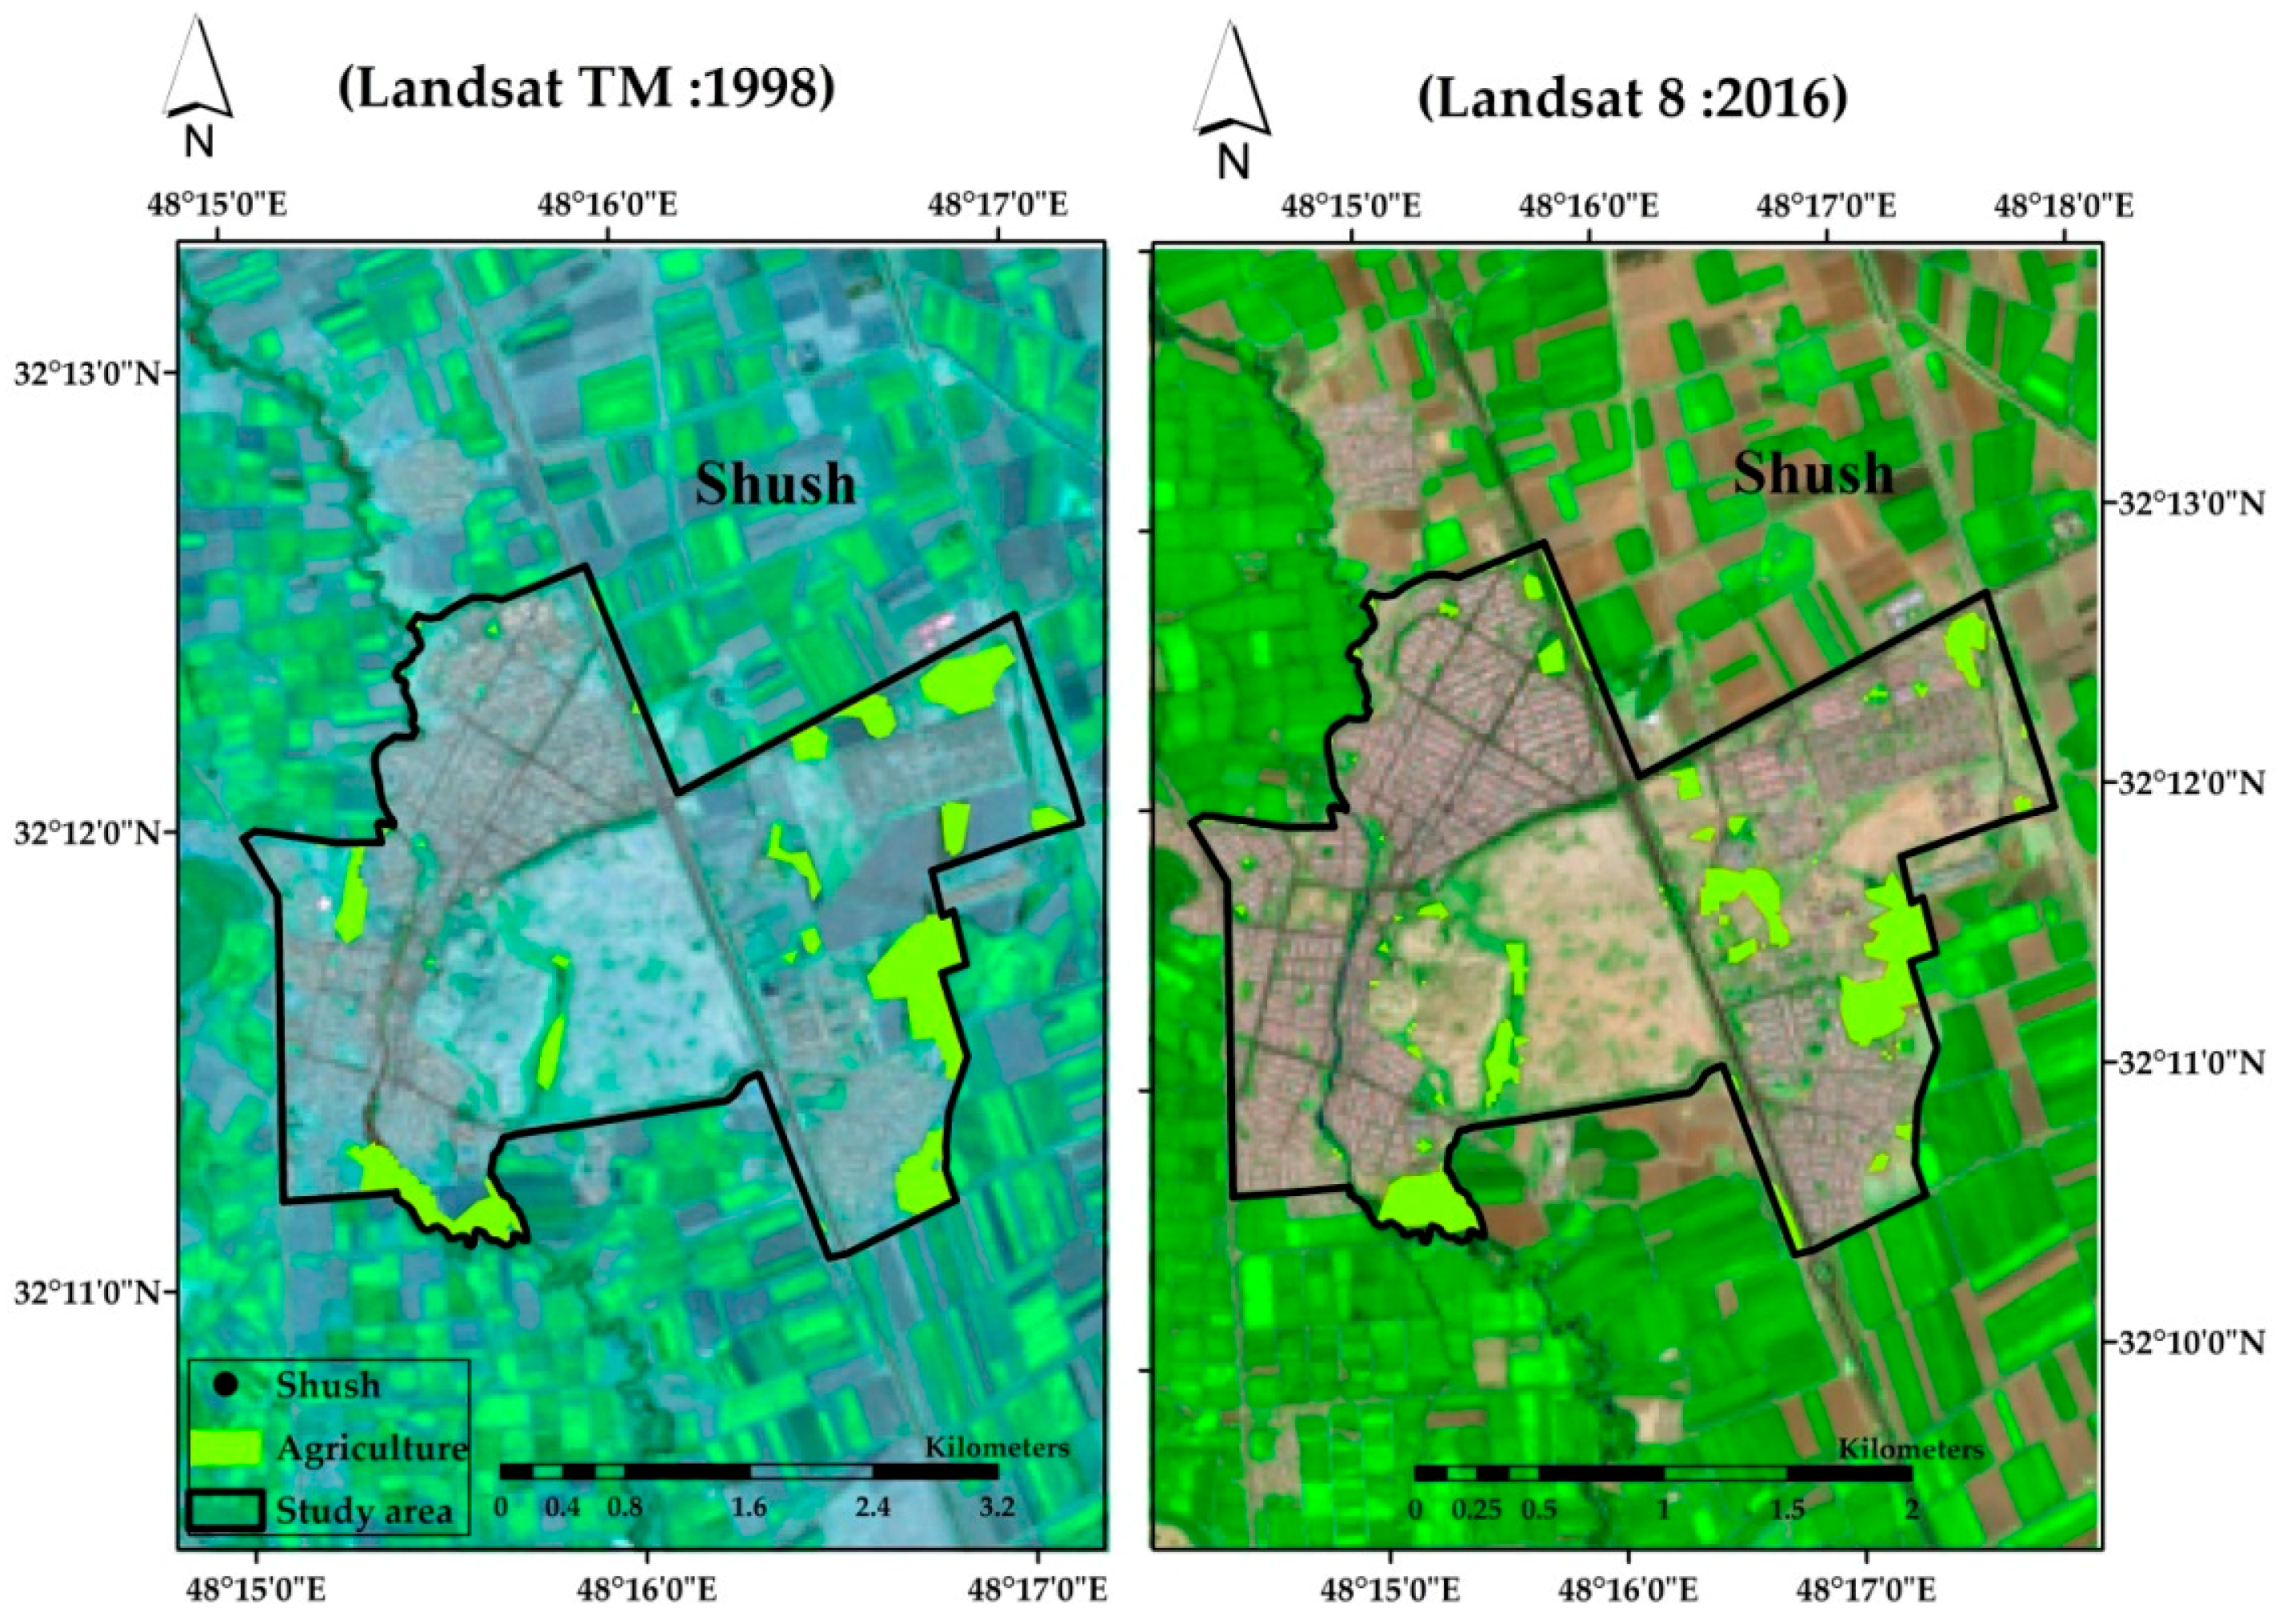
In the supervised classification technique, the maximum likelihood is a widely used algorithm to classify the images based on the training sets (signatures) provided by the user on the previous field knowledge. The classification finally gives the diverse categorizations (classes) which in our case are: urban (Figure 9 and Figure 10) and agricultural (Figure 11 and Figure 12). The temporal changes are obtained by comparing the categorization obtained for each year (1964, 1984, 1998, and 2016).

Post Classification

The accuracy of the classification process has been carried out using the most popular metric based on Kappa statistic (generally denoted as K) and overall accuracy. Kappa statistic is defined as [52]:
K = o b s e r v e d   a c c u r a c y c h a n c e   a g r e e m e n t 1 c h a n c e   a g r e e m e n t
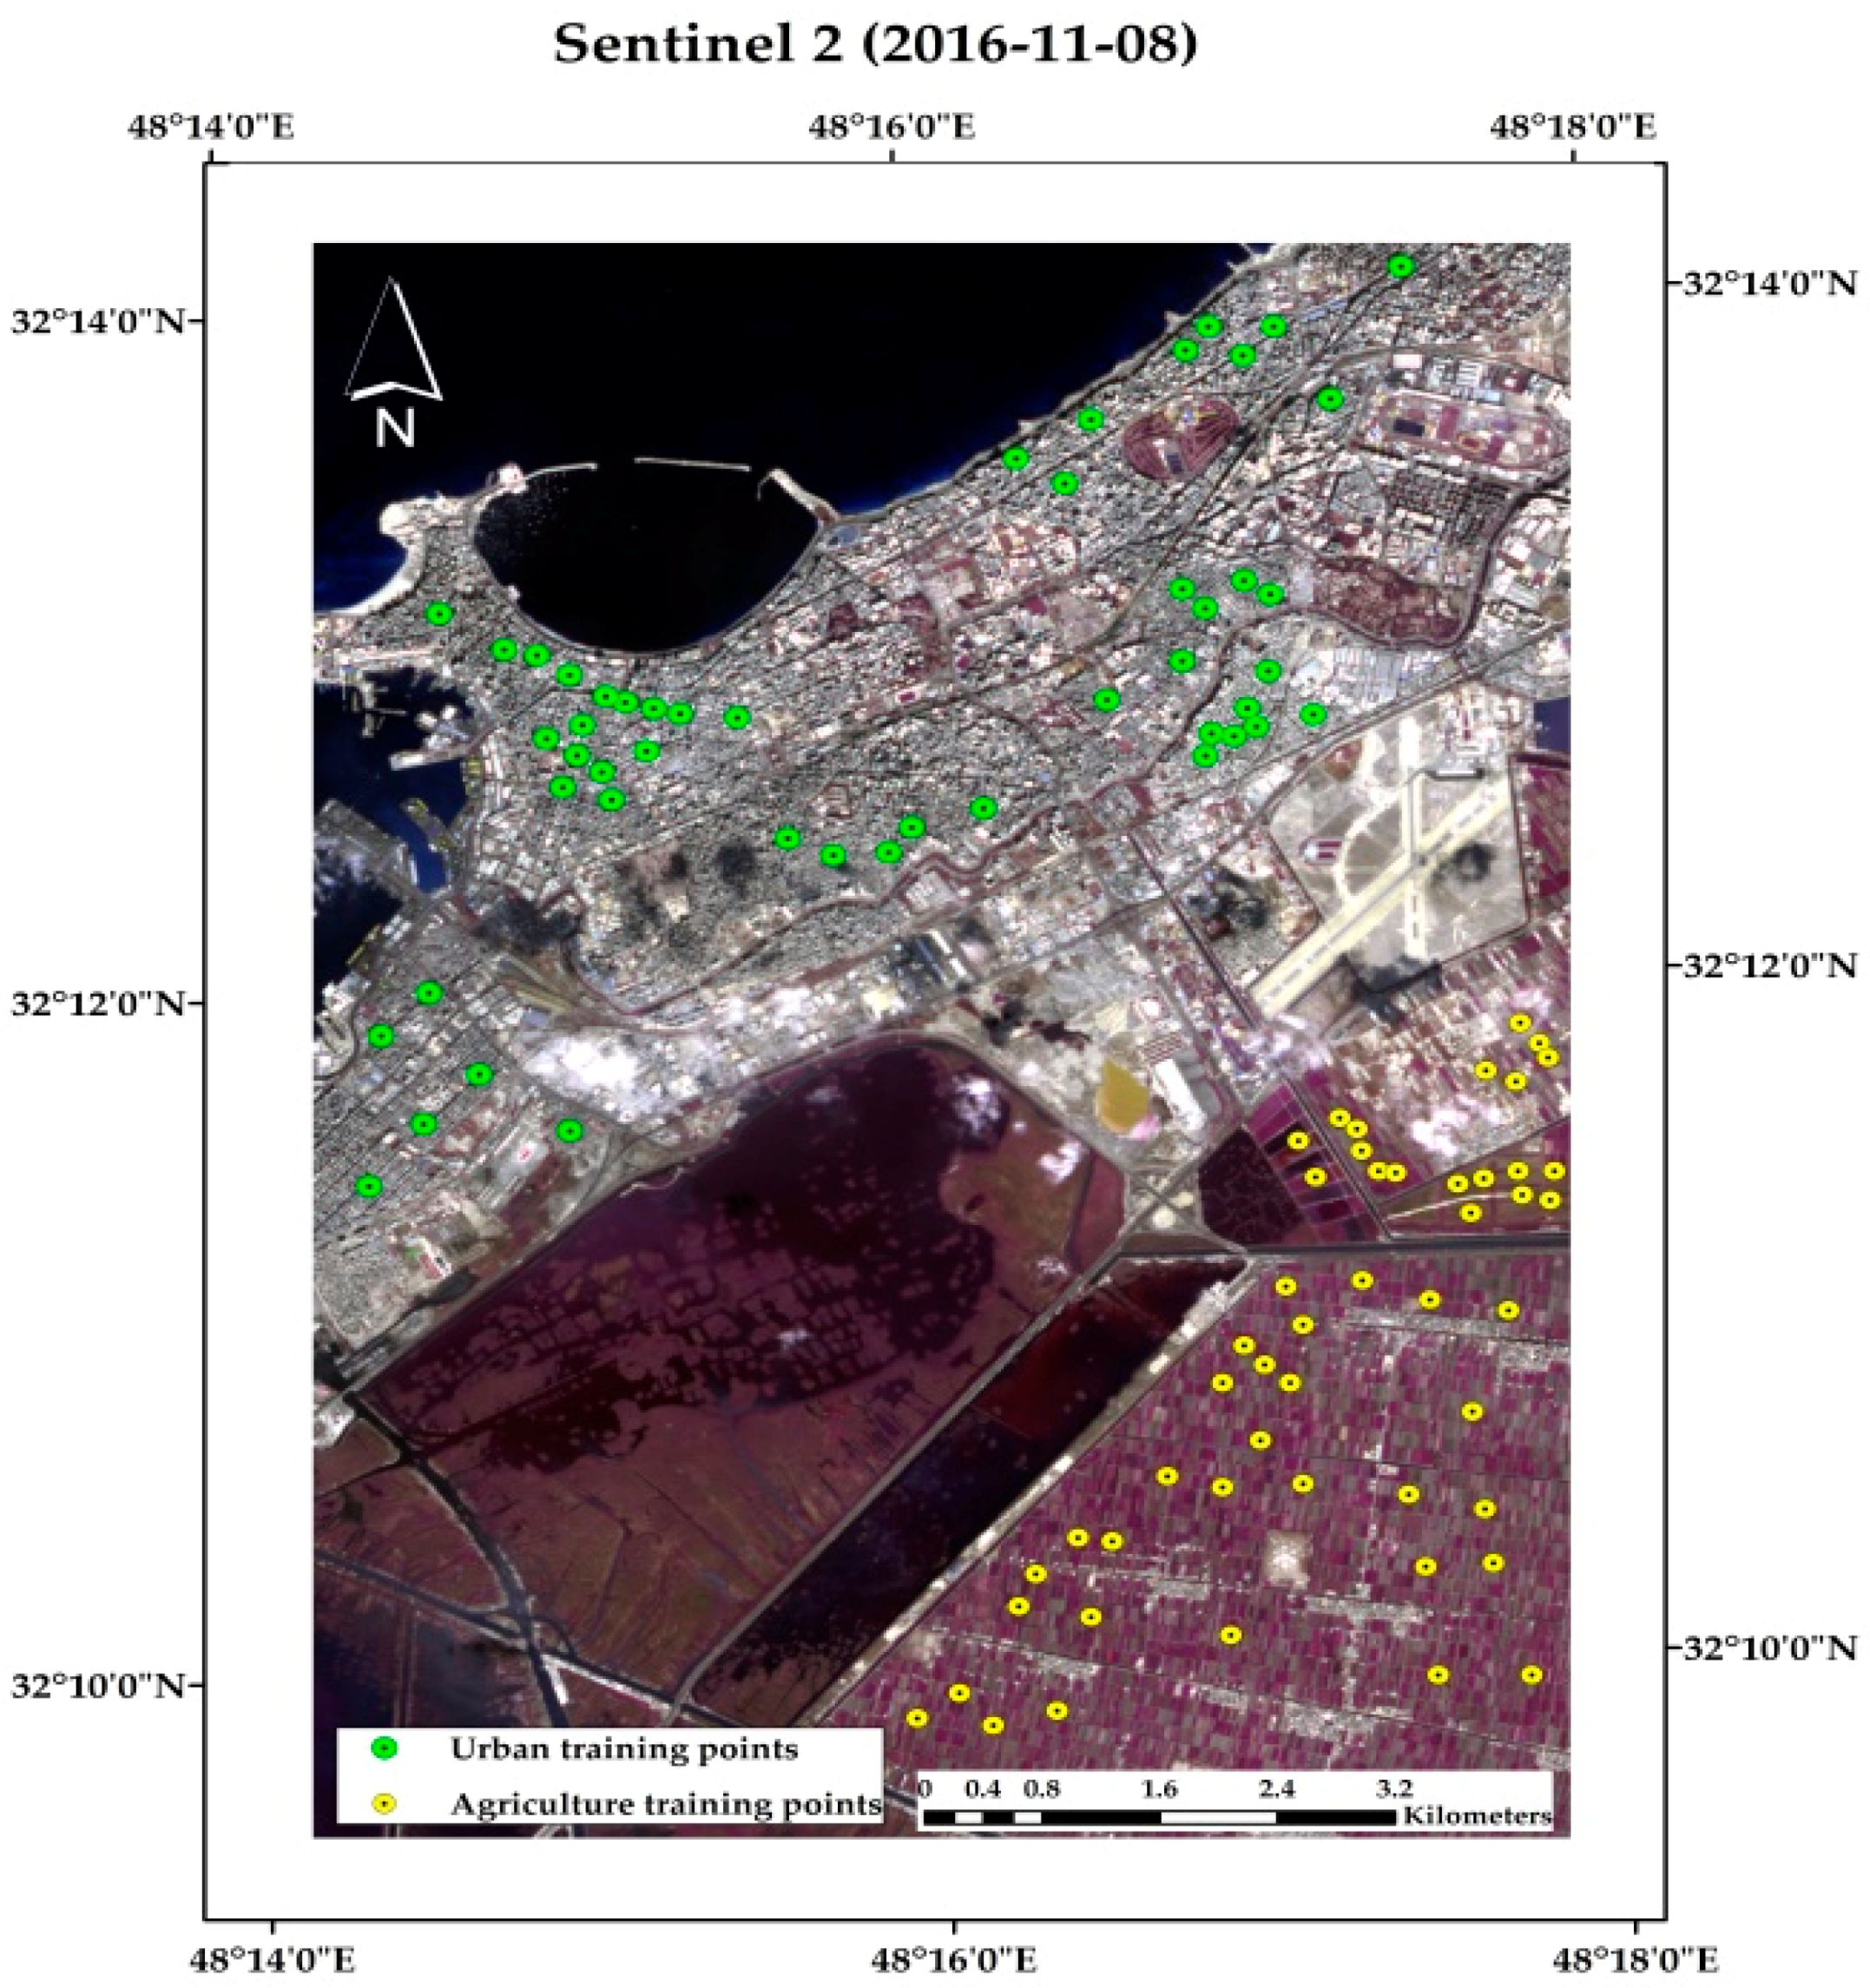
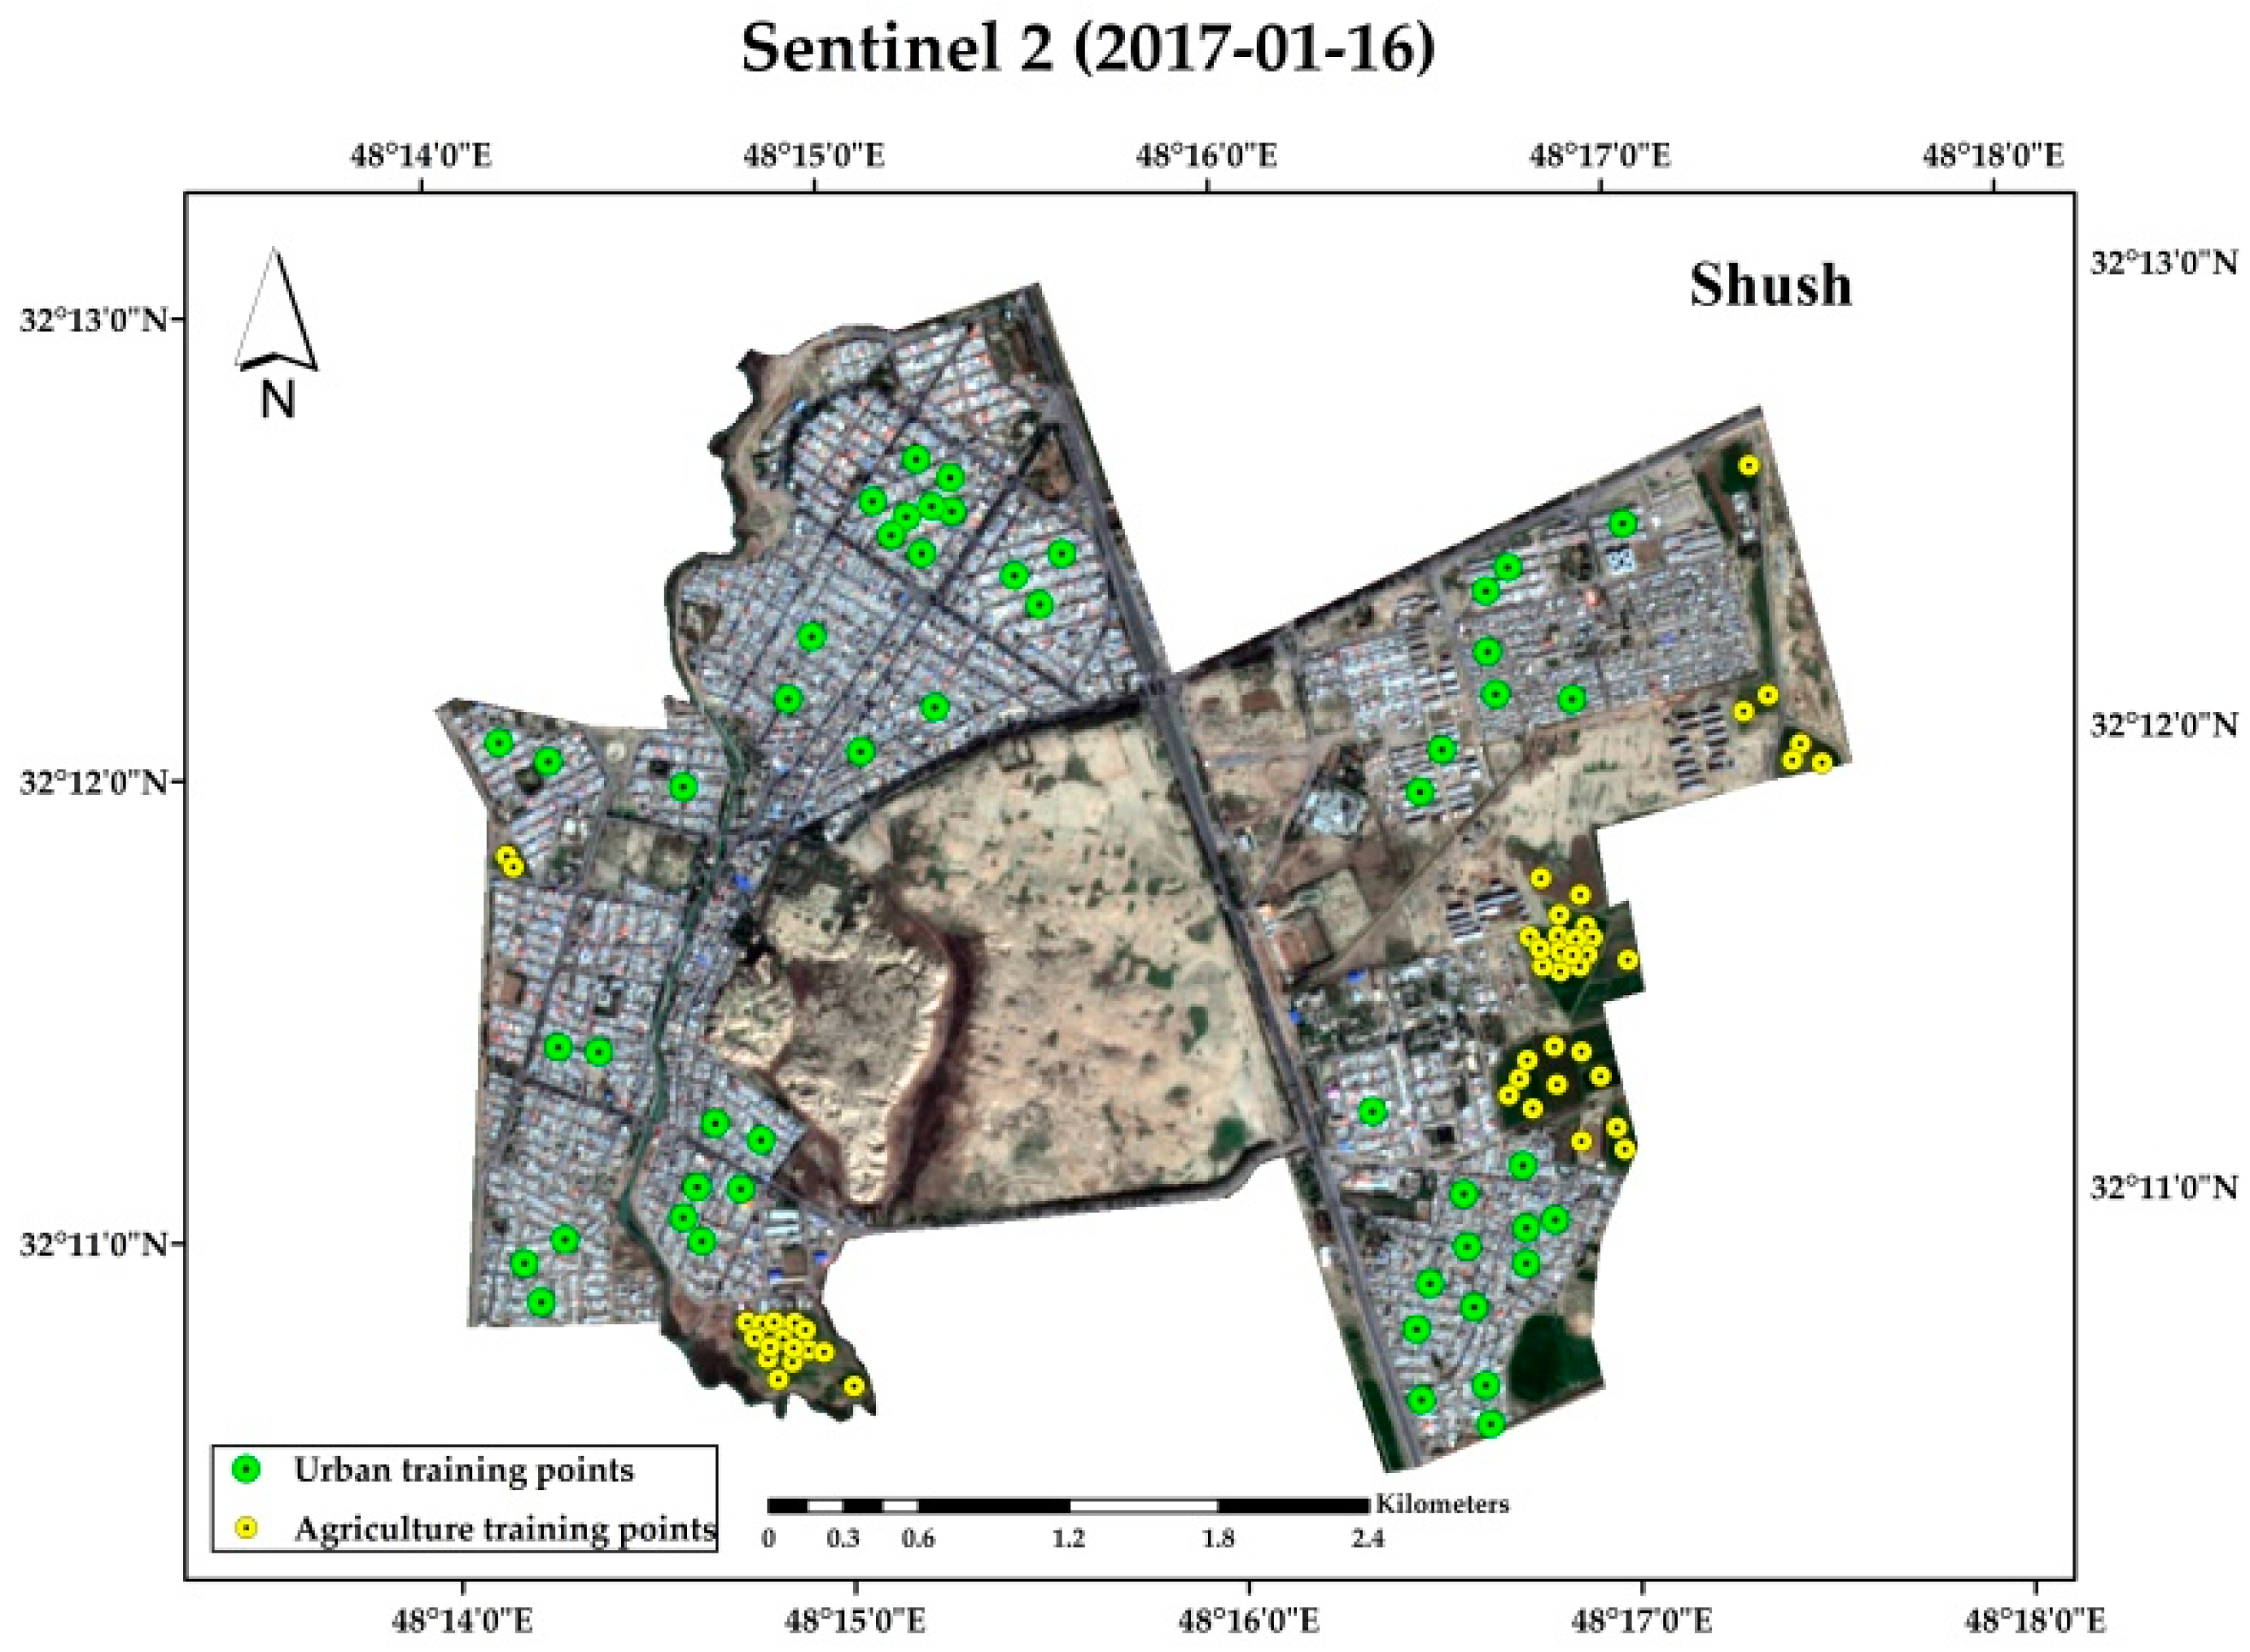
Overall accuracy is computed as the sum of the number of observations correctly classified (class1, as class 1, class 2 as class 2, etc.) divided by the total number of observations. The classification accuracy was estimated for the ROIs (Regions of Interest) (100 points; 50 points related to urban area and 50 points related to agricultural area) in each period and calculated by using both of Kappa coefficient and overall accuracy (Table 2).
Results showed that Kappa coefficient for the study area of Kom el Shoqafa in the year 1984 was 0.89 with 92.79% overall accuracy, but for the study area of Shush in the same year was 0.67 with 80.00% overall accuracy. For the next period 1998, Kappa coefficient decreased to 0.95 with 97.14% overall accuracy in Kom el Shoqafa, but increased to 0.95 with 96.83% overall accuracy in Shush. Finally, in 2016, Kappa coefficient increased in average and became 0.92 with 95.00% overall accuracy in Kom el Shoqafa, while Kappa coefficient increased again on average in Shush to be 0.92 with 98.86% overall accuracy (Figure 13 and Figure 14).

4. Results

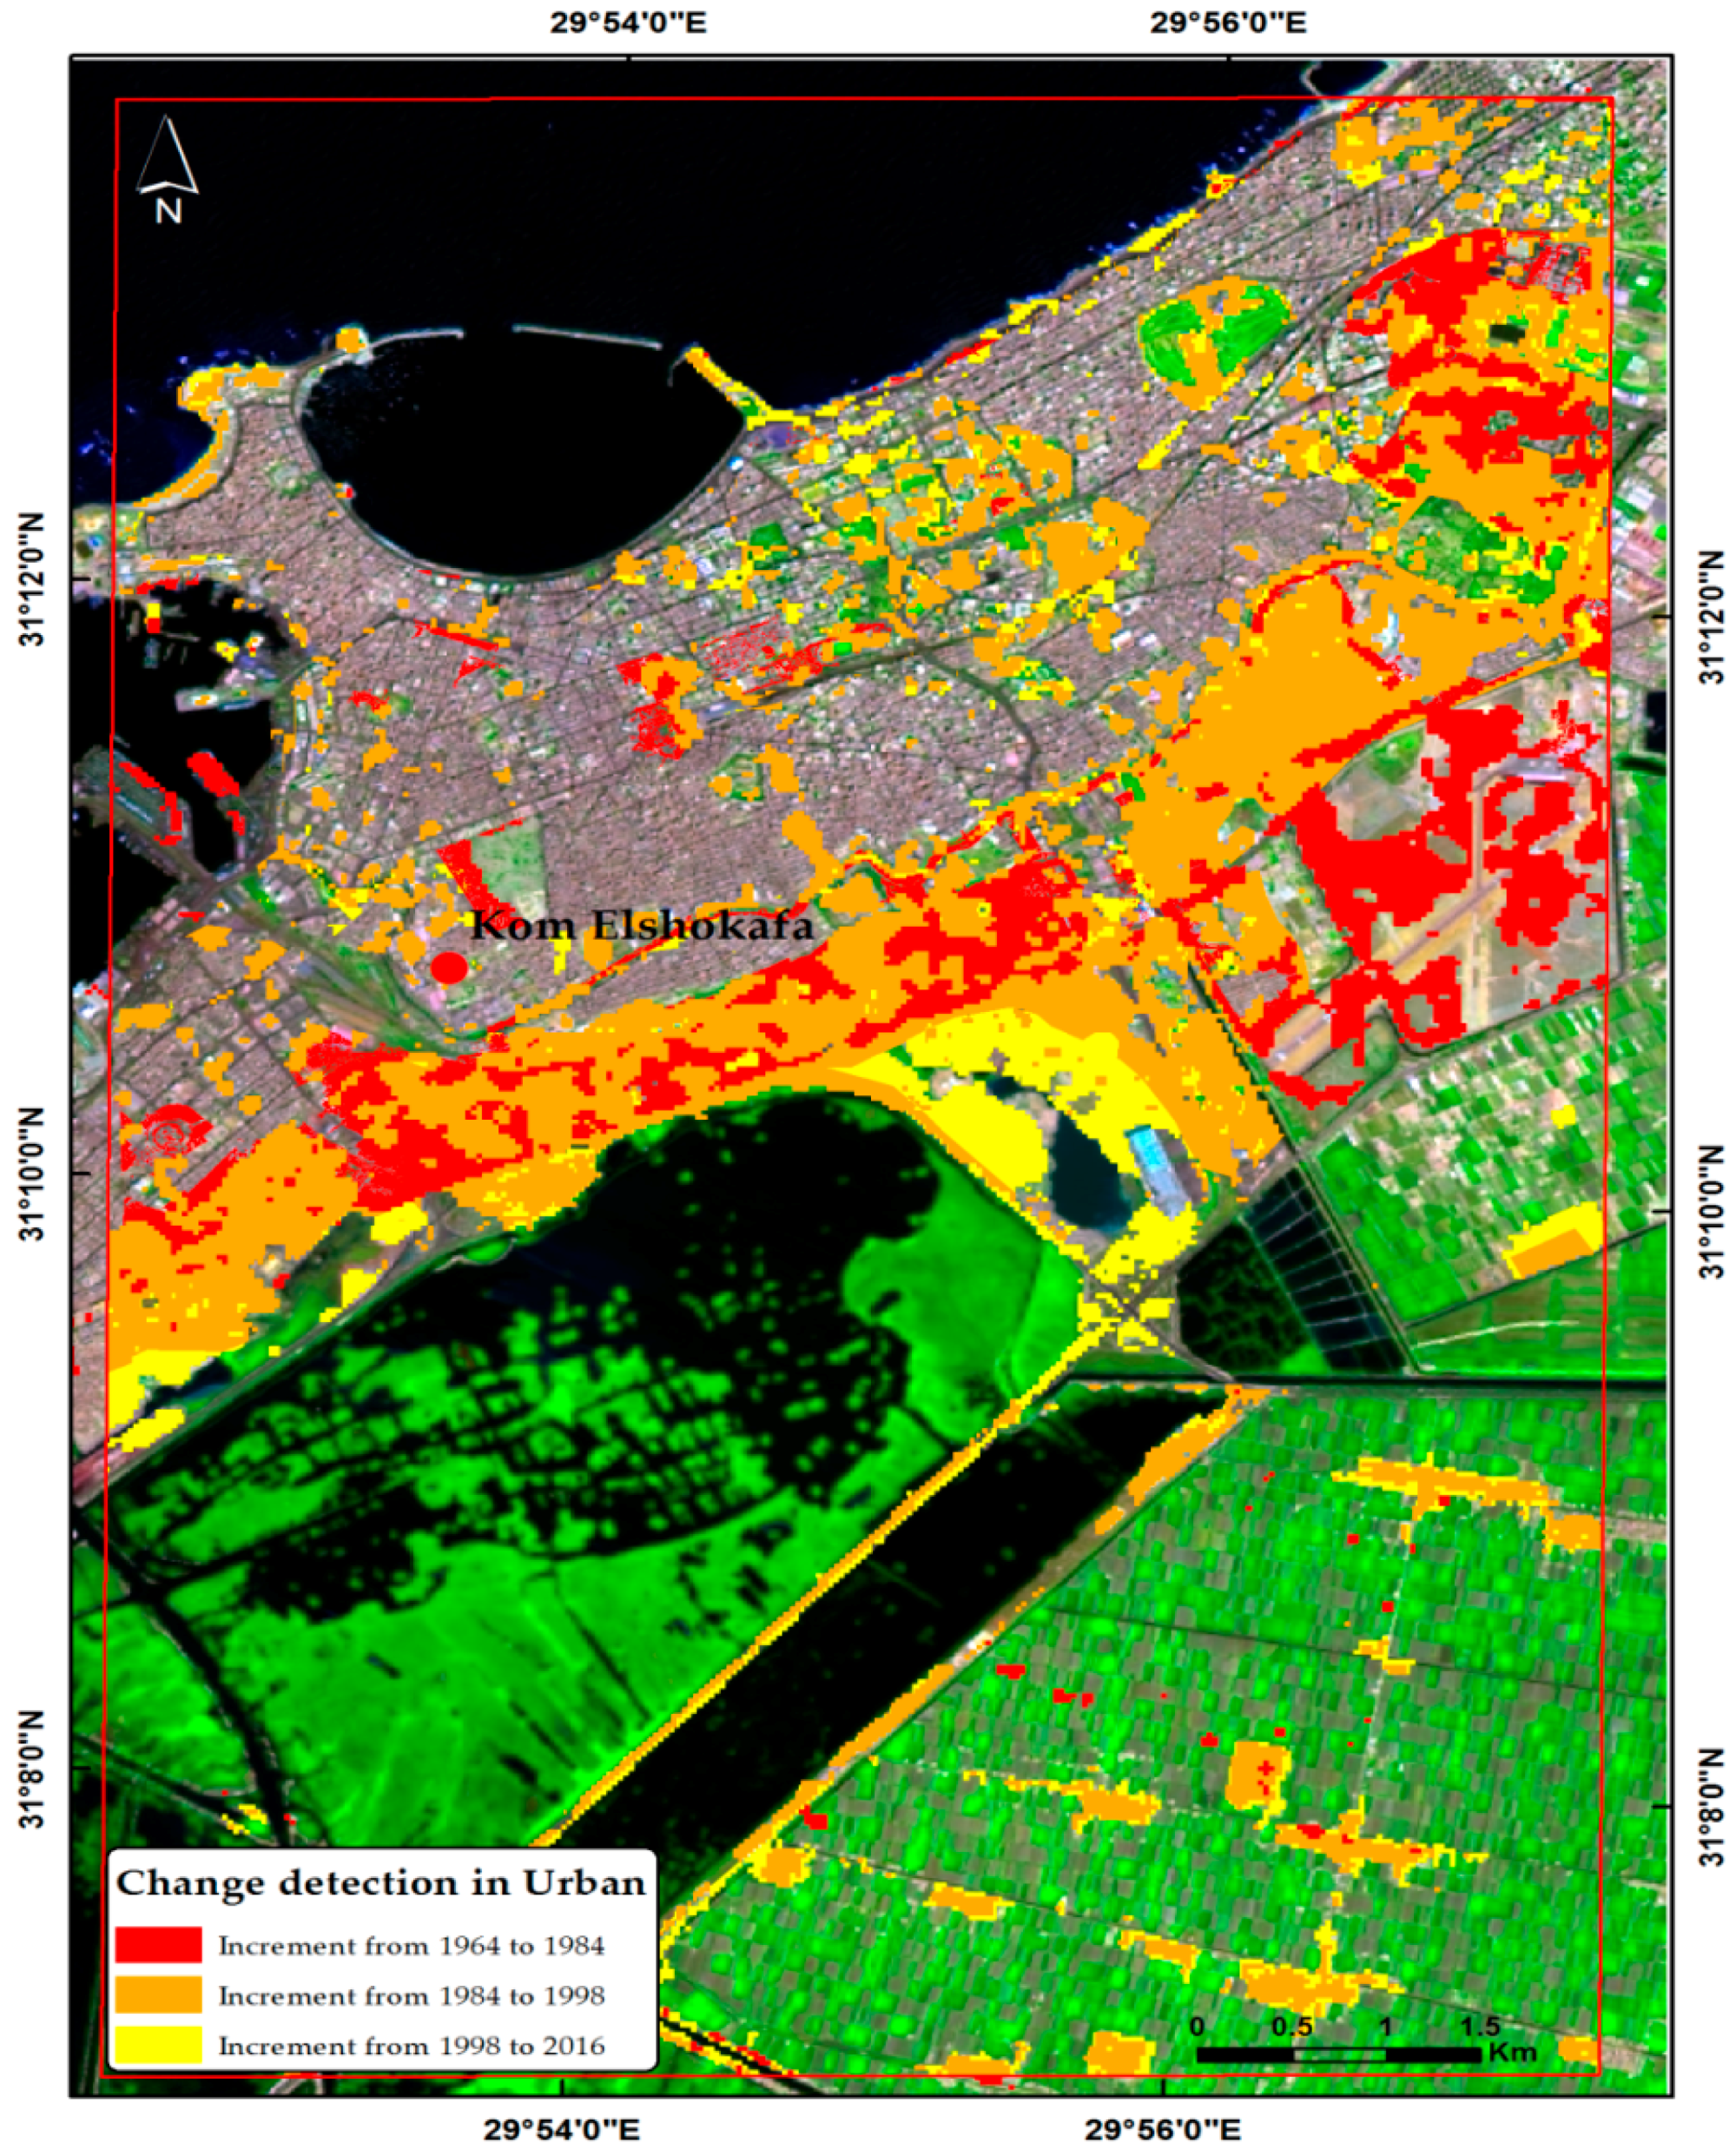
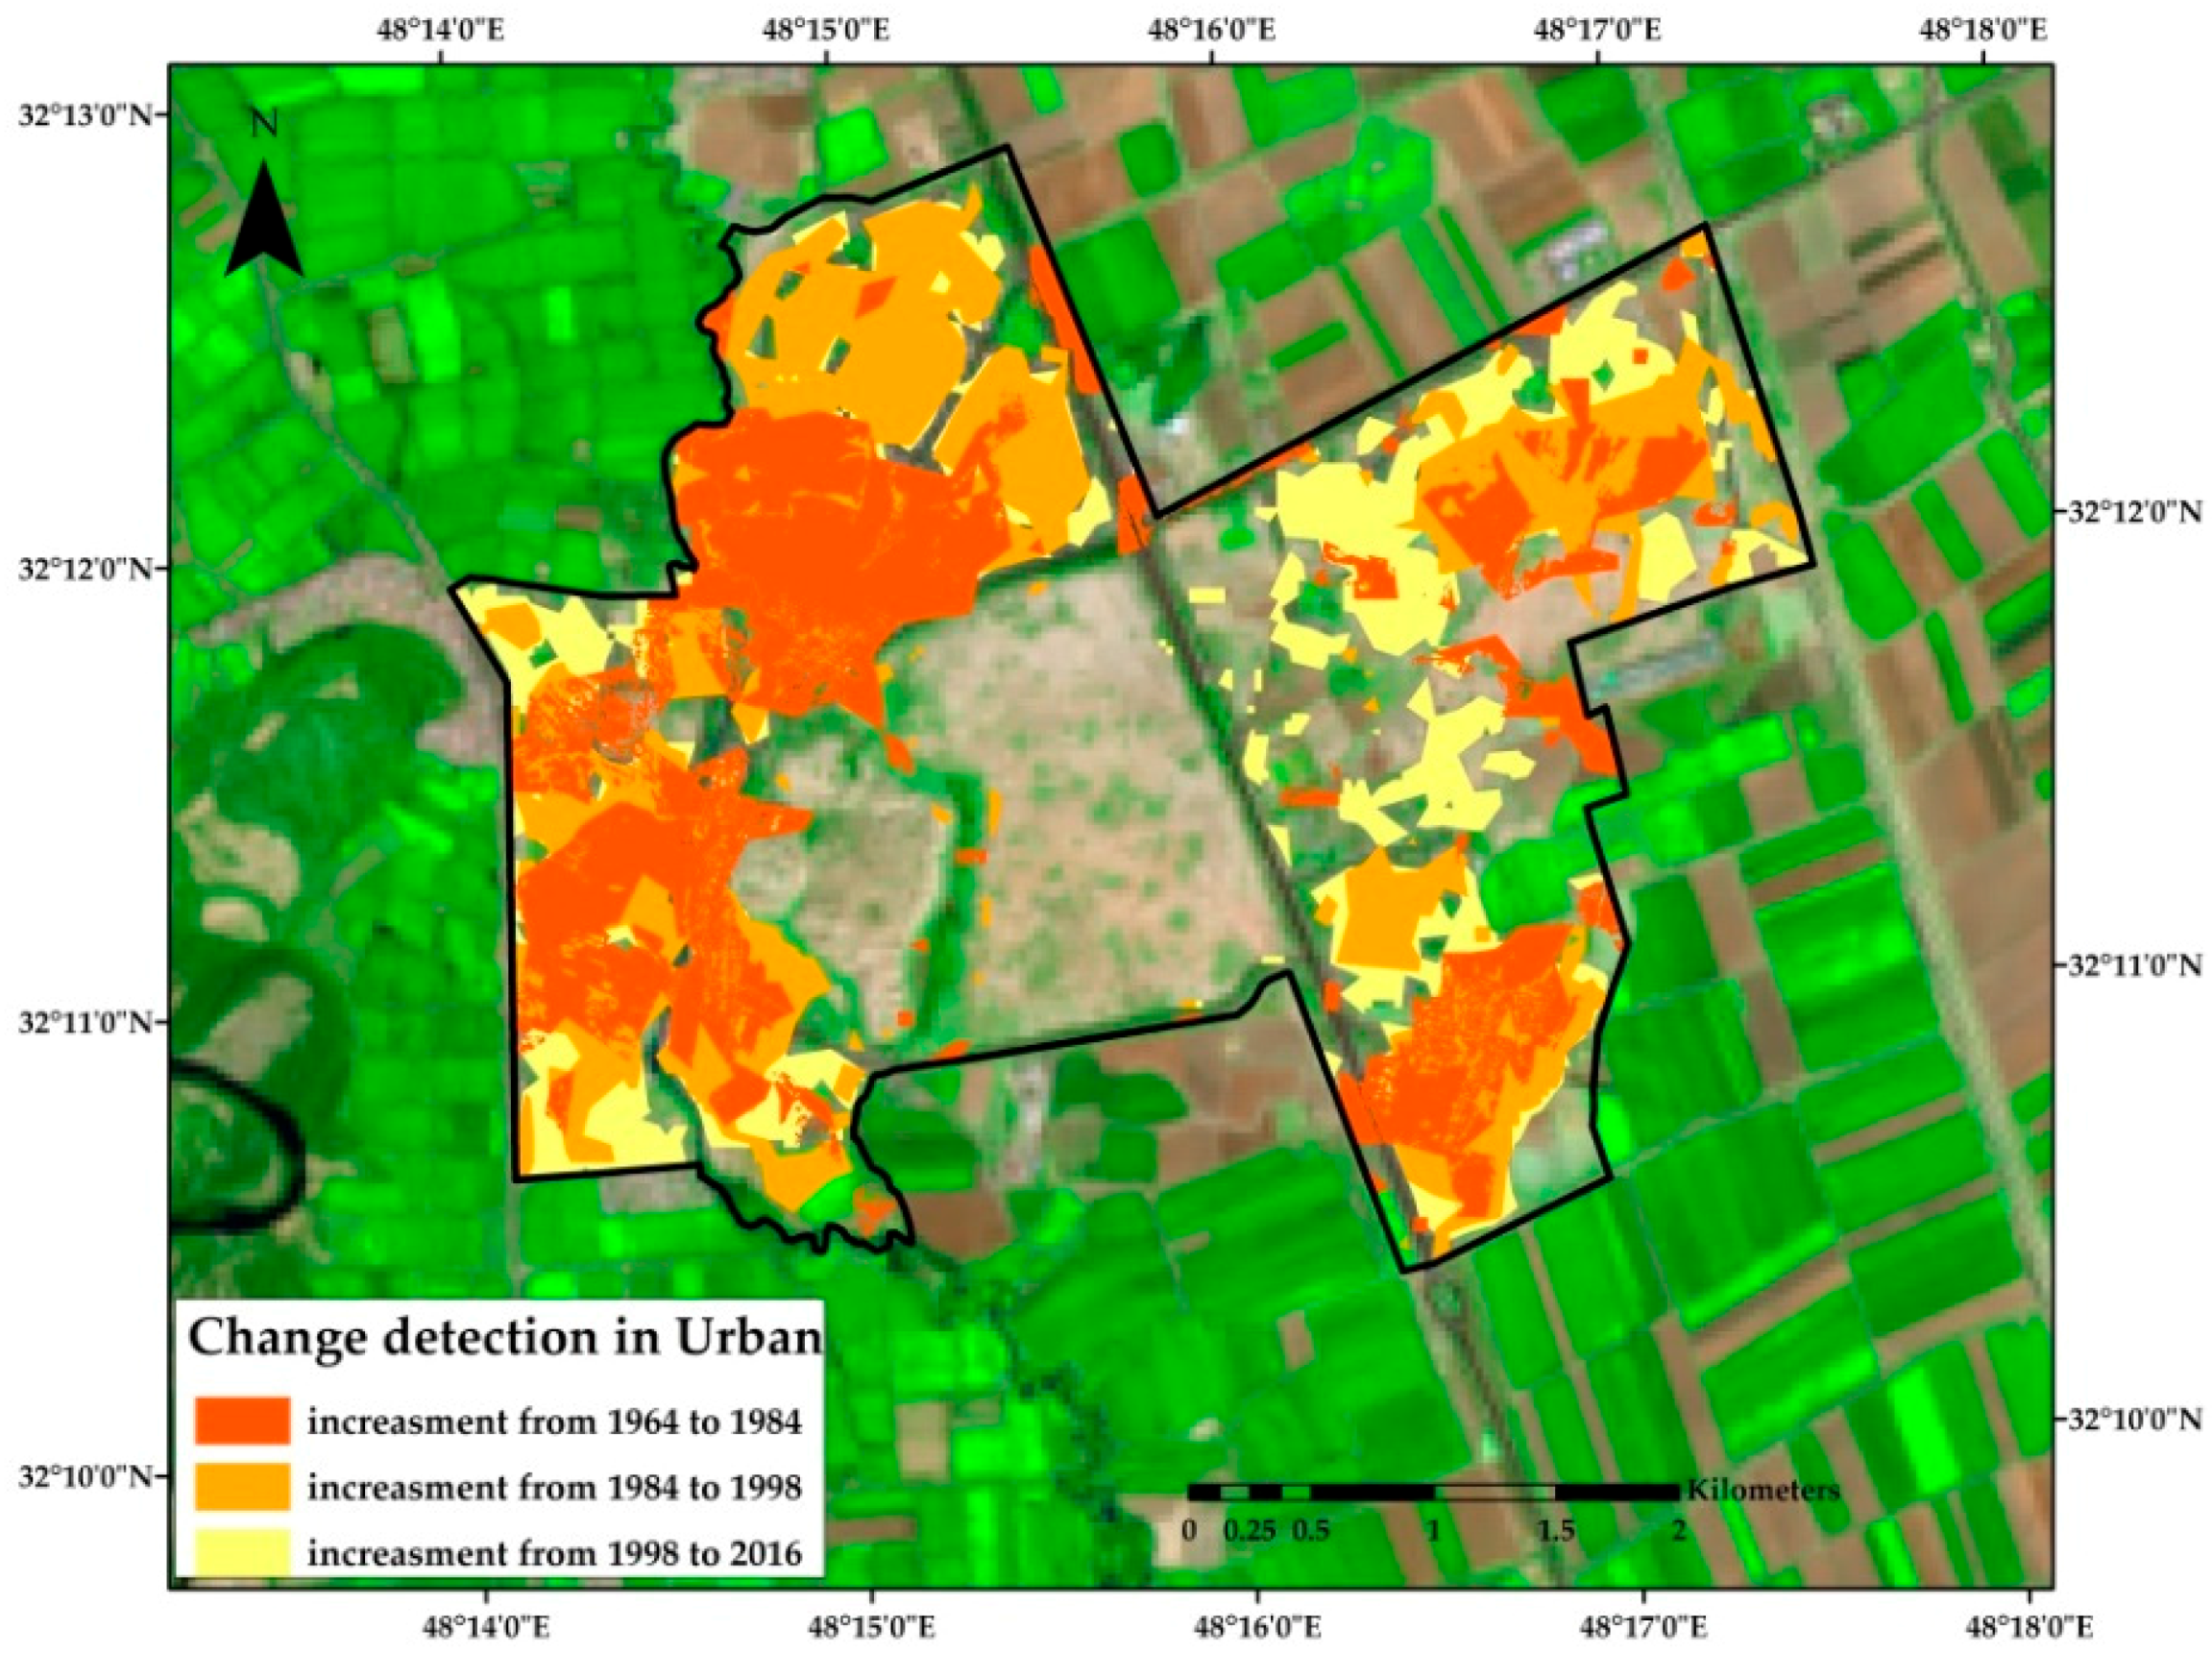
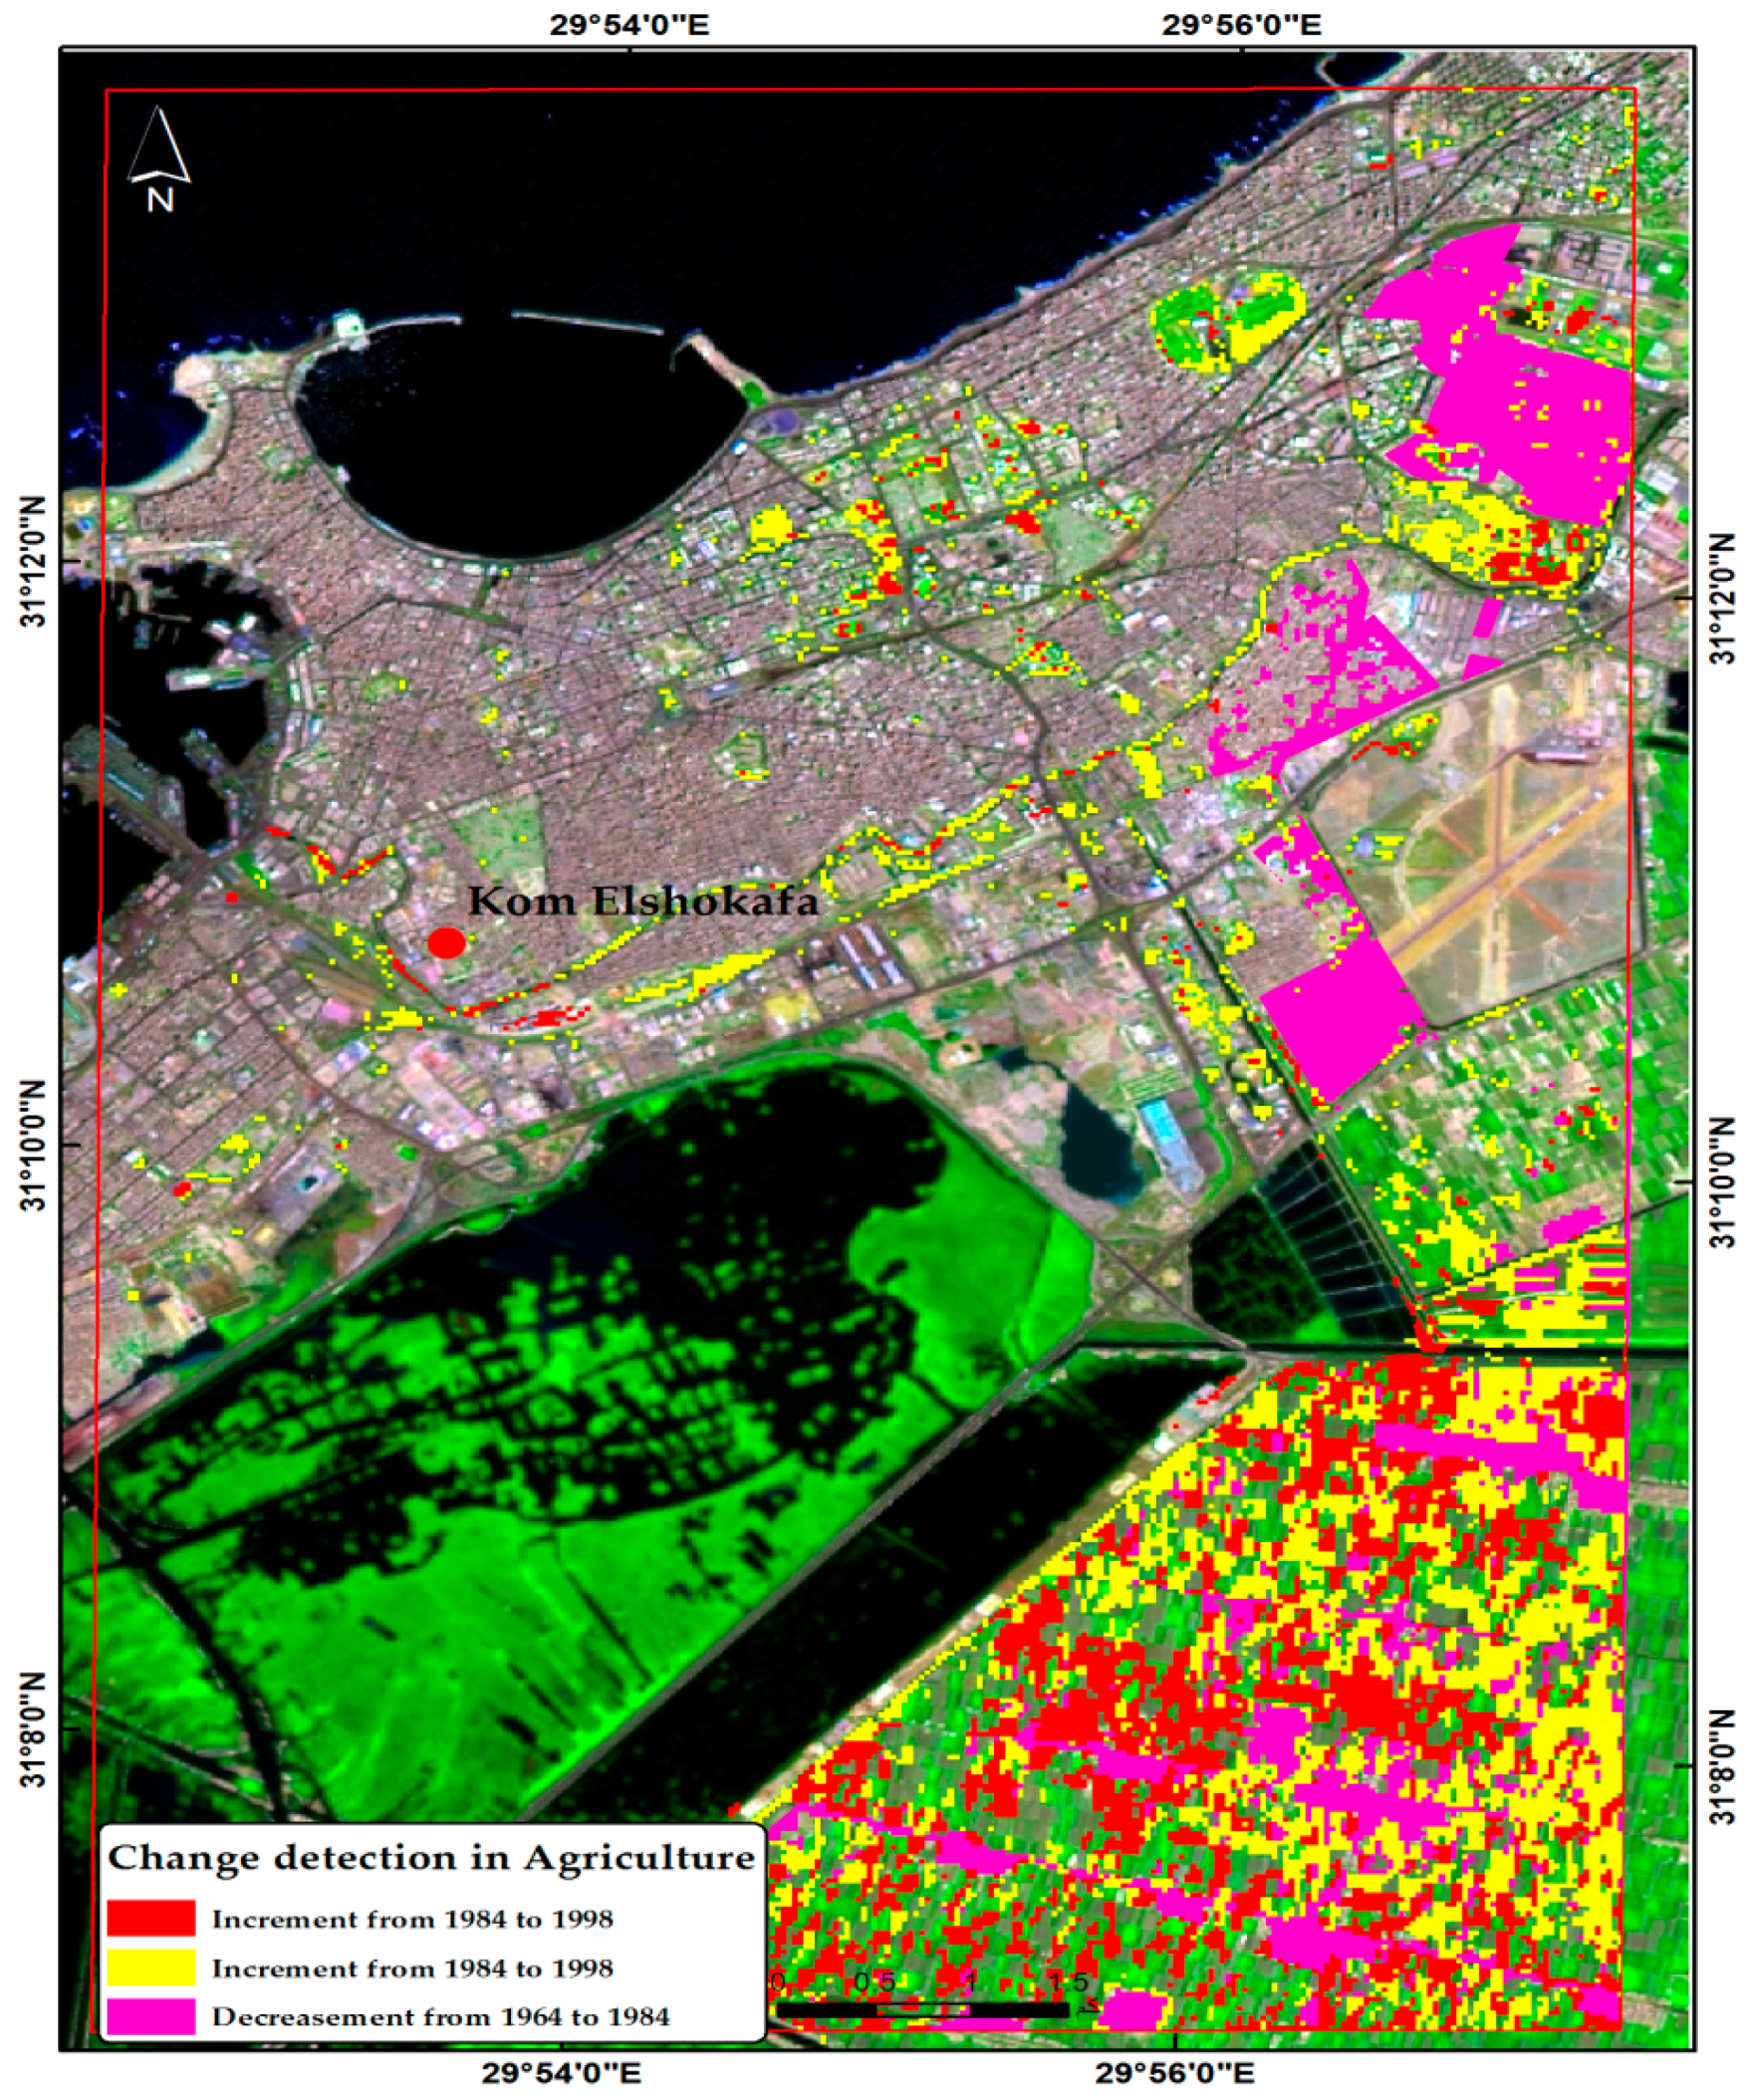
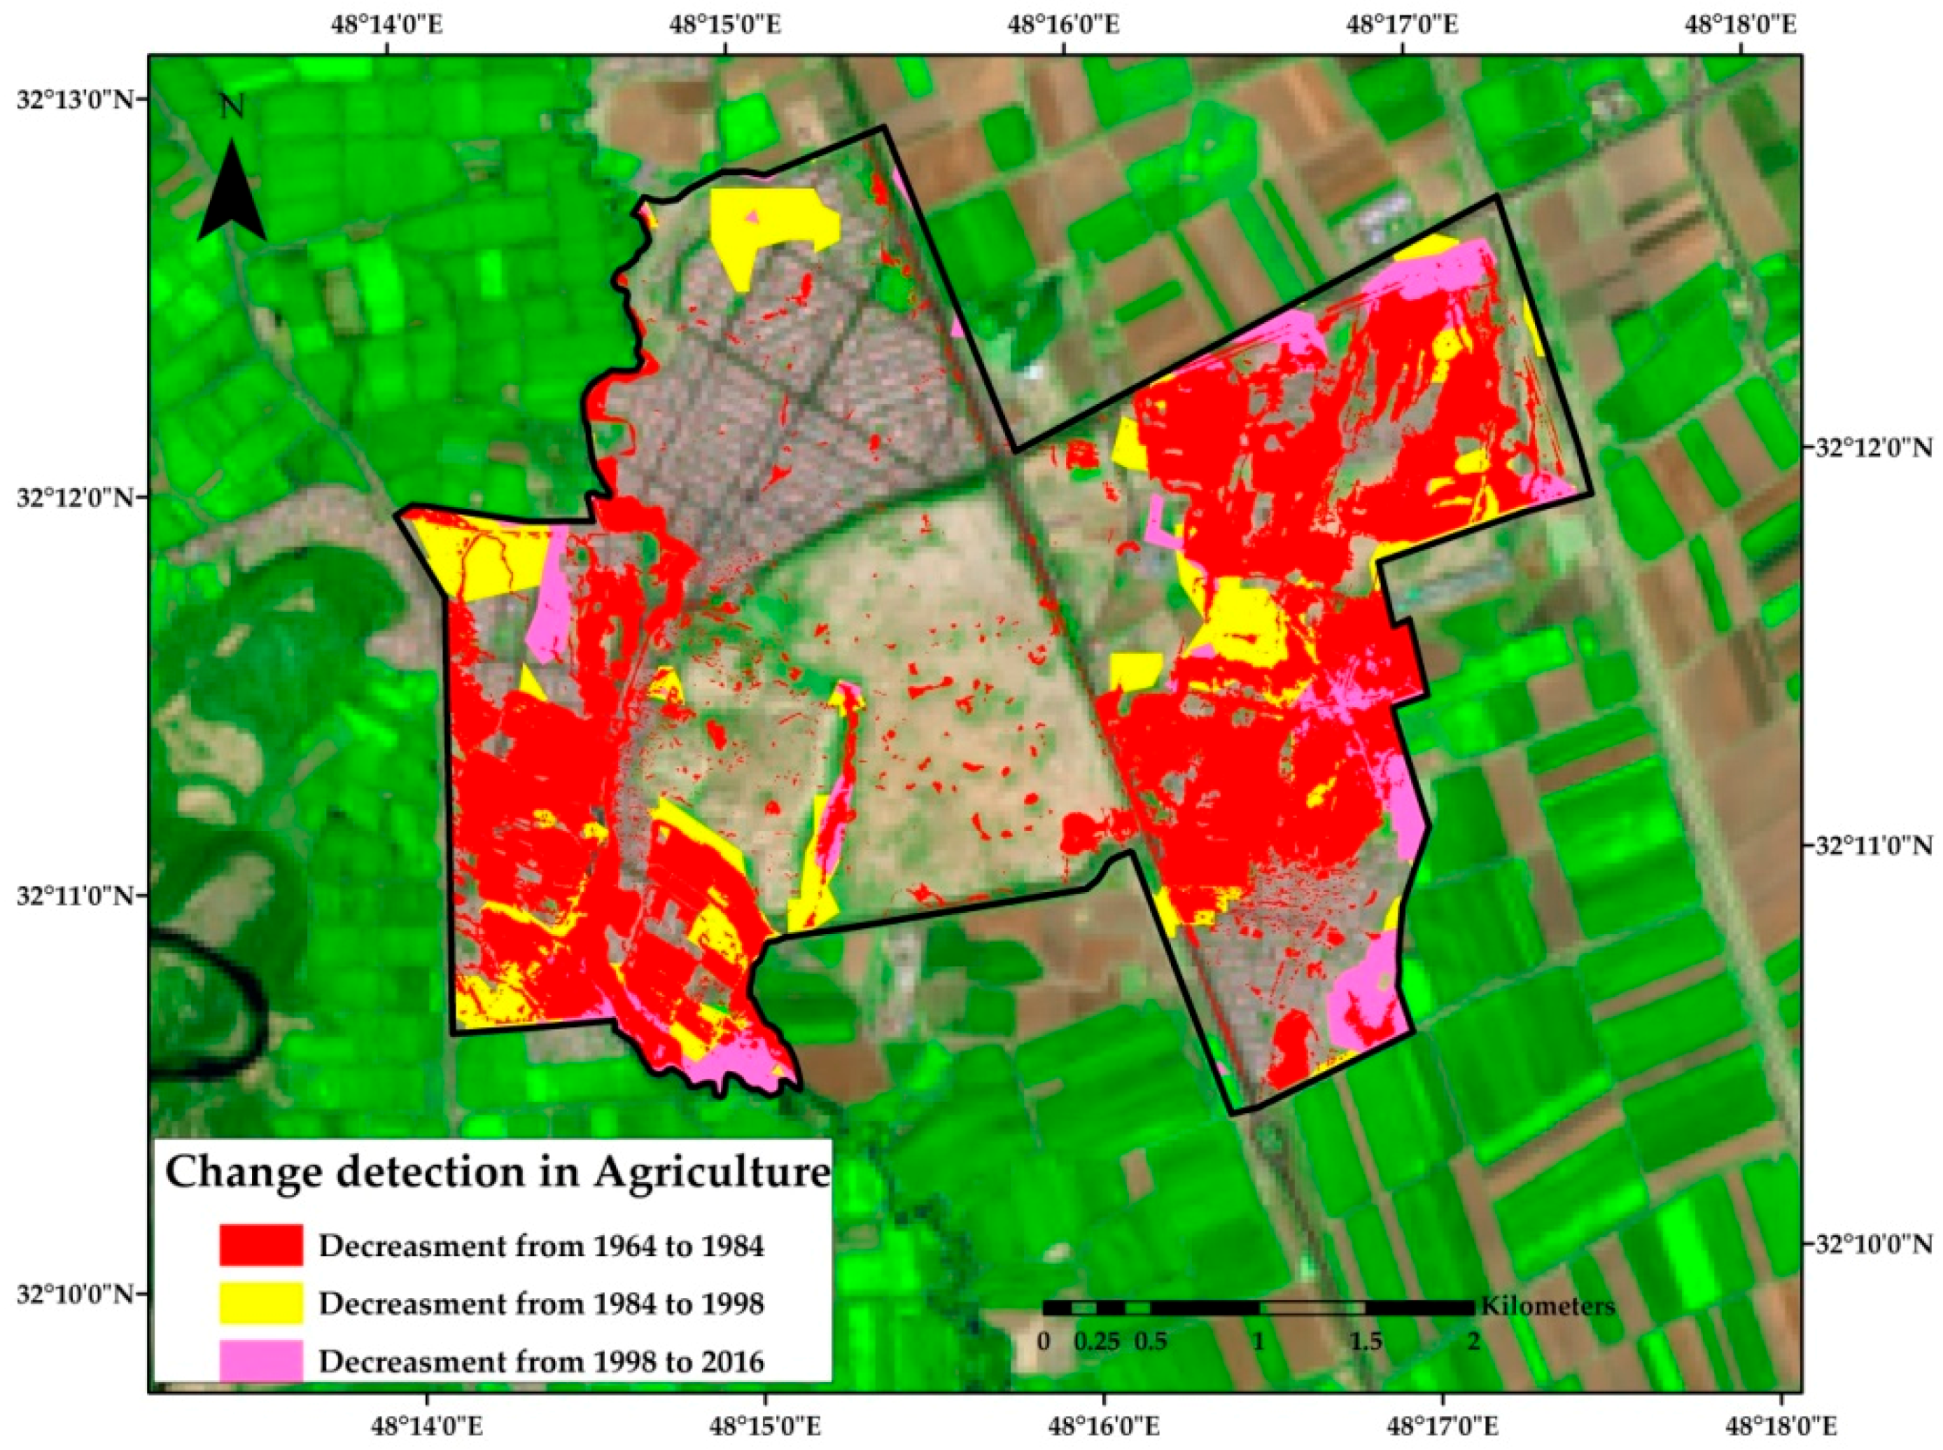
The analysis of Corona imagery in Kom el Shoqafa revealed that the urban area increased by about 2315 km2 from 1964 to 1984 about 6777 km2 from 1984 to 1998, and finally about 3634 km2 from 1998 to 2016. For the urban areas in Shush there was an increase of about 1433 km2 from 1964 to 1984, about 945 km2 from 1984 to 1998 and about 1012 km2 from 1998 to 2016. On the other hand, we can see that the agricultural lands in Kom el Shoqafa decreased by about 6178 km2 from 1964 to 1984, but decreased by about 108 km2 from 1984 to 1998, and the agriculture lands increased by about 2128 km2 from 1998 to 2016. For Shush, the agricultural lands decreased by about 4528 km2 from 1964 to 1984, and decreased again by about 141 km2 from 1984 to 1998. Then, the agriculture land decreased again by about 23 km2 from 1998 to 2016 (Table 3). We used a contingency table to compare land use maps between four time periods for each region to quantify the amount of land use change for each land use class [53]. It means that the urban areas sprawling in Shush and Kom el Shoqafa (Figure 15 and Figure 16) through the population increased have clearly effected the agricultural land’s change into urban use (Figure 17 and Figure 18). For the urban area, the evaluation of the change detection presented generally increasing chronology in both of the study areas, but for the agriculture lands we can see that the changes were sometimes decreasing and sometimes increasing.
Classification algorithms help to understand the existing pattern in data and can be used to predict the land use class using suitable data mining techniques [54]. Corona and Landsat TM and L8 imagery were used to detect the changes in the urban and agriculture lands at Kom el Shoqafa (Egypt) and Shush (Iran). Using integration between Envi and ArcGIS software, the changes were detected chronologically from 1964 to 2016. Final change detection analysis quantified and described the differences between the images of the same scene at different times. The classified images of the four dates can be used to calculate the area of different land covers and observe the changes that are taking place in the span of data.

5. Recommendation

Current technologies of space data should be incorporated to optimize the use of traditional technologies adding comfort and environmental quality. New trends in the culture heritage management can be identified on the basis of the concept of sustainable tourism. Due to the environmental problems around the both of the study areas, some of the recommendations can be carried out.
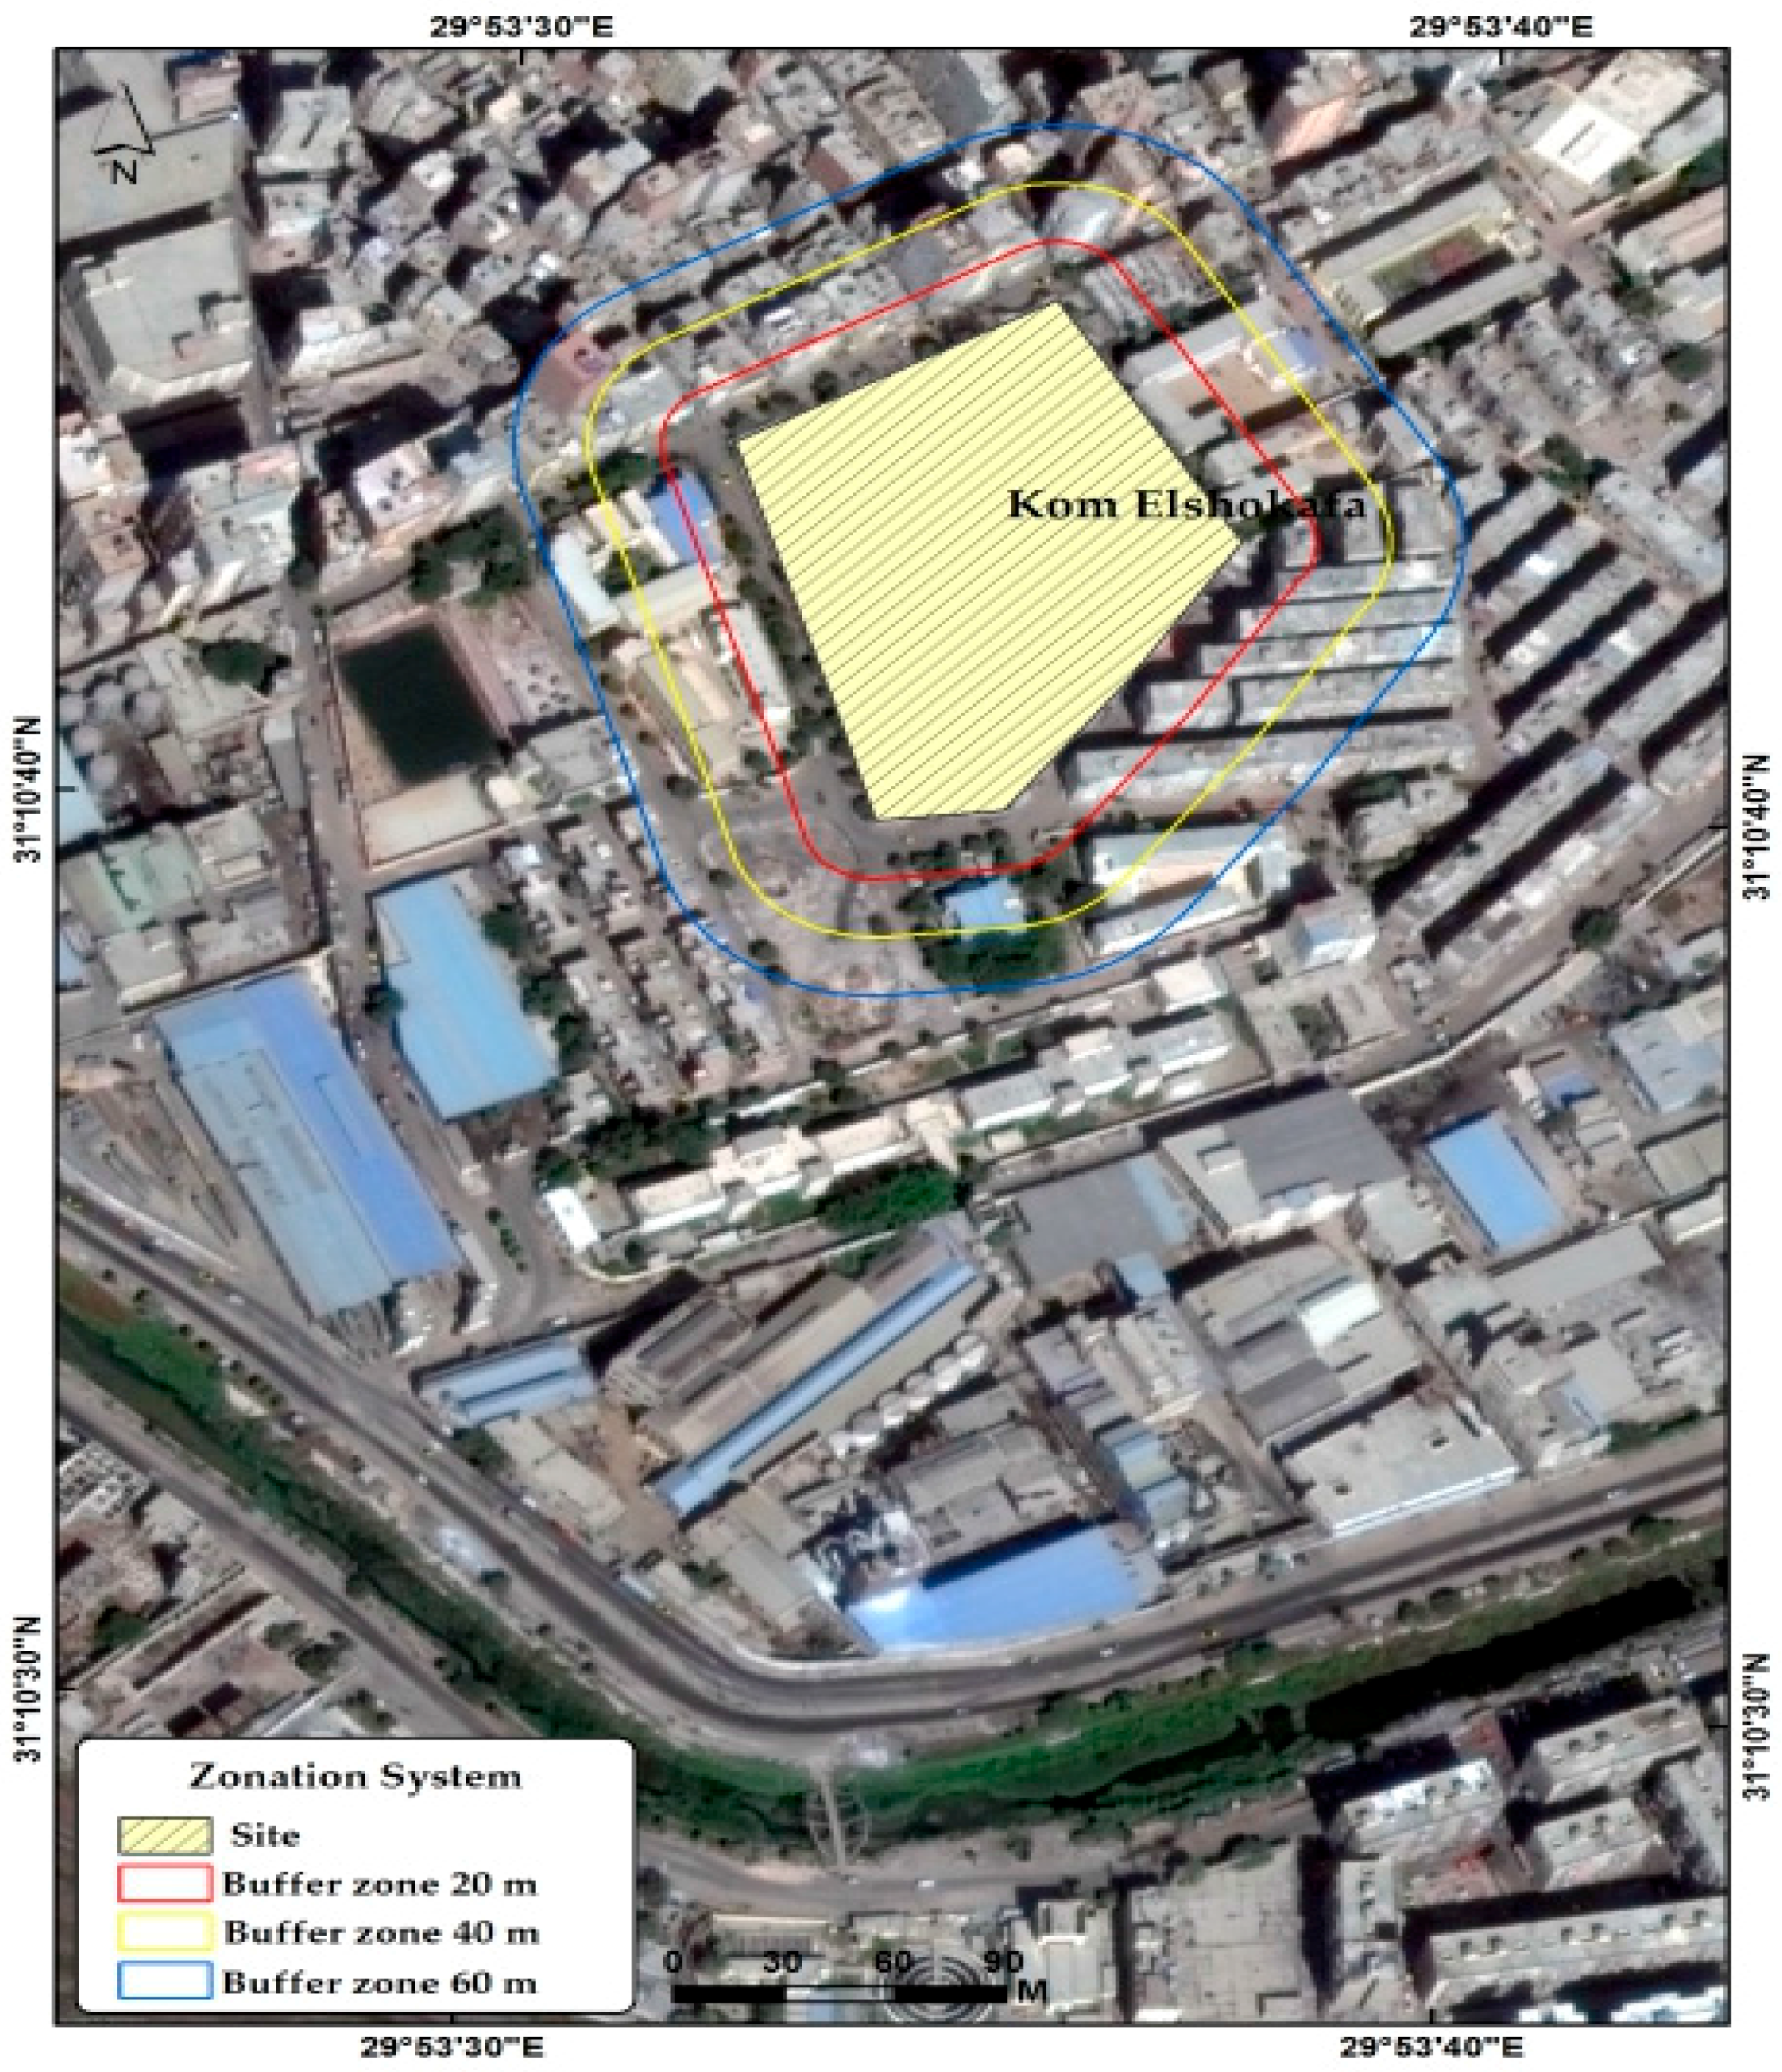
According to [55] it is believed that the right approach to handle the situation is the application of the concept of biosphere reserves as proposed and adopted by the UNESCO Man and Biosphere Program (MAB). This objective can be met by a Zonation System in Kom el shoqafa and Shush that applies different management policies to different zones (50 m in shush, 20 m in Kom el shoqafa). These distances have been chosen as a result of the topographical and geological situation in both areas. The archaeological area is to be surrounded by three areas. The first area is between the archaeological site and core area (monitoring). The second area is between the core area and buffer zone (research station or experiment, and education and training—human settlements). The third area is between the buffer zone and transition zone (tourism and recreation) [55] (Figure 19 and Figure 20).
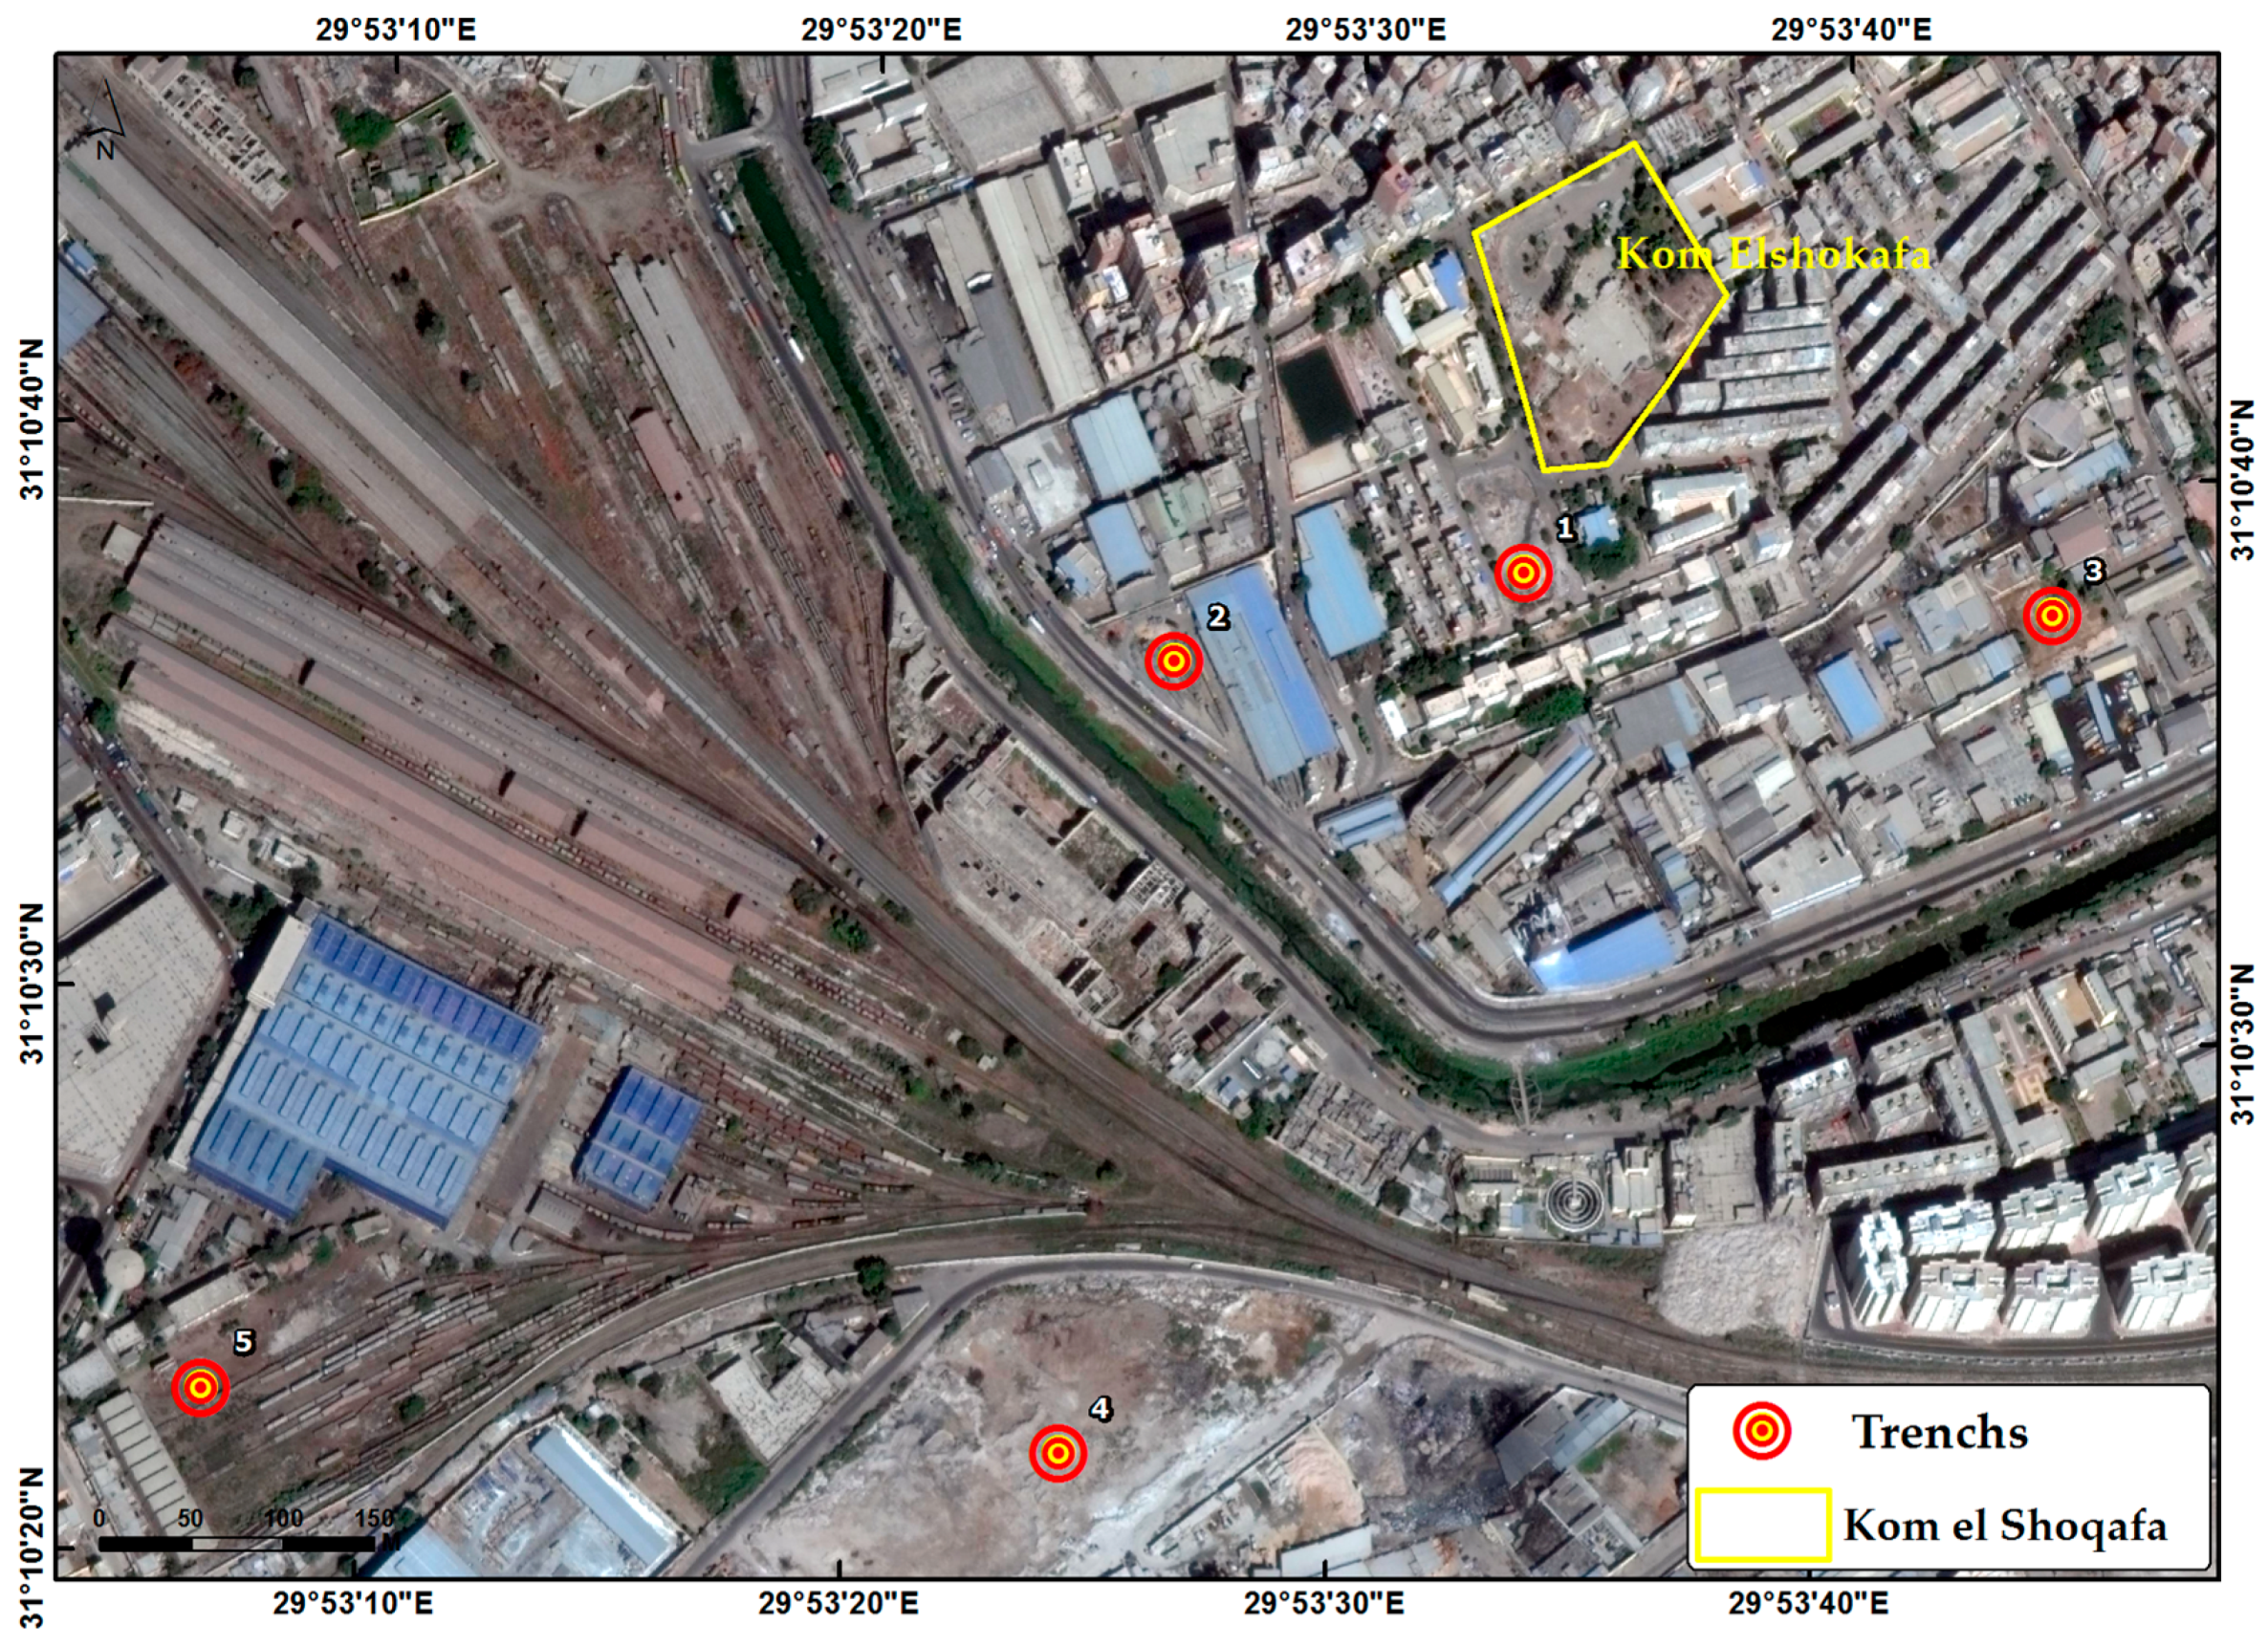
As a result of the bad environmental status around the archaeological area of Kom el shoqafa, it became necessary to choose some suitable places to dig some trenches to collect the groundwater from the study area of Kom el shoqafa. In fact, because the level of groundwater has become a huge danger to the area of the temples after the establishment of new Kom el shoqafa barrages, we must work on drainage systems covered with a layer of sponge to withdraw the groundwater or dig up trenches at certain distances from the temple to withdraw the wastewater slowly to avoid cracking the walls of the temple. The methodology involves the phase of GIS technique to identify the potential feasible sites based on external impact factors such as roads, DEM, archaeological area, agricultures. The position of the most suitable site is shown in the next images (Figure 21).

6. Discussion

Today, advanced information and communication technologies represent the most innovative aspects of many scientific disciplines, and this is especially true of the Cultural Heritage sector, where there is a growing demand from the public, at the local community level, for education and the management of cultural heritage with a view to increasing tourism [56]. Remote sensing is one of the main foundations of archaeological data, underpinning knowledge and understanding the historic environment. The potential of remote sensing can be achieved by placing a particular focus on archaeological heritage management. Well-established approaches and techniques have been used alongside new technologies and data sources, with discussion covering relative merits and applicability, and the need for integrated approaches to understanding and managing the landscape [57]. Urban development, related population growth, and environmental changes [58] can all be detected via remote sensing analysis, and the importance of locating archaeological sites to preserve and protect them has been stressed [59]. A range of generic software tools to aid the documentation, inspection and maintenance management of cultural buildings has been developed. Expert systems, containing, for example, the knowledge for diagnosis of damage/decay of (pointing) mortars have been realized [60].
In this paper, in order to recover the lost information and set up a systematic monitoring of ongoing changes close to archaeological areas of Kom el Shoqafa (Egypt) and Shush (Iran), we propose the use of historical archives along with recent satellite acquisitions. The data set is obviously made up of heterogeneous remote sensing images which can enable the recovery and recording of important formation on the past land use around two important archaeological areas Kom el Shoqafa (Egypt) and Shush (Iran). Results have been developed that take advantage of GIS and RS based on the utilization of a variety of environmental factors. Our approach addresses the challenges in using heterogeneous data from multiple data sources for change detection analysis to improve knowledge and monitoring of landscape over time with a specific focus on urban sprawl and land use change around archaeological areas. The change detection we performed is based on the use of a heterogeneous optical imagery data set, made up of satellite declassified Corona imagery and the more recent Landsat TM data. There are many techniques nowadays available to capture and record differences in two or more images acquired, that can be summarized as follows: (i) if the images come from the same sensors, the change detection is generally based on image differencing, ratios or correlation; (ii) if the data set is made up of heterogeneous images the post classification comparison is generally adopted. Moreover, it is really important to highlight that data preprocessing is an important procedure for change detection analysis. In particular, the comparison between satellite images taken form the same scene at different acquisition dates needs the images under analysis to be co-registered. In particular, the analysis of Corona and Landsat TM, ETM+, L8 imagery in Kom el Shoqafa revealed that urban areas increased by about 18% from 1964 to 1984, about 53% from 1984 to 1998 and finally about 29% from 1998 to 2016. Similarly, the urban areas in Shush increased by about 42% from 1964 to 1984, about 28% from 1984 to 1998 and are still today increasing around 30% from 1998 to 2016. On the other hand we can see that the agricultural lands in Kom el Shoqafa were decreased by about 72% from 1964 to 1984, and again decreased by about 1% from 1984 to 1998, but the agriculture lands increased by about 25% from 1998 to 2016. For Shush the agricultural lands decreased by about 76% from 1964 to 1984, and decreased again by about 22% from 1984 to 1998. Then, the agriculture land decreased again by about 4% from 1998 to 2016.
These changes are to the young farmers’ decision to try to invest in relatively low-priced, yet quality areas for agricultural purposes. In addition, some positive changes occurred in some land covers as in the case of natural grassland areas, which represent a middle phase of development between agricultural lands and urban areas, as farmers turn them into areas for building their houses (or to sell it as building area with much higher price). Some farmers, however, seem to neglect their agriculture land on purpose in Kom el Shoqafa [61]. All of these (bio) physical changes within the setting of the region’s ecosystems of Shush reflected the dynamics of human impacts on the study area.
Reconciling the demands of waste disposal and urban subsurface engineering as well as those of water supply, some degree of degradation will be unavoidable. Examining the effects each have on the subsurface can help develop the integrated approach so necessary to avoid serious long-term degradation [62]. Expert GIS tools, including statistical and other numerical techniques, can transform inputs from GIS modeling into derivative layers—and such layers can be exported into computer models. This results in the much more efficient use of the professional’s time, with more time spent on critical decisions about model boundaries and parameters and less time transcribing information. Computer models will need refinement in order to accurately represent pumping cycles (transient conditions) and to create detailed management zones within regional models. Predictions of cause and effect can be made and management scenarios explored. Fully developed groundwater models can inform management decisions. Publically available GIS mapping tools allow anyone with internet access to explore spatial relationships between existing data layers [63]. In addition, it is also evident that there is a need for a more complete protection of geosites from potential human-induced threats (e.g., urbanization, human-induced coastal erosion, waste disposal, mineral/aggregate extraction) [64].

7. Conclusions

In summary, the output from our investigations clearly highlighted that satellite data can provide very useful tools for (i) capturing land use changes along with impact induced by human activities at a site level; (ii) monitoring environmental problems with a particular attention addressed to the urbanization and changes in land use/land cover with particular reference to areas in close proximity to archaeological areas and cultural landscape. It is very important for researchers to understand the dramatic changes that have occurred due to human activity during the last decades. The analyses of the historical data set of satellite images provide detailed information on the evolution of the size and distribution of urban areas and agricultural lands that is key information useful for supporting both the management of future city growth and the implementation of strategies to mitigate the negative impacts on environment, ecosystems, cultural sites and archaeological landscape. As suggested by UNESCO, satellite images provide a means to improve the information flow and communication among site managers and conservation authorities: an image is worth a thousand words.
The results from our investigations conducted using data acquired in 1964, 1984, 1998 and 2016 clearly showed that the spatial dimension of the urban areas significantly increased for both the study areas Kom el Shoqafa (Egypt) and Shush (Iran). Analyses were based on the use of the Corona and Landsat TM, ETM+, L8 imagery, processed using different steps. (i) Geometric correction, unsupervised classification, supervised classification and post classification analyses to extract and quantify the most significant changes. These case studies present an experience in terms of planning and design that makes it possible to think of a sustainable use of heritage resources and their relationship with tourist space design. Moreover, this proposal sets a precedent and may be applicable to other projects, with the necessary adaptations depending on the particular contextual circumstances. The aims of this study were focused on detecting the result of urban sprawl, which appeared in the both study areas. This urban expansion affected the archaeological area, so we created some solutions which were supported by the integration between space images and GIS techniques. We can conclude that: (i) the current availability of long term satellite time series provide an excellent tool to observe and monitor changes from a global down to a local scale; (ii) additional improvement are expected to be obtained in the future using active and passive satellite data from Sentinel 1 and 2 provided free of charge by the European Space Agency (ESA).

Acknowledgments

The study is funded by the Italian National Research Council, C.da Santa Loja, Tito Scalo, Potenza. The authors wish to acknowledge the three anonymous reviewers who provided useful comments on an earlier draft of the paper.

Author Contributions

Rosa Lasaponara and Beniamino Murgante conceptualized and designed the study, reviewed and edited the manuscript. Abdelaziz Elfadaly, Mohamad Molaei Qelichi and Osama Wafa performed the experiments and wrote the paper. Saeed Zanganeh Shahraki and Wael Attia collected the data. All authors read and approved the manuscript.

Conflicts of Interest

The authors declare there is no conflict of interest regarding the publication of this paper.

References

  1. United Nations, Department of Economic and Social Affairs, Population Division. World Urbanization Prospects: The 2014 Revision, Highlights (ST/ESA/SER.A/352). Available online: http://esa.un.org/unpd/wup/Highlights/WUP2014-Highlights.pdf (accessed on 25 February 2015).
  2. The global partnership for environment and development: A guide to Agenda 21, post-Rio edition. 1993. Available online: https://catalog.hathitrust.org/Record/007191254 (accessed on 8 April 2017).
  3. The Istanbul Declaration on Human Settlements. Available online: http://www.jstor.org/stable/2137742 (accessed on 8 April 2017).
  4. Costanza, R. (Ed.) Ecological Economics: The Science and the Management of Sustainability; Columbia University Press: New York, NY, USA, 1991. [Google Scholar]
  5. Daly, H.E.; Cobb, J.J. For the Common Good; Beacon Press: Boston, MA, USA, 1990. [Google Scholar]
  6. Nijkamp, P. (Ed.) Sustainability of Urban Systems; Avebury: Aldershot, UK, 1990. [Google Scholar]
  7. Archibugi, F.; Nijkamp, P. (Eds.) Economy and Ecology: Towards Sustainable Development; Kluwer: Dordrecht, The Netherlands, 1989. [Google Scholar]
  8. Pearce, D.W. Blueprint 2: Sustaining the World Economy; Earthscan: London, UK, 1991. [Google Scholar]
  9. Amato, F.; Martellozzo, F.; Nolè, G.; Murgante, B. Preserving cultural heritage by supporting landscape planning with quantitative predictions of soil consumption. J. Cult. Herit. 2017, 23, 44–54. [Google Scholar] [CrossRef]
  10. United Nations Educational, Scientific and Cultural Organization, World Heritage Centre. Available online: http://whc.unesco.org/ (accessed on 18 December 2016).
  11. Nole, G.; Lanorte, A.; Murgante, B.; Lasaponara, R. Space Monitoring of urban sprawl. In EGU General Assembly Conference Abstracts; EGU: Vienna, Austria, 2012; Volume 14, p. 14067. [Google Scholar]
  12. Coluzzi, R.; Didonna, I. Multiscale/Multitemporal Urban pattern morphology monitoring in southern Italy by using Landsat TM time series. In EGU General Assembly Conference Abstracts; EGU: Vienna, Austria, 2009; Volume 11, p. 10555. [Google Scholar]
  13. Lasaponara, R.; Lanorte, A. Satellite time-series analysis. Int. J. Remote Sens. 2012, 33, 4649–4652. [Google Scholar] [CrossRef]
  14. Di Palma, F.; Amato, F.; Nolè, G.; Martellozzo, F.; Murgante, B. A SMAP Supervised Classification of Landsat Images for Urban Sprawl Evaluation. ISPRS Int. J. Geo-Inf. 2016, 5, 109. [Google Scholar] [CrossRef]
  15. Lasaponara, R.; Leucci, G.; Masini, N.; Persico, R.; Scardozzi, G. Towards an operative use of remote sensing for exploring the past using satellite data: The case study of Hierapolis (Turkey). Remote Sens. Environ. 2016, 174, 148–164. [Google Scholar] [CrossRef]
  16. Rizzo, E.; Orefici, G. New discoveries in the Piramide Naranjada in Cahuachi (Peru) using satellite, Ground Probing Radar and magnetic investigations. J. Archaeol. Sci. 2011, 38, 2031–2039. [Google Scholar]
  17. Masini, N.; Lasaponara, R.; Orefici, G. Addressing the challenge of detecting archaeological adobe structures in Southern Peru using QuickBird imagery. J. Cult. Herit. 2009, 10, e3–e9. [Google Scholar] [CrossRef]
  18. Amato, F.; Pontrandolfi, P.; Murgante, B. Supporting planning activities with the assessment and the prediction of urban sprawl using spatio-temporal analysis. Ecol. Inform. 2015, 30, 365–378. [Google Scholar]
  19. Nolè, G.; Lasaponara, R.; Murgante, B. Analyzing urban sprawl applying spatial autocorrelation techniques to multi-temporal satellite data. Urban Reg. Data Manag. UDMS Annu. 2013, 3, 161–170. [Google Scholar]
  20. Nolè, G.; Lasaponara, R.; Lanorte, A.; Murgante, B. Quantifying Urban Sprawl with Spatial Autocorrelation Techniques using Multi-Temporal Satellite Data. Int. J. Agric. Environ. Inf. Syst. 2014, 5, 19–37. [Google Scholar] [CrossRef]
  21. Nolè, G.; Murgante, B.; Calamita, G.; Lanorte, A.; Lasaponara, R. Evaluation of urban sprawl from space using open source technologies. Ecol. Inform. 2015, 26, 151–161. [Google Scholar] [CrossRef]
  22. Cigna, F.; Lasaponara, R.; Masini, N.; Milillo, P.; Tapete, D. Persistent Scatterer Interferometry Processing of COSMO-SkyMed StripMap HIMAGE Time Series to Depict Deformation of the Historic Centre of Rome, Italy. Remote Sens. 2014, 6, 12593–12618. [Google Scholar] [CrossRef]
  23. Lasaponara, R. Editorial of special issue on Identification of traces of past human activities fossilized in the modern landscape. J. Cult. Herit. 2017, 23, 2–4. [Google Scholar] [CrossRef]
  24. Winograd, I.J. Archaeology and Public Perception of a Trans-Scientific Problem; Disposal of Toxic Wastes in the Unsaturated Zone; U.S. Geological Survey: Reston, VA, USA, 1986.
  25. Masini, N.; Lasaponara, R. Satellite-based recognition of landscape archaeological features related to ancient human transformation. J. Geophys. Eng. 2006, 3, 230–235. [Google Scholar] [CrossRef]
  26. Environment Agency and English Heritage. Piling in layered ground: risks to groundwater and archaeology. 2006. Available online: https://www.gov.uk/government/publications/piling-in-layered-ground-risks-to-groundwater-and-archaeology (accessed on 1 October 2006).
  27. Lasaponara, R.; Masini, N. Satellite remote sensing in archaeology: Past, present and future perspectives. J. Archaeol. Sci. 2011, 9, 1995–2002. [Google Scholar] [CrossRef]
  28. Hegazy, I.R.; Kaloop, M.R. Monitoring urban growth and land use change detection with GIS and remote sensing techniques in Daqahlia governorate Egypt. Int. J. Sustain. Built Environ. 2015, 4, 117–124. [Google Scholar] [CrossRef]
  29. Le, T.; Chang, C.-P.; Nguyen, X.; Yhokha, A. TerraSAR-X Data for High-Precision Land Subsidence Monitoring: A Case Study in the Historical Centre of Hanoi, Vietnam. Remote Sens. 2016, 8, 338. [Google Scholar] [CrossRef]
  30. Lasaponara, R.; Masini, N. Satellite Synthetic Aperture Radar in Archaeology and Cultural Landscape: An Overview. Archaeol. Prospect. 2013, 20, 71–78. [Google Scholar] [CrossRef]
  31. Stewart, C.; Lasaponara, R.; Schiavon, G. Multi-frequency, polarimetric SAR analysis for archaeological prospection. Int. J. Appl. Earth Observ. Geoinf. 2014, 28, 211–219. [Google Scholar] [CrossRef]
  32. Tapete, D.; Cigna, F.; Masini, N.; Lasaponara, R. Prospection and monitoring of the archaeological heritage of Nasca, Peru, with ENVISAT ASAR. Archaeol. Prospect. 2013, 20, 133–147. [Google Scholar] [CrossRef]
  33. Moya, K.M. Alexandria and the Hellenistic World. Available online: http://www.moyak.com/papers/ancient-alexandria.html (accessed on 8 September 2016).
  34. Sayed, H. Seismic Response Analysis and Protection of Underground Monumental Structures—The Catacombs of Kom EL-Shoqafa, Alexandria, Egypt; INTECH Open Access: Rijeka, Croatia, 2012. [Google Scholar]
  35. Empereur, J.Y.; Compoint, S. Alexandria Rediscovered. Available online: https://books.google.it/books/about/Alexandria_rediscovered.html?id=3tEVAQAAIAAJ&redir_esc=y (accessed on 15 December 2016).
  36. Empereur, J.Y.; Clement, C.; Gout, J.F. A Short Guide to the Catacombs of Kom El Shoqafa Alexandria; Serapis Publishing: Alexandria, KY, USA; 1995. [Google Scholar]
  37. Ali, M.A.M.; Kotb, A.A.; Elsherif, A.; Hisham, R.; Osama, M. Environmental’s Design Role in the Reviving and Preserving of Architectural Heritage Case Study (Catacombs of Kom El Shoqafa). Procedia Soc. Behav. Sci. 2016, 225, 132–144. [Google Scholar] [CrossRef]
  38. McKenzie, J. The Architecture of Alexandria and Egypt; C. 300 B.C. to A.D. 700; Yale University Press: New Haven, CT, USA, 2007. [Google Scholar]
  39. Savvopoulos, K. Archeology of Alexandrea in Aegypto. The Role of the Egyptian Tradition in the Hellenistic and Roman Periods: Ideology, Culture, Identity, and Public Life. Ph.D. Thesis, Leiden University, Leiden, The Netherlands, 2011. [Google Scholar]
  40. Frakes, J.F.D. Monumental Tombs of Ancient Alexandria: The Theater of the Dead. J. Soc. Archit. Histor. 2003. [Google Scholar] [CrossRef]
  41. Physical location map of Egypt, National Imagery and Mapping Agency data, USA. Available online: https://commons.wikimedia.org/wiki/File:Egypt_relief_location_map_2008_to_2011.jpg (accessed on 6 October 2011).
  42. Bader, N.A.; Hassan, R.A.E. Examination and Conservation of Helal El-Beah Mosque, Dakahlia, Egypt. J. Build. Constr. Plan. Res. 2016, 4, 103–118. [Google Scholar] [CrossRef]
  43. Shush—UNESCO World Heritage Centre. Available online: http://whc.unesco.org/en/tentativelists/894 (accessed on 15 December 2016).
  44. Nouri, J.; Mahvi, A.H.; Babaei, A.; Ahmadpour, E. Regional pattern distribution of groundwater fluoride in the Shush aquifer of Khuzestan County. Iran. Fluoride 2006, 39, 321–325. [Google Scholar]
  45. Jahanshahi, S.; Siavash Rashidi, S. Designing an Institute of History of Ancient Iran Based on an Approach to Reinvention of Architectural and Local Values in Kenar Sandal Area. J. Sci. Res. Dev. Niger. 2015, 2, 78–86. [Google Scholar]
  46. Shahmirzadi, S. A Study on Evulution of Archaeological Studies in Iran. Tehran, 1990. Available online: https://www.google.it/_/chrome/newtab?espv=2&ie=UTF-8 (accessed on 15 December 2016).
  47. Hodjat, M. Cultural Heritage in Iran: Policies for an Islamic Country. 1995. Available online: http://etheses.whiterose.ac.uk/2460/1/DX193597.pdf (accessed on 8 August 2013).
  48. Mirza-Mohammad-Ali-Khan, Farid-ol-Molk-Hamadani. Memoirs of Farid from 1874–1917; Zawar: Tehran, Iran, 1975. [Google Scholar]
  49. Afshar, I. Roznameh Khaterat-E Etemad Al-Saltaneh; Amir-Kabir Press: Tehran, Iran, 1966. [Google Scholar]
  50. United Nations Educational, Scientific and Cultural Organization, World Heritage Centre. Available online: http://whc.unesco.org/en/list/1455/ (accessed on 25 February 2017).
  51. Arb, O. Determining Rate Development of Counties of Khuzestan Province Based on Various Indices of Development. Indian J. Fundam. Appl. Life Sci. 2015, 5, 977–985. [Google Scholar]
  52. Gomez, D.; Montero, J. Determining the accuracy in image supervised classification problems. In Proceedings of the 7th Conference of the European Society for Fuzzy Logic and Technology (EUSFLAT-2011), Paris, France, 18–22 July 2011. [Google Scholar]
  53. Tayyebi, A.; Pijanowski, B.C.; Linderman, M.; Gratton, C. Comparing three global parametric and local non-parametric models to simulate land use change in diverse areas of the world. Environ. Model. Softw. 2014, 59, 202–221. [Google Scholar] [CrossRef]
  54. Tayyebi, A.; Pijanowski, B.C. Modeling multiple land use changes using ANN, CART and MARS: Comparing tradeoffs in goodness of fit and explanatory power of data mining tools. Int. J. Appl. Earth Obs. Geoinf. 2014, 28, 102–116. [Google Scholar] [CrossRef]
  55. Lasaponara, R.; Elfadaly, A.; Attia, W. Low Cost Space Technologies for Operational Change Detection Monitoring Around the Archaeological Area of Esna-Egypt. Comput. Sci. Appl. 2016, 9787, 611–621. [Google Scholar]
  56. Lasaponara, R.; Masini, N. Advances on Remote Sensing for Archaeology and Cultural Heritage Management. In Proceedings of the 1st International EARSeL Workshop, Rome, Italy, 30 September–4 October 2008; pp. 3–6. [Google Scholar]
  57. Cowley, D.C. Remote Sensing for Archaeological Heritage Management. In Proceedings of the 11th EAC Heritage Management Symposium, Reykjavík, Iceland, 25–27 March 2010. [Google Scholar]
  58. Akasheh, T.S. Ancient and modern watershed management in Petra. Near East. Archaeol. 2002, 65, 220–224. [Google Scholar] [CrossRef]
  59. Parcak, S. Satellite Remote Sensing for Archaeology; Routledge Publication: London, UK, 2009; p. 286. [Google Scholar]
  60. Cassar, M.; Brimblecombe, P.; Nixon, T.; Price, C.; Sabbioni, C.; Jimenez, S.; Van Balen, K. Technological Requirements for Solutions in the Conservation and Protection of Historic Monuments and Archaeological Remains; In Assessment (p. 52); European Parliament, Directorate-General for Research Directorate A STOA Programme: Luxembourg, 2001; p. 52. [Google Scholar]
  61. El-Hattab, M.M. Applying post classification change detection technique to monitor an Egyptian coastal zone (Abu Qir Bay), Egypt. J. Remote Sens. Space Sci. 2016, 19, 23–36. [Google Scholar]
  62. Morris, B.L.; Lawrence, A.R.; Chilton, P.J.; Adams, B.; Calow, R.C.; Klinck, B.A. Groundwater and Its Susceptibility to Degradation: A Global Assessment of the Problem and Options for Management; United Nations Environment Programme: Nairobi, Kenya, 2003. [Google Scholar]
  63. Groundwater Technical Workgroup. Evaluation of Models and Tools for Assessing Groundwater Availability and Sustainability; Minnesota Department of Natural Resources: Minnesota, MI, USA, 2010.
  64. Geremia, F.; Bentivenga, M.; Palladino, G. Environmental Geology Applied to geoconservation in the interaction between geosites and linear infrastructures in South-Eastern Italy. Geoheritage 2015, 7, 33–46. [Google Scholar]
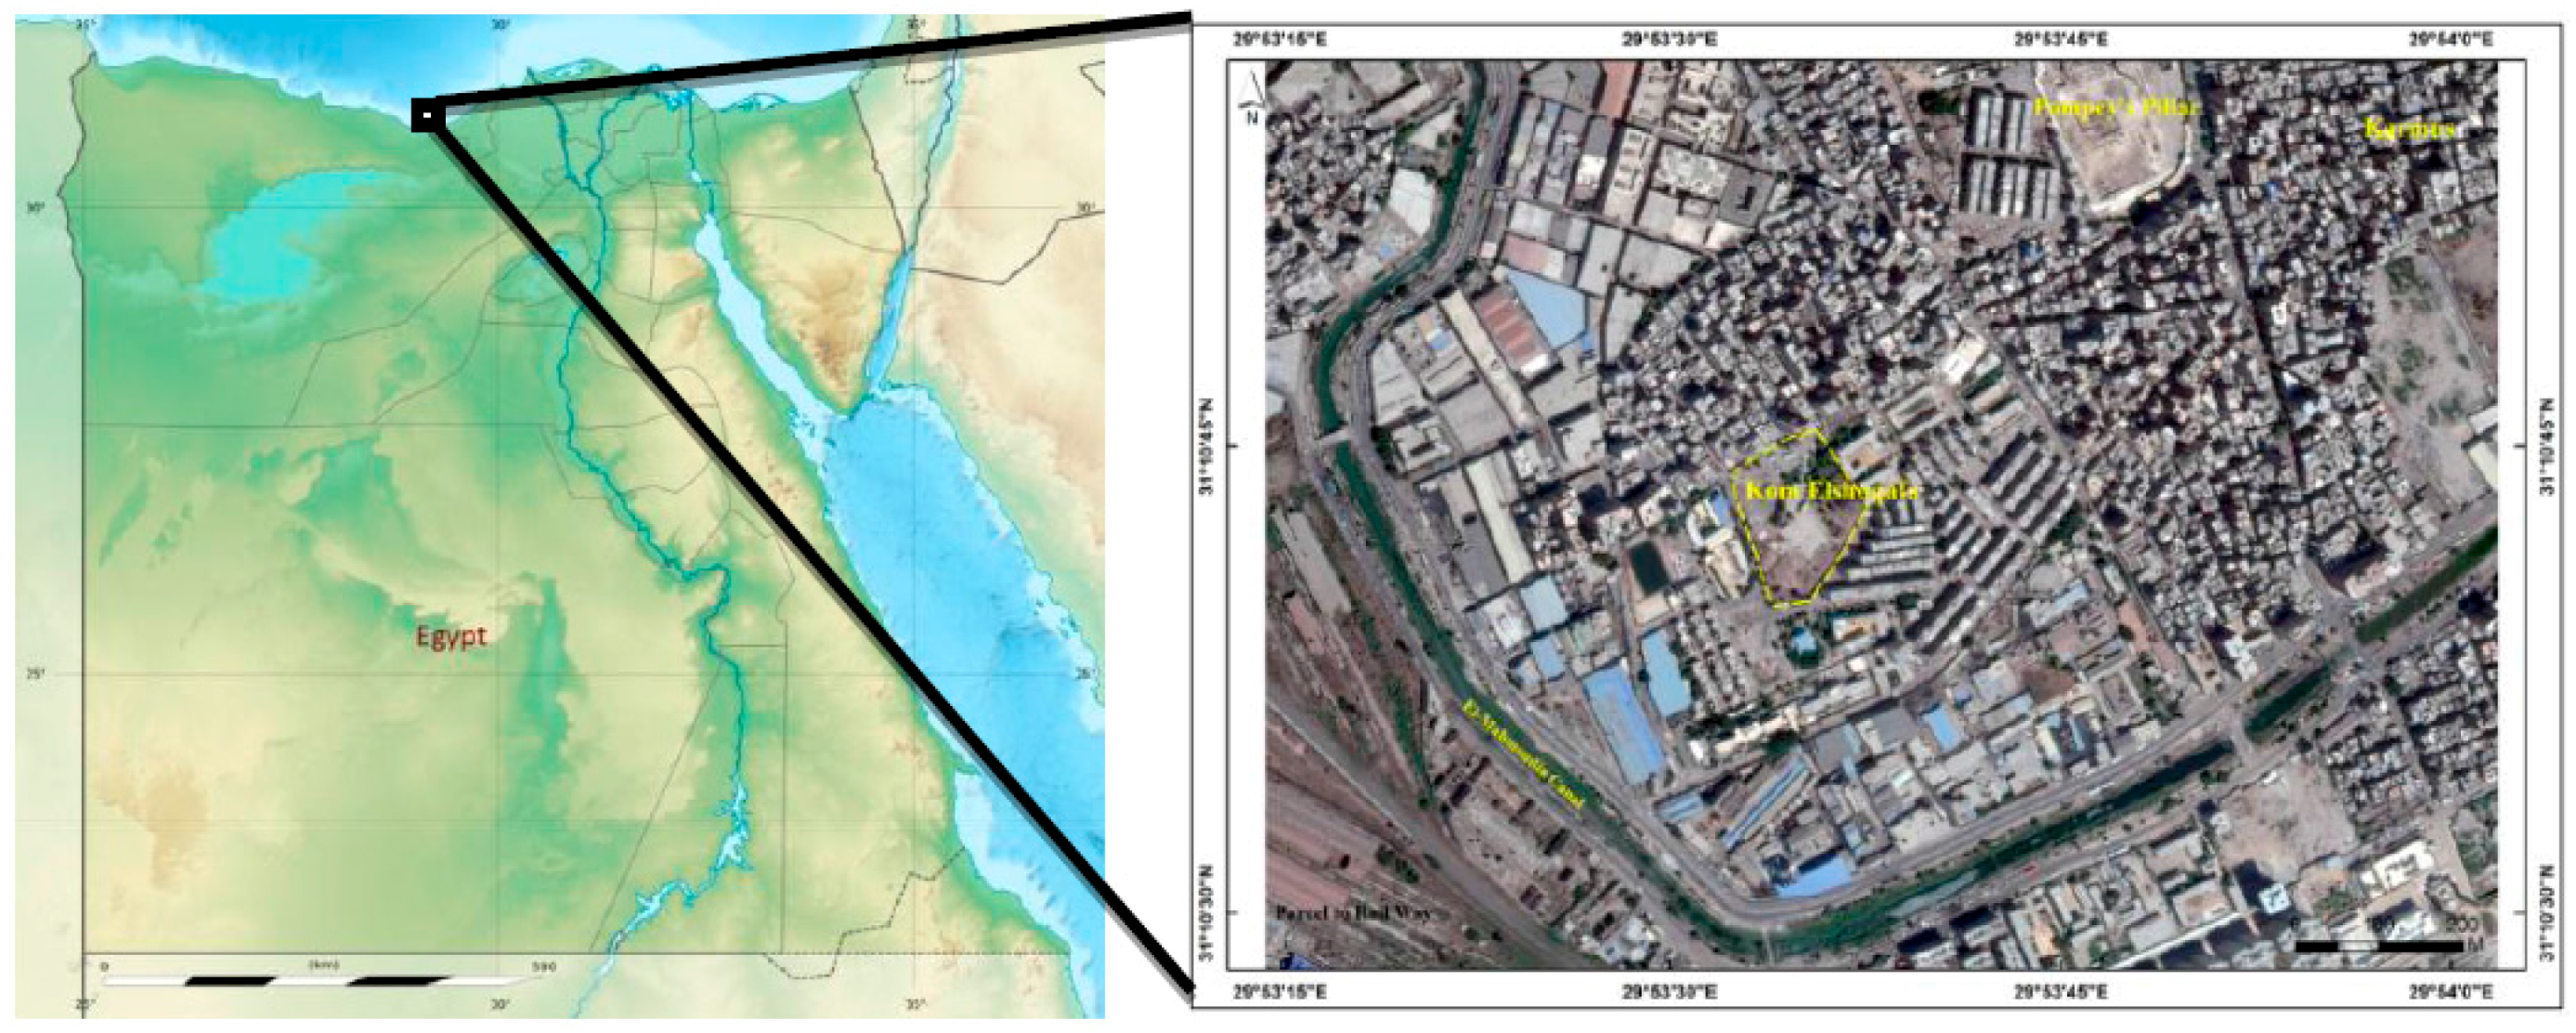
Figure 1. Study area of (Kom el Shoqafa) Alexandria, Egypt by [41].
Sustainability 09 00572 g001
Figure 2. (ac) Some of the decorations inside the catacombs of Kom el Shoqafa.
Sustainability 09 00572 g002
Figure 3. (ac) Interior deteriorations in the archaeological area of Kom el Shoqafa.
Sustainability 09 00572 g003aSustainability 09 00572 g003b
Figure 4. (a) Map of Iran; (b) Map of Khuzestan province; (c) Map of Shush city.
Sustainability 09 00572 g004
Figure 5. (a) Shush castle; (b) the ziggurat at Choghā Zanbīl; (c) the remains of a sculpture in Shush.
Sustainability 09 00572 g005
Figure 6. (a) Urban sprawl around the archaeological area of Shush; (b) Urban sprawl around the Tomb of Daniel in Shush.
Sustainability 09 00572 g006
Figure 7. Unsupervised Classification for Kom el shoqafa.
Sustainability 09 00572 g007
Figure 8. Unsupervised Classification for Shush area from 1964 to 2016.
Sustainability 09 00572 g008
Figure 9. Urban areas in Kom el Shoqafa from 1964 to 2016.
Sustainability 09 00572 g009
Figure 10. Urban areas in Shush from 1964 to 2016.
Sustainability 09 00572 g010
Figure 11. Agriculture areas in Kom el Shoqafa from 1964 to 2016.
Sustainability 09 00572 g011
Figure 12. Agriculture areas in Shush from 1964 to 2016.
Sustainability 09 00572 g012aSustainability 09 00572 g012b
Figure 13. Training points for accuracy assessment in Kom el Shoqafa area.
Sustainability 09 00572 g013
Figure 14. Training points for accuracy assessment in Shush area.
Sustainability 09 00572 g014
Figure 15. Total changes in the urban area of Kom el Shoqafa.
Sustainability 09 00572 g015
Figure 16. Total changes in the urban area of Shush.
Sustainability 09 00572 g016
Figure 17. Total changes in the agriculture area of Kom el Shoqafa.
Sustainability 09 00572 g017
Figure 18. Total changes in the agriculture area of Shush.
Sustainability 09 00572 g018
Figure 19. Generalized zonal system in the study area of Kom el Shoqafa.
Sustainability 09 00572 g019
Figure 20. Generalized zonal system in the study area of Shush.
Sustainability 09 00572 g020
Figure 21. The most suitable new sites for the Trenches around the study area of Kom el Shoqafa.
Sustainability 09 00572 g021
Table 1. Data collection properties of the study areas (Egypt and Iran).
NumberSatelliteSensorResolution (M)Acquisition DateSource
1CoronaKH-4B1.8 mAugust 1964USGS
2LandsatTM30 mSeptember 1984GLCF
3LandsatETM+30 mOctober 1998GLCF
4LandsatOLI30 mSeptember 2016USGS
Table 2. Kappa Coefficient and overall accuracy of Regions of Interest (ROIs) for each period.
YearKom el ShoqafaShush
Kappa CoefficientOverall AccuracyKappa CoefficientOverall Accuracy
19840.8992.79%0.6780.00%
19980.9597.14%0.9596.83%
20160.9295.00%0.9298.86%
Table 3. Total changes in the urban and agriculture areas by km2 in (Kom el Shoqafa and Shush).
ClassStudy AreaArea 1964 (km2)Change Detection ±km2Area 1984 (km2) Change Detection ±km2Area 1998 (km2)Change Detection ±km2Area 2016 (km2)
Urban(Kom el Shoqafa)21,065 231523,380677730,158363433,792
(Shush)2744 143341779455122 10126134
Agriculture(Kom el Shoqafa)20,445−6178 14,267−108 14,159 212816,287
(Shush)4809−4528 281−141 140 −23117