
Integrated Natural Gas, Heat, and Power Dispatch Considering Wind Power and Power-to-Gas


School of Electrical Engineering, Wuhan University, Wuhan 430072, China
*
Author to whom correspondence should be addressed.
Sustainability 2017, 9(4), 602; https://doi.org/10.3390/su9040602
Submission received: 9 March 2017
/
Revised: 9 April 2017
/
Accepted: 10 April 2017
/
Published: 13 April 2017
(This article belongs to the Special Issue Sustainable Electric Power Systems Research)
Abstract
:A large amount of wind power has to be curtailed due to the inflexibility of the combined heat and power (CHP) system in the heating season in northern China. The power-to-gas (P2G) technology, which uses electricity to produce hydrogen or synthetic natural gas, has become a promising energy conversion option for the utilization of surplus power energy. In this paper, an integrated natural gas, heat, and power dispatch (INGHPD) model which balances natural gas, heat, and power demand considering wind power and a P2G unit, is proposed. A natural gas network and P2G are modeled and integrated into the dispatch model. To demonstrate the effectiveness of the proposed model, an integrated energy system consisting of a six-bus power system, a six-node natural gas system, and a district heating system is simulated. The benefits of P2G are investigated in terms of reducing wind power curtailment, as well as system operation cost and CO2 emissions. The results in the deterministic model show that with the introduction of 40 MW P2G, the wind power curtailment rate decreases from 24.0% to 9.7%. The daily wind power energy consumed by P2G reaches 256 MWh and the daily CO2 emissions reduction reaches 46,080 kg. Additionally, the impact of the power and heat demand on the gas production of P2G and of the P2G capacity on the wind power curtailment are also investigated. P2G tends to generate more natural gas when the power demand is low and the heat demand is high.
1. Introduction
Wind energy has achieved a great development all over the world in recent years. In China, the gross installed capacity of wind power reached 97 GW by the end of 2014, representing 27% of the global installed capacity. Moreover, eight wind power generation bases have been planned, mainly located in northern China, each of which is planned to have an installed capacity of more than 10 GW by 2020 [1]. Combined heat and power (CHP) is a technology which can simultaneously satisfy heat and power requirements with a high efficiency. Compared to the separated generation of heat and power by pure heating and power technologies, the efficiency can improve the performance by 10–40% in CHP units [2]. CHP units play an important role in northern China. For example, in the Jilin Province, over 70% of the heat demand is supplied by CHP units [3]. However, in the winter, when the heat demand is high and the power demand is low, CHP units have to meet the heat demand and then generate a considerable amount of electricity, leaving little room for wind power integration. This leads to a high wind power curtailment.
The natural gas-fired units (NGFU) and combined heat and power units, due to their high efficiency, low investment cost, operational flexibility, and low environmental pollution in comparison with conventional coal plants, have grown dramatically in the last decade and play an important role in the power system [4]. Gas-fired units establish the interdependence of the power system and natural gas system [5,6], while CHP units provide the linkage between the heating system and power system [7]. The economy and security of the three different systems would affect each other. For example, the natural gas supply could influence the dispatch and operation of gas-fired power units and CHP units. The operation of CHP units would then affect the heat supply. The rapid development of natural gas-fired plants strengthens the interdependence of gas, heat, and electricity. Thus, it is significant to investigate the operation optimization of the integrated natural gas, heat, and power system considering their operational constraints.
Power-to-gas (P2G) is a technology which uses electricity to produce hydrogen or synthetic natural gas that can be later utilized for re-electrification or heating [8,9,10,11,12]. Surplus wind power can be utilized in this method and stored in the natural gas system [13,14]. P2G provides the bidirectional energy flow between a power and natural gas system, which can largely increase the efficiency of energy utilization. It provides an important flexibility option for the CHP system in northern China and needs to be further studied.
In this paper, an integrated natural gas, heat, and power dispatch (INGHPD) model which balances the natural gas load, heat load, and power load is proposed, with a consideration of the constraints of the three systems. The benefits of P2G in the integrated energy system are evaluated in terms of reducing the wind power curtailment, system operation cost, and CO2 emissions.
The main contributions of this paper are illustrated as follows:
- (1)
- A novel framework of an integrated energy system considering wind power and P2G is proposed (as depicted in Figure 1), in which a natural gas system, heating system, and power system are included. The INGHPD model, aimed at minimizing the system operation cost, is proposed.
- (2)
- A natural gas network is modeled and its system constraints are taken into account in the optimal dispatch model.
- (3)
- P2G is integrated into the dispatch model and its benefits in reducing the wind power curtailment, system operation cost, and CO2 emissions are evaluated. Factors influencing the performance of P2G are also investigated.
This paper is organized as follows: The related work is briefly reviewed in Section 2. The key components of the integrated natural gas, heat, and power system are modeled in Section 3. The INGHPD model considering wind power and P2G is formulated in Section 4. In Section 5, a case study is simulated to demonstrate the effectiveness of the proposed method. Conclusions are drawn in Section 6.
2. Related Work
The integration of a power system and natural gas system has recently been investigated [15,16,17,18,19]. A mixed-integer linear programing security-constrained optimal power and gas flow is formulated in [16]. A coordinated stochastic model is proposed in [19] for studying the interdependence of electricity and natural gas transmission networks. In [20], the security-constrained unit commitment is modeled considering natural gas transmission constraints. Reference [21] explores the impact of the electricity demand response in the integrated electricity and natural gas network. Firming the variability of wind power is analyzed in [22], with the consideration of interdependent power and natural gas infrastructures.
However, P2G is not taken into consideration in the aforementioned studies. The impacts of P2G on reducing the operation cost and CO2 emissions, and relieving electricity and natural gas congestions, are evaluated in [23]. Reference [24] analyzes the optimal capacity and spatial distribution of P2G plants in an 85% renewable energy scenario. Reference [25] assesses the potential of P2G with the integration of gas seasonal storage in terms of gas production from renewable energy, as well as its impact on natural gas prices. Reference [26] focuses on a steady-state analysis of the integrated natural gas and power system considering P2G. A unified energy flow formulation is developed to describe the nodal balance and branch flow in both systems. However, the heat supply is not considered and its impact on P2G is not investigated in previous studies.
The combined operation of integrated electricity and heat systems is also investigated in the recent papers. In [27], heat storage tanks and electric boilers are introduced into the CHP system to increase the wind power integration. In [28], the energy storage capability of a district heating network is investigated to improve the overall efficiency of the integrated heat and power system. In [29], the electric heat pump and building thermal inertia are considered to decouple the strong linkage of electric power and heat supplies in the CHP system.
In contrast to the previous work, we jointly optimize the natural gas, heat, and power supplies to promote wind power integration with the consideration of P2G. This work is a beneficial supplement for the previous works.
3. Model of Integrated Natural Gas, Heat and Power System
3.1. Structure of Integrated Natural Gas, Heat, and Power System
The structure of an integrated natural gas, heat, and power system is depicted in Figure 1. Natural gas is provided for the CHP units, NGFUs, and residential gas loads. The power load is satisfied by the CHP units, NGFUs, and wind power, while the heat load is satisfied by the CHP units. Surplus power energy can be utilized to produce hydrogen or synthetic natural gas by power-to-gas plants, which is then inputted into the natural gas network. It should be noted that other heat sources such as a gas-fired boiler and heat storage could also be introduced to the system, but they are not the focus of this paper and are not modeled here.
3.2. CHP Unit
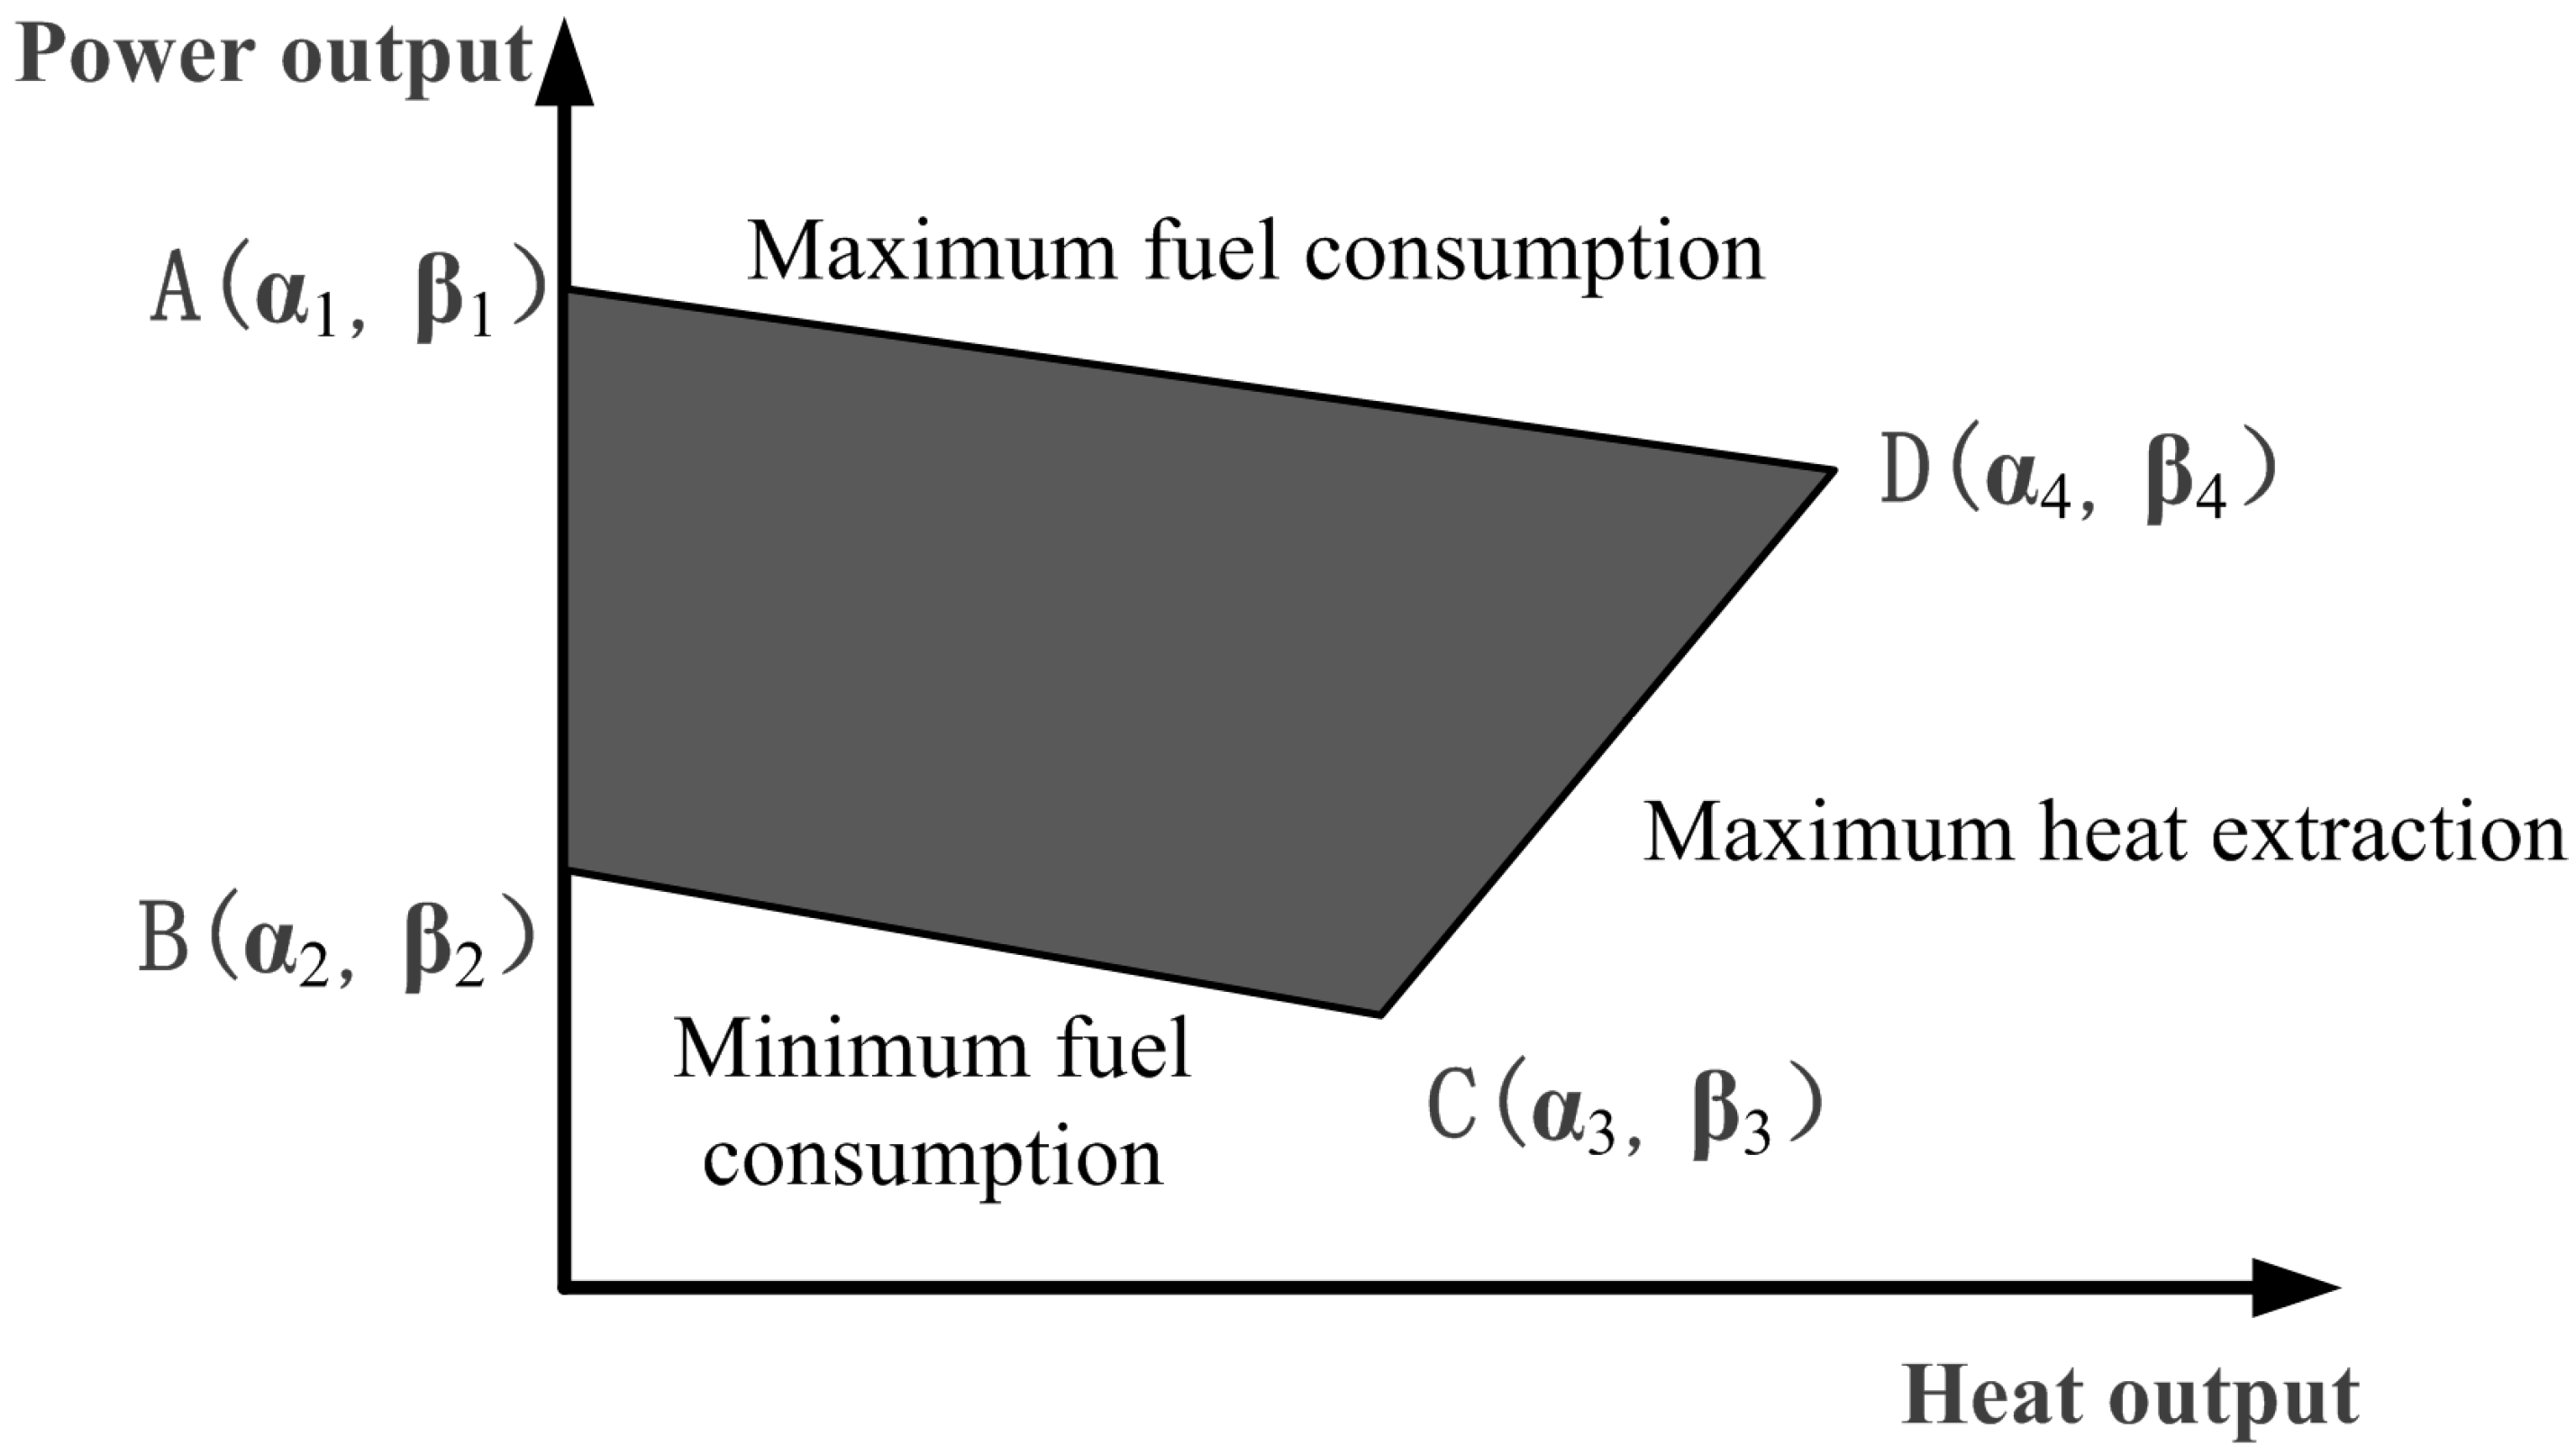
A typical feasible operation region [30] of the CHP is shown in Figure 2. The heat and power productions of the CHP are restricted by the boundary curve ABCD. The power and heat production of the CHP unit are constrained by three operational limits: minimum fuel consumption, maximum fuel consumption, and maximum heat extraction [31]. The corners of the operating region are called the extreme characteristic points of the CHP unit. The power production, heat production, and gas cost of each point within the feasible operation region can be represented by the convex combination of extreme characteristic points [32]. The relationship can be presented by:
It should be noted that the dispatch of one CHP unit may have an impact on the remaining capacity of the heat pipelines and electrical lines, and thus have an influence on the feasible region of other CHP units. In this paper, it is assumed that the capacities of the heat pipelines and electrical lines are large enough and the impact is not considered.
3.3. Natural Gas Network
The main components of a natural gas system include natural gas wells, transmission pipelines, and natural gas loads. In this paper, the model of a natural gas system is presented by using the steady-state mathematical model.
Natural gas supply: In general, natural gas suppliers are gas wells, which are seen as positive gas injections at related nodes. The gas supplies are restricted by their upper and lower limits:
Natural gas loads: The gas loads are seen as negative injections at related nodes. Natural gas loads can be classified into residential, commercial, and industrial loads. Natural gas-fired units are the industrial load. The gas loads are restricted by their upper and lower limits:
Pipelines: The pipelines are used to transmit natural gas from the gas wells to gas customers. The pipelines can be classified into active pipelines and passive pipelines. The active pipelines are comprised of compressors, which are equipped to increase the gas pressure of the pipelines and thus increase the transmission capacity. In this paper, we only consider the passive pipelines. The natural gas flow in the pipelines can be modeled by the Weymouth equation [33]:
where Cmn is the pipeline constant which depends on the temperature, length, friction, diameter, and natural gas compositions. The function of sgn(πm,πn) represents the direction of the gas flow through the pipeline. When the pressure of node m is higher than node n, it is equal to one; otherwise, it is −1. The pressure of each node should be maintained within a certain interval, as depicted in (5).
To improve the computation efficiency, the Weymouth equation is linearized by a piecewise linear function [33,34]. First, Equation (4), when πm ≥ πn, can be expressed as (6).
Then, in the optimization model, the pressure variable of each node can be defined by , which could eliminate the nonlinearity on the right side of the equation. Moreover, the quadratic term on the left side of Equation (6) can be piecewise-linearly approximated, as shown in (7).
Natural gas flow conservation: With respect to node m, the gas injected into the node should be equal to the gas extracted from the node. Thus, natural gas flow conservation can be depicted as:
The first term represents the gas supply from the gas suppliers to node m. The second term represents the gas load at node m. The third term represents the gas flow rate in the pipelines which are connected with node m.
3.4. Power to Gas
The power-to-gas technology utilizes surplus power energy from renewable energy to produce hydrogen by the process of electrolysis. The produced hydrogen can be injected into the natural gas network or further converted to synthetic natural gas by additional methanation combined with carbon dioxide. However, the amount of hydrogen injected into the natural gas system should be limited, since blending hydrogen into the natural gas network will reduce the energy density of the gas and have a bad effect on the pipeline material. In the UK, the maximal level of hydrogen in the natural gas network is currently limited to 0.1% (by volume) [25]. Therefore, in this paper, we assume that all of the produced hydrogen is converted to natural gas. The conversion from power to natural gas production has a 60–65% efficiency [35].
In this paper, a power-to-gas plant is modeled to covert the power to natural gas with a certain efficiency [36], as demonstrated in (9). The volumetric quantity of natural gas can be converted by Equation (10). The P2G power is restricted by its installed power capacity, as shown in (11). The incremental power consumption of P2G is restricted by its maximum ramping rate, as depicted in (12).
3.5. Natural Gas-Fired Unit
NGFUs consume gas to generate power according to the flexible gas contracts and can be regarded as gas loads in the natural gas network. The power production derived from natural gas consumption is modeled in (13). Then, the natural gas consumption cost can be represented as (14).
4. Formulation of INGHPD Model
In this section, the INGHPD model is formulated considering wind power and P2G, which seeks the optimal dispatch of natural gas, power, and heat sources, while satisfying the physical and security constraints of the natural gas, heat, and power system. It is assumed that the power units remain on during the scheduling horizon.
4.1. Objective Function
The objective of the dispatch model is to minimize NGFUs, the operating cost of the CHP units, and the revenue of the natural gas produced by P2G over the scheduling horizon, which can be expressed as:
4.2. Constraints
- (1)
- Power balance constraints: The power demand is satisfied by NGFUs, CHP units, and wind power.
- (2)
- Heat balance constraints: The heat demand is satisfied by the CHP units only.
- (3)
- Power output constraints of NGFUs: The power outputs of the NGFUs are constrained by their technical limits.
- (4)
- Ramping rate constraints of NGFUs and CHP units: The incremental power outputs of the power generation units are restricted by their maximum ramping rates.
- (5)
- Power output constraints of wind farms: The integrated wind power should not exceed its forecasted wind power.
- (6)
- Spinning reserve constraints: A certain level of spinning reserve capacity is required to deal with the system contingencies.
- (7)
- Power transmission constraints: Transmission flow should not exceed the transmission capacity.
The other constraints are expressed in (1)–(14).
4.3. Robust Optimization Model
When uncertainty is taken into consideration, the optimization model can be formulated by using stochastic optimization, interval optimization, or robust optimization. In this paper, a robust optimization model is formulated to verify the feasibility of the proposed method when the uncertainties of wind power, power demand, and heat demand are considered. The objective of the robust optimization model is to minimize the worst-case total cost. The objective function can be formulated as:
where u represents the decision variables, are the uncertain parameter vectors that represent the available wind power, power demand, and heat demand, respectively.
The uncertainty sets define the range of the uncertain wind power, power demand, and heat demand:
The constraints in the robust optimization model are the same as those in the deterministic model, expect that the certain parameters are substituted by the uncertain parameters.
5. Case Study
5.1. System Description
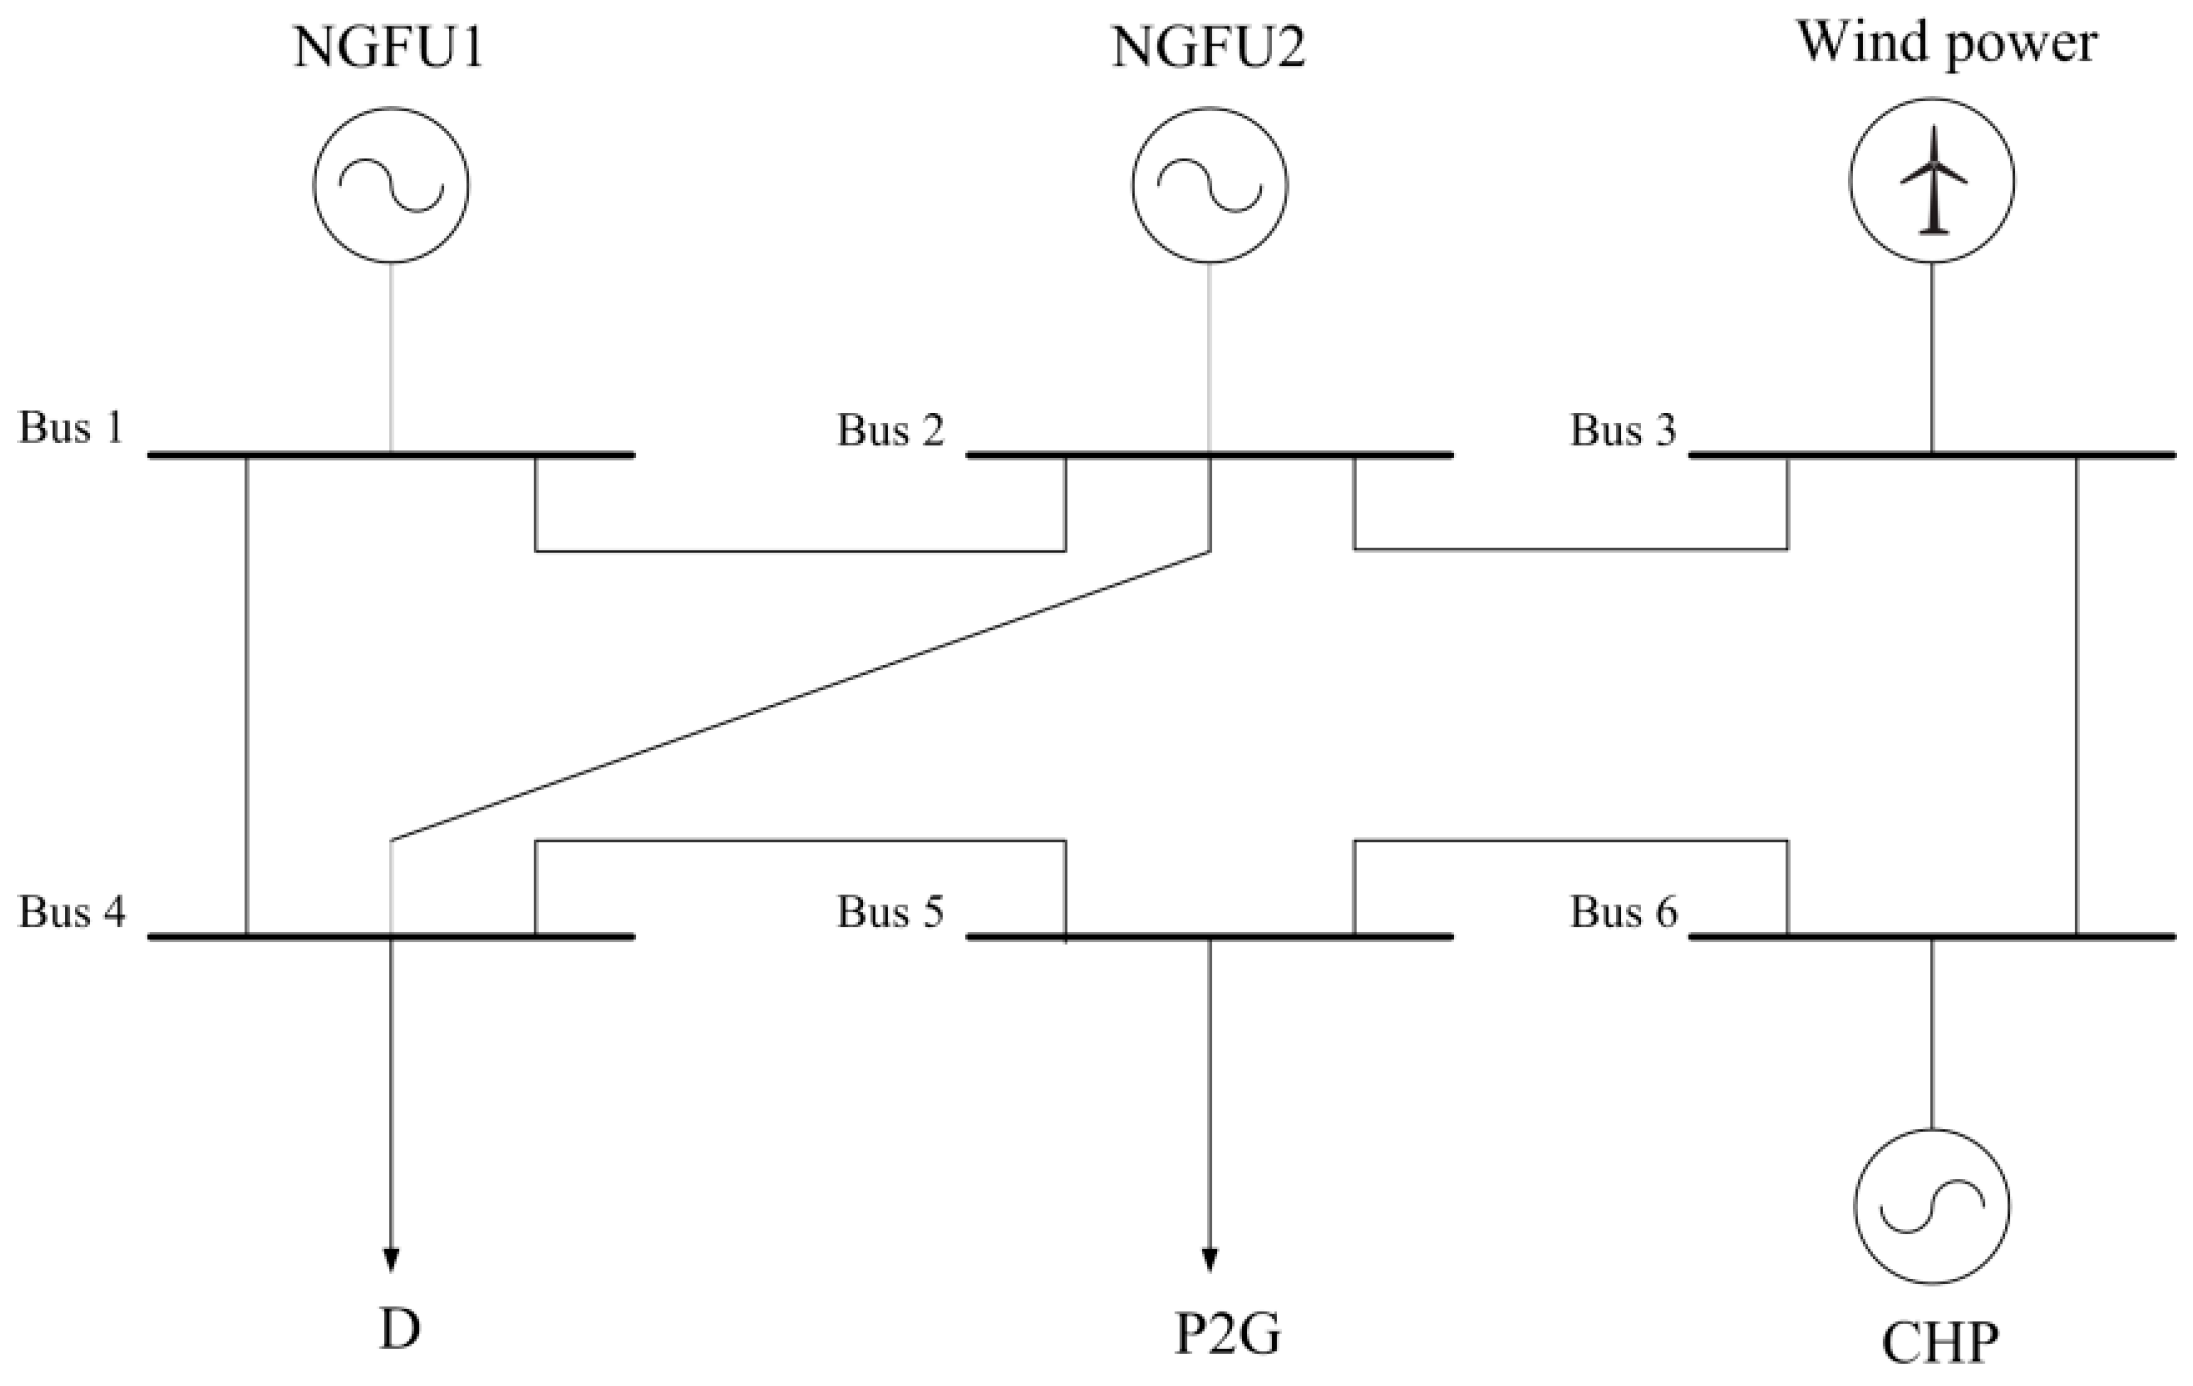
The six-bus power system [28,30], as shown in Figure 3, consists of a CHP unit, two NGFUs, a P2G plant, and a wind farm. All of the three generation units are gas-fired units. The natural gas price is 30 $/MWh [23].
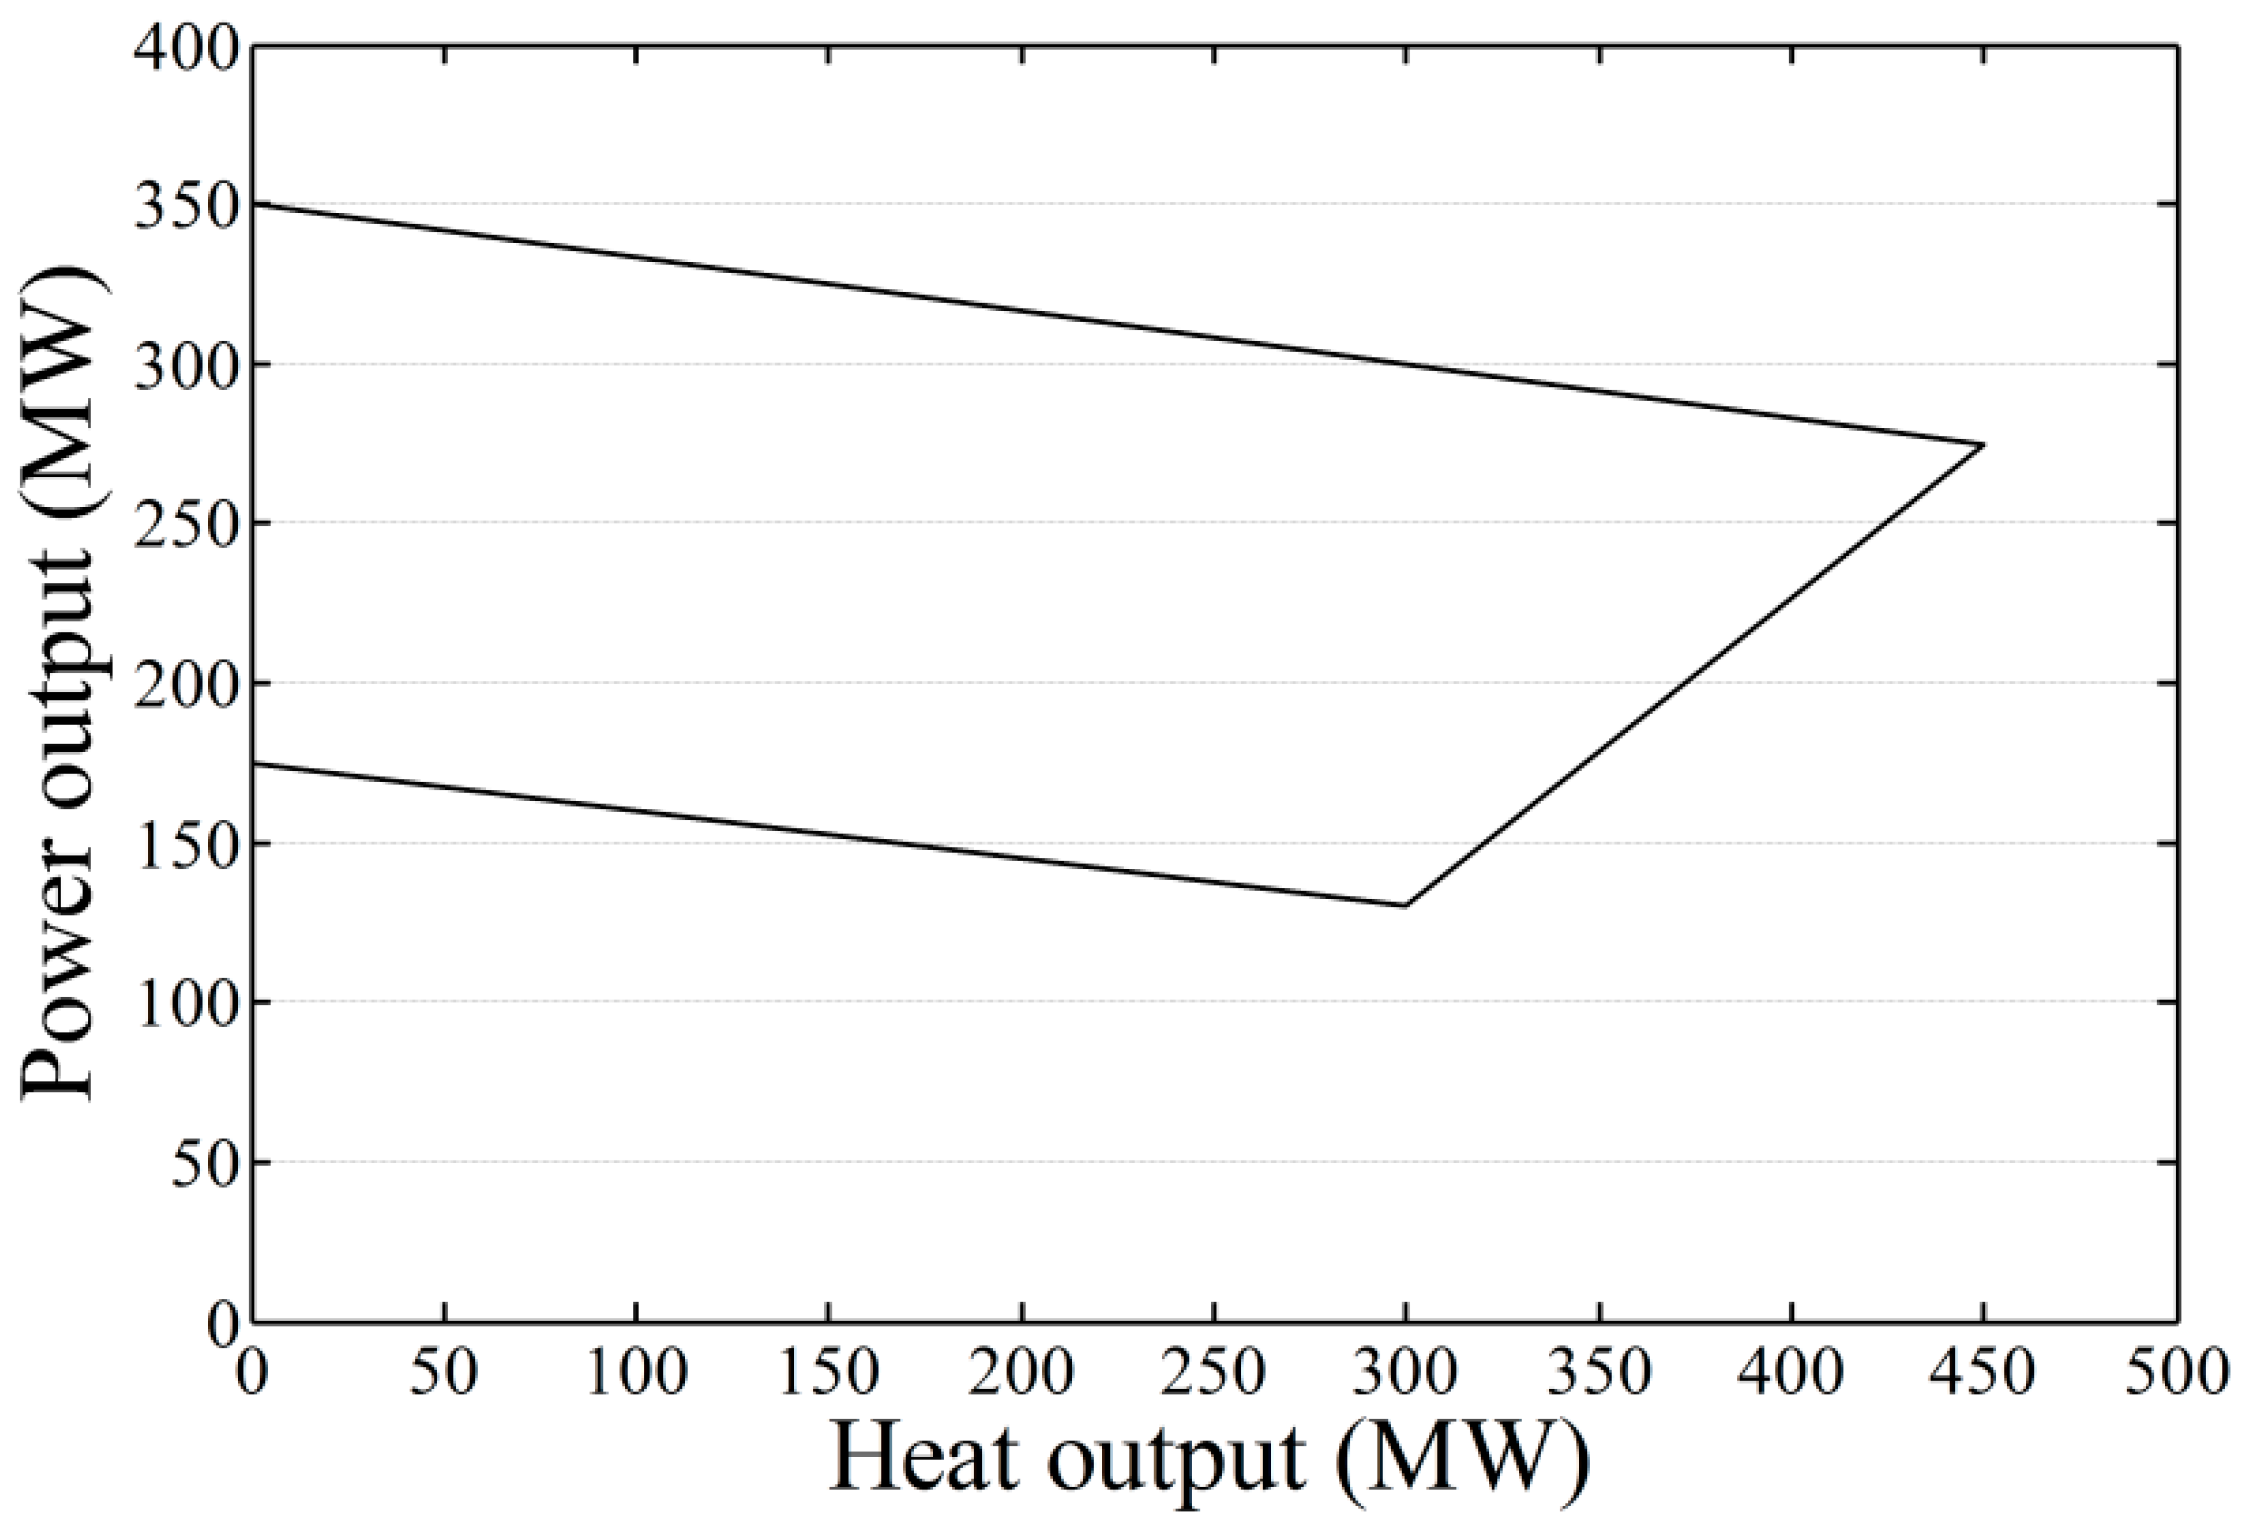
The six-node natural gas system, as depicted in Figure 4, includes two gas wells, five pipelines, and six gas loads. NGFU1, NGFU2, and the CHP unit are connected to node 1, 2, and 3, respectively. The main parameters of the power generation units are listed in Table 1 and the feasible operation region of the CHP unit is shown in Figure 5. The other three gas loads (L4, L5, L6) are fixed residential gas loads. The detailed parameters of the power and natural gas networks can be found in [21]. The difference is the parameters of the natural gas supplier and residential gas load, and they are listed in Table 2. A 40 MW P2G plant is connected to node 5. The efficiency of P2G is set to 65% for natural gas production.
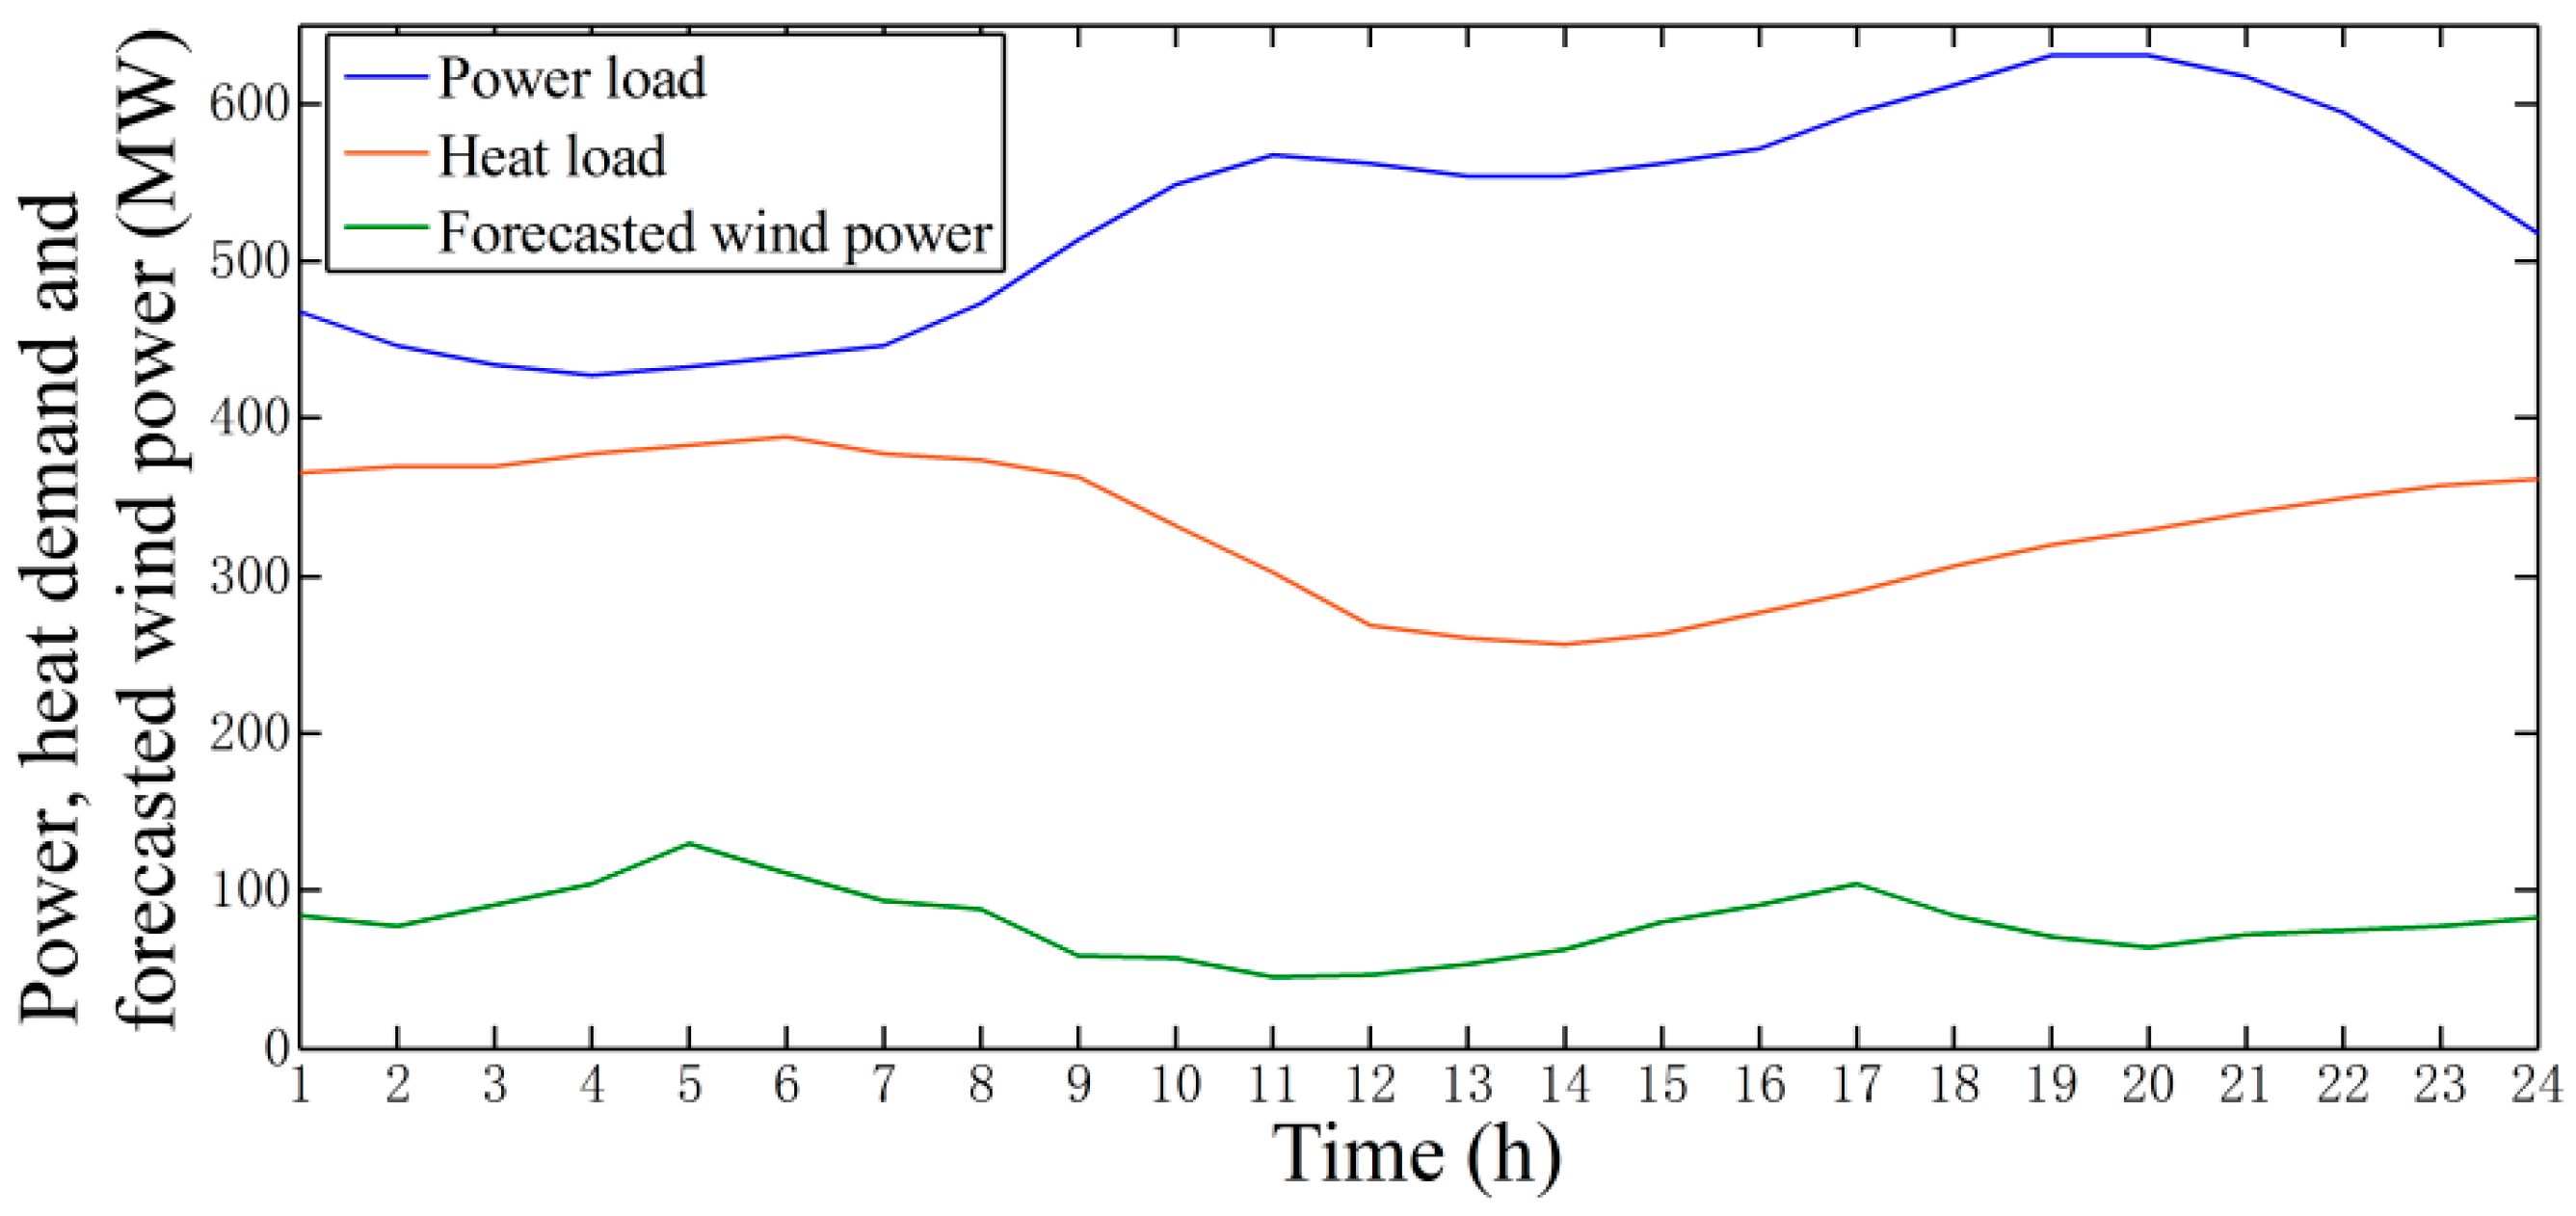
The profiles of power, heat demand, and forecasted wind power are shown in Figure 6. The heat demand can be increased or decreased by 10% of the original heat load. The district heating control of individual heat consumption is not considered in this paper. The simulations are considered for the hourly generation dispatch over 24 h. All of the simulations were implemented in MATLAB R2013a and solved by Gurobi 6.5 on a computer with two Inter Core i5 CPU (2.5 GHz) and 4.0 GB RAM.
5.2. Scenarios
To demonstrate the feasibility and effectiveness of the proposed model, three scenarios are presented:
Scenario 1: Dispatch model is formulated without considering the natural gas system constraints and P2G.
Scenario 2: Dispatch model is formulated considering the natural gas system constraints, but the P2G process is not integrated.
Scenario 3: Both the natural gas system constraints and P2G process are integrated to the dispatch model.
5.3. Results and Analysis
5.3.1. Necessity of Considering Natural Gas System Constraints
The hourly power dispatch results of the CHP unit and NGFU1 in Scenario 1 and Scenario 2 are shown in Figure 7. It can be observed that the power outputs of the CHP unit in the first eight hours are the same in the two scenarios, but at other times, the power outputs in Scenario 2 are less than those in Scenario 1. However, for NGFU1, the results are the opposite and the outputs increase, even in the off-peak hour (at 6:00). The power outputs of NGFU2 have not changed, but the wind power curtailment rate increases from 23.1% to 24.0%. The reason for this lies in the power outputs of the CHP unit between 9:00 and 24:00 in Scenario 2, which are restricted by natural gas transmission and supply constraints. This part of the power is substituted by NGFU1, which has a wider natural gas transmission and supply margin. Additionally, the increased power outputs of NGFU1 hinder part of the wind power integration.
The daily operation costs in these two scenarios are $351,360 and $352,730, respectively. The reason for this lies in the fact that NGFU1 is more frequently dispatched in Scenario 2, but it costs more compared with the CHP unit. The substituted power production by NGFU1 increases the total fuel cost.
Thus, it can be concluded that the natural gas system constraints influence the operation results and must be taken into account in the dispatch model.
5.3.2. Effect of P2G on Wind Power Curtailment, Fuel Cost, and CO2 Emission
The power dispatch results of the wind power and P2G in Scenario 2 and 3 are depicted in Figure 8. It can be seen that in Scenario 2, the wind power is largely curtailed during the periods when the power demand is low and the heat demand is high. In Scenario 3, the integration of P2G largely promotes the wind power accommodation, decreasing the curtailment rate of the wind power from 24.0% to 9.7%. The reason for this is that the P2G utilizes the surplus wind power to produce natural gas, creating an extra margin for wind accommodation in the off-peak hours.
A comparison of the dispatch results in these two scenarios is summarized in Table 3. It can be observed that the operation cost of the integrated energy system decreases from Scenario 2 to 3. The P2G plant utilizes the free wind power to produce natural gas which can be used later for re-electrification, thereby decreasing the total fuel cost. The daily wind power energy consumed by P2G reaches 256 MWh. Moreover, according to [23], the CO2 emission reduction factor is 180 kg/MWh. Thus, the daily CO2 emission reduction reaches 46,080 kg.
Therefore, it can be indicated that the introduction of P2G will promote wind power integration, and reduce the fuel cost and CO2 emissions of the integrated energy system.
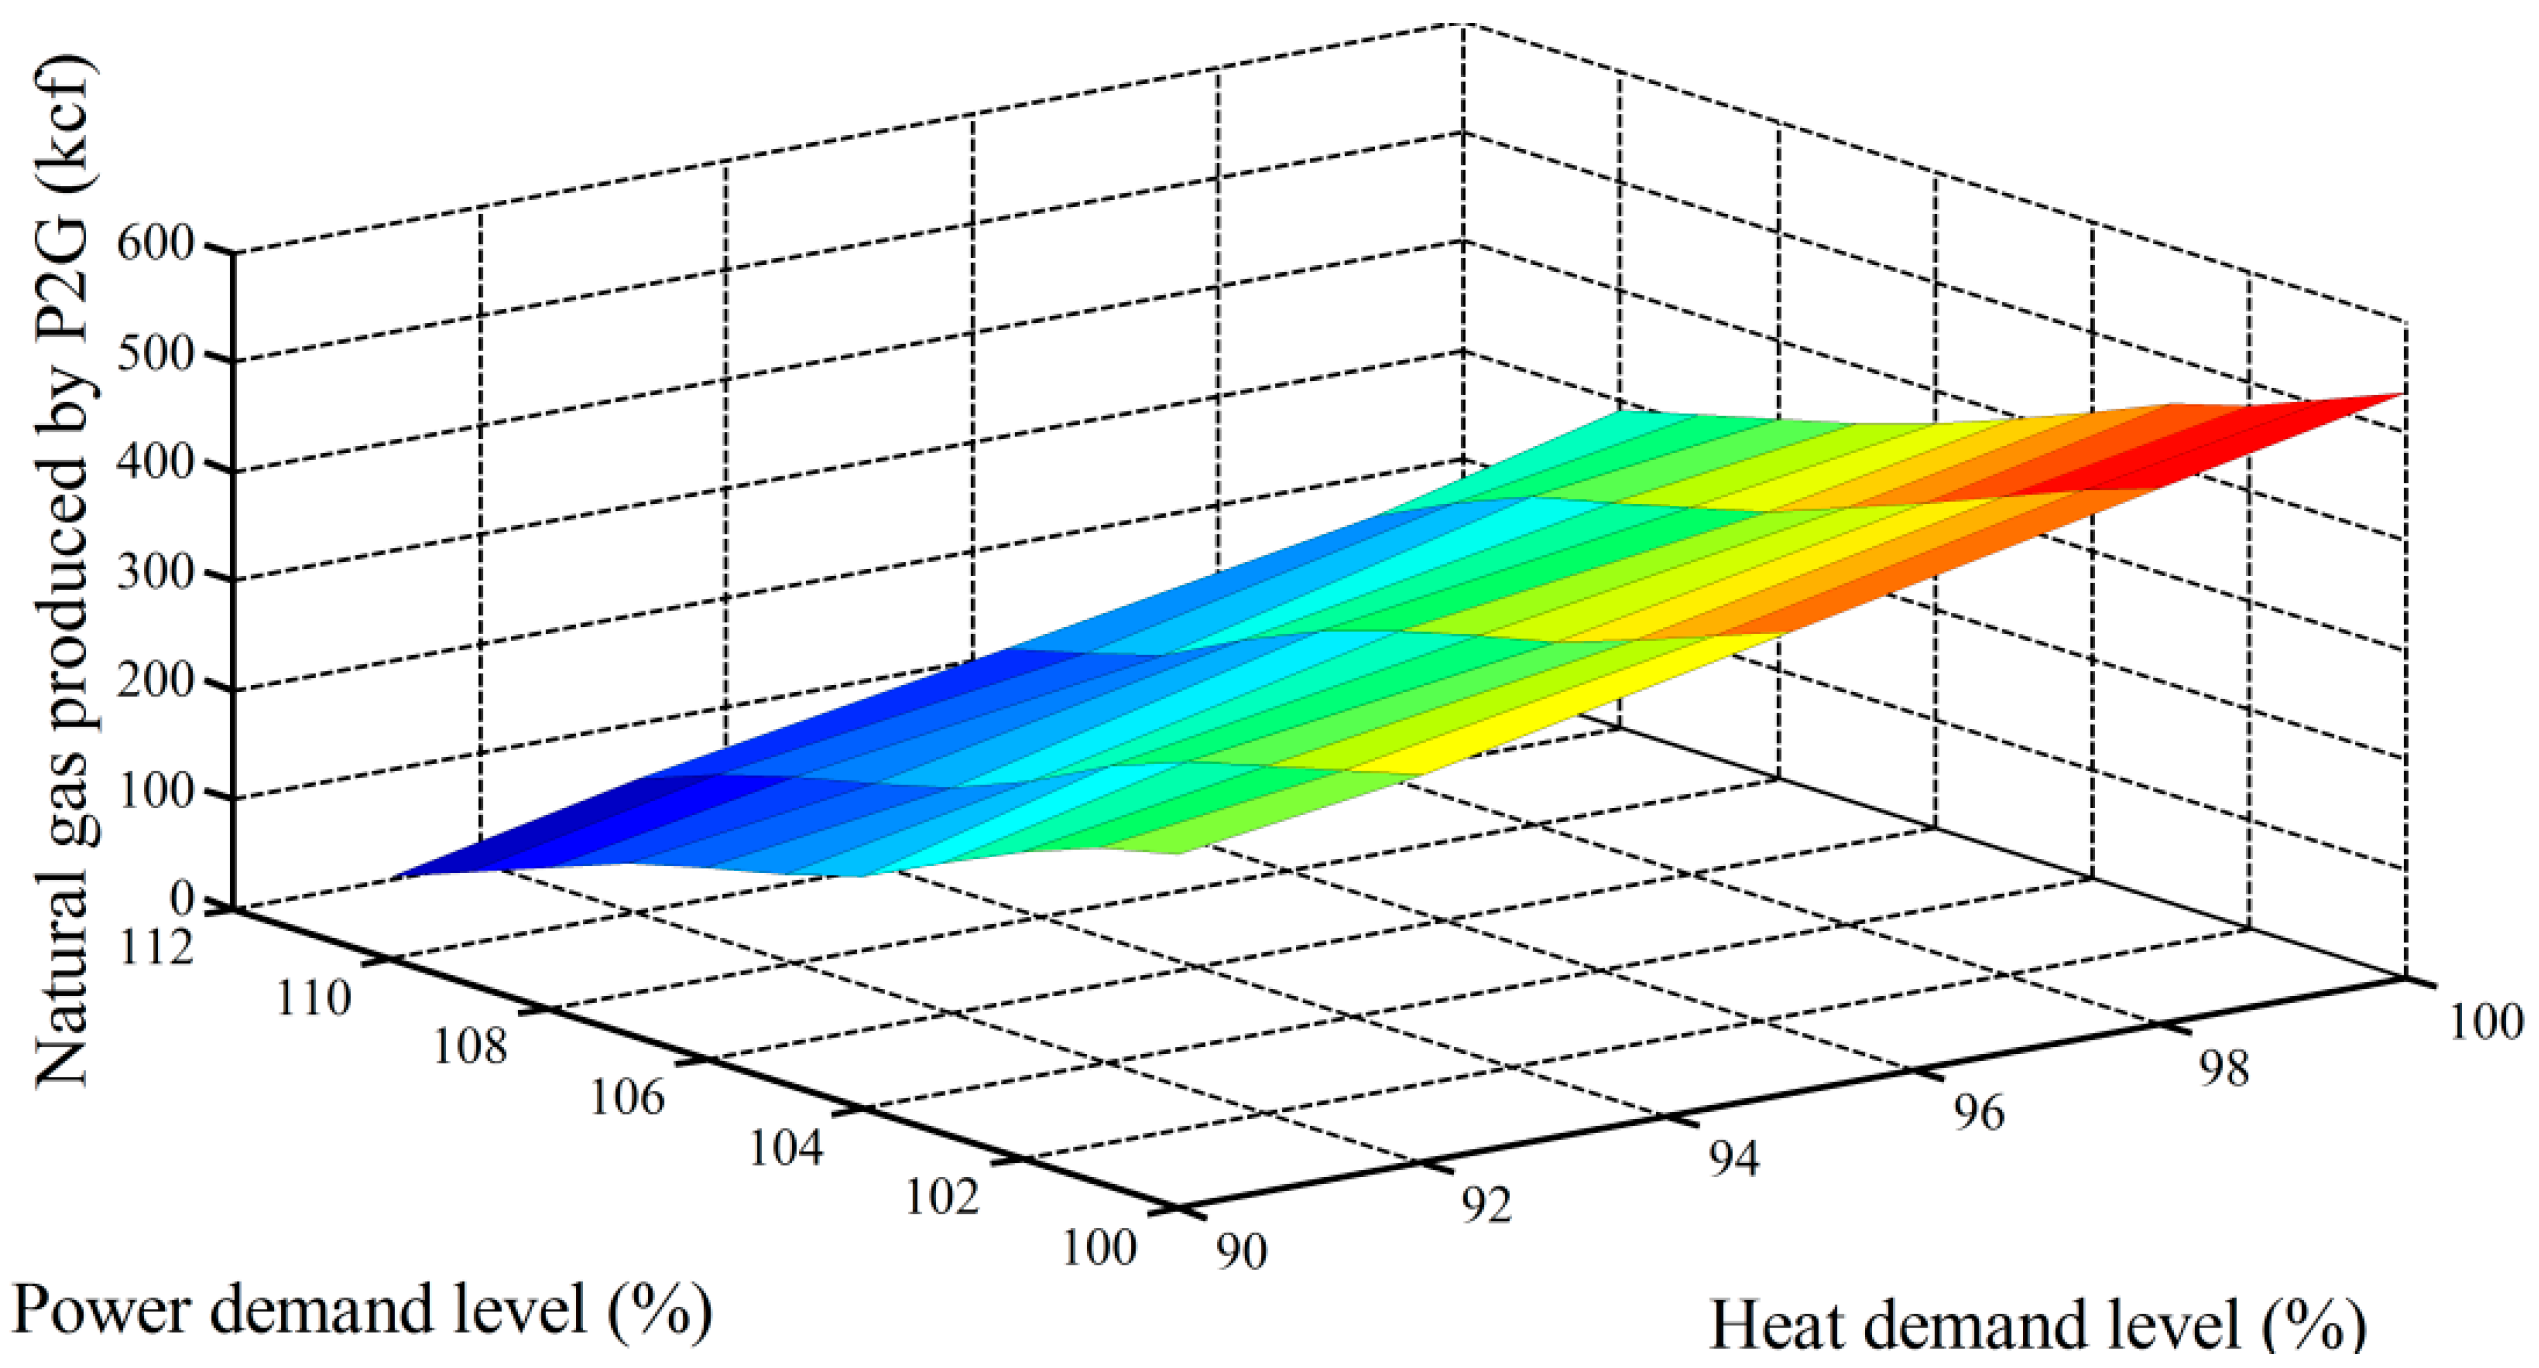
5.3.3. Impact of Power and Heat Demand on P2G
In order to explore the impact of power and heat demand on P2G, the natural gas production of P2G under different power and heat demand levels is investigated. As shown in Figure 9, P2G tends to generate more natural gas when the power demand is lower and the heat demand is higher. It can be attributed to the energy storage capability of P2G: when the heat demand is high and the power demand is low, the heat and power production of the CHP units are deeply coupled. This leads to a high wind energy curtailment. By means of P2G, the surplus wind power will be utilized to produce gas fuel that can be stored in the existing natural gas networks and then be injected back into the power system through gas-fired generators. Thus, it can be indicated that P2G has the potential to increase the flexibility of the integrated energy system.
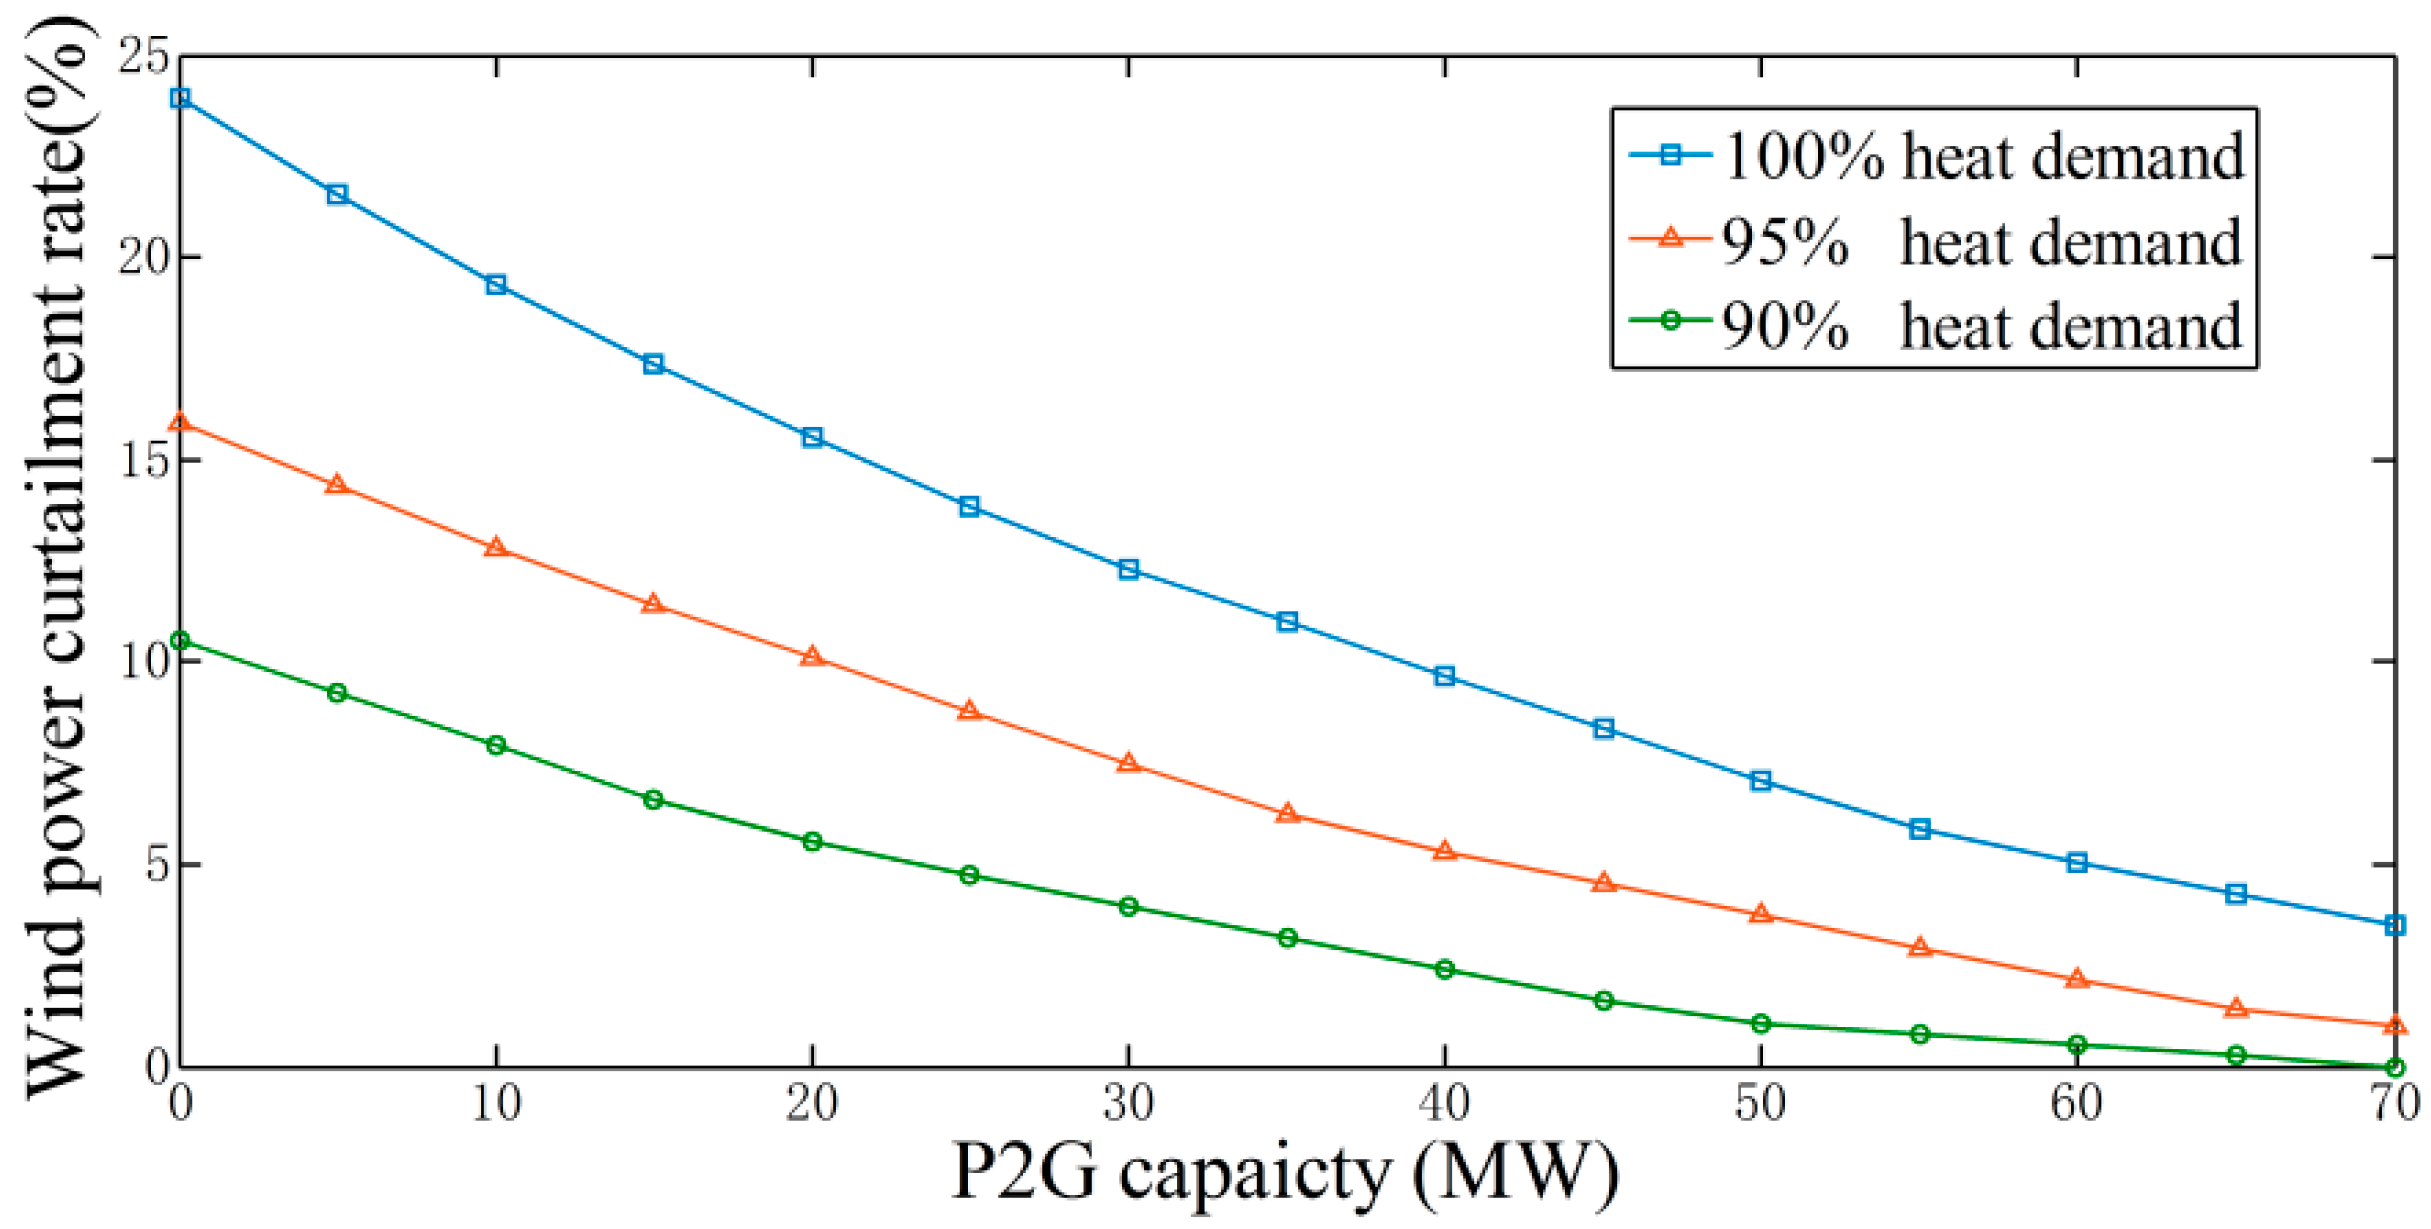
5.3.4. Impact of P2G Capacity on Wind Power Integration
The impact of different P2G capacities on wind power integration is investigated in Scenario 3. P2G capacities varying from 0 MW to 70 MW are integrated to the integrated energy system to accommodate the otherwise curtailed wind power. The effects of P2G in reducing the wind curtailment rate are investigated at three different heat demand levels: 90%, 95%, and 100% of the original heat demand. As shown in Figure 10, the wind curtailment rate declines with the increasing capacity of P2G, independent of the heat demand level. However, there exhibits a declining marginal effect of increased P2G capacity on reducing wind power curtailments. The reason for this lies in the fact that when the P2G capacity increases, the available free wind power is nearly used up, resulting in a declining benefit.
5.3.5. Robust Optimization Result
In this section, the uncertainties of the wind power, power demand, and heat demand are considered. For simplicity, the maximum downward/upward deviation levels from the forecasted values are set to ±5%, ±2%, and ±2% for wind power, power demand, and heat demand, respectively. The robust optimization result is shown in Table 4.
Compared to the deterministic result, the fuel cost increases while the wind power consumed by P2G decreases, which is attributed to the uncertainties of the wind power, power demand, and heat demand. However, the fuel cost in Scenario 3 is still less than that in Scenario 2. This result reveals the feasibility of the proposed method when the uncertainties are considered.
6. Conclusions
In this paper, an INGHPD model that balances natural gas, heat, and power demands with energy sources including a CHP unit, NGFUs, wind power, and P2G unit is proposed. The natural gas system constraints are introduced to the dispatch model and the results show that the security constraints of the natural gas system influence the dispatch results and should be taken into account in the operation optimization.
P2G is used as a power load to consume surplus wind power and convert electricity to natural gas for a later use. The effects of P2G in the integrated natural gas, heat, and power system are investigated and the results show that P2G could largely promote wind power accommodation, as well as reduce the fuel cost and CO2 emissions. With the introduction of 40 MW P2G in the deterministic model, the wind power curtailment rate decreases from 24.0% to 9.7%. The daily wind power energy consumed by P2G reaches 256 MWh. Moreover, the daily fuel cost and CO2 emissions reduction reach 516$ and 46,080 kg in the integrated energy system, respectively. In addition, the impact of the power and heat demand on the output of P2G and the impact of P2G capacity on the wind power curtailment are also investigated. P2G tends to generate more natural gas when the power demand is low and the heat demand is high. With the increase of P2G capacity, the wind curtailment rate declines, but exhibits a declining marginal effect.
Based on the proposed INGHPD model, many interesting issues could be further investigated. For instance, P2G facility can be used to relieve the power transmission limitations by consuming the power at certain nodes and transforming the energy by the natural gas system. Additionally, P2G can be utilized to produce natural gas at vulnerable nodes in the natural gas system, which could reduce the natural gas congestions. Utilizing the produced natural gas to directly generate heat and help decouple the heat and power production of CHP will also be analyzed in our future work.
Acknowledgments
This work was supported by the research funding of School of Electrical Engineering, Wuhan University. This sponsorship is gratefully acknowledged.
Author Contributions
Jun Ye and Rongxiang Yuan conceived and designed the experiments; Jun Ye performed the experiments; Jun Ye and Rongxiang Yuan analyzed the data; Jun Ye wrote the paper.
Conflicts of Interest
The authors declare no conflict of interest.
Nomenclature
| Index Sets: | |
| Index set of CHP units | |
| Index set of gas supplies | |
| Index set of natural gas loads | |
| Index set of buses | |
| Index set of gas nodes connected with m | |
| Index set of P2G units | |
| Index set of NGFUs | |
| Index set of wind power units | |
| Uncertainty set of available wind power | |
| Uncertainty set of power demand | |
| Uncertainty set of heat demand | |
| T | Index set of dispatch time steps |
| J | Index set of extreme characteristic points |
| Input Parameters and Functions: | |
| , , | Power production, heat production and gas consumption cost of extreme characteristic point j |
| Gas consumption cost of CHP i at time t | |
| / | Lower/upper limit of gas supplier i |
| Lower/upper limit of gas load i | |
| Pipeline constant | |
| Lower/upper limit of nodal pressure | |
| Lower bound of gas flow in the pipeline | |
| Gas flow of block l | |
| Slope of block l | |
| Lower limit of block l of piecewise linear function | |
| A/B | Node-gas supplier/load incidence matrix |
| Conversion efficiency of P2G unit i | |
| Capacity of P2G unit i | |
| Higher heating value of natural gas (39.5 MJ/m3) | |
| / | Maximum downward/upward ramping rate of P2G unit i |
| Power plant efficiency of NGFU unit i | |
| Natural gas cost of NGFU unit i at time t | |
| Price of natural gas | |
| Forecasted power demand of the system at time step t | |
| / | Minimum/maximum power output of NGFU unit i |
| / | Maximum downward/upward ramping rate of unit i |
| Forecasted wind power at time t | |
| Forecasted heat demand of the system at time t | |
| Power load at bus n at time t | |
| Transmission capacity limit of line l | |
| / | System upward/downward spinning reserve capacity requirement |
| Power transfer distribution factor from bus n to line l | |
| / | Maximum downward/upward deviation of wind power from the forecasted value |
| / | Maximum downward/upward deviation of power demand from the forecasted value |
| / | Maximum downward/upward deviation of heat demand from the forecasted value |
| Decision Variables: | |
| Power production of thermal power unit i at time t | |
| Heat production of thermal power unit i at time t | |
| Wind power integrated to the power system at time t | |
| Combination coefficient of extreme characteristic point j | |
| Gas supply of node i at time t | |
| Gas load of node i at time t | |
| Gas flow between node m and n | |
| / | Pressure of node m/n |
| Energy content of produced natural gas from P2G unit i at time t | |
| Volumetric quantity of natural gas produced by P2G i at time t | |
| Consumed electric power of P2G unit i at time t | |
| Uncertain Parameters: | |
| Actual available wind power of wind farm i at time t | |
| Actual power demand at time t | |
| Actual heat demand at time t | |
References
- Feng, Y.; Lin, H.Y.; Ho, S.L.; Yanc, J.H.; Dong, J.N.; Fang, S.H.; Huang, Y.K. Overview of Wind Power Generation in China: Status and Development. Renew. Sustain. Energy Rev. 2015, 50, 847–858. [Google Scholar] [CrossRef]
- Madlener, R.; Schmid, C. Combined Heat and Power Generation in Liberalised Markets and a Carbon-Constrained World. GAIA-Ecol. Perspect. Sci. Soc. 2003, 12, 114–120. [Google Scholar]
- Jiang, L.P.; Wang, C.X.; Huang, Y.H.; Pei, Z.Y.; Xin, S.X.; Wang, W.S.; Ma, S.; Brown, T. Growth in Wind and Sun Integrating Variable Generation in China. IEEE Power Energy Mag. 2015, 13, 40–49. [Google Scholar] [CrossRef]
- Cong, L.; Shahidehpour, M.; Zuyi, L.; Fotuhi-Firuzabad, M. Component and Mode Models for the Short-Term Scheduling of Combined-Cycle Units. IEEE Trans. Power Syst. 2009, 24, 976–990. [Google Scholar] [CrossRef]
- Shahidehpour, M.; Yong, F.; Wiedman, T. Impact of Natural Gas Infrastructure on Electric Power Systems. Proc. IEEE 2005, 93, 1042–1056. [Google Scholar] [CrossRef]
- Li, T.; Eremia, M.; Shahidehpour, M. Interdependency of Natural Gas Network and Power System Security. IEEE Trans. Power Syst. 2008, 23, 1817–1824. [Google Scholar] [CrossRef]
- Zhang, N.; Lu, X.; McElroy, M.B.; Nielsen, C.P.; Chen, X.; Deng, Y.; Kang, C. Reducing Curtailment of Wind Electricity in China by Employing Electric Boilers for Heat and Pumped Hydro for Energy Storage. Appl. Energy 2015, 184, 987–994. [Google Scholar] [CrossRef]
- De Boer, H.S.; Grond, L.; Moll, H.; Benders, R. The Application of Power-to-gas, Pumped Hydro Storage and Compressed Air Energy Storage in an Electricity System at Different Wind Power Penetration Levels. Energy 2014, 72, 360–370. [Google Scholar] [CrossRef]
- Reiter, G.; Lindorfer, J. Global Warming Potential of Hydrogen and Methane Production from Renewable Electricity via Power-to-gas Technology. Int. J. Life Cycle Assess. 2015, 20, 477–489. [Google Scholar] [CrossRef]
- Parra, D.; Patel, M.K. Techno-economic Implications of the Electrolyser Technology and Size for Power-to-gas Systems. Int. J. Hydrogen Energy 2016, 41, 3748–3761. [Google Scholar] [CrossRef]
- Qadrdan, M.; Abeysekera, M.; Chaudry, M.; Wu, J.Z.; Jenkins, N. Role of Power-to-gas in an Integrated Gas and Electricity System in Great Britain. Int. J. Hydrogen Energy 2015, 40, 5763–5775. [Google Scholar] [CrossRef]
- Schiebahn, S.; Grube, T.; Robinius, M.; Tietze, V.; Kumar, B.; Stolten, D. Power to gas: Technological Overview, Systems Analysis and Economic Assessment for a Case Study in Germany. Int. J. Hydrogen Energy 2015, 40, 4285–4294. [Google Scholar] [CrossRef]
- Estermann, T.; Newborough, M.; Sterner, M. Power-to-gas Systems for Absorbing Excess Solar Power in Electricity Distribution Networks. Int. J. Hydrogen Energy 2016, 41, 13950–13959. [Google Scholar] [CrossRef]
- Buchi, F.N.; Hofer, M.; Peter, C.; Cabalzar, U.D.; Bernard, J.; Hannesen, U.; Schmidt, T.J.; Closset, A.; Dietrich, P. Towards Re-electrification of Hydrogen Obtained from the Power-to-gas Process by Highly Efficient H-2/O-2 Polymer Electrolyte Fuel Cells. RSC Adv. 2014, 4, 56139–56146. [Google Scholar] [CrossRef]
- Correa-Posada, C.M.; Sanchez-Martin, P. Security-Constrained Optimal Power and Natural-Gas Flow. IEEE Trans. Power Syst. 2014, 29, 1780–1787. [Google Scholar] [CrossRef]
- Correa-Posada, C.M.; Sanchez-Martin, P. Integrated Power and Natural Gas Model for Energy Adequacy in Short-Term Operation. IEEE Trans. Power Syst. 2015, 30, 3347–3355. [Google Scholar] [CrossRef]
- Zhang, X.; Che, L.; Shahidehpour, M.; Alabdulwahab, A.; Abusorrah, A. Electricity-Natural Gas Operation Planning with Hourly Demand Response for Deployment of Flexible Ramp. IEEE Trans. Sustain. Energy 2016, 7, 996–1004. [Google Scholar] [CrossRef]
- Alabdulwahab, A.; Abusorrah, A.; Zhang, X.; Shahidehpour, M. Stochastic Security-Constrained Scheduling of Coordinated Electricity and Natural Gas Infrastructures. IEEE Syst. J. 2015, 3, 1–10. [Google Scholar] [CrossRef]
- Liu, C.; Lee, C.; Shahidehpour, M. Look Ahead Robust Scheduling of Wind-Thermal System with Considering Natural Gas Congestion. IEEE Trans. Power Syst. 2015, 30, 544–545. [Google Scholar] [CrossRef]
- Cong, L.; Shahidehpour, M.; Yong, F.; Zuyi, L. Security-Constrained Unit Commitment with Natural Gas Transmission Constraints. IEEE Trans. Power Syst. 2009, 24, 1523–1536. [Google Scholar] [CrossRef]
- Zhang, X.; Shahidehpour, M.; Alabdulwahab, A.; Abusorrah, A. Hourly Electricity Demand Response in the Stochastic Day-Ahead Scheduling of Coordinated Electricity and Natural Gas Networks. IEEE Trans. Power Syst. 2016, 31, 592–601. [Google Scholar] [CrossRef]
- Alabdulwahab, A.; Abusorrah, A.; Zhang, X.; Shahidehpour, M. Coordination of Interdependent Natural Gas and Electricity Infrastructures for Firming the Variability of Wind Energy in Stochastic Day-Ahead Scheduling. IEEE Trans. Sustain. Energy 2015, 6, 606–615. [Google Scholar] [CrossRef]
- Stephen, C.; Pierluigi, M. Integrated Modeling and Assessment of the Operational Impact of Power-to-Gas (P2G) on Electrical and Gas Transmission Networks. IEEE Trans. Sustain. Energy 2015, 6, 1234–1244. [Google Scholar]
- Jentsch, M.; Trost, T.; Sterner, M. Optimal Use of Power-to-Gas Energy Storage Systems in an 85% Renewable Energy Scenario. Energy Procedia 2014, 46, 254–261. [Google Scholar] [CrossRef]
- Clegg, S.; Mancarella, P. Storing Renewables in the Gas Network: Modelling of Power-to-gas Seasonal Storage Flexibility in Low-carbon Power Systems. IET Gener. Transm. Distrib. 2016, 10, 566–575. [Google Scholar] [CrossRef]
- Zeng, Q.; Fang, J.; Li, J.; Chen, Z. Steady-state Analysis of the Integrated Natural Gas and Electric Power System with Bi-directional Energy Conversion. Appl. Energy 2016, 184, 1483–1492. [Google Scholar] [CrossRef]
- Chen, X.Y.; Kang, C.Q.; Mark, O.; Xia, Q. Increasing the Flexibility of Combined Heat and Power for Wind Power Integration in China Modeling and Implications. IEEE Trans. Power Syst. 2015, 30, 1848–1857. [Google Scholar] [CrossRef]
- Li, Z.G.; Wu, W.C.; Shahidehpour, M.; Wang, J.H.; Zhang, B.M. Combined Heat and Power Dispatch Considering Pipeline Energy Storage of District Heating Network. IEEE Trans. Sustain. Energy 2016, 7, 12–22. [Google Scholar] [CrossRef]
- Yang, Y.L.; Wu, K.; Long, H.Y.; Gao, J.C.; Yan, X.; Kato, T.; Suzuoki, Y. Integrated Electricity and Heating Demand-side Management for Wind Power Integration in China. Energy 2014, 78, 235–246. [Google Scholar] [CrossRef]
- Yuan, R.; Ye, J.; Lei, J.; Li, T. Integrated Combined Heat and Power System Dispatch Considering Electrical and Thermal Energy Storage. Energies 2016, 9, 474. [Google Scholar] [CrossRef]
- Alipour, M.; Zare, K.; Mohammadi-Ivatloo, B. Short-term Scheduling of Combined Heat and Power Generation Units in the Presence of Demand Response Programs. Energy 2014, 71, 289–301. [Google Scholar] [CrossRef]
- Lahdelma, R.; Hakonen, H. An Efficient Linear Programming Algorithm for Combined Heat and Power Production. Eur. J. Oper. Res. 2003, 148, 141–151. [Google Scholar] [CrossRef]
- Li, G.; Zhang, R.; Jiang, T.; Chen, H.; Bai, L.; Cui, H.; Li, X. Optimal Dispatch Strategy for Integrated Energy Systems with CCHP and Wind Power. Appl. Energy 2017, 192, 408–419. [Google Scholar] [CrossRef]
- Miguel, C.; José, M. A Computationally Efficient Mixed-integer Linear Formulation for the Thermal Unit Commitment Problem. IEEE Trans. Power Syst. 2006, 21, 1371–1378. [Google Scholar]
- Bailera, M.; Lisbona, P.; Romeo, L.M.; Espatolero, S. Power to Gas-biomass Oxycombustion Hybrid System: Energy Integration and Potential Applications. Appl. Energy 2016, 167, 221–229. [Google Scholar] [CrossRef]
- Li, G.; Zhang, R.; Jiang, T.; Chen, H.; Bai, L.; Li, X. Security-constrained Bi-level Economic Dispatch Model for Integrated Natural Gas and Electricity Systems Considering Wind Power and Power-to-gas Process. Appl. Energy 2016, 194, 696–704. [Google Scholar] [CrossRef]
Figure 1.
Structure of an integrated natural gas, heat, and power system.
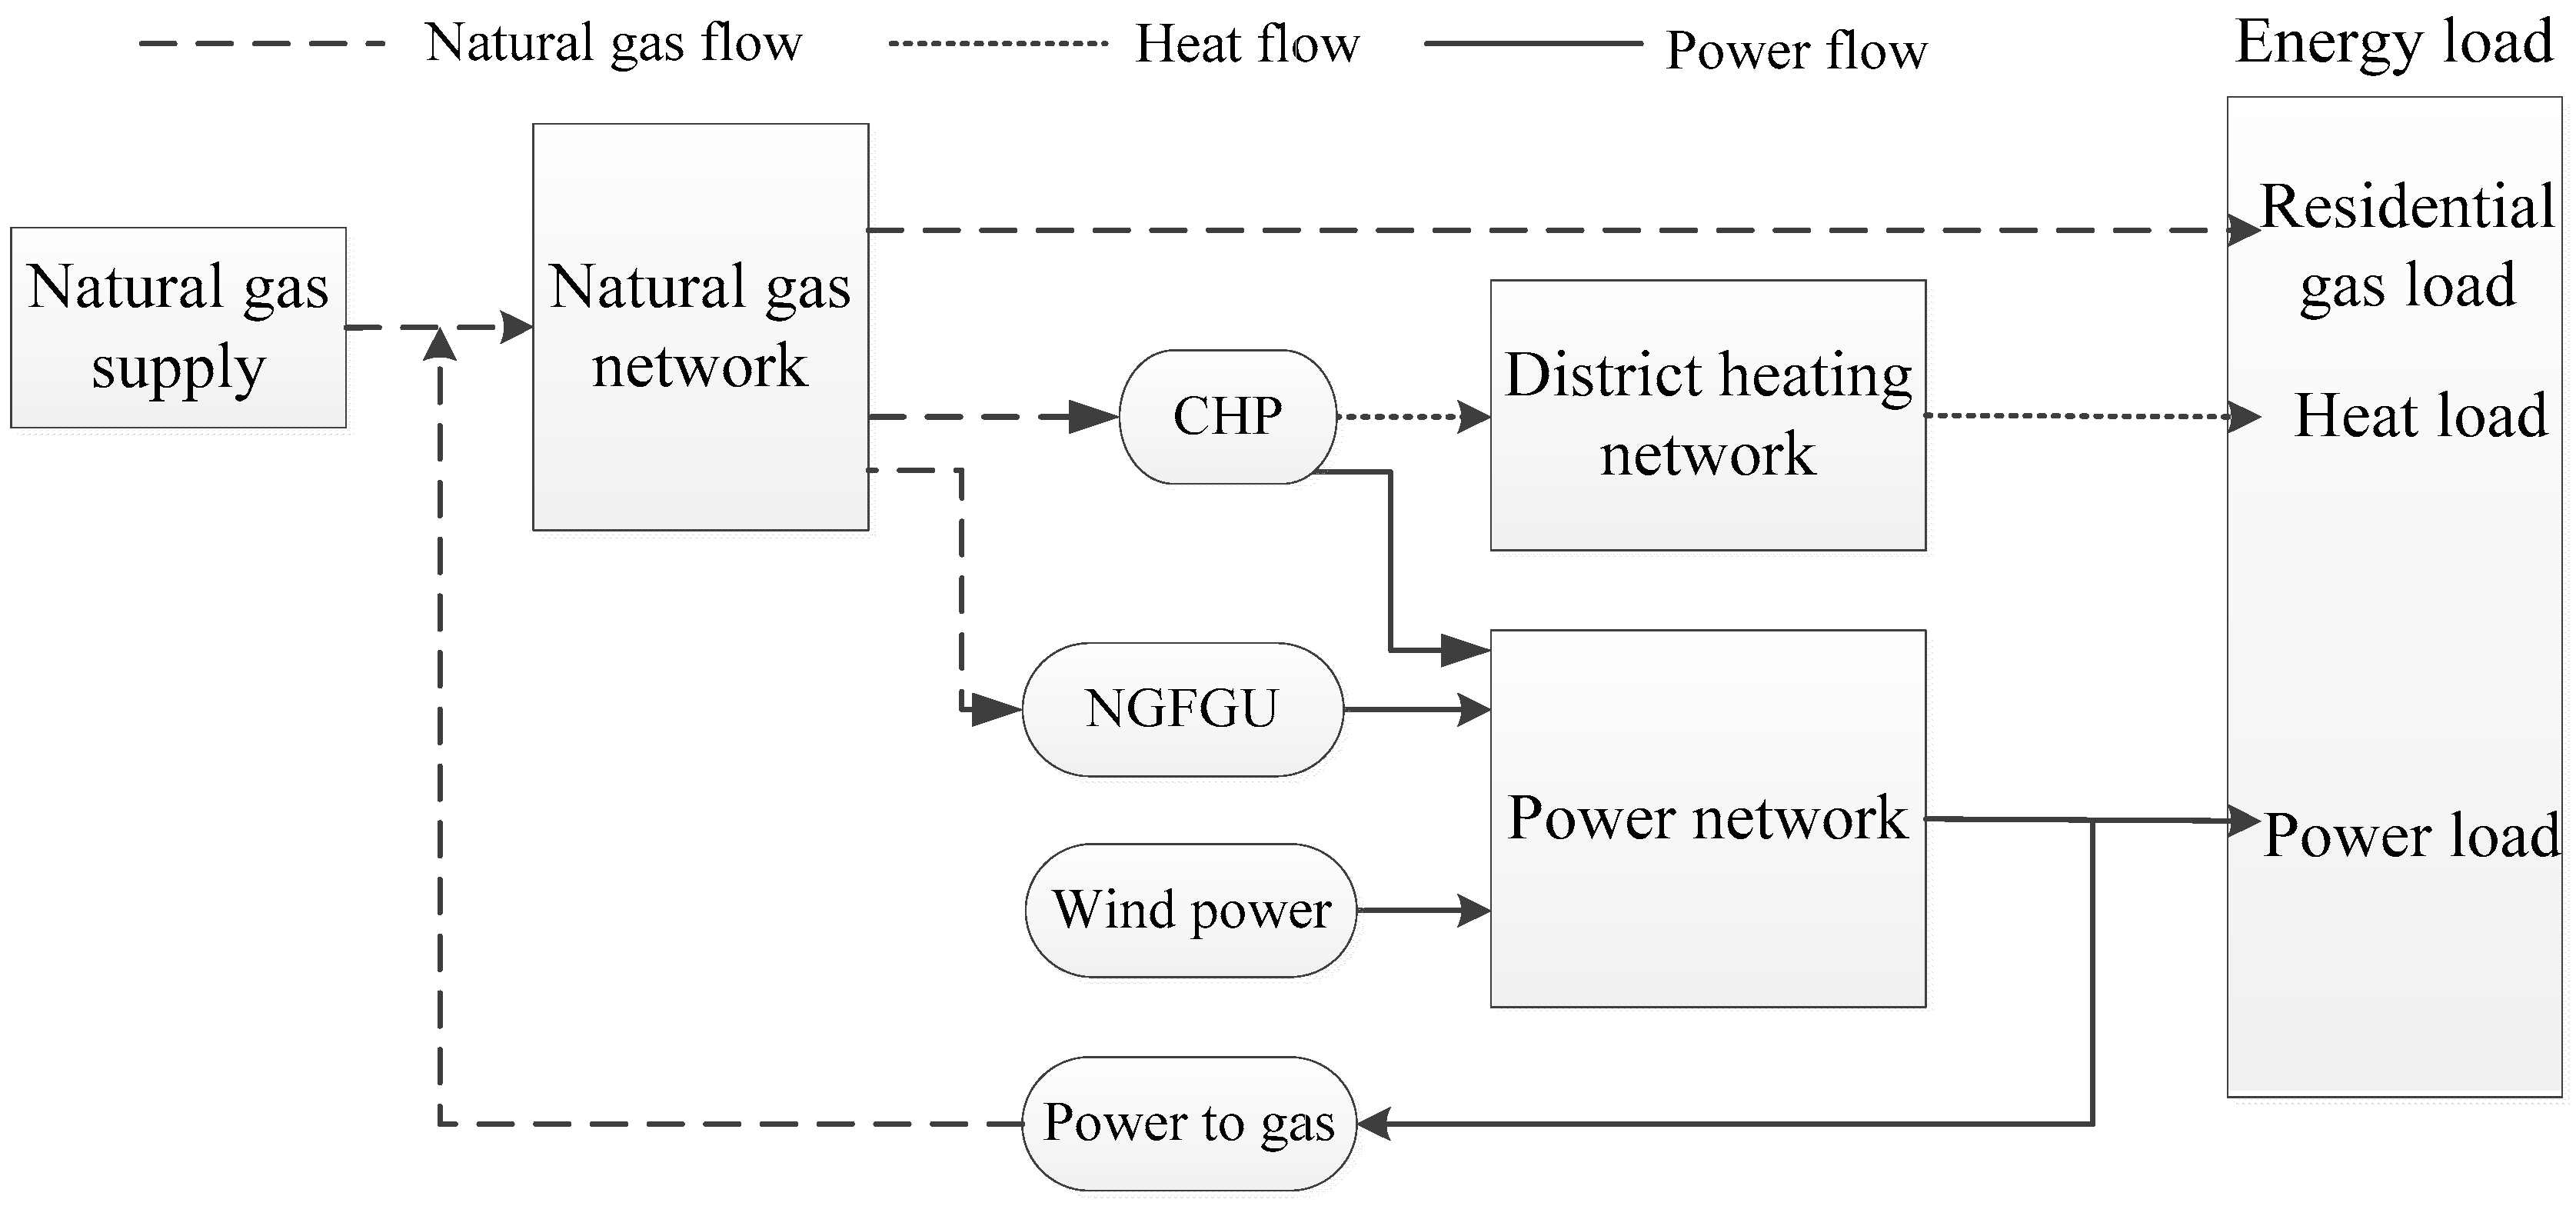
Figure 2.
Feasible operation region of a typical CHP unit.

Figure 3.
Six-bus power system.

Figure 4.
Six-node natural gas system.
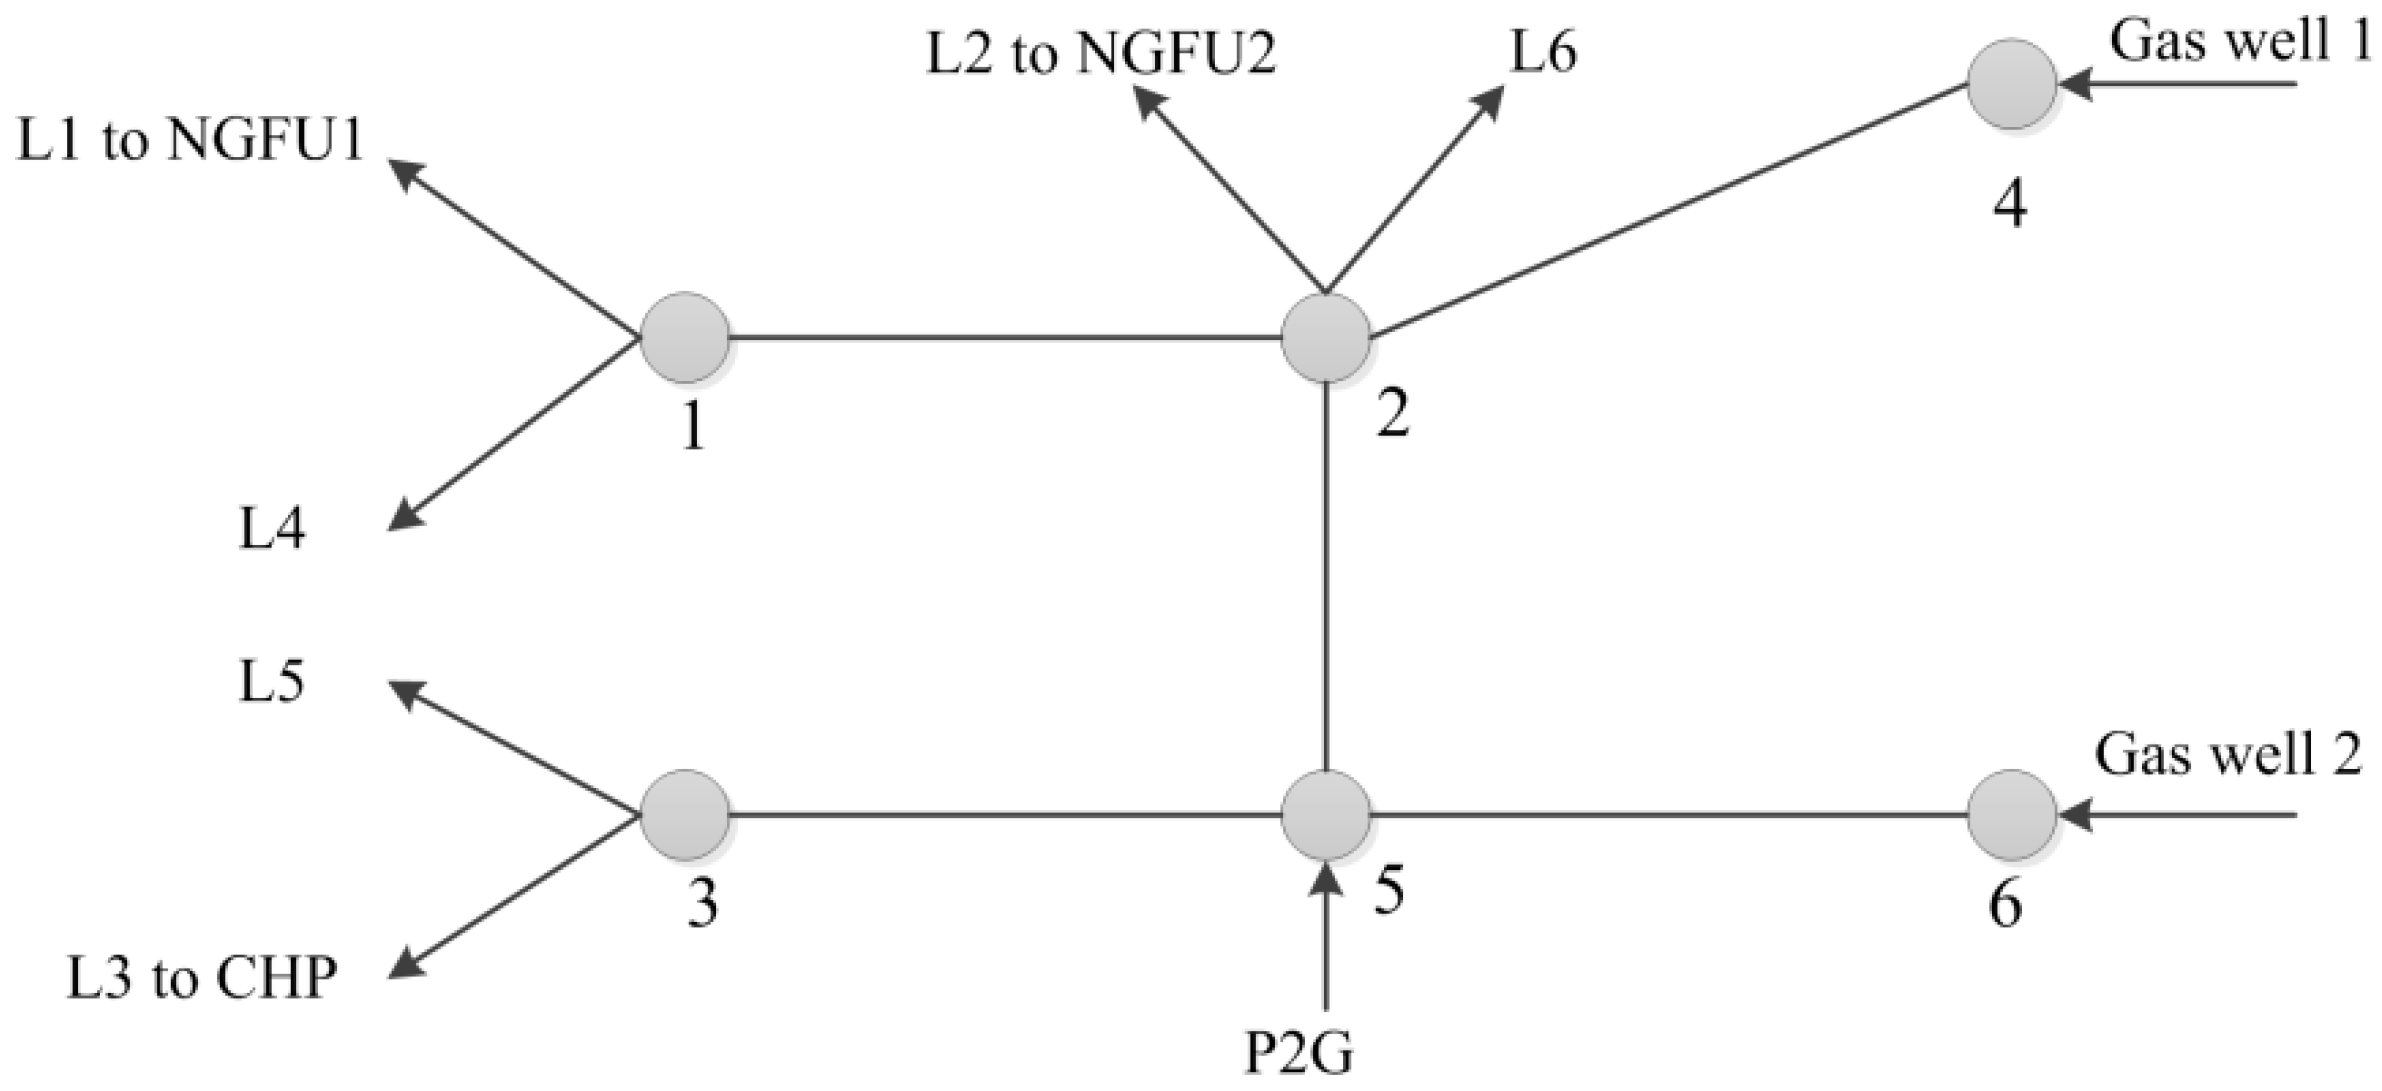
Figure 5.
Feasible operation region of the CHP unit.

Figure 6.
Profiles of power, heat demand, and forecasted wind power.

Figure 7.
Power dispatch results of (a) the CHP unit and (b) NGFU1.
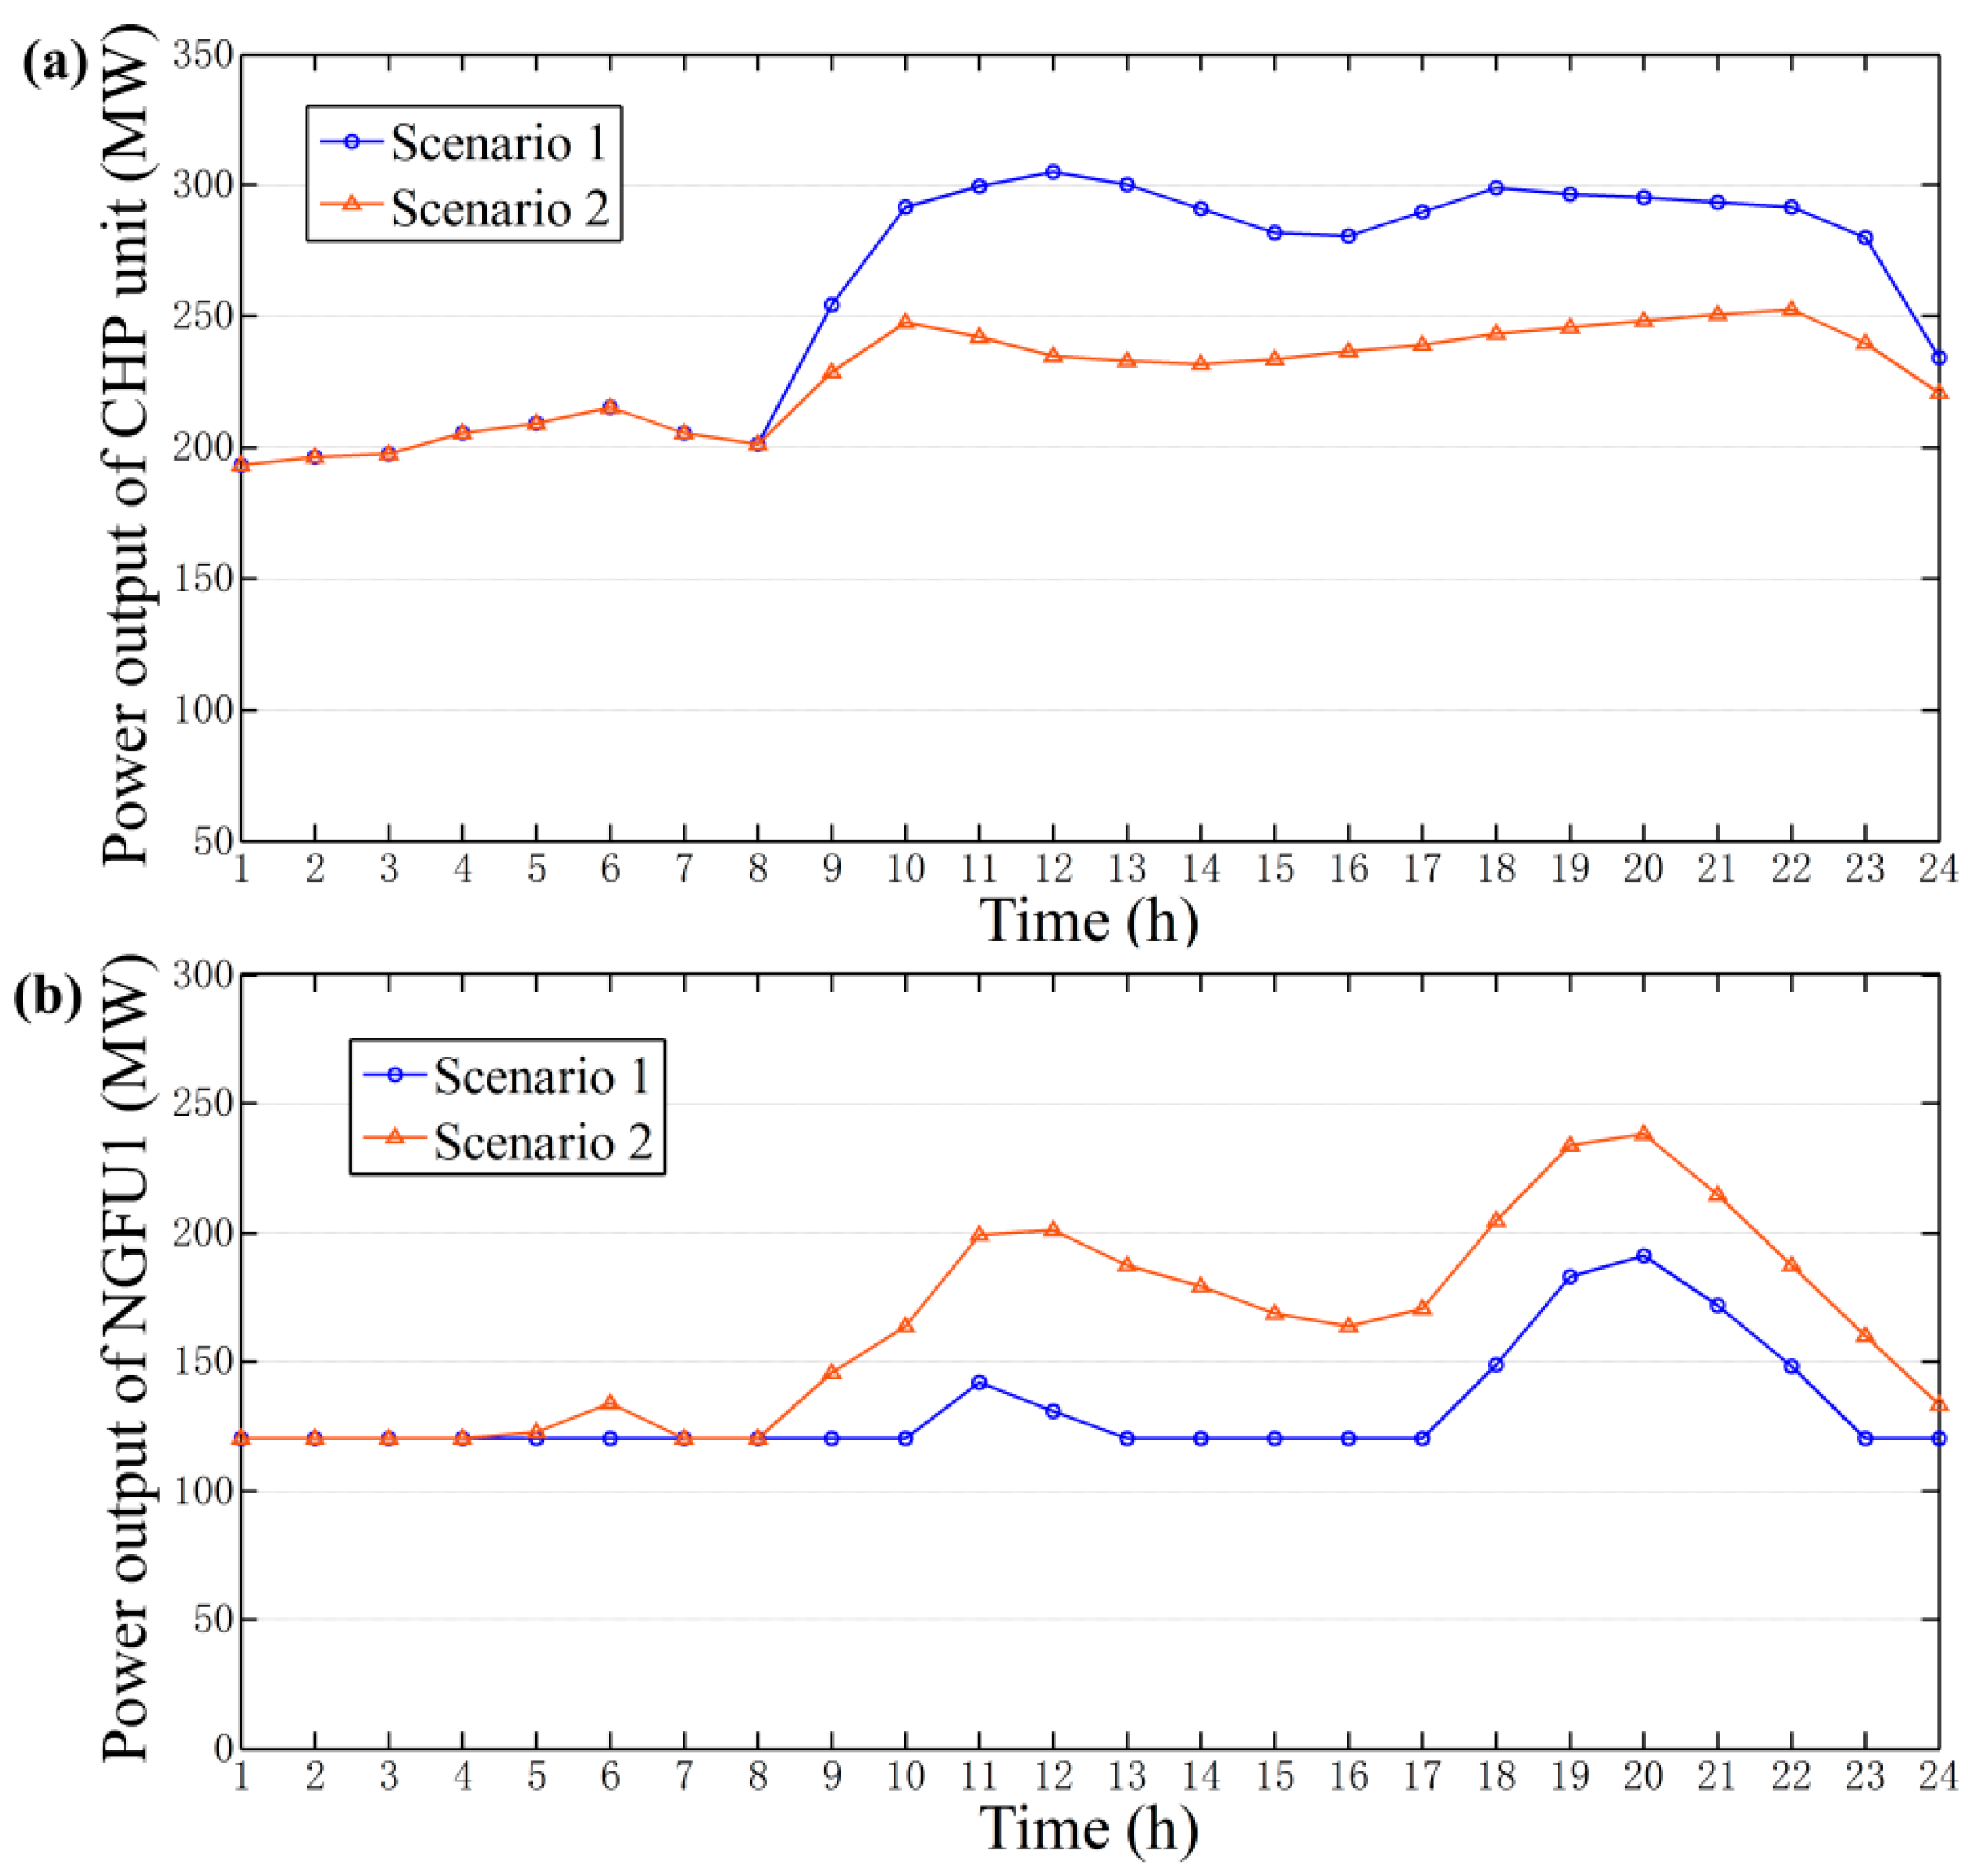
Figure 8.
Power dispatch results of the wind power and P2G in (a) Scenario 2 and (b) Scenario 3.
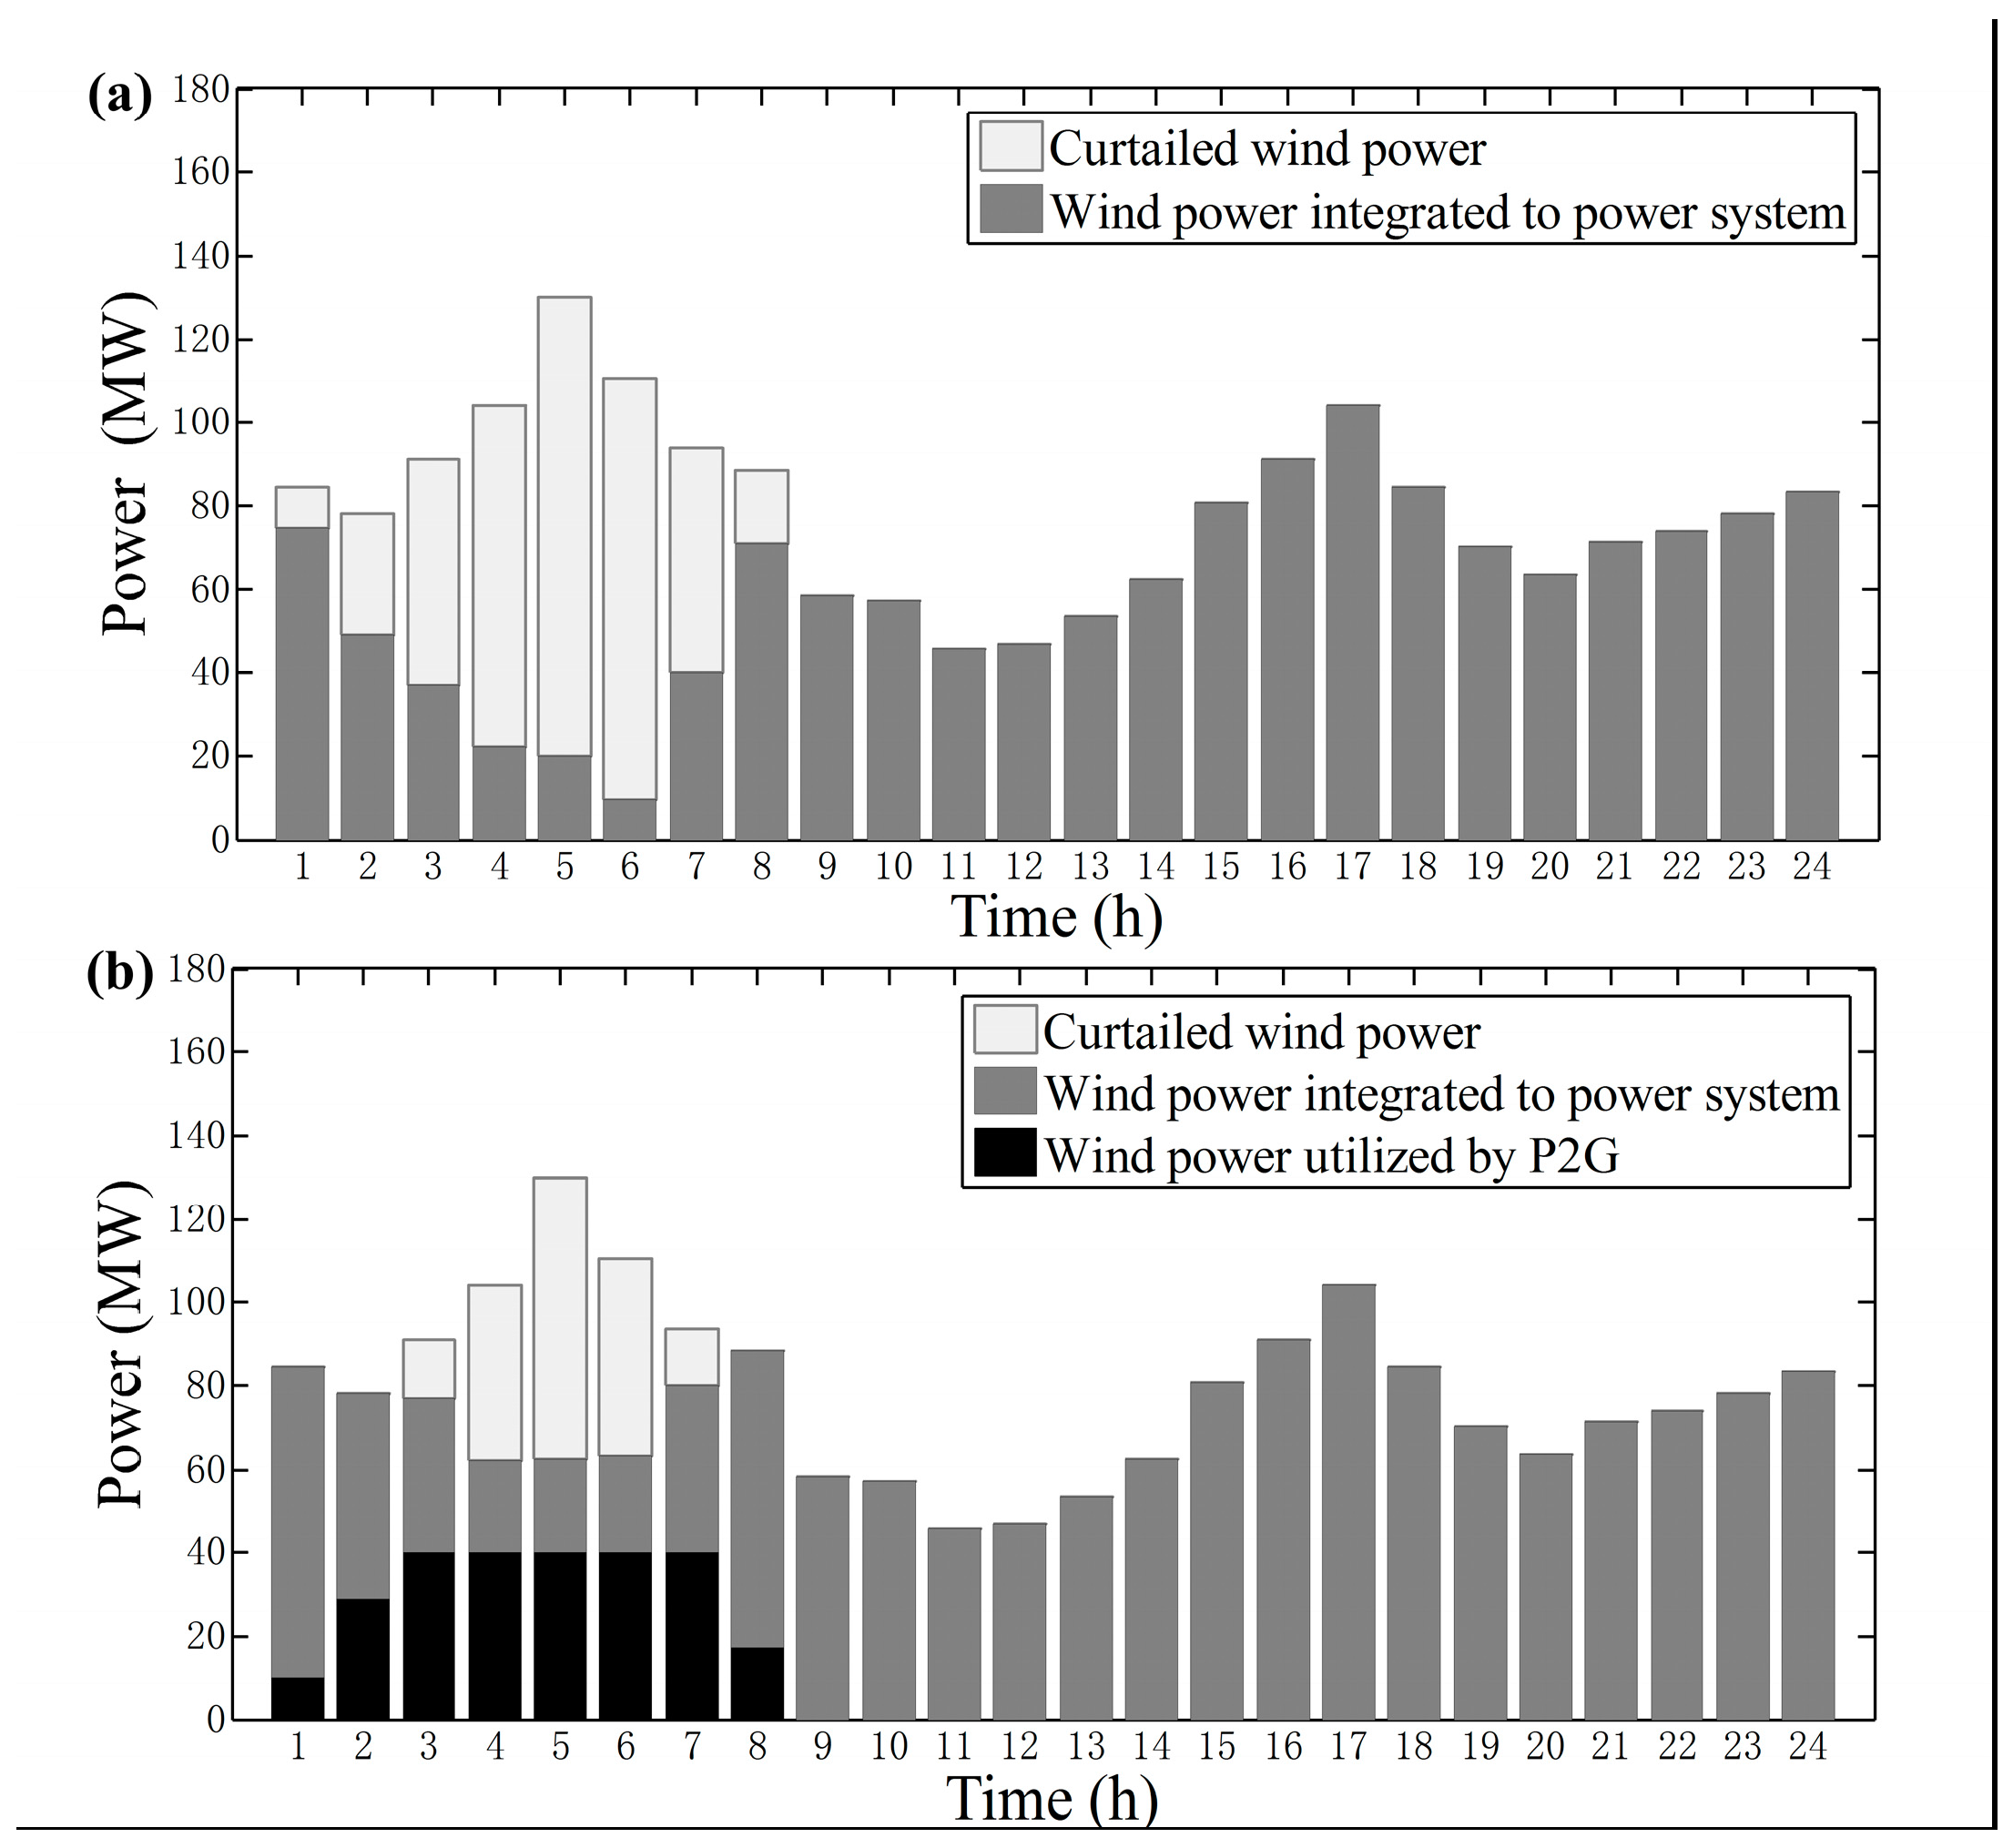
Figure 9.
Impact of the power and heat demand on the gas production of P2G.

Figure 10.
Wind power curtailment rate under different P2G capacities.


Table 1.
Main parameters of the power generation units.
| NGFU1 | NGFU1 | CHP | |
|---|---|---|---|
| Maximum power capacity (MW) | 250 | 200 | 350 |
| Minimum power output (MW) | 120 | 80 | 175 |
| Maximum heat capacity (MW) | - | - | 450 |
| Maximum ramping rate (MW/h) | 50 | 50 | 70 |
Table 2.
Parameters of the natural gas supplier and residential gas load.
| Gas Well 1 | Gas Well 2 | L4 | L5 | L6 | |
|---|---|---|---|---|---|
| Natural gas injected (kcf/h) | 1500–5000 | 2000–5000 | −2500 | −1700 | −1000 |
Table 3.
Comparison of the dispatch results under different scenarios.
| Scenario 2 | Scenario 3 | |
|---|---|---|
| Fuel cost | 352,730$ | 347,570$ |
| Wind power consumed by P2G | 0 | 256 MWh |
| Wind power curtailment rate | 24.0% | 9.7% |
Table 4.
Comparison of robust dispatch results under different scenarios.
| Scenario 2 | Scenario 3 | |
|---|---|---|
| Fuel cost | 359,420$ | 355,440$ |
| Wind power consumed by P2G | 0 | 237 MWh |
© 2017 by the authors. Licensee MDPI, Basel, Switzerland. This article is an open access article distributed under the terms and conditions of the Creative Commons Attribution (CC BY) license (http://creativecommons.org/licenses/by/4.0/).
Share and Cite
MDPI and ACS Style
Ye, J.; Yuan, R. Integrated Natural Gas, Heat, and Power Dispatch Considering Wind Power and Power-to-Gas. Sustainability 2017, 9, 602. https://doi.org/10.3390/su9040602
AMA Style
Ye J, Yuan R. Integrated Natural Gas, Heat, and Power Dispatch Considering Wind Power and Power-to-Gas. Sustainability. 2017; 9(4):602. https://doi.org/10.3390/su9040602
Chicago/Turabian StyleYe, Jun, and Rongxiang Yuan. 2017. "Integrated Natural Gas, Heat, and Power Dispatch Considering Wind Power and Power-to-Gas" Sustainability 9, no. 4: 602. https://doi.org/10.3390/su9040602
Note that from the first issue of 2016, this journal uses article numbers instead of page numbers. See further details here.