Abstract
Reducing carbon emissions is a major way to achieve green development and sustainability for China’s future. This paper elaborates the detailed features of China’s carbon flow for 2013 with the carbon flow chart and shows the changing characteristics of China’s CO2 flow from the viewpoint of specific sectors and energies from 2000 and 2013. The results show that (1) from 2000 to 2013, China’s CO2 emissions approximately grew by 9% annually, while the CO2 intensity of China diminished at different rates. (2) The CO2 emissions from the secondary industry are prominent from the perspective of four main sectors, accounting for 83.5% of emissions. Manufacturing plays an important part in the secondary industry with 45% of the emissions, in which the “smelting and pressing of metal” takes up a large percentage of about 50% of the emissions from manufacturing. (3) The CO2 emissions produced by coal consumption are dominant in energy-related emissions with a contribution of 65%, which will decrease in the future. (4) From the aspect of different sectors, the CO2 emissions mainly come from the “electricity and heating” sector and the “smelting, pressing and manufacturing of metals” sub-sector. It is essential and urgent to propose concrete recommendations for CO2 emissions mitigation. Firstly, the progression of creative technology is inevitable and undeniable. Secondly, the government should make different CO2 emissions reduction policies among different sectors. For example, the process emissions play an important role in “non-metallic minerals” while in “smelting and manufacturing of metals” it is energy emissions. Thirdly, the country can change the energy structure and promote renewable energy that is powered by wind or other low-carbon energy sources. Alternatively, coke oven gas can be a feasible substitution. Finally, policy makers should be aware that the emissions from residents have been growing at a fast rate. It is effective to involve the public in energy conservation and carbon emissions reduction, such as reducing the time of personal transportation.
1. Introduction
In the past few years, environmental problems, particularly global warming, have captured both public and academic attention from all over the world. The highly intensive emissions of greenhouse gases (GHGs) including carbon dioxide (CO2) and methane (CH4), which have been regarded as some of the most important factors for the global warming that has occurred since the Industrial Revolution, have exerted profound impacts on global ecological and social-economic systems [1]. According to the “5th Assessment Report of the Intergovernmental Panel on Climate Change (IPCC)”, the atmospheric concentration of CO2 rose to 391 mg/L by 2011, which was a 40% increase from the concentration before industrialization. The last 30 years, that is from 1983 to 2012, may be the hottest decades on record in the past 1400 years [2]. Meanwhile, China surpassed the United States in CO2 emissions in 2008, becoming the world’s largest emitter and energy consumer which forces China to face more and more pressure to control its CO2 emissions [3,4,5,6,7]. After four years, China’s CO2 emissions rapidly grew from 6.78 billion tons to 8.18 billion tons with an average annual growth rate of 4.81% [8]. The increasing numbers and upward variation tendency make it urgent and essential for policy-makers to make efforts to address this. Thus, a study about the characteristics and variation trends of current carbon emissions in China is extremely necessary. Identifying the emissions’ source is of great importance to inform policy designers for future mitigation and to realize an environmentally friendly and sustainable development society in China [9].
China is now the world’s largest consumer of primary energy and emitter of greenhouse gas emissions [10]. There are still many challenges for China’s CO2 mitigation. China produces 25% of the global CO2 emissions [11] and consumes 20.3% of global primary energy [3]. Among CO2 emissions sources, 85% of China’s emissions are contributed by energy usage in cities, which is higher than that of the USA (80%) or Europe (69%) [12,13]. Energy-related CO2 emissions and emissions at the city-level, province-level, and national-level have been widely studied [4,14,15,16]. This paper also analyzes data at the national-level, but analyzes the feature of emissions from four main sectors (primary industry, secondary industry, tertiary industry, and civil department) and four major energy types (coal, coke, oil, and gas).
As for the calculation approaches for CO2 emissions, there are two methods employed widely in academic and statistical studies: production-based and consumption-based accounting [17,18]. Production-based CO2 emissions are emissions caused by domestic production, including exports [19]. This approach accounts for CO2 emissions at the point of production, without consideration of where goods are used or who ultimately uses them [20,21]. Conversely, under consumption-based accounting, all emissions occurring along the chains of production and distribution are allocated to the final consumers of products [22]. The former approach is generally used in global climate change agreements, including the United Nations Framework Convention on Climate Change (UNFCCC) and the Kyoto Protocol [23]. Due to its flexible and extensive applicability, the production-based method for calculating CO2 total emissions at the national-level is used in this paper.
In order to provide detailed and straight insights for the current situation of CO2 emissions, a carbon flow chart is used. It is an intuitive and quantitative tool to show the whole picture of substances [16]. The approach of the flow chart method has been increasing applied to study energy paths and emissions sources of different countries at the regional or national scale [24,25,26,27,28]. Adopting this method, Xie had conducted a carbon flow chart for Shanghai in 2007 and found that 15.6% of coal was directly consumed in end sectors, which was not beneficial to energy saving and emissions reduction [28]. Some scholars applied the flow chart method to analyze the changing characteristics of China’s carbon flow between 2008 and 2012, and made a conclusion that CO2 flow carried by primary energy has significantly increased in 2012 [8]. However, these efforts about energy or energy-related CO2 emissions were received only to adopt the classification method for CO2 emissions in Intergovernmental Panel on Climate Change. It probably can’t realize the discrimination of CO2 emissions changes.
In this paper, a carbon flow is adopted which combines the method of the IPCC carbon emissions inventory with the classification of the national economy industry published by the National Bureau of Statistics of the People’s Republic of China. It can provide a quantitative and intuitive study about the carbon emissions path. Additionally, the changes between 2000 and 2013 in China are also presented. These will greatly contribute to the clear understanding of the emissions status and policy-making for emissions mitigation.
The paper is organized as follows: the classification and calculation methods of CO2 emissions are introduced in Section 2; Section 3 analyzes the characteristics in 2013 through the carbon flow chart and measures the emissions in different sectors or energy types based on the results, and conclusion are drawn in Section 4.
2. Materials and Methods
2.1. The Method for Classification of CO2 Emissions
According to Greenhouse Gas Inventory of the IPCC [29] and the national economy industry in China, the CO2 emissions sources are dividing into four main sectors shown in Table 1 as the Primary industry involving farming, fishery, forestry, and animal husbandry sectors, the Secondary industry which is divided into mining, manufacturing, electricity, and heat supply, as well as construction, the Tertiary industry that is split into transportation and post services, wholesale and retail services, and the Civil Department whose CO2 accumulation covers rural and urban households.

Table 1.
The classification of CO2 emissions sources.
Because the manufacturing sector contains a huge amount of industries, it has sub-classifications that are shown in Table 2. As for energy type, it covers coal, coke, oil, and gas. Figure 1 shows the summary of the analysis framework of this paper.
Table 2.
The sub-sectors of the manufacturing sector.
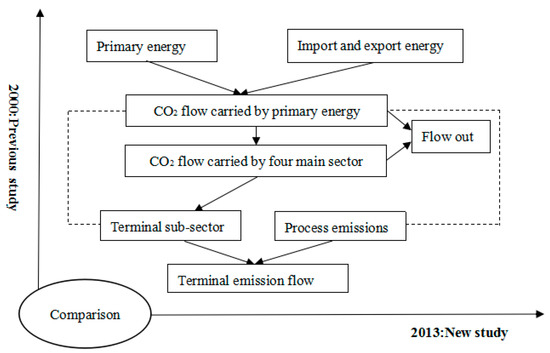
Figure 1.
Framework of the paper.
2.2. Formulas for Calculating CO2 Emissions
In this paper, CO2 emissions that are energy-related [14] and process-related are calculated. The growth and its rate are also considered.
The CO2 emissions from fossil fuel combustion and industrial processes [30] are calculated according to the IPCC sectoral approach [22]. This method is also applied by other scholars [31,32,33,34,35,36,37,38,39].
2.2.1. Energy-Related CO2 Emissions
Equation (1) is used to calculate the fossil fuel-related CO2 emissions. In this equation, the subscripts i and j denote the ith sector and the jth fuel, respectively; the designates the CO2 emissions of different sectors and energy types; represents the adjusted energy consumption; refers to the net calorific value of different energy types; is the carbon emissions factor of the fuel; is the fraction of carbon oxidized of the fuel.
Therefore, the total energy-related CO2 emissions in the year t is accumulated for all economy sectors from 1 to 4 as Equation (2):
The parameter instructions in Equations (1) and (2) are shown in Table 3. In Table 3, the NCV refers to the net calorific value and the EF denotes the carbon emissions factors as described in Equation (1).
Table 3.
Carbon emissions factor (EF) and fraction oxidized (O) of fuel.
2.2.2. Process CO2 Emissions
For the non-metal products, the process emissions are presented as Equation (3):
The instructions from Formula (3) are shown in Table 4. In Equation (3), the m refers to the category of process CO2 emission and the AD means the production in different industries as shown in Table 4.
Table 4.
The instructions from Formula (3).
2.2.3. The Change in CO2 Emissions
The change in CO2 emissions from period t to T can be formulated as follows:
where CΔ stands for the change in carbon emissions from period t to period T, and refers to the changes in percentage form.
2.3. Data Sources
The data in this paper are prior to the adoption of official statistics, such as the “China Statistical Yearbook” [40], “China Energy Statistical Yearbook” [41], “IPCC report (2006)” [29], and “Industry Statistics Yearbooks” [42,43,44]. Some data used in this paper are from survey and author’s calculation.
2.4. Uncertainty Analysis
Uncertainty exists in the calculation approach of CO2 emissions. The calculation method is based on production-based accounting without taking into consideration where goods are used or who ultimately uses them [20,21]. Some studies have shown that there are substantial differences between production-based and consumption-based accounting in terms of calculating both the overall and per capita carbon emission levels [23]. Consumption-based accounting has many advantages over production-based accounting in addressing carbon leakage, promoting environmental comparative advantages, increasing options for mitigation, and encouraging technology diffusion [45]. As a result, the selection of an emissions accounting approach has a major influence on the allocation of responsibilities for climate change mitigation [23].
In addition to the uncertainty in the carbon emissions calculation approach, carbon emissions factors which are adopted in this paper is other uncertain aspect. Several authors have questioned Chinese energy and carbon data and revealed that energy consumption in China was underestimated by the Chinese national statistics while its carbon emissions were overestimated by the IPCC and other reports [46,47,48]. The gap between them also affects the results.
3. Results and Discussion
3.1. CO2 Flow Chart from 2013
Based on the data calculated above, it is easy to determine the CO2 flow in 2013. It is clear that the fossil fuels are the CO2 source and are denoted with different colors. At the same time, the scale of the rectangle represents the magnitude of the CO2 flow in Figure 2.
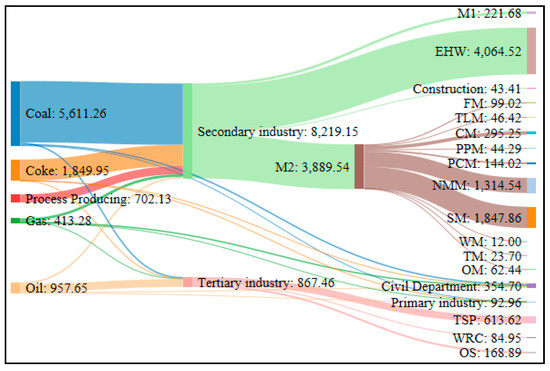
Figure 2.
China’s CO2 flow chart in 2013 (unit: Mt CO2).
The graph on the left is the CO2 flowing into China’s industrial system, which is carried by primary energy. Apparently, coal is the main source in the CO2 flow which accounts for 59% of the total with a share of 5611.27 million tons, decreasing 0.03 percent from that in 2000. This unitary structure of primary energy is not positive for CO2 mitigation, which makes changing its structure and seeking replacement more emergent. Then, the CO2 flows into the four main industries which are primary industry, secondary industry, tertiary industry and civil department. It is significant that 85% of the total CO2 flows into the secondary industry, in which coal is the major source. When compared with 2000, the percentage of coal in secondary industry decreases 3% and the coke decreases 8%. Additionally, 71% of the CO2 carried by gas flows into the tertiary industry and 31% of the oil goes into the civil department. Adjustment in these huge flows can greatly reduce CO2 emissions. The right part is the CO2 flowing to the terminal sub-sectors. The amount of CO2 flowing into the “electricity and heating” sector and the “manufacturing” sector in the secondary industry is huge, reaching up to 4064.52 million tons and 3187.41 million tons, respectively. In addition, the “smelting and pressing of metals” sub-sector and the “non-metallic mineral” sub-sector among these sub-sectors involves a large share of CO2 flowing to manufacturing, which is 1847.86 million tons and 295.26 million tons, respectively. It is noteworthy that there is a considerable percentage of the “transportation, storage and post” sector in the tertiary industry with a proportion of 71%, which has decreased 6% from that in 2000. There will be more efficient carbon reduction if the government makes more effect in these specific sectors.
3.2. Trend Analysis from 2000 to 2013
Based on the method mentioned in Section 2, China’s total CO2 emissions and CO2 intensity from 2000 to 2013 is shown in Figure 3.
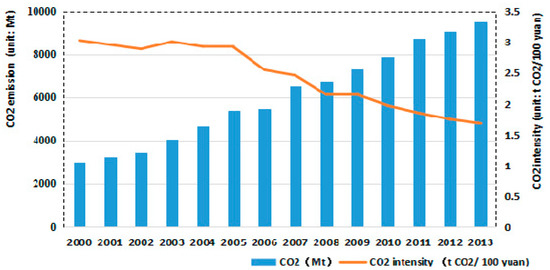
Figure 3.
China’s total CO2 emissions and CO2 intensity from 2000 to 2013.
There is a substantial growth of CO2 emissions from 3003.43 million tons to 9534.22 million tons, with an annual growth rate of 9.46% from 2000 to 2013. In 2003, 2004, 2005, 2007, and 2011, there have been great increases due to the developing secondary industry. Apparently, the CO2 intensity in China declined continuously from 2000 to 2013, whereas the slightly increase in 2003 is probably due to the rapid expansion of infrastructure requiring the operation of energy-consuming industries [15]. It is obvious to see that the intensity of CO2 had a stable drop rate from 2009 with about 6% yearly. China’s government has been promoting technical innovation and other efficient measures to reduce CO2 emissions, which contributes to making CO2 intensity steadily decrease. It is worth mentioning that the total emissions will continue to increase for a long time because of the developmental industrialization and urbanization in China.
3.2.1. Emissions from Different Sectors
In order to present the sectoral contributions clearly, there are four main sectors of China’s CO2 emissions shown in Figure 4, as mentioned in Section 2.
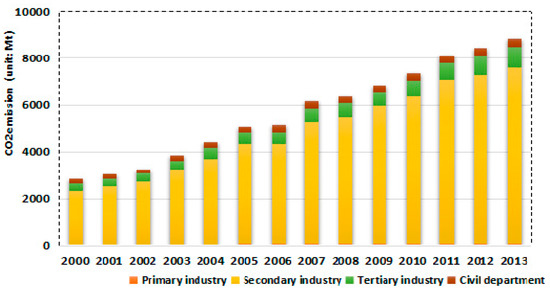
Figure 4.
China’s CO2 emissions in four main sectors from 2000 to 2013.
The CO2 emissions of the secondary industry ranks first, ranging from 2299 million tons to 7517 million tons and accounting for 83.5% of the total CO2 emissions on average, followed by the tertiary industry and civil department. The primary industry has the smallest CO2 emissions. It is noteworthy that the secondary industry has the highest growth rate of 9.62% on average, followed by the tertiary industry and civil department with annual increases of 8.30% and 8.15%, respectively. The primary industry similarly has the lowest growth percentage of 6.23%. It is clear that taking some actions in the secondary industry would contribute effectively to the mitigation of CO2 emissions. The civil department also should consider seriously making some changes regarding human lifestyles [49]. It is necessary to subdivide the secondary industry due to its huge amount and varied sectors. Figure 5a–d presents the proportions for the different sectors of mining, manufacturing, electricity and heating, and construction, mentioned in Table 1 in 2000, 2004, 2008, and 2013.
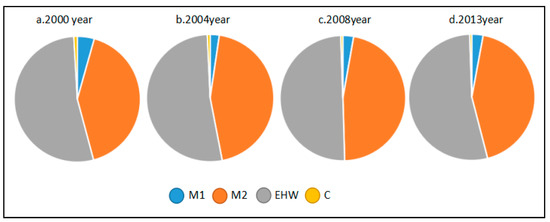
Figure 5.
The proportions for the different sectors of mining, manufacturing, electricity and heating, and construction in the secondary industry in 2000, 2004, 2008 and 2013.
The “Electricity and heating” sector apparently emits the most with a proportion of over 50% of the total emissions on average from the aspect of the secondary industry, following by the “manufacturing” sector with 45% and then the “mining” sector. The construction sector has the lowest emissions. The structure of the secondary industry is almost invariable from 2000 to 2013 as seen from these pie charts. Mining has declined slightly due to the promotion of conserving resources and the close focus on environmental problems. Because of the increasing huge demand on electricity, “electricity and heating” is the primary source that contributes to the secondary industry’s average CO2 emissions. This shows that reducing emissions through “electricity and heating” is equally important for emission reductions in the “manufacturing” sector. Innovative technology is strongly proposed to be applied to the “electricity and heating” sector.
China’s government has been paying more attention to the “manufacturing” sector recently and it is devoted to making it a powerful country regarding its manufacturing industry. Among the 10 sub-sectors of manufacturing defined in Section 2, the “smelting and pressing of metals” sub-sector produces the most CO2 and generates 51.2% on average of the manufacture emissions during 2000, 2008, and 2013, shown in Figure 6. Obviously, the “smelting and pressing of metals” sub-sector definitely determines whether the carbon emissions trend of the “manufacturing” sector is upward or downward to some extent, but it will not decline greatly in a short time due to China’s booming economical construction. The flourishing housing industry causes the “non-metallic mineral” and the “wood processing” sectors to increase continuously. When construction and real estate reaches a satisfactory situation, it will decrease or remain at a stable level. The emissions of the other eight sub-sectors have almost no change.
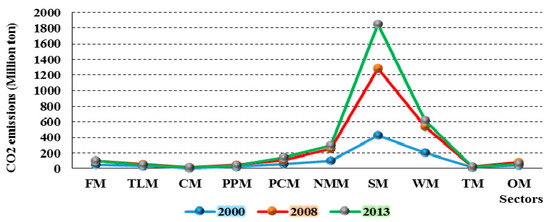
Figure 6.
The CO2 emissions of the sub-sectors in manufacturing during 2000, 2008, and 2013.
3.2.2. Emissions of Different Energy Types
Figure 7a–d shows the proportion of energy for the energy-related CO2 emissions inventory in 2000, 2005, 2010, and 2013, respectively. There are four energy types; coal, coke, oil, and gas. Clearly, the CO2 emissions carried by coal is the highest, accounting for 65% on average, followed by coke, accounting for 18.5%. The others take up approximately 16.5% in total. Coal is the largest primary energy source in China. More than 65% of the total energy used in China comes from coal [11].
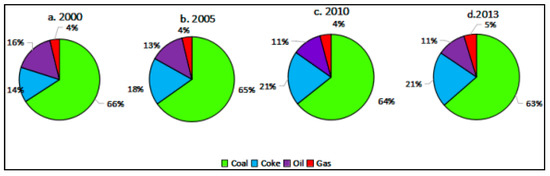
Figure 7.
CO2 emissions from the four types of energy in 2000, 2005, 2010, and 2013.
From the perspective of primary energy carriers, the structure of their emissions has little change. Obviously, the emissions caused by coal and the combustion of coal products slightly diminished, while the CO2 emissions produced by coke and natural gas both increased slightly. To promote coal mineral harnessing movements and encourage industries to adopt renewable alternative energies will be more efficient in reducing the coal use.
In addition to energy-related emissions, industrial processes also contribute to total CO2 emissions as shown in Figure 8 with a percentage of 6.36% on average. It increased slightly due to the large quantities of manufacturing industries in China such as the "non-metal mineral” sector and the large production of cement, iron, and steel. The emissions of industrial processes should be given preference by the Chinese government.
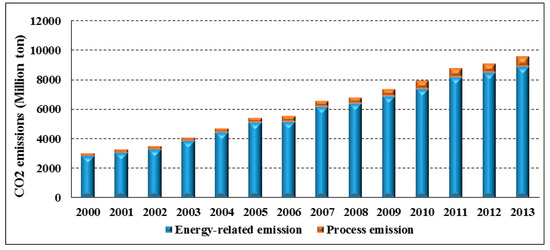
Figure 8.
Energy-related and process CO2 emissions from 2000 to 2013.
4. Results and Conclusions
This paper elaborates the detailed features of China’s carbon flow for 2013 with the carbon flow chart and provides the changing characteristics of China’s CO2 flow from the sector and energy viewpoints during 2000 and 2013. Based on the findings presented above, the specific results are as follows:
- (1)
- There remains an upward trend in China’s CO2 emissions with an approximate growth proportion of 7% annually, while the CO2 intensity of China diminished at different rates from 2000 to 2013, and should still decrease in the future.
- (2)
- The CO2 emissions from the secondary industry are prominent from the perspective of the four main sectors that account for 83.5% of emissions. The “manufacturing” sector plays an important part in the secondary industry with 45% of emissions, in which the “smelting and pressing of metal” takes up a large percentage of about 50% of the manufacturing emissions.
- (3)
- Although its total amount is small at present, the growth rate of civil department emissions reached about 8%, which should be paid more attention to.
- (4)
- The CO2 emissions produced by coal consumption is dominant regarding energy-related emissions with a contribution of 65%, which will decrease in the future. Apart from this, the process emissions had considerable growth of 11%.
- (5)
- From the sector aspect, the CO2 emissions mainly come from the “electricity and heating” sector and the “smelting, pressing and manufacturing of metals” sub-sector, while the “non-metallic mineral” and the “wood processing” sectors also have a strong proportion.
According to the results of this paper, it is essential and urgent to propose concrete recommendations for CO2 emissions mitigation. Firstly, the progression of creative technology is inevitable and undeniable, which will cause the CO2 intensity to constantly decrease. It is necessary and essential for China to offset CO2 intensity with the rapid development of its economy, thus the government should take a series of actions to encourage innovation in techniques and management and then apply it immediately to the industrial sectors with huge CO2 emission flows. Secondly, the government should make different CO2 emissions reduction policies among different sectors. For example, the process emissions play an important role in the “non-metallic mineral” sector while in the “smelting and manufacturing of metals” sector, the major source is energy consumption. Thirdly, because the secondary industry has a large share of the total emissions and it is the pillar industry of China’s economy, it is necessary to adjust its structure by focusing on manufacturing and adopting clean energy. In addition, coal is still the main source of CO2 emissions. It is not feasible to shut down all coal mineral production and alter it immediately but the country can change its energy structure and promote renewable energy for power production by wind or other low-carbon energy sources. When comparing the combustion emissions between coke oven gas and other energy, the emissions of coke oven gas is twice or even more than three times lower than the others. It will be feasible to make full use of coke oven gas rather than coal. Finally, policy makers should be aware that the emissions from residents have been growing at a fast rate. It is effective to involve the public in the activity of energy conservation and carbon emissions reduction such as reducing the times of personal transportation.
This paper has limitations. On the one hand, there are uncertainties in the calculation approach and carbon emissions factors adopted by the IPCC. On the other hand, the carbon flow chart is only seen at the national-level without considering trade effects between countries. Further studies will be conducted to improve the accuracy of the CO2 emissions data and to form a more comprehensive understanding of carbon flow.
Acknowledgments
This research is supported by funding from the Cultivating program of excellent innovation team of Chengdu University of Technology (KYTD201406); Resources and the Environment Strategy Research Team of Sichuan’s High Level Social Science Research Team (2015–2017); Accounting and evaluation of carbon dioxide emissions inventory in Sichuan: Sichuan Social Science Association planned project (SC16TJ006) Sichuan Social Science Association research base project (SC16E06).
Author Contributions
All authors have made a significant contribution to this research. Minxi Wang and Xin Li conceived and designed the experiments; Xiandan Cui collected data and information; Minxi Wang provided methods and processed data; Xin Li analyzed the data; Xiandan Cui wrote the paper.
Conflicts of Interest
The authors declare no conflict of interest.
References
- Liu, Y.; Wang, C.; Chen, M. Carbon flow analysis of China’s agro-ecosystem from 1980 to 2013: A perspective from substance flow analysis. J. Environ. Sci. 2016. [Google Scholar] [CrossRef]
- IPCC. Climate Change: Impacts, Adaption, and Vulnerability. 2014. Available online: http://www.ipcc.ch/report/ar5/wg2/ (accessed on 7 September 2015).
- BP (British Petroleum). BP Statistical Review of World Energy. 2013. Available online: http://www.usaee.org/usaee2013/submissions/presentations/SR%202013%20US%20events.pdf (accessed on 15 April 2017).
- Zhu, L.J.; Yue, C.; Wang, S.P.; Fang, J.G. Carbon emissions in China and major countries from 1850 to 2008. Acta Sci. Nat. Univ. Pekin. 2010, 46, 479–504. (In Chinese) [Google Scholar]
- Hu, J.L.; Lee, Y.C. Efficient three industrial waste abatement for regions in China. Int. J. Sustain. Dev. World Ecol. 2008, 15, 132–144. [Google Scholar] [CrossRef]
- Li, Z.D. Quantitative analysis of sustainable energy strategies in China. Energy Policy 2010, 38, 2149–2160. [Google Scholar]
- Wang, T.; Waston, J. Scenario analysis of China’s emissions pathways in the 21st century for low-carbon transition. Energy Policy 2010, 38, 3537–3546. [Google Scholar] [CrossRef]
- Li, H.; Wei, Y.-M.; Mi, Z. China’s carbon flow: 2008–2012. Energy Policy 2015, 80, 45–53. [Google Scholar] [CrossRef]
- Qi, T.; Weng, Y.; Zhang, X.; He, J. An analysis of the driving factors of energy-related CO2 emissions reduction in China from 2005 to 2013. Energy Econ. 2016, 60, 15–22. [Google Scholar] [CrossRef]
- Guan, D.; Hubacek, K.; Weber, C.L.; Peters, G.P. Journey to world top emitter: An analysis of the driving forces of China’s recent CO2 emissions surge. Geophys. Res. Lett. 2009. [Google Scholar] [CrossRef]
- U.S. Energy Information Administration (EIA). International Energy Outlook. 2010. Available online: http://unfccc.int/2860.php (accessed on 29 August 2011).
- Dhakal, S. Urban energy use and carbon emissions from cities in China and policy implications. Energy Policy 2009, 37, 4208–4219. [Google Scholar] [CrossRef]
- Dhakal, S. GHG emissions from urbanization and opportunities for urban carbon mitigation. Curr. Opin. Environ. Sustain. 2010, 2, 227–283. [Google Scholar] [CrossRef]
- Shan, Y.; Guan, D.; Liu, J.; Liu, Z.; Liu, J.; Schroeder, H.; Chen, Y.; Shao, S.; Mi, Z.; Zhang, Q. CO2 emissions inventary of Chinese cities. Atmos. Chem. Phys. Discuss. 2016. [Google Scholar] [CrossRef]
- Mu, H.L.; Li, H.N.; Zhang, M.; Li, M. Analysis of China’s carbon dioxide flow for 2008. Energy Policy 2013, 54, 320–326. [Google Scholar] [CrossRef]
- Zhang, M.; Mu, H.; Ning, Y. Accounting for energy-related CO2 emissions in China during 1991 to 2006. Energy Policy 2009, 37, 767–773. [Google Scholar] [CrossRef]
- Zhang, B.; Qiao, H.; Chen, Z.M.; Chen, B. Growth in Embodied Energy Transfers via China’s Domestic Trade: Evidence from Multiregional Input–Output Analysis. 2015. Available online: http://dx.doi.org/10.1016/j.apenergy.2015.09.076 (accessed on 10 September 2015).
- Shigeto, S.; Yamagata, Y.; Ii, R.; Hidaka, M.; Horio, M. An easily traceable scenario for 80% CO2 emissions reduction in Japan through the final consumption-based CO2 emissions approach: A case study of Kyoto-city. Appl. Energy 2012, 90, 201–205. [Google Scholar] [CrossRef]
- Peters, G.P. From production-based to consumption-based national emissions inventories. Ecol. Econ. 2008, 65, 13–23. [Google Scholar] [CrossRef]
- Steininger, K.; Lininger, C.; Droege, S.; Roser, D.; Tomlinson, L.; Meyer, L. Justice and cost effectiveness of consumption-based versus production-based approaches in the case of unilateral climate policies. Glob. Environ. Chang. 2014, 24, 75–87. [Google Scholar] [CrossRef]
- Atkinson, G.; Hamilton, K.; Ruta, G.; Van Der Mensbrugghe, D. Trade in ‘virtual carbon’: Empirical results and implications for policy. Glob. Environ. Chang. 2011, 21, 563–574. [Google Scholar] [CrossRef]
- Wiedmann, T. A review of recent multi-region input–output models used for consumption-based emissions and resource accounting. Ecol. Econ. 2009, 69, 211–220. [Google Scholar] [CrossRef]
- Mi, Z.; Zhang, Y.; Guan, D.; Shan, Y.; Liu, Z.; Cong, R.; Yuan, X.; Wei, Y. Consumption-based emissions accounting for Chinese cities. Appl. Energy 2016, 184, 1073–1081. [Google Scholar] [CrossRef]
- Garry, P. UK Energy Flow Chart 2007. 2008. Available online: http:/rs.resalliance.org/2008/09/05/uk-energy-flow-chart-2007/ (accessed on 5 September 2008).
- Lawrence Livermore National Laboratory. US Energy and Carbon Flow Chart. 2011. Available online: http://flowcharts.llnl.gov/index.html (accessed on 12 October 2012).
- Li, Z.; Fu, F.; Ma, L.W. China’s energy flow chart based on energy balance sheet. Energy China 2006, 28, 5–10. (In Chinese) [Google Scholar]
- Osaka University: TsujiLabs. Energy Sankey Diagram for Japan. 2007. Available online: http://www.sankey-diagrams.com/tag/japan/ (accessed on 5 August 2008).
- Xie, S.; Chen, C.; Li, L.; Cheng, C.; Zhen, P.; Lu, J. The energy related carbon dioxide emissions inventory and carbon flow chart in Shanghai City. China Environ. Sci. 2009, 29, 1215–1220. (In Chinese) [Google Scholar]
- IPCC. Greenhouse Gas Inventory: IPCC Guidelines for National Greenhouse Gas Inventories; United Kingdom Metoorological Office: Backnell, UK, 2006. [Google Scholar]
- Peters, G.; Weber, C.; Liu, J. Construction of Chinese Energy and Emissions Inventory; Norwegian University of Science and Technology: Trondheim, Norway, 2006. [Google Scholar]
- International Energy Agency (IEA). Cities, Towns and Renewable Energy; IEA: Paris, France, 2009. [Google Scholar]
- Feng, K.; Davis, S.J.; Sun, L.; Li, X.; Guan, D.; Liu, W.; Liu, Z.; Hubacek, K. Outsourcing CO2 within China. Proceed. Natl. Acad. Sci. USA 2013, 110, 11654–11659. [Google Scholar] [CrossRef] [PubMed]
- Wiedmann, T.; Wood, R.; Lenzen, M.; Minx, J.; Guan, D.; Barrett, J. Development of an Embedded Carbon Emissions Indicator-Producing a Time Series of Input-Output Tables and Embedded Carbon Dioxide Emissions for the UK by Using a MRIO Data Optimization System; Department for Environment, Food and Rural Affairs: London, UK, 2008.
- Liu, Z.; Dong, H.; Geng, Y.; Lu, C.; Ren, W. Insights into the regional greenhouse gas (GHG) emissions of industrial processes: A case study of Shenyang, China. Sustainability 2014, 6, 3669–3685. [Google Scholar] [CrossRef]
- Zhao, X.; Ma, Q.; Yang, R. Factors influencing CO2 emissions in China’s power industry: Co-integration analysis. Energy Policy 2013, 57, 89–98. [Google Scholar] [CrossRef]
- Zhou, W.; Zhu, B.; Li, Q.; Ma, T.; Hu, S.; Griffy-Brown, C. CO2 emissions and mitigation potential in China’s ammonia industry. Energy Policy 2010, 38, 3701–3709. [Google Scholar] [CrossRef]
- Lei, Y.; Zhang, Q.; Nielsen, C.; He, K. An inventory of primary air pollutants and CO2 emissions from cement production in China during 1990 to 2020. Atmos. Environ. 2011, 45, 147–154. [Google Scholar] [CrossRef]
- Mi, Z.; Wei, Y.; He, C.; Li, H.; Yuan, X.; Liao, H. Regional efforts to mitigate climate change in China: A multi-criteria assessment approach. Mitig. Adapt. Strateg. Glob. Chang. 2017, 22, 45–66. [Google Scholar] [CrossRef]
- Mi, Z.; Pan, S.; Yu, H.; Wei, Y. Potential impacts of industrial structure on energy consumption and CO2 emissions: A case study of Beijing. J. Clean. Prod. 2015, 103, 455–462. [Google Scholar] [CrossRef]
- National Bureau of Statistics of China. China Statistical Yearbook; National Bureau of Statistics of China: Beijing, China, 2017. Available online: http://www.stats.gov.cn/tjsj/ndsj/2016/indexch.htm (accessed on 24 February 2017).
- National Bureau of Statistics of China. China Energy Statistical Yearbook; National Bureau of Statistics of China: Beijing, China, 2017. Available online: http://www.stats.gov.cn/tjsj/ndsj/2016/indexch.htm (accessed on 24 February 2017).
- China Building Material Council. Almanac of China Building Material Industry; Almanac of China Building Materials Industry Press: Hong Kong, China, 2009. [Google Scholar]
- China Cement Association. China Cement Almanac; China Building Material Press: Hong Kong, China, 2009. [Google Scholar]
- China Nonferrous Metals Industry Association. The Yearbook of Nonferrous Metals Industry of China; China Nonferrous Metals Industry Yearbook Editorial Board: Hong Kong, China, 2009. [Google Scholar]
- Peters, G.P.; Hertwich, E.G. CO2 embodied in international trade with implications for global climate policy. Environ. Sci. Technol. 2008, 42, 1401–1407. [Google Scholar] [CrossRef] [PubMed]
- Guan, D.; Liu, Z.; Geng, Y.; Lindner, S.; Hubacek, K. The gigatonne gap in China’s carbon dioxide inventories. Nat. Clim. Chang. 2012, 2, 672–675. [Google Scholar] [CrossRef]
- Liu, Z.; Guan, D.; Moore, S.; Lee, H.; Su, J.; Zhang, Q. Climate policy: Steps to China’s carbon peak. Nature 2015, 522, 279–281. [Google Scholar] [CrossRef] [PubMed]
- Mi, Z.; Wei, Y.-M.; Wang, B.; Meng, J.; Liu, Z.; Shan, Y.; Liu, J.; Guan, D. Socioeconomic impact assessment of China’s CO2 emissions peak prior to 2030. J. Clean. Prod. 2017, 142, 2227–2236. [Google Scholar] [CrossRef]
- Bin, S.; Dowlatabadi, H. Consumer lifestyle approach to US energy use and the related CO2 emissions. Energy Policy 2005, 33, 197–208. [Google Scholar] [CrossRef]
© 2017 by the authors. Licensee MDPI, Basel, Switzerland. This article is an open access article distributed under the terms and conditions of the Creative Commons Attribution (CC BY) license (http://creativecommons.org/licenses/by/4.0/).