
San Antonio 360: The Rise and Decline of the Concentric City 1890–2010


1
Department of Architecture, University of Texas at San Antonio, San Antonio, TX 78249, USA
2
Bloustein School of Planning and Public Policy, Rutgers University, New Brunswick, NJ 08901, USA
*
Author to whom correspondence should be addressed.
Sustainability 2017, 9(4), 649; https://doi.org/10.3390/su9040649
Submission received: 22 February 2017
/
Revised: 4 April 2017
/
Accepted: 12 April 2017
/
Published: 19 April 2017
(This article belongs to the Special Issue Sustaining Suburbia: Reassessing the Policies, Systems, and Form of Decentralized Growth)
Abstract
:This paper catalogs the suburban expansion of San Antonio, Texas by decade between the years 1890 and 2009, a time frame that saw the city reorganize its morphological structure four times. The city inhabited a 36-square mile grid until the late nineteenth century; expanded radially along streetcar lines during the early twentieth century; grew concentrically along automotive ring roads during the mid-twentieth century; and has assumed a polycentric organization within the past two decades. This research places San Antonio’s recent demographic and geographic boom into historical perspective, utilizing construction completions in host Bexar County to answer the following question: how did the form, location, and type of suburban growth shift over 120 years? The research reveals three trends: first, that historically concentric growth patterns began to assume a polycentric configuration in the late twentieth century; second, that patterns of centrifugal expansion began to accelerate dramatically during the same time period; and third, that the relative increase of multifamily completions has surpassed that of single-family completions in five of the last six decades. These findings suggest that the City of San Antonio, in order to establish a sustainable growth model, must prioritize the opportunities and constraints associated with polycentric suburban expansion.
1. Introduction
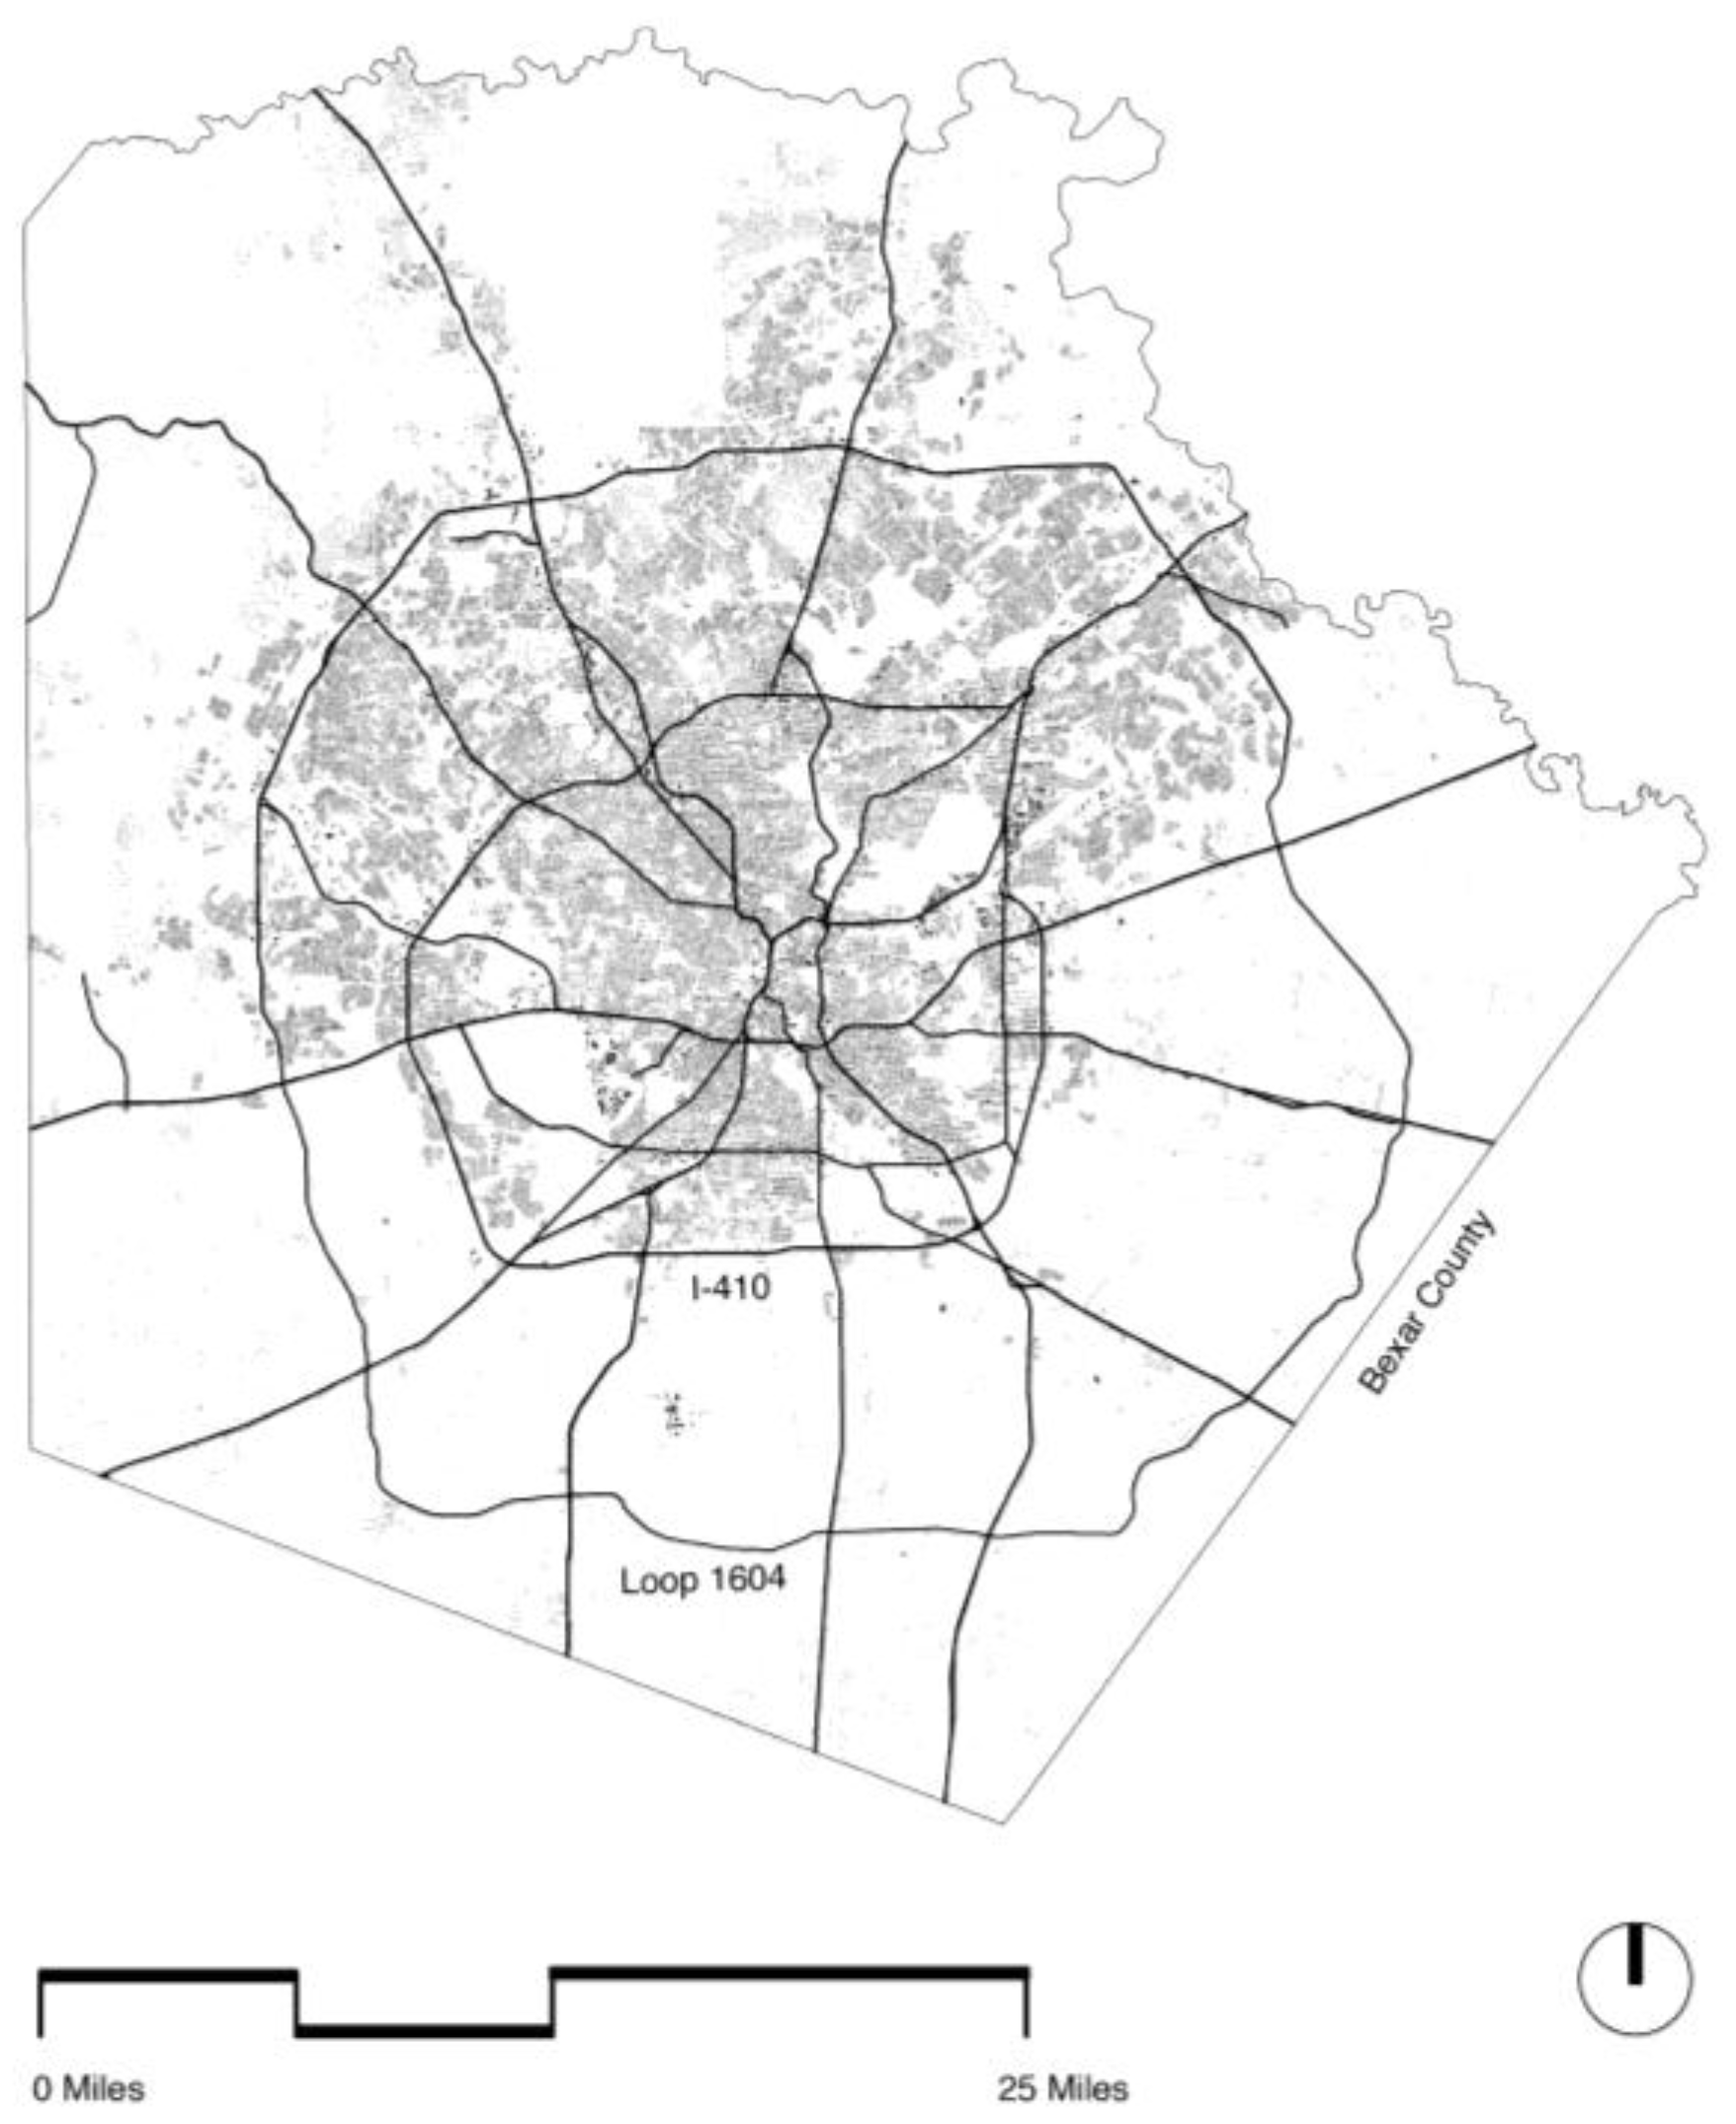
The topic of suburban expansion is timely for the City of San Antonio, Texas. With an estimated population of 1,469,845, San Antonio currently ranks the second largest city in the state and seventh largest in the United States [1]. The city will add 500,000 jobs and 500,000 units of housing by 2040, testament to a strong and diverse economy built on healthcare, education, military and tourism. All of this in a city that added 430,000 people in the last ten years [2]. This growth will increase the population of host Bexar County by 65%, with much of the population influx occurring within the San Antonio city limits [3]. This demographic expansion would likely lead to significant geographic expansion. The city’s current footprint covers 467 square miles, at the relatively low residential density of 3017 people per square mile [3] (Figure 1).
Our research is already registering the impact of this growth, measured as a function of both construction completions and developed land area. A comparison of the 1990s and 2000s, for example, shows a 165% increase in construction completions and a 185% increase in developed land area (Table 1). This data reveals the largest relative increases during the post-WWII period and the largest total increases ever.
The dramatic expansion of population and land area has prompted city planners to advance a series of recent policy efforts including a comprehensive master plan, transportation plan, and sustainability plan. These documents outline a plan for growth through 2040. The explicit goal of the Comprehensive Plan, passed in 2016, is to determine the direction and form of future physical growth, distribute the projected population, and guide infrastructural investment [3]. The Comprehensive Plan recognizes that economic activity in San Antonio is distributed widely across 13 regional nodes, nine existing and four emerging, which together account for half of the city’s employment and non-residential development since the year 2000 [3]. The Comprehensive Plan also recommends further investment in these nodes, with the hope of transforming them into mixed-use activity centers [3]. The city is also preparing an $850-million-dollar bond campaign to fund major infrastructure projects. Together, these two policy efforts will go a long way toward determining San Antonio’s ability to sustain existing environmental, financial, and infrastructural systems in the face of unprecedented local growth.
Our research catalogs the history of suburban expansion in San Antonio in order to help policy-makers and residents make more critically informed choices about where and how to grow. We begin the research in the year 1890, which marks the first time that the city began large-scale expansion beyond its original 36-square mile colonial grid. The ensuing 120 years saw San Antonio transform itself multiple times; stretching its historical footprint in a linear fashion along streetcar routes, multiplying growth in a concentric fashion along automotive ring-roads, and eventually assuming the complex polycentric footprint that the city exhibits today.
While the origins of suburban development in the United States date to the early nineteenth century, it was not until the second half of the twentieth century that suburbs fully eclipsed central cities as the primary locale for residential and economic development in U.S. cities. Mieszkowski and Mills [4] note that between the years 1950 and 1990, the percentage of residents living within central cities, as opposed to larger metropolitan statistical areas, declined from 57% to 37%, while the percentage of jobs declined from 70% to 45%. Wheeler [5] uncovers similar trends in his study of six metropolitan areas in the U.S., revealing that 88% of their total metropolitan land area was developed after 1940, a time period when suburban morphologies achieved prevalence. Farris [6] locates a similar disparity in studies of 22 major central cities, finding that during the 1990s they netted only 5.2% of total new metropolitan housing permits.
The ascendance of suburban morphologies during the second half of the twentieth century has generated continuous and widespread disdain from planners, policy-makers, and architects. Early detractors like Peter Blake [7] critiqued suburbia on largely aesthetic terms, lamenting the negative visual impact of billboards and power lines on previously countryside views. More recently, opponents have focused their ire on the professed social and environmental deficiencies of suburban development [8,9]. This critical discourse, impressive in its breadth, depth, and diversity, generally falls under the rubric of New Urbanism or Smart Growth [9,10,11,12]. These related movements are bound by a series of design and policy prescriptions, many of which seek to recapture the best qualities of the pre-automotive city. Some of the most prevalent strategies include increasing population densities, re-introducing street grids, expanding mixed-use zoning, and investing in mass transit networks.
The last decade, however, has seen attitudes towards suburbia shift as critics have increasingly come to accept the inherent form and logic of suburban landscapes. Robert Bruegman [13] constructs a powerful historical argument for this position, reminding us that the geographic decentralization that defines suburban locales is not unique to post-war U.S. cities. In fact, even ancient cities like Babylon, Ur, and Rome included transitional or suburban zones, which by definition fall somewhere between urban and rural conditions.
Joel Kotkin [14] similarly contends that the expanded decentralized structure of U.S. post-war suburbs is fully capable of accommodating growth in an environmentally and socially productive manner. According to Kotkin, the proper role of policy-makers and designers is therefore to facilitate further growth through more productive policy and formal arrangements within the existing suburban structure. Architect Judith De Jong [15] stakes out a related position, arguing that suburbs offer the most robust site for new formal and spatial investigations. She is less convinced than Kotkin that the garden suburbs of the early twentieth century offer the best way forward. Instead, De Jong suggests that the greatest potential for growth lies in edge cities such as Tyson’s Corner, Virginia; inner-ring suburbs like Evanston, Illinois; or exurban areas like The Woodlands, Texas.
Kotkin and De Jong both advocate for a position that can broadly be described as New Suburbanism. This emerging paradigm accepts the inevitability and even legitimacy of post-war suburban environments, arguing for a series of strategic interventions to improve these landscapes through the introduction of new forms, programs, and spatial arrangements. This position is largely at odds with the more familiar narratives of New Urbanism and Smart Growth, which assert a greater affinity for the footprint of the pre-Modern pre-automotive city. Still, even urbanists who advocate a return to more traditional urban morphologies recognize that the strategic infill and retrofit of the existing suburban fabric offers a critical way to minimize the negative effects of post-war growth and to accommodate new growth [16,17,18].
This paper argues that New Suburbanism, as a theoretical framework, can help San Antonio confront its impending population boom in three ways. First, the approach would allow San Antonio to absorb 1.1 million people in the next 25 years, even if the city is unable to fill out its existing urban core. This is not a small consideration, as San Antonio’s recent efforts to advance residential and commercial development in the city’s central core have done little to slow centrifugal patterns of suburban development. In fact, our research indicates that the peak wave of construction during the 2000s, a time period tabbed by former Mayor Julián Castro as the ‘Decade of Downtown’, remained a full 15 miles beyond the historic urban core.
Second, the political climate in Texas, characterized by strong support for property rights and fierce resistance to regulations, means that most attempts to guide or limit the location of growth will encounter staunch and well-funded opposition. Most recently, pro-development sentiments led the Planning Commission to remove binding language from the Comprehensive Plan related to impervious cover and night sky restrictions [19].
Third, by focusing on the inherent possibilities of both new and infill suburban development, San Antonio policy-makers will have an opportunity to retrofit and infill the massive quantities of peripheral development that have appeared since 1950.
The research focuses on three specific research questions. First, how did the form of suburban growth shift within Bexar County over the study period? Second, where has suburban growth historically occurred within Bexar County during the study period? Third, what type of suburban growth has San Antonio experienced during the study period, specifically with regard to single-family and multifamily housing?
The work utilizes two broad measures of growth, both of which operate at the metropolitan scale. Such expansive methods seem appropriate in Bexar County, a locale that has not benefitted from significant quantitative urban analysis. The team began by mapping the geographic distribution of suburban growth within Bexar County. For this portion of the work, the project relies on kernel density spatial analysis, which establishes how the concentration of development in Bexar County changed over time. This paper presents the data at the scale of the county, classifying it by decades. Kernel density calculates the density of development (point features) by creating a smooth raster surface. Kernel density spatial analysis allows the research team to detect and display emerging development patterns. The technique is especially useful when considering large study areas like Bexar County, which covers over 1200 square miles.
An excellent precedent for this approach comes from Delmelle, Zhou, and Thill [20], who use the technique to understand the impact of urban infill on residential density in Charlotte, NC between the years 2000–2009. Their work reveals that density in Charlotte is increasing simultaneously within the city’s core and suburban periphery, suggesting that traditional distinctions between a dense urban core and a diffuse suburban periphery are breaking down.
The second portion of this analysis digs deeper into the spatial data, sorting construction permits by year built and distance from center. The research team organizes this data in chart form, highlighting San Antonio’s chronological shift from a centripetal, or inward pattern of growth to a centrifugal, or outward one. This approach builds on a lineage of work that begins with Blumenfeld [21], who found that cities expanded in three stages, beginning with slow growth, moving towards peak population growth, and finally entering decline. He notes that the peak wave of suburban development travels at a rate of one mile each decade. Subsequent research efforts pick up on the wave metaphor to describe suburban growth, including Hart [22] and Pond and Yeates [23]. The latter offer a five-stage development process that begins with agricultural development and ends with complete urbanization.
Gober and Burns [24] extend this line of research, examining the size and shape of the ‘urban fringe,’ or outer edge of development, in Phoenix between the years 1990 and 1998. They specifically measure the distance between housing completions at the periphery and those at the metropolitan center. This work focuses on where the urban fringe peaks, how fast it peaks, and on its character and surroundings. Their results suggest that the urban fringe does not constitute a highly concentrated narrow region but rather a complex process that impacts various areas of the metropolitan region at different rates and in dissimilar ways.
Atkinson-Palombo [25] similarly examines the changing form and character of the urban fringe, comparing the location and type of new housing construction in Phoenix between 1990–1999 and 2000–2005. The work charts the quantity of construction completions and distance from the center to conclude that the relentless outward momentum of single-family construction has slowed in recent years, being replaced by infill development. The findings further suggest that the urban fringe does not expand evenly in all directions, as barriers to development impede growth in some areas of the city. It finally reveals that multifamily housing, long associated with dense infill at the historic core, is becoming increasingly prevalent at the urban fringe.
Together, this body of research describes an increasingly complex, peripheral, and decentered pattern of suburban development. The resultant landscape, composed of increasingly unfamiliar spatial and programmatic arrangements, will continue to resist the traditional development solutions offered by New Urbanist and Smart Growth advocates. Within this context, New Suburbanism provides a promising theoretical framework for sustainable growth, one grounded in the physical and political realities of contemporary suburbia.
2. Materials and Methods
The research team began by obtaining the 2015 parcel shapefile for San Antonio from the Bexar County Property Appraiser. This shapefile contained information on property ownership, the year the first building was constructed on the lot, the assessed value of building(s) and lot, land use, and the total acreage for the parcel. The team next secured a shapefile with San Antonio building footprints from the Texas Sustainable Energy Research Institute, extracting the building footprints by processing the TNRIS LiDAR dataset. This provided the total coverage of each building and total acreage of developed land.
The next step involved removing all parcels with a missing year-built date from the study before performing a spatial join of the parcel shapefile and building footprints. This process assigned all of the attributes from the Bexar County Property Appraiser dataset to the buildings. The team then constructed shapefiles for both the parcel and buildings for each decade beginning in the 1890s and ending in the 2000s. This allowed the team to observe development patterns and trends for 14 distinct time periods.
The project considered four land uses including residential single-family, residential multifamily, commercial, and industrial. These land uses corresponded to the state reporting categories as defined by the property classification guide for Texas. The team removed buildings and parcels associated with all other land uses (such as utilities and farmland) from the study. This left a sample size of 609,006 buildings and 475,127 parcels.
Upon securing the data, the team engaged in two forms of analysis. First, in an effort to examine how the distribution of suburban development changed over time, we converted the polygon building footprint shapefiles for each decade into point shapefiles in ArcGIS. The next step involved using the kernel density spatial analyst tool on the point building footprint shapefiles to calculate the concentration of buildings within an area. This created a development surface for each time period. The team utilized total building coverage as a weight in the population field of the kernel density function in order to account for the size of each completed building. The team utilized the default parameters for the kernel density spatial analyst tool. The next step involved creating maps from the results and classifying them using the equal interval method. The team then compared the kernel density maps across decades to determine how the concentration of development changed in San Antonio over time.
In an attempt to more fully understand the centrifugal growth in the city, the team calculated the average distance from the city center, building on work from Gober and Burns [24] and Atkinson-Palombo [25]. This involved using the ArcGIS near tool to calculate the distance from the center of each building in the data set to the center of downtown’s Main Plaza, widely recognized as the heart of the historic city. The final step involved calculating the total developed acres (i.e., coverage) and sorting the data by use (residential single-family, residential multifamily, commercial, and industrial) and by decade (1890–2010).
3. Results
3.1. From Concentric to Polycentric Growth
The first portion of the research uses kernel density analysis to examine the changing form of suburban development in San Antonio. Like many U.S. cities, San Antonio’s historical development maintained a largely concentric form through much of the nineteenth and twentieth centuries. Contained within a 36-square mile colonial grid until the late nineteenth century, the city first began to expand significantly with the advent of the electric streetcar. This growth was predictably radial in form, largely a result of the geographic constraints of streetcar lines. The mid-twentieth century saw suburban expansion accelerate dramatically with the construction of I-410, San Antonio’s first metropolitan ring-road. During this time frame, which lasted until approximately 1990, concentric suburban infill continued to occur within an area stretching between the historic city and I-410. In 1990, the formal pattern of suburban development began to shift dramatically, as development became increasingly fragmented and polycentric. The following section summarizes these growth patterns, while emphasizing the city’s qualitative shift from a concentric to polycentric arrangement.
3.1.1. Pre-1890: The Colonial City
During this initial time frame, the technological limits of transportation confined urban development to the historic downtown (Figure 2). The city was not densely settled, maintaining a rural character until the late 1890s. Until the mid-nineteenth century, most growth was concentrated in the areas surrounding the Alamo and Military Plazas, with the majority of the population living north or south of Main Plaza. Growth after 1845, the year Texas joined the Union, moved east towards Alamo Plaza. This time frame also saw significant commercial development adjacent to the Main and Military Plazas [26]. During the decade of the 1870s, growth drifted towards the southern portion of downtown into an area now referred to as the King William District. During the decade of the 1880s, growth spread north along San Pedro Avenue as well as the route now known as Broadway Street [26].
3.1.2. 1890s–1940s: Streetcar Suburbs and the Linear City
San Antonio, like most U.S. cities, saw dramatic suburban expansion during the streetcar era. The transit system, which commenced operation in 1890, utilized 30 cars and 35 miles of track in 1900. By 1917, the system had expanded to 150 cars and 70 miles. The system reached its peak in 1927 before shutting down operations in 1933, a casualty of the widespread introduction of buses and automobiles [27].
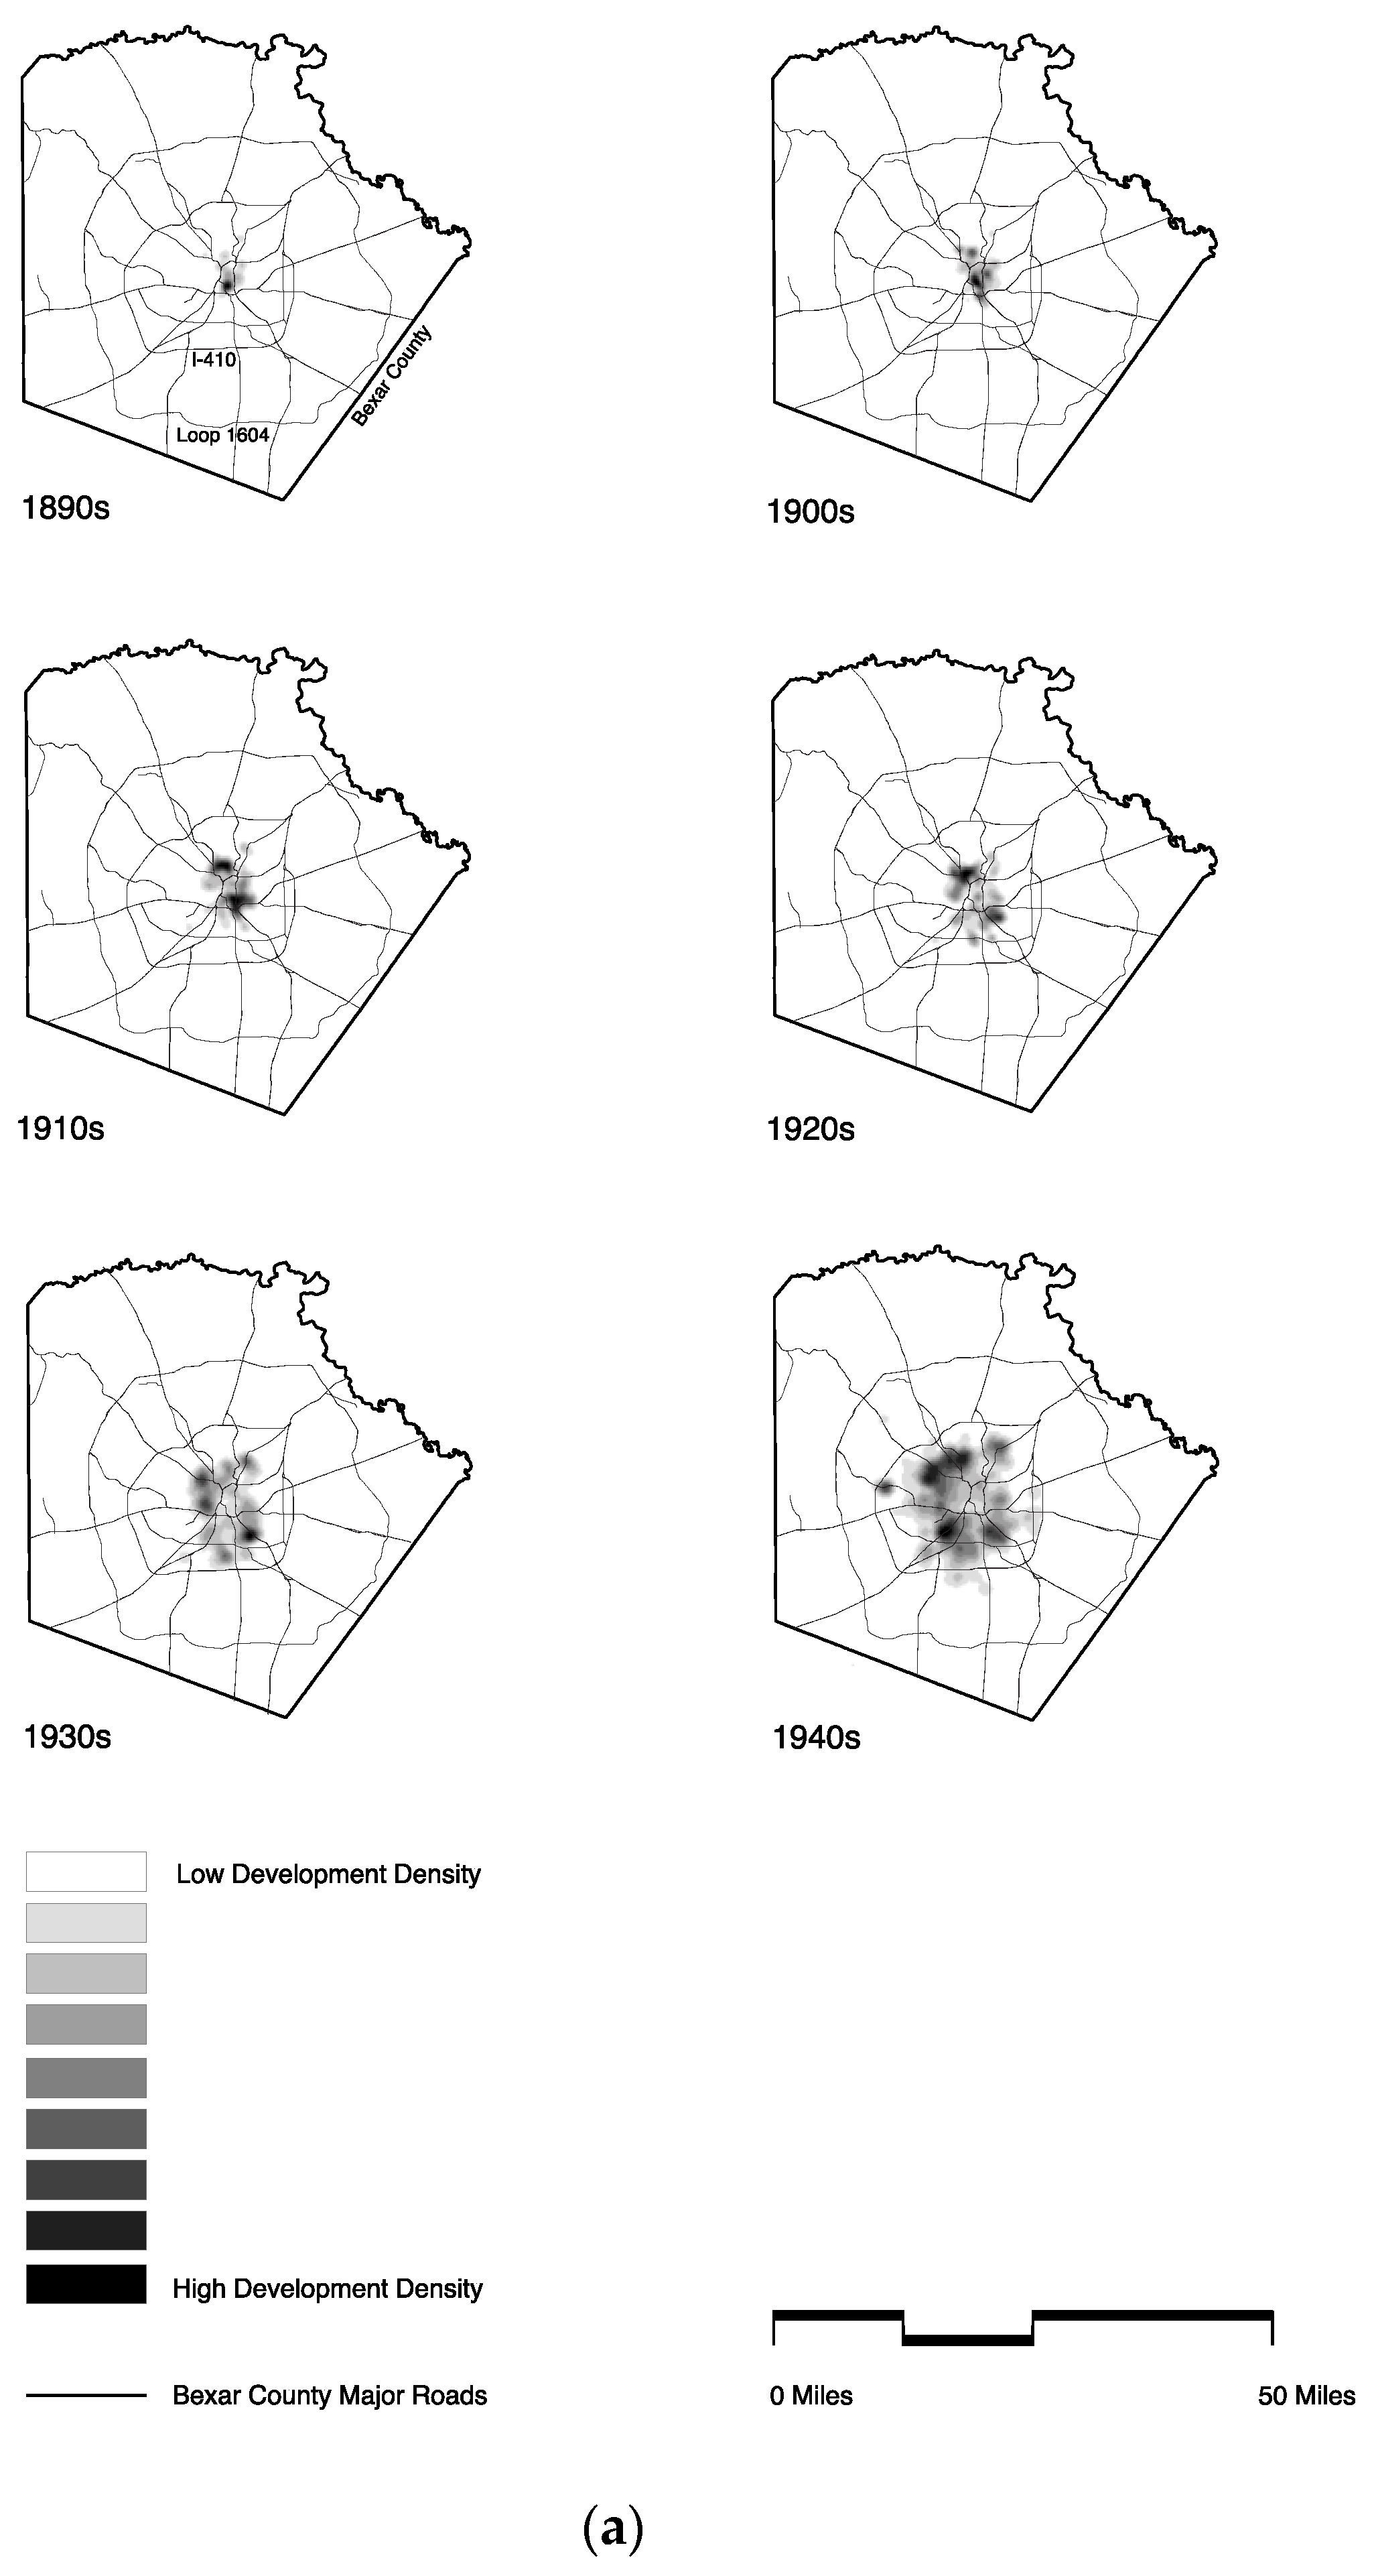
The kernel density analysis demonstrates the positive impact that streetcar lines had on suburban growth during the first decade of the twentieth century, particularly north of downtown in the Five Points and Tobin Hill areas. Development continued to thrive in this area during the 1910s and 1920s. Beacon Hill, for example, saw its housing stock grow from just six structures in 1905, to 119 in 1910 and 230 in 1915 [27]. These decades also saw development intensify west of downtown in Prospect Hill, which gained a streetcar route along West Commerce Street in 1909 [28]. Similar street car developments appeared southeast of downtown in an area then known as South Heights.
The 1930s saw streetcar lines continue to spur radial expansion in multiple directions; to the west along the West Commerce-Prospect Hill line, the northwest along the Beacon Hill Line, and the southwest along the Denver Heights line. Our kernel density analysis shows significant growth in these areas during the decade, despite the demise of the streetcar system in 1933 (Figure 2). The 1940s saw this activity continue, with additional activity to the northwest in Jefferson, the north in Beacon Hill, the southwest in Palm Heights, and to the southeast in Highland Park.
During the 1940s, San Antonio began to annex areas beyond the original 36-square-mile grid. The full impact of annexation as a growth strategy would only reveal itself in subsequent decades. One such area, Los Angeles Heights, showed substantial activity in the northwest portion of the city during this time period [29]. The 1940s also saw peripheral subdivisions like Woodlawn Hills, which never enjoyed the benefit of streetcar access, begin to grow solely based on automotive access [30].
3.1.3. 1950s–1990s: The Concentric City
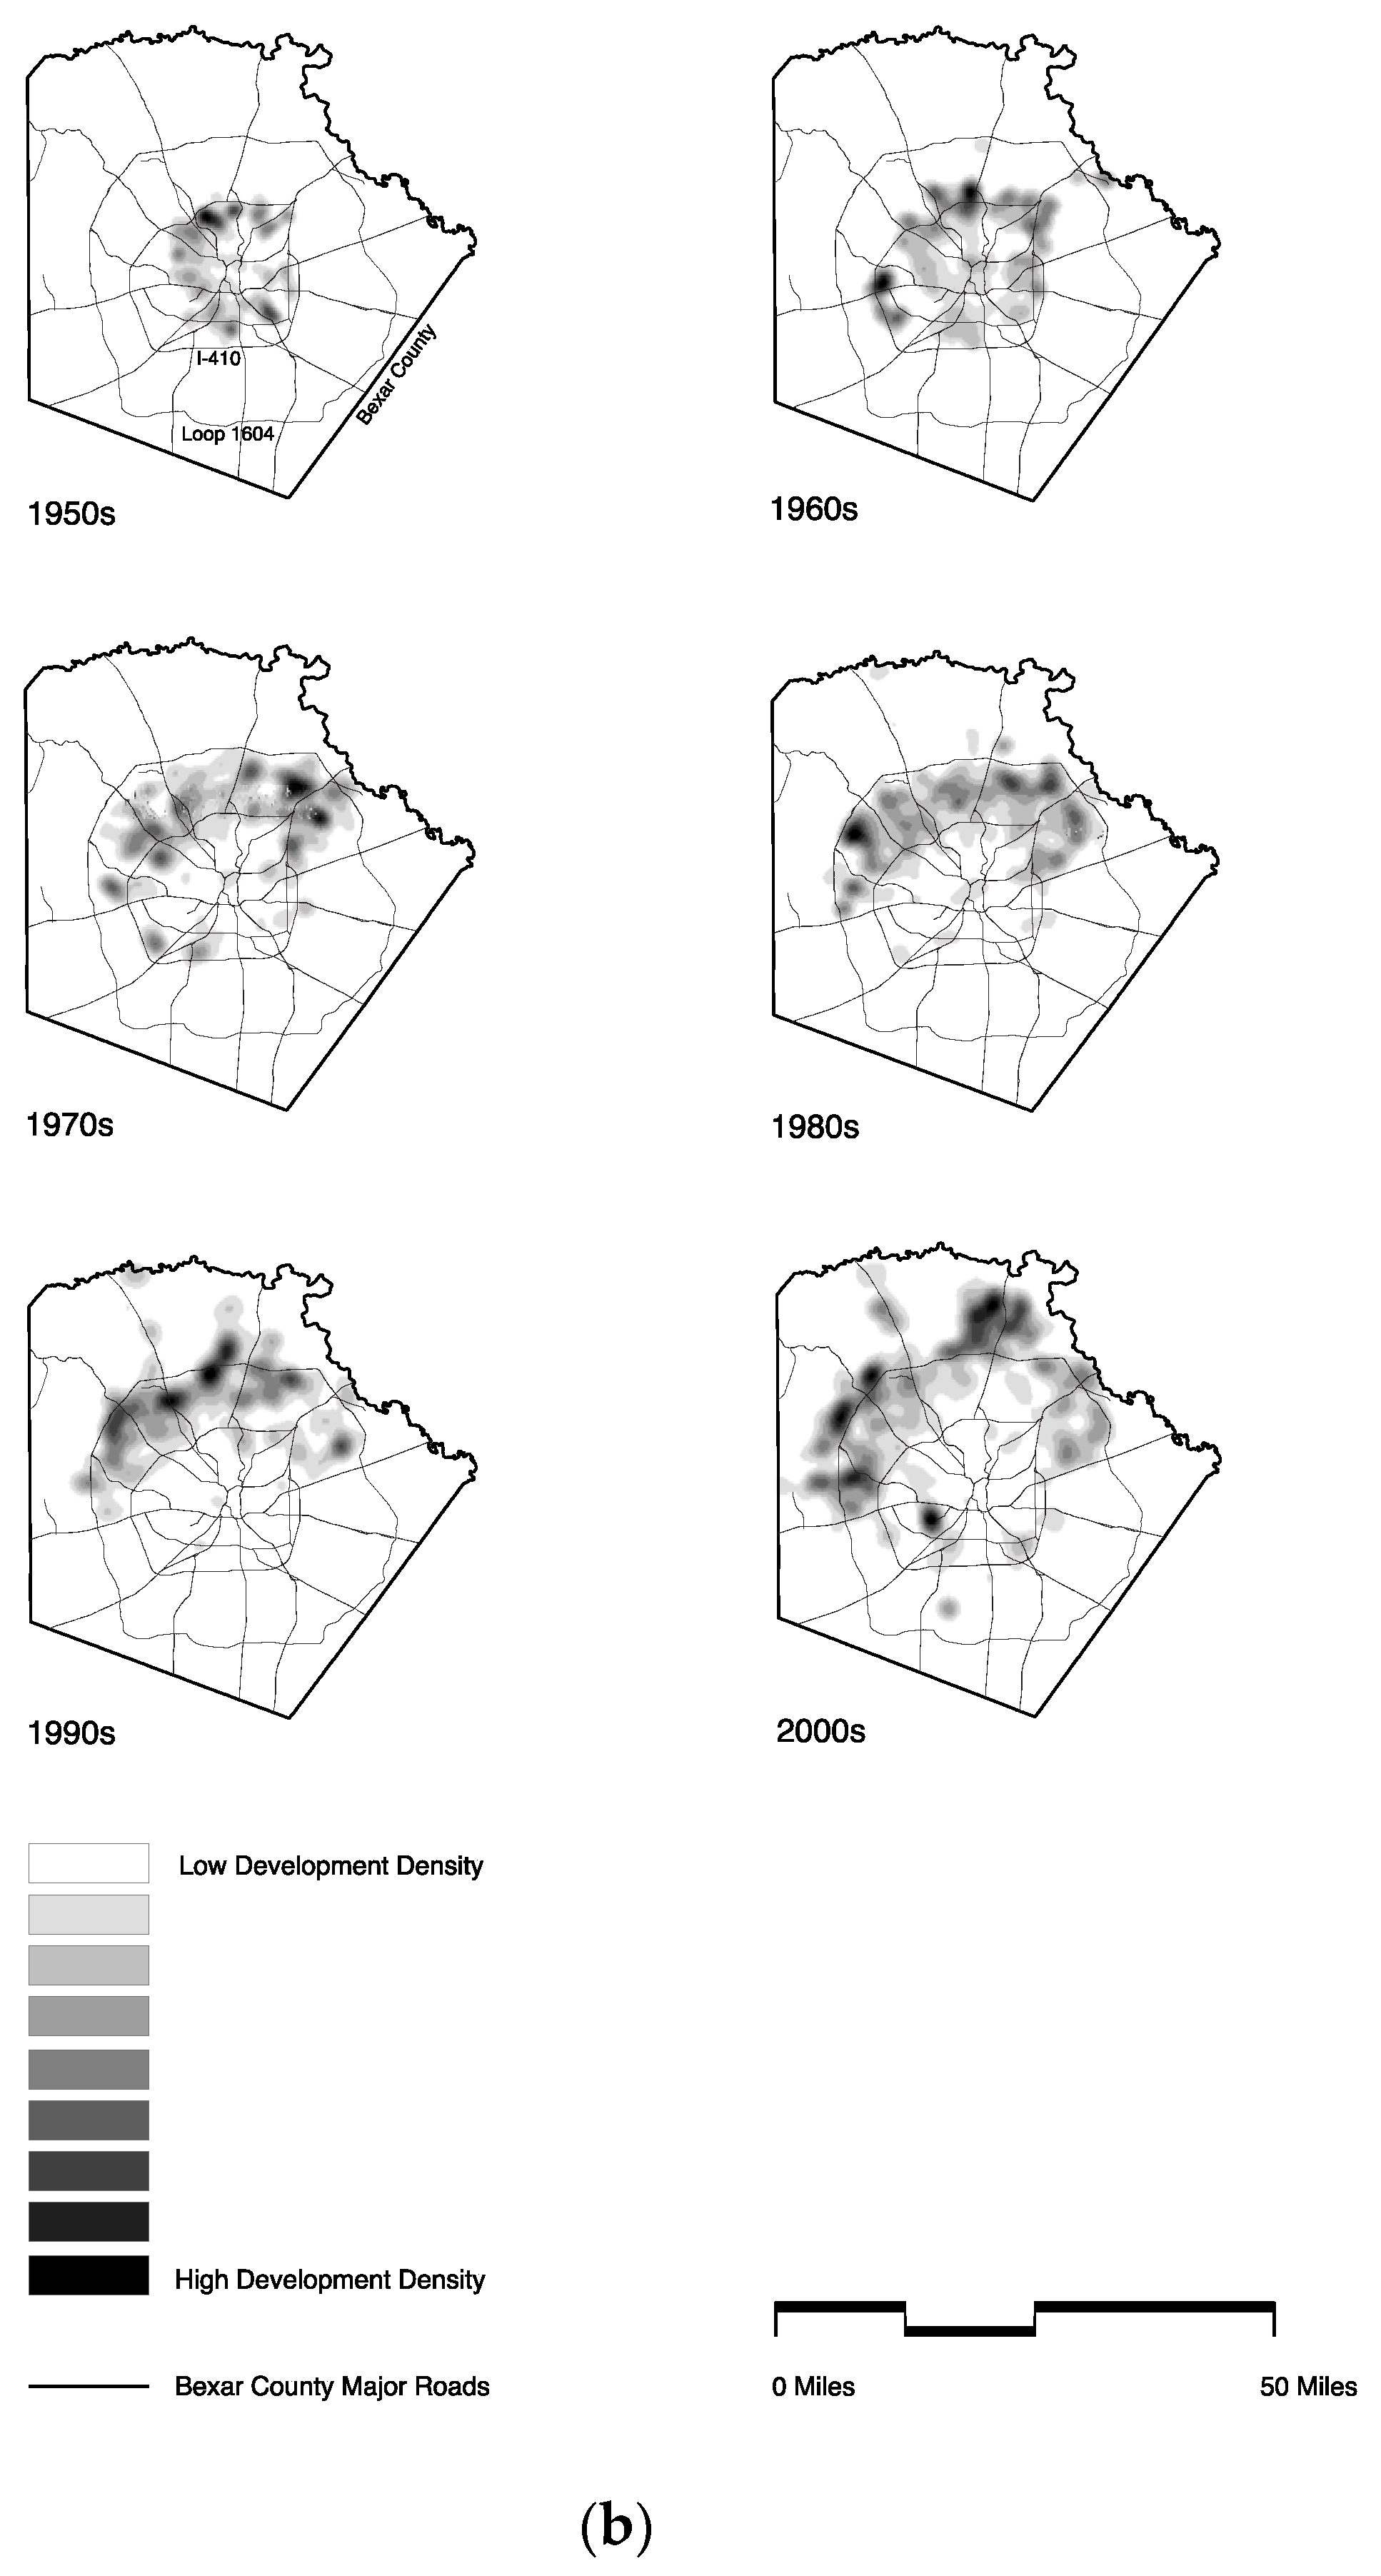
The disappearance of the streetcar and the rise of the automobile can be seen more clearly during the 1950s, as growth began to spread in a concentric pattern around downtown. The most prominent hotspot in the kernel density analysis appeared adjacent to the Northstar Mall, an early regional shopping mall that developers built at the intersection of San Pedro Avenue and I-410 (Figure 2). Still, even with the widespread adoption of the automobile, the vast majority of suburban growth remained inside of I-410.
The formal logic of the automotive suburb came into full view during the 1960s, as growth concentrated itself in a radial pattern around I-410. Hotspots emerged around Lackland Terrace to the west and Castle Hills to the north. Both instances occurred at the nexus of major arterial roadways and I-410. Our analysis of the 1970s and 1980s reveals that the suburbs continued to expand concentrically around downtown, while growth continued to focus north of downtown. During this time period, the downtown area showed virtually no development, while significant infill emerged between I-410 and the 1604 Loop, San Antonio’s second ring road.
While much of San Antonio developed concentrically around downtown during the second half of the twentieth century, the decades of the 1960s and 1970s saw the seeds of polycentric growth take root. This was particularly true northwest of downtown, where three critical actors made significant bets on the suburban expansion of the city. In 1961, voters in Bexar County approved a $5 million bond to fund the construction of a 300-bed hospital and teaching facility. The University of Texas Board of Regents made the controversial decision to locate the new facility on 100 acres of donated land in the Oak Hills area, seven miles northwest of downtown adjacent to the Oak Hills Country Club. In doing so they rejected an alternative site downtown. This decision would drastically change the course of urban development in San Antonio, as today the South Texas Medical Center employs more than 29,000 people and in 2010 had an annual budget of $3.4 billion [31,32].
In 1972, the Board of Regents made another massive bet on the suburban expansion of the city, constructing a new campus for the University of Texas at San Antonio (UTSA) thirteen miles northwest of downtown. The 600-acre tract of land lay in rolling foothills, well beyond the current population and business centers. In 1976, another major San Antonio institution, the United Services Automobile Association (USAA), opened a new corporate headquarters on a 232-acre site along Fredericksburg Road, nine miles northwest of downtown. The construction of the future South Texas Medical Center, UTSA campus, and USAA each provide early examples of leapfrog development, outstripping the existing fabric of the city. While the full impact of these decisions didn’t show up for decades, the kernel density analysis clearly reveals the catalytic impact that these three developments had on subsequent growth.
The kernel density analysis also reinforces the fact that, after 1970, development in San Antonio became concentrated in the northern half of the city. While much of this pattern can be attributed to large-scale capital investment in institutions like the South Texas Medical Center, UTSA, and USAA, historical structural forces had long privileged development in the northern part of the city. During the late nineteenth century, for example, the decision to locate rail corridors on the east and west sides of downtown profoundly impacted the spatial development of the city, creating long and highly undesirable tracts of land. Elites subsequently migrated north along Broadway Street, attracted by the prospect of living in neighborhoods that were not separated from downtown by a railroad crossing. Local ordinances in the late nineteenth and early twentieth centuries similarly privileged the northern part of the city by placing vice-related programs like brothels and gambling on the west side of downtown, while concentrating slaughterhouses on the southwest side [33]. These structural patterns begin to explain why economic investment became increasingly concentrated on the north side of San Antonio during the twentieth century, a trend that continues today. It also provides context for patterns of ethnic segregation that persist in the city today, as whites are disproportionately represented in the north, Mexicans and Mexican-Americans in the west and south, and African-Americans in the east.
3.1.4. 1990s–2000s: Fragmentation and the Emergence of the Polycentric City
During the 1990s, growth continued to expand outwards from the historic center as commercial and residential activity concentrated itself on the north of downtown near the 1604 Loop. The most notable development during this time period was a high-end residential development called Stone Oak, which anchored the northeast portion of the city beyond the 1604 Loop. This geographic expansion continued between the years 2000–2009, as the most intense growth appeared in a series of large peripheral residential developments; three along the 1604 Loop and one in an unincorporated area beyond the northwest limit of San Antonio. The kernel density analysis continued to show a negligible amount of downtown development during the decades of the 1990s and 2000s.
Since 2009, suburban growth in San Antonio became increasingly scattered, as developers continued to leapfrog existing suburban fabric in search of less expensive and underutilized land. Primary hotspots included large residential cul-de-sac developments along I-410 and the 1604 Loop. The metropolitan form of this development represents a qualitative break from mid-twentieth century patterns of suburbanization, which appeared concentrically around the historic downtown.
Another critical and diverging trend involves the appearance of large-scale infill activity adjacent to the historic downtown. Perhaps the best example of this is The Pearl, an adaptive re-use project that occupies an abandoned late-nineteenth century brewery just north of downtown. The early success of this mixed-use project is spawning additional housing and retail activity along an adjacent stretch of Broadway Street.
San Antonio’s ongoing transformation from a monocentric, contained city in the mid-twentieth century to a polycentric, metropolitan region in the first decades of the twenty-first parallels findings in additional U.S. cities [4,34,35]. Wheeler’s [5] analysis of metropolitan regions in Boston, Atlanta, Minneapolis, Albuquerque, Las Vegas, and Portland is particularly relevant, as it confirms that the spatial fragmentation, expansion, and the proliferation of built landscape types have increased dramatically since 1980.
3.2. Centrifugal Growth Accelerates
While the formal structure of San Antonio’s footprint transformed slowly from a concentric footprint focused on downtown to a polycentric footprint with multiple hotspots, the location of growth shifted steadily from the center to the periphery (Table 2). In fact, the trend towards spatial decentralization began during the early decades of the twentieth century, when development began to exit downtown via the streetcar system. A comparison of the 1910s and 1920s shows that the peak zone of suburban development expanded modestly at first, relocating from two to three miles outside of Main Plaza, while the quantity of overall construction increased by more than 400%.
After a relatively stagnant decade during the 1930s, the volume of growth picked up again during the 1940s, as the total number of construction completions grew by 254%. During this time period, centrifugal growth remained relatively modest, as the peak wave of suburban development appeared just four miles beyond Main Plaza.
The rate of expansion accelerated during the decade of the 1950s, as the widespread adoption of automobile and construction of I-410 allowed residents and businesses to more easily evacuate the city. The peak zone of suburban development extended to six miles from the center during the 1950s, nine miles during the 1960s, and eleven miles during the 1970s. By the first decade of the twenty-first century, continuous centrifugal pressure pushed the peak zone of suburban development to 16 miles, while the volume of development also increased dramatically from 69,709 completions during 1950s to 126,057 in the 2000s. San Antonio solidified its position as a booming city between the decades of the 1990s and 2000s, when the number of completions increased by 164%.
San Antonio’s centrifugal growth patterns (Figure 3) align with findings from multiple authors, including Gober and Burns [24], who examined housing completions at the urban-fringe in Phoenix between 1990 and 1998. Their work revealed that centrifugal development proceeded quickly, at a rate of up to half a mile per year, or approximately 4 miles during the study period. Sarzynski, Galster, and Stack [36] similarly discovered that 257 metropolitan areas in the U.S. experienced a decrease in the spatial concentration of employment between the years 1990 and 2000, as jobs moved away from the historic core.
Our data clearly establishes an overwhelming trend towards decentralization in San Antonio, a city that has seen residents and economic activity exit downtown virtually continuously since 1890. Still, a historic anomaly has emerged in recent years along Broadway Street with the introduction of large-scale mixed-use infill developments. These developments, which reside directly adjacent to the downtown core, are countering the long-term trend towards decentralization.
These seemingly opposing trends, centrifugal expansion beyond the 1604 Loop and centrifugal infill adjacent to downtown, suggest the emergence of a more complex urban fabric, one that resists binary definitions of urban periphery and core. It also parallels trends in other Sunbelt cities like Charlotte, North Carolina, which is simultaneously seeing the infill of downtown and expansion of its suburban periphery [20].
3.3. An Increase in the Diversity and Distribution of Residential Typologies
The production of single-family homes drove the economic and geographic expansion of suburbs throughout the United States, particularly in the decades following the Second World War. The data for San Antonio reveals this trend clearly, as the number of single-family completions jumped from 17,110 during the 1930s to 43,963 during the 1940s, an increase of 257% (Table 3). The growth would more than double again during the second half of the twentieth century, as the decade of the 2000s produced 110,633 new single-family units. San Antonio, like most U.S. cities, can attribute the explosion of single-family homes to structural forces that took root during the post-war period, including rapid demographic growth, financial incentives associated with the 1934 creation of the Federal Housing Administration, and the mid-century construction of ring-road highways like I-410.
One of the most compelling aspects of our research, however, involves the increasing impact of multifamily residential buildings on the character of suburban growth. This trend is noteworthy because multifamily completions have historically lagged single-family completions, both in terms of quantity and distance from the suburban fringe. Beginning with the issue of quantity, while the raw number of single-family completions has exceeded multifamily completions in every decade since the 1890s, the relative increase of multifamily completions has exceeded that of single-family completions in five of the last six decades. This figure highlights the increasing impact of this typology on the physical character of suburban growth. The rise of multifamily housing was particularly pronounced during the 2000s, a period of intense growth for San Antonio. During this critical decade, the increase in multifamily completions outpaced that of single-family completions by 242% to 164% (Table 3).
Atkinson-Palombo [25] finds a similar trend in Phoenix, where the average annual number of multifamily completions in 2000–2005 was 60% higher than during the decade of the 1990s. The author explains that higher-value, higher-density, multiple-family housing is indicative of a maturing region approaching build-out. Our data suggests that San Antonio may be entering a similar phase in the history of its urban development.
Another interesting question involves the geographic location of single and multifamily housing, particularly as they relate to the downtown core. Historically, multifamily structures emerge closer to the city center than single-family dwellings, which are more likely to appear at the suburban fringe. This dynamic remains constant throughout most of our data set. In the 1900s, the average distance of a single-family home from downtown was 3 miles, compared to 1.7 miles for a multifamily structure (Table 3). The distance between the two typologies remained fairly constant through the 1950s, as the average single-family home appeared between 0.5 and 1.5 miles further from downtown than the typical multifamily building. The average distance between the location of the two typologies began to increase during the second half of the twentieth century, however, reaching 2.5 miles by the 2000s. These findings parallel those of Gober and Burns [24] and Atkinson-Palombo [25], who both find that multifamily housing on average trails single-family housing in its geographic relationship to the suburban edge.
Interestingly, this pattern began to reverse itself in San Antonio after 2009, as the average distance from the center of multifamily buildings decreased by more than 1.5 miles, while single-family construction continued to expand outwards. This trend in the data likely reflects the construction of recent infill projects adjoining the north and south sides of downtown. Atkinson-Palombo [25] notes that the average location of multifamily buildings can be highly variable due to the construction of a few large complexes in any given time frame. This dynamic is likely impacting the most recent data in San Antonio.
While the decreasing distance of multifamily housing from the urban core is noteworthy, it hardly represents the ‘return-to-the-city’ scenario that proponents of San Antonio’s ‘Decade of Downtown’ once imagined. In fact, since 2009, the average new multifamily structure appeared 9 miles from downtown, while the average single-family home appeared 15 miles from downtown. These numbers serve as reminders that the vast majority of San Antonio’s development is still occurring well beyond the confines of historic downtown and even beyond the inner ring suburbs.
4. Discussion
The current research confirms several critical trends: first, since the year 2000 San Antonio’s urban development has become increasingly polycentric; second, the rate of centrifugal growth has increased dramatically since 1990; and, third, multifamily housing is playing an increasingly large role in defining the form and program of the metropolitan area. Collectively, these trends attest to San Antonio’s emergence as a polycentric metropolitan area, where the vast majority of growth is occurring beyond the limits of the traditional city.
While this observation does not distinguish San Antonio among Sunbelt cities, it does represent a bold reconceptualization of the metropolitan region. Prevailing public images of the Alamo City focus almost exclusively on downtown, highlighting the beautifully preserved Spanish colonial grid, Alamo, Riverwalk promenade, and Mission district. This image is magnified by the city’s impressive record of historic preservation, which became even more distinguished in 2015 with UNESCO’s inscription of the San Antonio Missions as World Heritage sites. San Antonio’s historic emphasis on the downtown core has driven tourism and urban policy for decades. Still, the data makes clear that halfway through the ‘Decade of Downtown’, relatively little of the city’s development is actually occurring downtown.
The results of this research in no way diminish the physical and cultural importance of San Antonio’s historic downtown and Missions. Rather, they question the relevance of a concentric growth model in light of persistently scattered development patterns that favor the periphery. Modarres [37] (p. 120) makes the argument that in order ‘to build a sustainable, polycentric or networked city, we need to re-think our notions of urbanism, urban planning, urban management, and development’. Increasingly, the planning community in San Antonio is taking up this challenge while recasting suburban development as something more than an unfortunate aberration.
The recently completed 2016 Comprehensive Plan successfully challenges dated concentric models that would privilege the historic downtown and central business district. The current plan forecasts that no fewer than thirteen distinct employment centers will be required to absorb the continuing economic boom [3]. This shift is noteworthy to the extent that it imagines the next San Antonio as a rapidly expanding, polycentric, decentralized landscape that will continue to resist geographic containment. Only by fully accepting this reality can San Antonio begin to generate sustainable growth policies that critically engage land use, transportation, open space conservation, and aquifer preservation.
The Comprehensive Plan’s decision to abandon a concentric model in favor of a polycentric one seems particularly appropriate given the lack of political will to implement growth restrictions, such as the ones that curtailed geographic expansion in Portland, Oregon [38]. If policy-makers truly intend to guide growth towards a more sustainable outcome, they must assertively engage the suburban periphery. This will necessitate new approaches to land development that incentivize urban infill and density, not just in downtown and inner-ring locations but also in post-war suburbs and even at the emerging edge. This approach will require the development of new suburban prototypes that can increase densities and mix uses without the benefit of traditional urban morphologies. Such an approach may also begin to challenge the conventional wisdom that emphasizes the importance of leveraging existing infrastructures, particularly those with physical proximity to the historical center. While the logic of this position is clear, it does not account for the fact that, historically, most development has occurred at the periphery of the city, a zone that has moved continuously farther from the historical center since 1890 (Table 2, Figure 3).
In a span of several decades, San Antonio has emerged as the fastest growing major city in the U.S., easily outpacing Phoenix and San Diego, its two closest competitors [39]. This seismic shift is placing unprecedented demand on local ecologies and infrastructures. It is also stretching San Antonio’s civic imagination, requiring policy-makers and residents to confront the unfamiliar terms of contemporary urbanism while relinquishing historic notions of a concentric city that lost currency after the Second World War.
As San Antonio scrambles to accommodate this growth, it must aspire to urban models that expand the physical and conceptual parameters of the Spanish colonial grid. Within this context, the theoretical framework of New Suburbanism becomes relevant, infusing the discourse with new ideas while avoiding the lament that often accompanies discussions of suburban growth. While efforts to preserve downtown and infill the central city remain vital, the next chapter in San Antonio’s story is being written at the city’s periphery and beyond. As San Antonio sets course for the next twenty-five years, it must continue to explore a more dynamic relationship with this emerging geography, conceiving a future sufficiently complex to befit the city’s celebrated past.
Acknowledgments
The authors would like to thank UTSA student Sarah Barrios, who assisted with the maps. Additionally, Tuan Le and Rolando Vega from the Texas Sustainable Energy Research Institute and Hongjie Xie from the Department of Geological Sciences of UTSA led the processing of the TNRIS LiDAR dataset to extract the 2010 building footprint database. This process was funded in part by monies provided by CPS Energy through an Agreement with The University of Texas at San Antonio.
Author Contributions
Ian Caine and Rebecca Walter conceived the paper and experiments; Rebecca Walter and Nathan Foote performed the experiments; Rebecca Walter and Nathan Foote analyzed the data; Ian Caine wrote the paper.
Conflicts of Interest
The authors declare no conflict of interest.
References and Notes
- United States Census Bureau. Annual Estimates of the Resident Population for Incorporated Places of 50,000 or More, Ranked by July 1, 2015 Population: April 1, 2010 to July 1, 2015—United States—Places of 50,000+ Population. Available online: http://factfinder.census.gov/faces/tableservices/jsf/pages/productview.xhtml?src=bkmk (accessed on 15 September 2016).
- Rivard, R. City Planning for San Antonio Growth Bomb; Rivard Report: San Antonio, TX, USA, 2014. [Google Scholar]
- MIG in Association with Economic & Planning Systems, Inc.; WSP; Parsons Brinkerhoff; Ximenes & Associates, Inc. City of San Antonio: Comprehensive Plan. San Antonio, TX, USA, 2016. Available online: http://www.sacompplan.com/files/managed/Document/479/SATomorrow_Comp%20Plan_Final_09.2.16_lowres2.pdf (accessed on 15 September 2016).
- Mieszkowski, P.; Mills, E.S. The Causes of Metropolitan Suburbanization. J. Econ. Perspect. 1993, 7, 135–147. [Google Scholar] [CrossRef]
- Wheeler, S.M. The Evolution of Built Landscapes in Metropolitan Regions. J. Plan. Educ. Res. 2008, 27, 400–416. [Google Scholar] [CrossRef]
- Farris, J.T. The barriers to using urban infill development to achieve smart growth. Hous. Policy Debate 2001, 12, 1–30. [Google Scholar] [CrossRef]
- Blake, P. God’s Own Junkyard: The Planned Deterioration of America’s Landscape; Holt, Rinehart and Winston: New York, NY, USA, 1964. [Google Scholar]
- Kunstler, J.H. The Geography of Nowhere: The Rise and Decline of America’s Man-Made Landscape; Simon and Schuster: New York, NY, USA, 1993. [Google Scholar]
- Duany, A.; Plater-Zyberk, E.; Speck, J. Suburban Nation: The Rise of Sprawl and the Decline of the American Dream; North Point Press: New York, NY, USA, 2000. [Google Scholar]
- Calthorpe, P. The Next American Metropolis: Ecology, Community and the American Dream; Princeton Architectural Press: New York, NY, USA, 1993. [Google Scholar]
- Calthorpe, P.; Fulton, W. The Regional City: Planning for the End of Sprawl; Island Press: Washington, DC, USA, 2001. [Google Scholar]
- Duany, A.; Speck, J.; Lydon, M. The Smart Growth Manual; McGraw-Hill: New York, NY, USA, 2010. [Google Scholar]
- Bruegmann, R. Sprawl: A Compact History; University of Chicago Press: Chicago, IL, USA, 2005. [Google Scholar]
- Kotkin, J. The New Suburbanism: A Realist’s Guide to the American Future; The Planning Center: San Mateo, CA, USA, 2005. [Google Scholar]
- DeJong, J. New SubUrbanisms; Routledge: New York, NY, USA, 2014. [Google Scholar]
- Dunham-Jones, E. Seventy-five Percent: The Next Big Architectural Project. Harv. Des. Mag. 2001, 12, 1–21. [Google Scholar]
- Dunham-Jones, E.; Williamson, J. Retrofitting Suburbia: Urban Design Solutions for Redesigning Suburbs; John Wiley & Sons Inc.: Somerset, NJ, USA, 2009. [Google Scholar]
- Tachieva, G. Sprawl Repair Manual; Island Press: Washington, DC, USA, 2010. [Google Scholar]
- Davila, V. San Antonio commission approves comprehensive plan despite neighborhood opposition. Available online: http://www.expressnews.com/news/local/article/San-Antonio-commission-approves-comprehensive-8479886.php (accessed on 4 April 2017).
- Delmelle, E.C.; Zhou, Y.; Thill, J.C. Densification without Growth Management? Evidence from Local Land Development and Housing Trends in Charlotte, North Carolina, USA. Sustainability 2014, 6, 3975–3990. [Google Scholar] [CrossRef]
- Blumenfeld, H. The tidal wave of metropolitan expansion. J. Am. Inst. Plan. 1954, 10, 3–14. [Google Scholar] [CrossRef]
- Hart, J.F. The perimetropolitan bow wave. Geogr. Rev. 1991, 81, 35–51. [Google Scholar] [CrossRef]
- Pond, B.; Yeates, M. Rural/Urban land conversion I: Estimating the direct and indirect impacts. Urban Geogr. 1993, 14, 323–347. [Google Scholar] [CrossRef]
- Gober, P.; Burns, E. The size and shape of Phoenix’s urban fringe. J. Plan. Educ. Res. 2002, 21, 379–390. [Google Scholar] [CrossRef]
- Atkinson-Palombo, C. New housing construction in Phoenix: Evidence of ‘new suburbanism’? Cities 2010, 27, 77–86. [Google Scholar] [CrossRef]
- Johnson, D. Interview. 21 November 2017. [Google Scholar] [CrossRef]
- Appler, J. General Directory of the City of San Antonio (1900, 1917, 1919, 1927). In San Antonio on Track: The Suburban and Street Railway Complex through 1933; Watson, A.M., Ed.; Trinity University: San Antonio, TX, USA, Unpublished work.
- Rullman, H. Map of the City of San Antonio. Daughters of the Republic of Texas Library (1909). In San Antonio on Track: The Suburban and Street Railway Complex through 1933; Watson, A.M., Ed.; Trinity University: San Antonio, TX, USA, Unpublished work.
- Pioneer Flour Mills, 100th Anniversary Pioneer Flour Mills 1851–1951 (San Antonio: Naylor, Co., 1951) 76. In San Antonio on Track: The Suburban and Street Railway Complex through 1933; Watson, A.M. (Ed.) Trinity University: San Antonio, TX, USA, Unpublished work.
- Pfeiffer, M.W. Deed Records, vol. 642, p.83. In San Antonio on Track: The Suburban and Street Railway Complex through 1933; Watson, A.M., Ed.; Trinity University: San Antonio, TX, USA, Unpublished work.
- O’Hare, P. San Antonio once largest city to lack medical school. San Antonio Express-News, 9 May 2015. [Google Scholar]
- South Texas Medical Center. 8 Facts about STMC. Available online: http://southtexasmed.com/who-we-are/ (accessed on 1 April 2017).
- Johnson, D. Interview. In Historic Roots of Modern Residential Segregation in a Southwestern Metropolis: San Antonio, Texas in 1910 and 2010; Walter, R., Foote, N., Cordoba, H., Sparks, C., Eds.; 7 February 2017; Unpublished work. [Google Scholar]
- Anas, A.; Arnott, R.; Small, K. Urban spatial structure. J. Econ. Lit. 1998, 36, 1426–1464. [Google Scholar]
- Burchfield, M.; Overman, H.; Puga, D.; Turner, M. Causes of sprawl: A portrait from space. Q. J. Econ. 2006, 121, 587–633. [Google Scholar] [CrossRef]
- Sarzynski, A.; Galster, G.; Stack, L. Evolving United States metropolitan land use patterns. Urban Geogr. 2014, 35, 25–47. [Google Scholar] [CrossRef]
- Modarres, A.; Kirby, A. Viewpoint: The suburban question: notes for a research program. Cities 2010, 27, 114–121. [Google Scholar] [CrossRef]
- Catenaccio, G. Urban growth boundaries: Two American examples. Projections 10: Des. Growth Chang. 2011, 10, 13–30. [Google Scholar]
- Gonzales, F. San Antonio: Demographic Distribution and Change 2000 to 2010. Available online: http://www.sanantonio.gov/portals/0/Files/planning/Census2000To2010DemographicChangeSummaryReport.pdf (accessed on 14 September 2016).
Figure 1.
Urban development in Bexar County, 2010.

Figure 2.
(a) Kernel Density Analysis for Construction, Bexar County 1890s–1940s; (b) Kernel Density Analysis for Construction, Bexar County 1950s–2000s. Note: The current location of arterial and ring roads is included on all diagrams for geographic reference only.
Figure 2.
(a) Kernel Density Analysis for Construction, Bexar County 1890s–1940s; (b) Kernel Density Analysis for Construction, Bexar County 1950s–2000s. Note: The current location of arterial and ring roads is included on all diagrams for geographic reference only.


Figure 3.
Number of Construction Completions by Distance from Center, Bexar County 1950–2009.


Table 1.
Number of Construction Completions, Bexar County 1890–2009. Source: Bexar County Property Appraiser 2015.
Table 1.
Number of Construction Completions, Bexar County 1890–2009. Source: Bexar County Property Appraiser 2015.
| Decade | Buildings (Count) | Developed Land (Acres) | Avg. Distance from Center (Miles) |
|---|---|---|---|
| 1890s | 438 | 17 | 2.8 |
| 1900s | 2393 | 100 | 2.8 |
| 1910s | 5148 | 188 | 2.6 |
| 1920s | 19,392 | 681 | 2.9 |
| 1930s | 18,830 | 643 | 3.7 |
| 1940s | 47,824 | 1663 | 4.2 |
| 1950s | 69,709 | 2929 | 5.5 |
| 1960s | 64,887 | 3622 | 7.8 |
| 1970s | 80,062 | 4849 | 9.9 |
| 1980s | 91,343 | 5720 | 11.0 |
| 1990s | 76,727 | 4452 | 12.2 |
| 2000s | 126,421 | 8242 | 12.8 |
| Total | 603,174 | 33,106 |
Table 2.
Number of Construction Completions by Distance from Center, Bexar County, 1890–present.
| Miles | 1890s | 1900s | 1910s | 1920s | 1930s | 1940s | 1950s | 1960s | 1970s | 1980s | 1990s | 2000s |
|---|---|---|---|---|---|---|---|---|---|---|---|---|
| 1 | 105 | 336 | 257 | 406 | 239 | 268 | 225 | 226 | 116 | 220 | 121 | 94 |
| 2 | 216 | 1031 | 2019 | 4504 | 3257 | 2805 | 1428 | 939 | 459 | 614 | 435 | 524 |
| 3 | 53 | 641 | 1970 | 8361 | 5558 | 10,442 | 4491 | 1221 | 419 | 758 | 546 | 620 |
| 4 | 16 | 113 | 431 | 3740 | 4875 | 14,897 | 9733 | 3326 | 1199 | 1179 | 923 | 1237 |
| 5 | 4 | 38 | 207 | 1381 | 2798 | 10,826 | 15,406 | 5694 | 1869 | 1580 | 1154 | 1801 |
| 6 | 2 | 18 | 83 | 418 | 755 | 4039 | 20,801 | 8124 | 2850 | 2327 | 1256 | 2427 |
| 7 | 0 | 38 | 16 | 116 | 238 | 1194 | 8734 | 9776 | 7324 | 3871 | 1449 | 3766 |
| 8 | 0 | 12 | 6 | 62 | 135 | 976 | 3610 | 9114 | 7529 | 5727 | 2384 | 3240 |
| 9 | 0 | 13 | 10 | 7 | 82 | 154 | 522 | 10,366 | 9816 | 5987 | 2648 | 6480 |
| 10 | 7 | 9 | 32 | 65 | 73 | 272 | 958 | 6732 | 9022 | 7931 | 5112 | 7783 |
| 11 | 6 | 4 | 14 | 37 | 61 | 210 | 607 | 1149 | 13,552 | 12,505 | 8708 | 9915 |
| 12 | 0 | 14 | 13 | 14 | 56 | 209 | 618 | 914 | 10,468 | 16,008 | 12,247 | 10,959 |
| 13 | 0 | 18 | 13 | 32 | 83 | 205 | 547 | 1551 | 6251 | 13,795 | 13,347 | 12,278 |
| 14 | 2 | 15 | 9 | 25 | 87 | 182 | 294 | 1019 | 2513 | 6903 | 8722 | 13,984 |
| 15 | 2 | 19 | 1 | 18 | 79 | 187 | 307 | 1552 | 1881 | 3206 | 5237 | 16,379 |
| 16 | 3 | 13 | 21 | 43 | 132 | 249 | 414 | 1243 | 903 | 2014 | 3355 | 11,517 |
| 17 | 10 | 24 | 3 | 37 | 90 | 225 | 363 | 498 | 822 | 1308 | 1765 | 7312 |
| 18 | 3 | 14 | 27 | 54 | 91 | 202 | 259 | 420 | 587 | 1228 | 2087 | 6275 |
| 19 | 5 | 7 | 7 | 23 | 58 | 120 | 146 | 338 | 677 | 1214 | 1725 | 4682 |
| 20 | 4 | 9 | 1 | 25 | 33 | 70 | 122 | 449 | 760 | 1089 | 1081 | 2524 |
| 21 | 0 | 6 | 9 | 27 | 43 | 63 | 150 | 257 | 621 | 674 | 840 | |
| 22 | 2 | 0 | 1 | 12 | 22 | 30 | 39 | 252 | 332 | 295 | 547 | |
| 23 | 0 | 0 | 1 | 5 | 6 | 16 | 33 | 278 | 480 | 626 | 801 | |
| 24 | 5 | 2 | 9 | 5 | 21 | 10 | 14 | 202 | 430 | 737 | 332 | |
| 25 | 4 | 1 | 5 | 54 | 16 | 93 | 104 | |||||
| 26 | 2 | |||||||||||
| Total | 438 | 2393 | 5148 | 19,392 | 18,830 | 47,824 | 69,709 | 64,887 | 80,062 | 91,343 | 76,727 | 126,421 |
Table 3.
Average Distance from City Center of Construction Completions by Type, Bexar County 1890–2009.
Table 3.
Average Distance from City Center of Construction Completions by Type, Bexar County 1890–2009.
| Residential Single-Family | Residential Multi Family | Commercial | Industrial | Total Buildings | ||||||
|---|---|---|---|---|---|---|---|---|---|---|
| Time Period | Buildings (Count) | Avg. Distance from Center (Miles) | Buildings (Count) | Avg. Distance from Center (Miles) | Buildings (Count) | Avg. Distance from Center (Miles) | Buildings (Count) | Avg. Distance from Center (Miles) | Buildings (Count) | Avg. Distance from Center (Miles) |
| 1890s | 369 | 3.1 | 39 | 1.7 | 30 | 1.1 | 0 | NA | 438 | 2.8 |
| 1900s | 1925 | 3.0 | 226 | 1.7 | 200 | 1.8 | 42 | 2.7 | 2393 | 2.8 |
| 1910s | 4574 | 2.6 | 407 | 2.0 | 161 | 1.9 | 6 | 0.9 | 5148 | 2.6 |
| 1920s | 17,722 | 3.0 | 1215 | 2.4 | 408 | 2.4 | 47 | 1.1 | 19,392 | 2.9 |
| 1930s | 17,110 | 3.7 | 1052 | 2.7 | 637 | 3.5 | 31 | 1.9 | 18,830 | 3.7 |
| 1940s | 43,963 | 4.2 | 1926 | 3.4 | 1884 | 5.2 | 51 | 4.0 | 47,824 | 4.2 |
| 1950s | 64,872 | 5.5 | 1361 | 4.1 | 3255 | 5.0 | 221 | 4.3 | 69,709 | 5.5 |
| 1960s | 55,836 | 8.0 | 3352 | 6.3 | 4861 | 5.9 | 838 | 5.2 | 64,887 | 7.8 |
| 1970s | 67,381 | 10.3 | 4997 | 7.4 | 7202 | 7.9 | 482 | 7.7 | 80,062 | 9.9 |
| 1980s | 72,319 | 11.6 | 8067 | 8.8 | 10,458 | 9.1 | 499 | 8.6 | 91,343 | 11.0 |
| 1990s | 67,523 | 12.5 | 2202 | 9.7 | 6691 | 10.1 | 311 | 9.6 | 76,727 | 12.2 |
| 2000s | 110,633 | 13.1 | 5332 | 10.6 | 9765 | 10.4 | 691 | 10.0 | 126,421 | 12.8 |
© 2017 by the authors. Licensee MDPI, Basel, Switzerland. This article is an open access article distributed under the terms and conditions of the Creative Commons Attribution (CC BY) license (http://creativecommons.org/licenses/by/4.0/).
Share and Cite
MDPI and ACS Style
Caine, I.; Walter, R.; Foote, N. San Antonio 360: The Rise and Decline of the Concentric City 1890–2010. Sustainability 2017, 9, 649. https://doi.org/10.3390/su9040649
AMA Style
Caine I, Walter R, Foote N. San Antonio 360: The Rise and Decline of the Concentric City 1890–2010. Sustainability. 2017; 9(4):649. https://doi.org/10.3390/su9040649
Chicago/Turabian StyleCaine, Ian, Rebecca Walter, and Nathan Foote. 2017. "San Antonio 360: The Rise and Decline of the Concentric City 1890–2010" Sustainability 9, no. 4: 649. https://doi.org/10.3390/su9040649
Note that from the first issue of 2016, this journal uses article numbers instead of page numbers. See further details here.