
Simplified I-V Characteristic Tester for Photovoltaic Modules Using a DC-DC Boost Converter

1
Department of Energy Engineering and Built Environment, An-Najah National University, 97300 Nablus, Palestine
2
Institute of Networked & Embedded Systems/Lakeside Labs, Alpen-Adria-Universität Klagenfurt, 9020 Klagenfurt, Austria
3
Department of Electric, Electronic and Systems Engineering, Faculty of Engineering and Built Environment, Universiti Kebangsaan Malaysai, 43600 Bangi, Malaysia
*
Author to whom correspondence should be addressed.
Sustainability 2017, 9(4), 657; https://doi.org/10.3390/su9040657
Submission received: 17 March 2017
/
Revised: 14 April 2017
/
Accepted: 17 April 2017
/
Published: 20 April 2017
(This article belongs to the Special Issue Solar Photovoltaic Electricity)
Abstract
:In this paper, an efficient testing system for measuring a PV module’s I-V curve is proposed. The proposed system is based on a controlled DC-DC boost converter. The advantage of using a DC-DC converter is that this converter is typically used in PV systems to track the maximum power point and to control the charging of the battery. Consequently, this device is utilized for I-V curve extraction without the need for further external devices. The I-V curve is extracted by modifying the duty cycle of the triggering signal of the boost converter’s switch. The proposed system has been tested experimentally using a 120 Wp PV module. The results show that the proposed system can successfully extract I-V curves of PV module. Notably, the performance of the tested module, as measured by this study’s system as well as with a reference system, was found to be in the range of 61–67% of the performance given in the datasheet. Hence, this result highlights the importance of considering a measurement of the actual performance of PV modules when designing any PV system so as to avoid an undersized system. The proposed I-V testing system can be used as a simple tool to diagnose any shortages or low performance problems in PV system.
1. Introduction
Photovoltaic (PV) generation is a popular use of solar radiation. Consequently, its installation is growing, as it is a renewable and sustainable energy source. One of the most important properties of PV systems is the I-V characteristic curve of the PV module/array. The I-V curve provides important performance information about PV modules such as open circuit voltage, short circuit current, maximum rated power, maximum current, maximum voltage, and module’s efficiency. These parameters are extremely important for utilizing, testing, calibrating, commissioning, designing, maintaining, and controlling PV systems [1].
The simplest way to measure the I-V curve of a PV module is to use a variable resistor. Theoretically, the values of the current and the voltage will be varied in progressive steps from zero to infinite resistance. By monitoring these values, the I-V curve features can be extracted. Such a method was used in some previous research work [2,3]. However, this method can be only applied to PV modules with low power capacity due to lack of resistors with high power capacity. Moreover, it is not possible to achieve the boundary conditions of the I-V curve perfectly, as such conditions require setting the load to exactly zero ohm. Therefore, capacitive loads were utilized for this purpose as well. Mahmoud in [4] has used a capacitive load to extract the I-V characteristic features of a specific PV module. The authors of this research suggest charging a capacitive load by the PV module. During the charging process, some of the I-V curve features can be obtained by monitoring the voltage and the current in the circuit. However, there are some drawbacks of this method that test time, PV module open circuit voltage and short circuit current measurement, and device scalability for different PV module sizes. Muñoz and Lorenzo in [5] have utilized the principle of the charging capacitive load for I-V characteristic extraction but avoid some of the drawbacks of the capacitive test. That method measures the PV module short circuit current and open circuit voltage at the initial and the final boundary conditions of the charging process. When the capacitor is totally discharged, the charging current is at its maximum and can be considered as PV module’s short circuit current. On the other hand, when the capacitor is fully charged, the PV module’s current reaches zero. At this point, the open circuit voltage can be measured. Additionally, more novel controllers were used to increase testing speed.
In addition to the aforementioned methods, transistors (usually MOSFETs) have been used for I-V characteristic extraction. This method, which is commonly known as electronic load method, utilizes the resistance between the MOSFET’s drain and source. This resistor can be modulated using a control signal, and thus the flow of current supplied by the PV module can be monitored. In this method, the MOSFET must be operated in its three modes of operation: cut-off, active, and ohmic region. The advantage of this method is the testing speed, whereas MOSFET’s resistance can be modulated quickly. However, when using a single MOSFET, the method becomes limited for medium power applications, as MOSFETs have limited power capability [6,7]. Kuai and Yuvarajan [6] utilized the high current produced by the PV array by utilizing several MOSFETs operated in parallel. The authors of [7] have proposed several transistors in cascade for measuring the I-V curve. Another method proposed to measure the I-V characteristic is the use of bipolar power amplifiers. This method utilizes traditional class-B power amplifier which allows measuring the dark I-V curves of the PV module through the reversed current and voltage. It uses two BJTs transistors as load for forward and reverse current, respectively [8]. In addition, four-quadrant power supply systems can also be used for measuring I-V characteristic curves. Such a system can be used as an adjustable load for another PV module, whereas the I-V curve can be obtained in the first quadrant. Moreover, mismatching in PV module operation can be diagnosed in the second and fourth quadrant. The drawbacks of this method are that it is expensive and not capable of handling PV systems with a capacity higher than 1 kW [9,10].
Finally, DC-DC converters can also be used to measure I-V curves of PV modules. DC-DC converters are power electronic circuits consisting of a switch, storage elements, diodes, filters, and resistors. These circuits can modify the voltage of a power source by modulating the triggering signal of the associated switch. There are three types of DC-DC converters: boost, buck, and buck-boost converters. Boost converters are used to raise the voltage of a power source, while buck converters are used to reduce this voltage. Buck-boost converters can operate in both modes. The impedance of these controllers can be modulated by changing the duty cycle of switch’s triggering single. Utilizing this property, some of I-V curve testers based on DC-DC converters were proposed [11,12,13,14]. An elegant review of these methods was conducted by Duran et al. [15]. In summary, it is concluded that the DC-DC converters method exceeds other methods in terms of flexibility, modularity, fidelity, fast response, direct display, and cost. However, DC-DC converters still have a problem to consider: the measurement of a PV module’s open circuit voltage and short circuit current. Theoretically it is possible to control the duty cycle of the triggering signal from 0–100%. Deriving from experience, it is not recommended to set the duty cycle beyond 80% as power losses significantly increase in these cases due to the high current passing through the converter. In addition, stability of the converter becomes critical when operating in this mode.
Currently, many PV modules come a with distributed maximum power point tracker (MPPT). This MPPT is a controlled DC-DC converter. Thus, this feature can be utilized to extract the I-V characteristics of a PV module so as to assess the performance of the module. Based on this, this study proposes an I-V characteristic tester for PV panels using DC-DC boost converter in this paper. The system is analyzed and tested experimentally in order to provide new data for such technology and to prove its applicability.
2. Solar Cell Mathematical Model
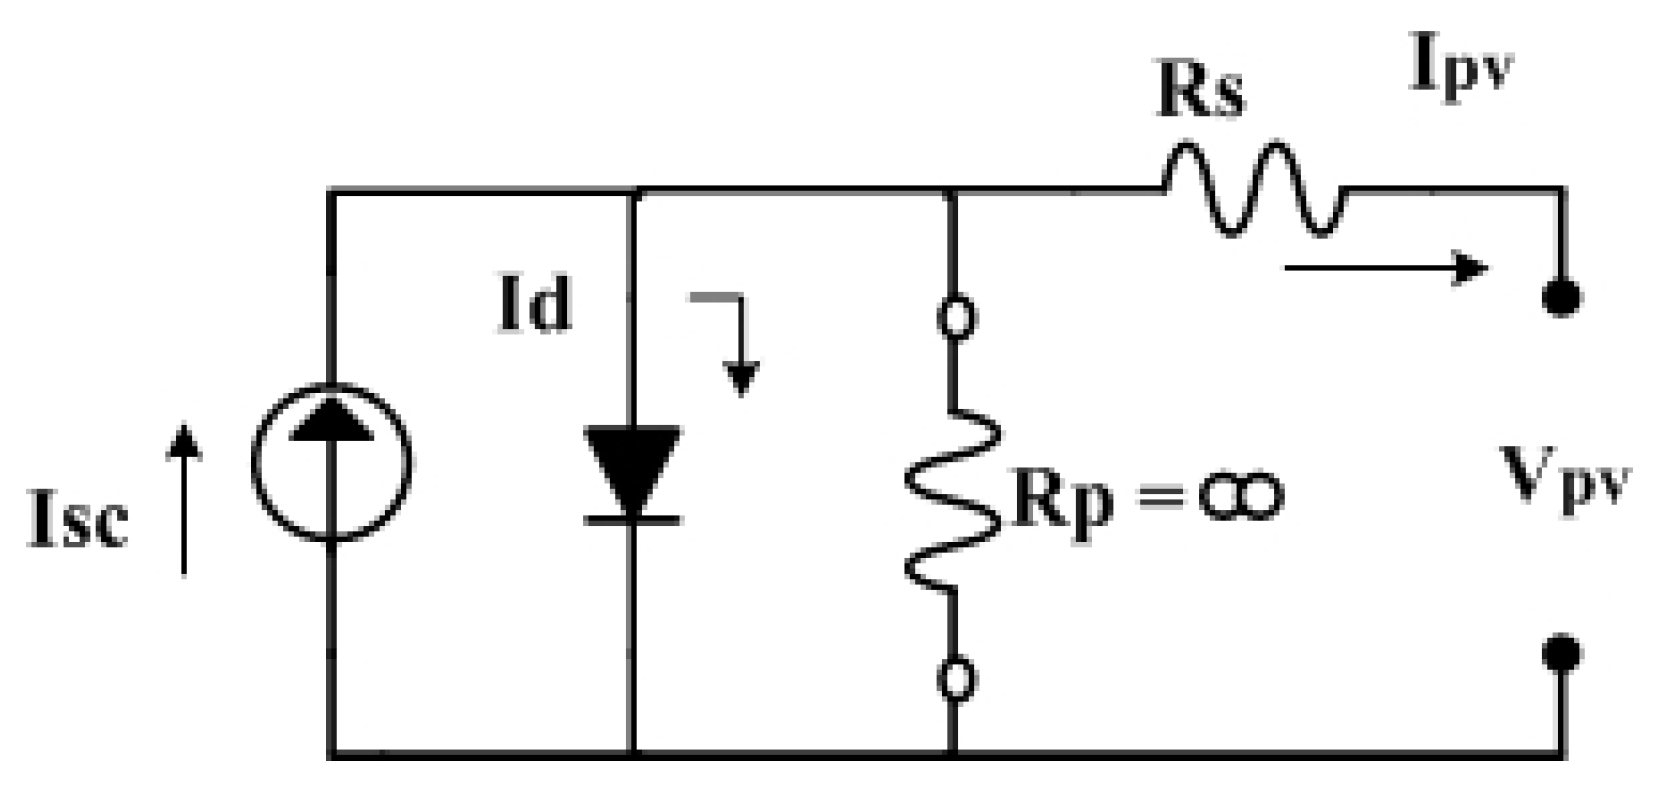
A solar cell is modeled as a p-n junction with nonlinear characteristics to describe its electrical response. The simplest equivalent circuit is a current source connected in parallel with a diode as shown in Figure 1. The output current is proportional to the solar radiation falling on the cell. During the night, the solar cell works as a diode in the reverse mode. However, if light falls on the solar cell, it generates a diode current. The properties of the diode determine the I-V characteristics of the cell. In addition, a series resistance, Rs, is added to represent the resistance inside each cell, while shunt resistance, Rp, is added to represent the saturation current of the diode. However, as a fair approximation, , can be neglected because Rp is assumed as a very large resistor [16].
In this research, is neglected as indicated in Figure 1. Consequently, the net current of the cell is the difference between the photocurrent, and the normal diode current (Id) which is given by,
where q is the electron charge, k is the Boltzmann constant, T is the temperature and n is the diode’s ideality factor.
The load, depends on first (T1) and second (T2) reference testing temperatures, and it is given by,
where,
where G is the present solar radiation and is the solar radiation at the reference test.
The saturation current of the diode, is given by,
where,
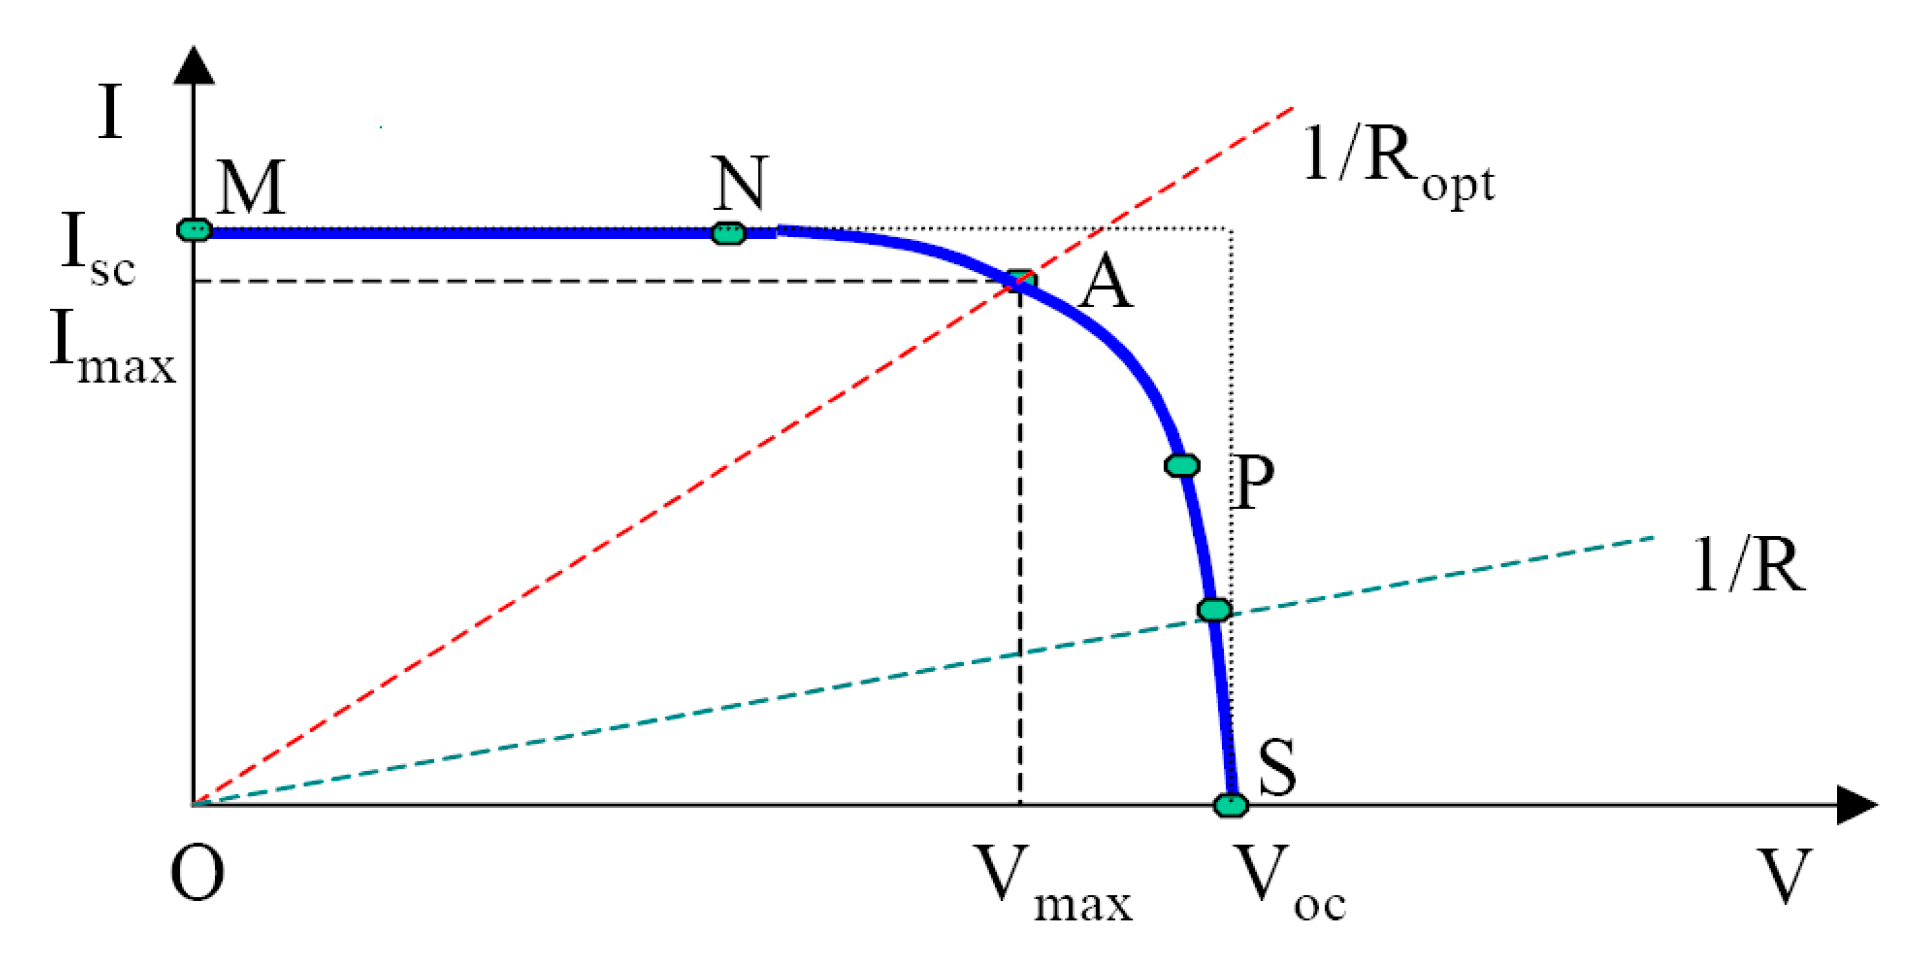
A typical I-V characteristic of a solar cell at a specific solar radiation and cell temperature is shown in Figure 2 For a resistive load, the load characteristic is a straight line with a slope I/V = 1/R.
As shown in Figure 2, the solar cell operates in the region M-N, when the load resistance is small. On the other hand, if the load resistance is large, the solar cell operates in the regions P-S of the curve. The short circuit current, Isc, is the greatest value of current generated by a solar cell. It is produced during the short circuit condition where V = 0. The open circuit voltage corresponds to the voltage across the diode when the photocurrent is zero. This case reflects the voltage of the cell at zero light conditions. The maximum power point defines the operating point A in which the power dissipated in the resistive load is at its maximum value. The fill factor (FF) is defined a measure of the real I-V characteristic. However it also can be defined as the measure of the efficiency of the solar cell. For an efficient solar cell the value should be greater than 0.7. The fill factor diminishes as the cell temperature increases [17]. The fill factor is expressed as,
In general, the voltage produced by a solar cell is about 0.5 V. Therefore, in order to provide adequate voltage for application, solar cells are connected together in series to increase the voltage. In the meanwhile, strings of solar cells are connected in parallel to increase the output current. This package is called a PV module or PV panel [17]. Assume having a PV module consisted of a NSM series solar cell and NPM with an RSM internal resistance, then the relations between the cell’s voltage () and current () and the module’s voltage () and current () are given by the following equations:
The performance of a PV module strongly depends on meteorological conditions such as solar radiation and ambient temperature. Increasing solar radiation increases PV module output current. On the other hand, increasing ambient temperature affects the PV output voltage negatively, while PV output current is slightly increased by the increasing of solar cell temperature [16,17].
3. Proposed I-V Curve Testing System
3.1. DC-DC Boost Converter Analysis
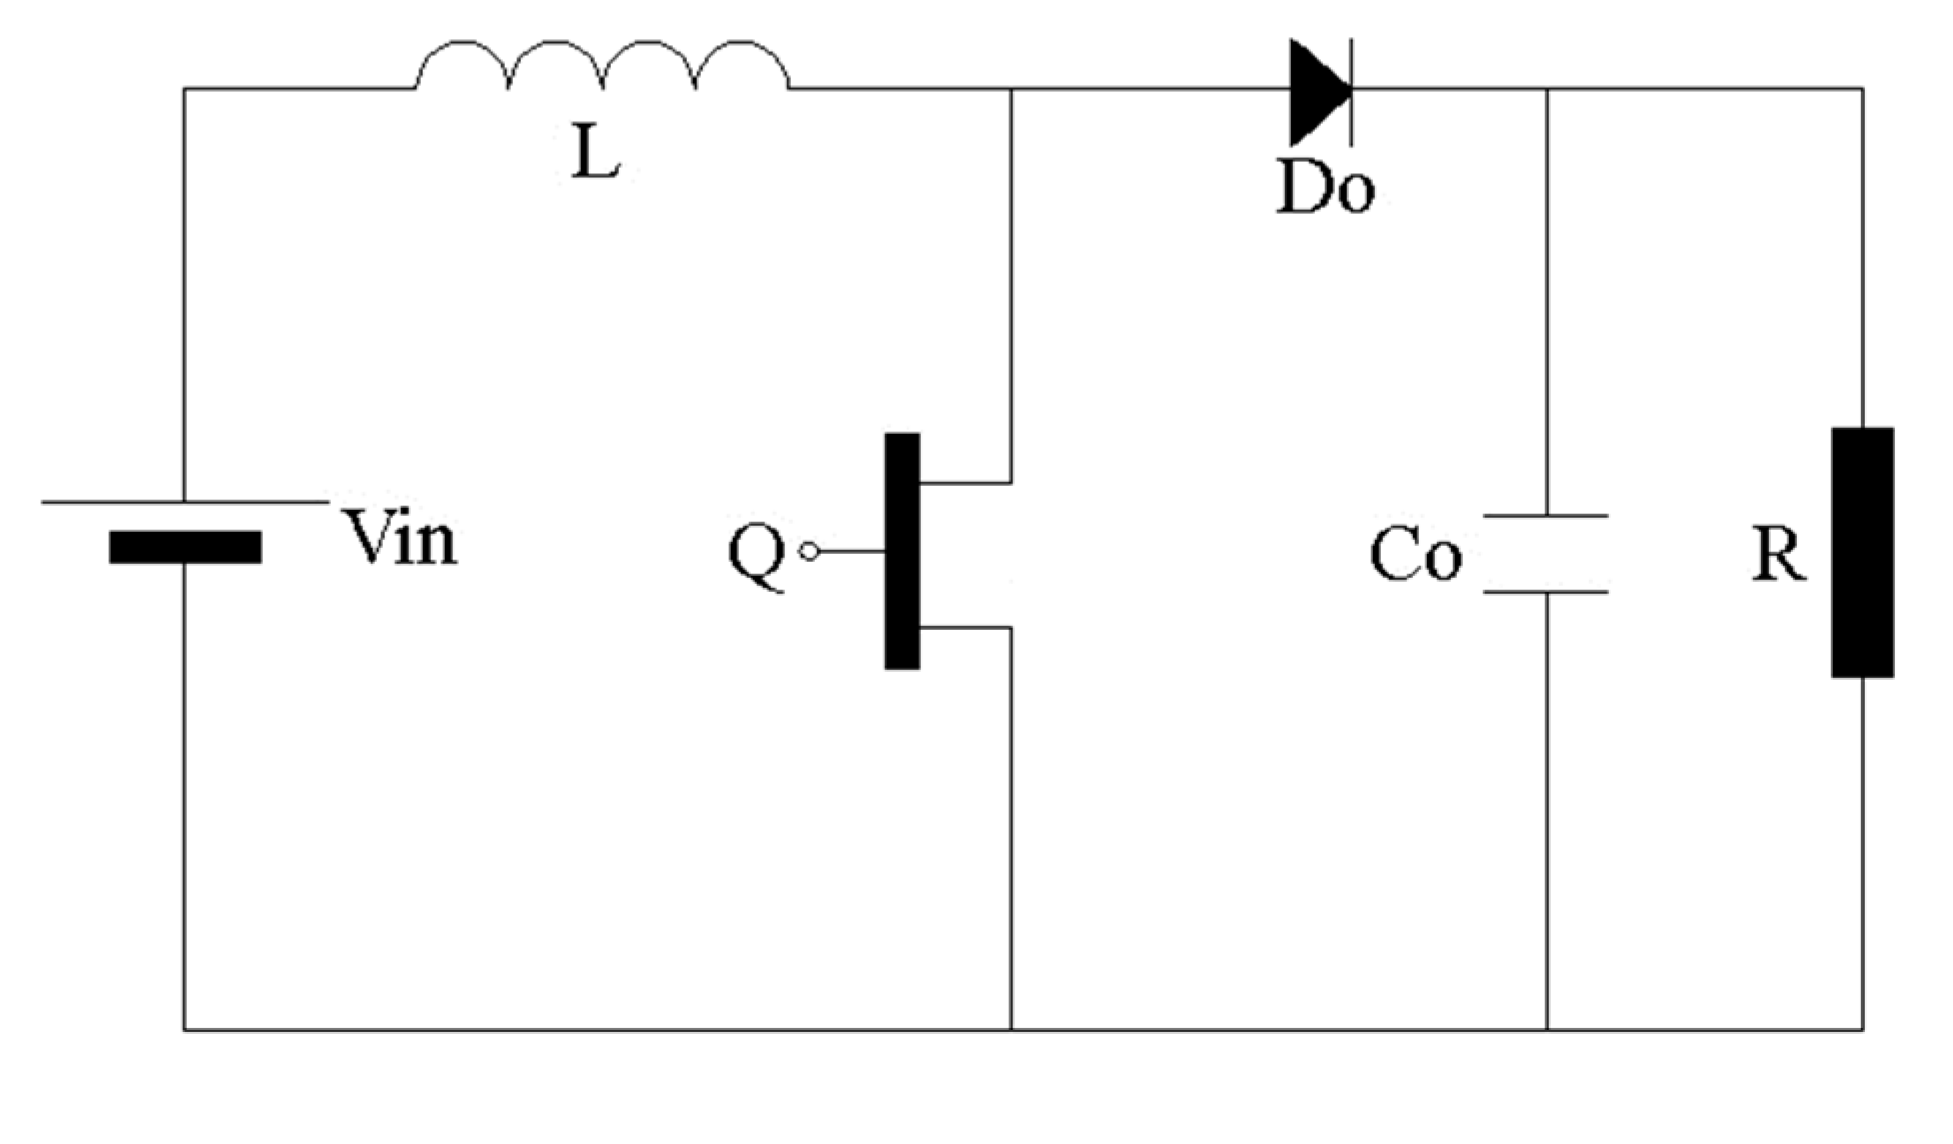
A boost converter is a power converter that boosts the input voltage to provide greater output voltage. A conventional boost converter consists of a switch, a diode, and at least one energy storage element. Capacitors are usually added as filters to the output of the converter to reduce the output voltage ripple [18]. Boost converters have some operational challenges, such as the leakage energy of the storage inductor due to the turning off action of the converter switches. This problem causes high voltage ripple across the switch. To protect the converter switches, high voltage rating device with a snubber circuit are usually applied which increases the conversion efficiency of such a converter. However, this paper proposes a conventional boost converter circuit since the aforementioned challenges do not affect the testing result of the I-V curve. Measurement of the I-V curve is done on the primary side of the converter and thus the losses can be ignored. Figure 3 shows the conventional boost converter.
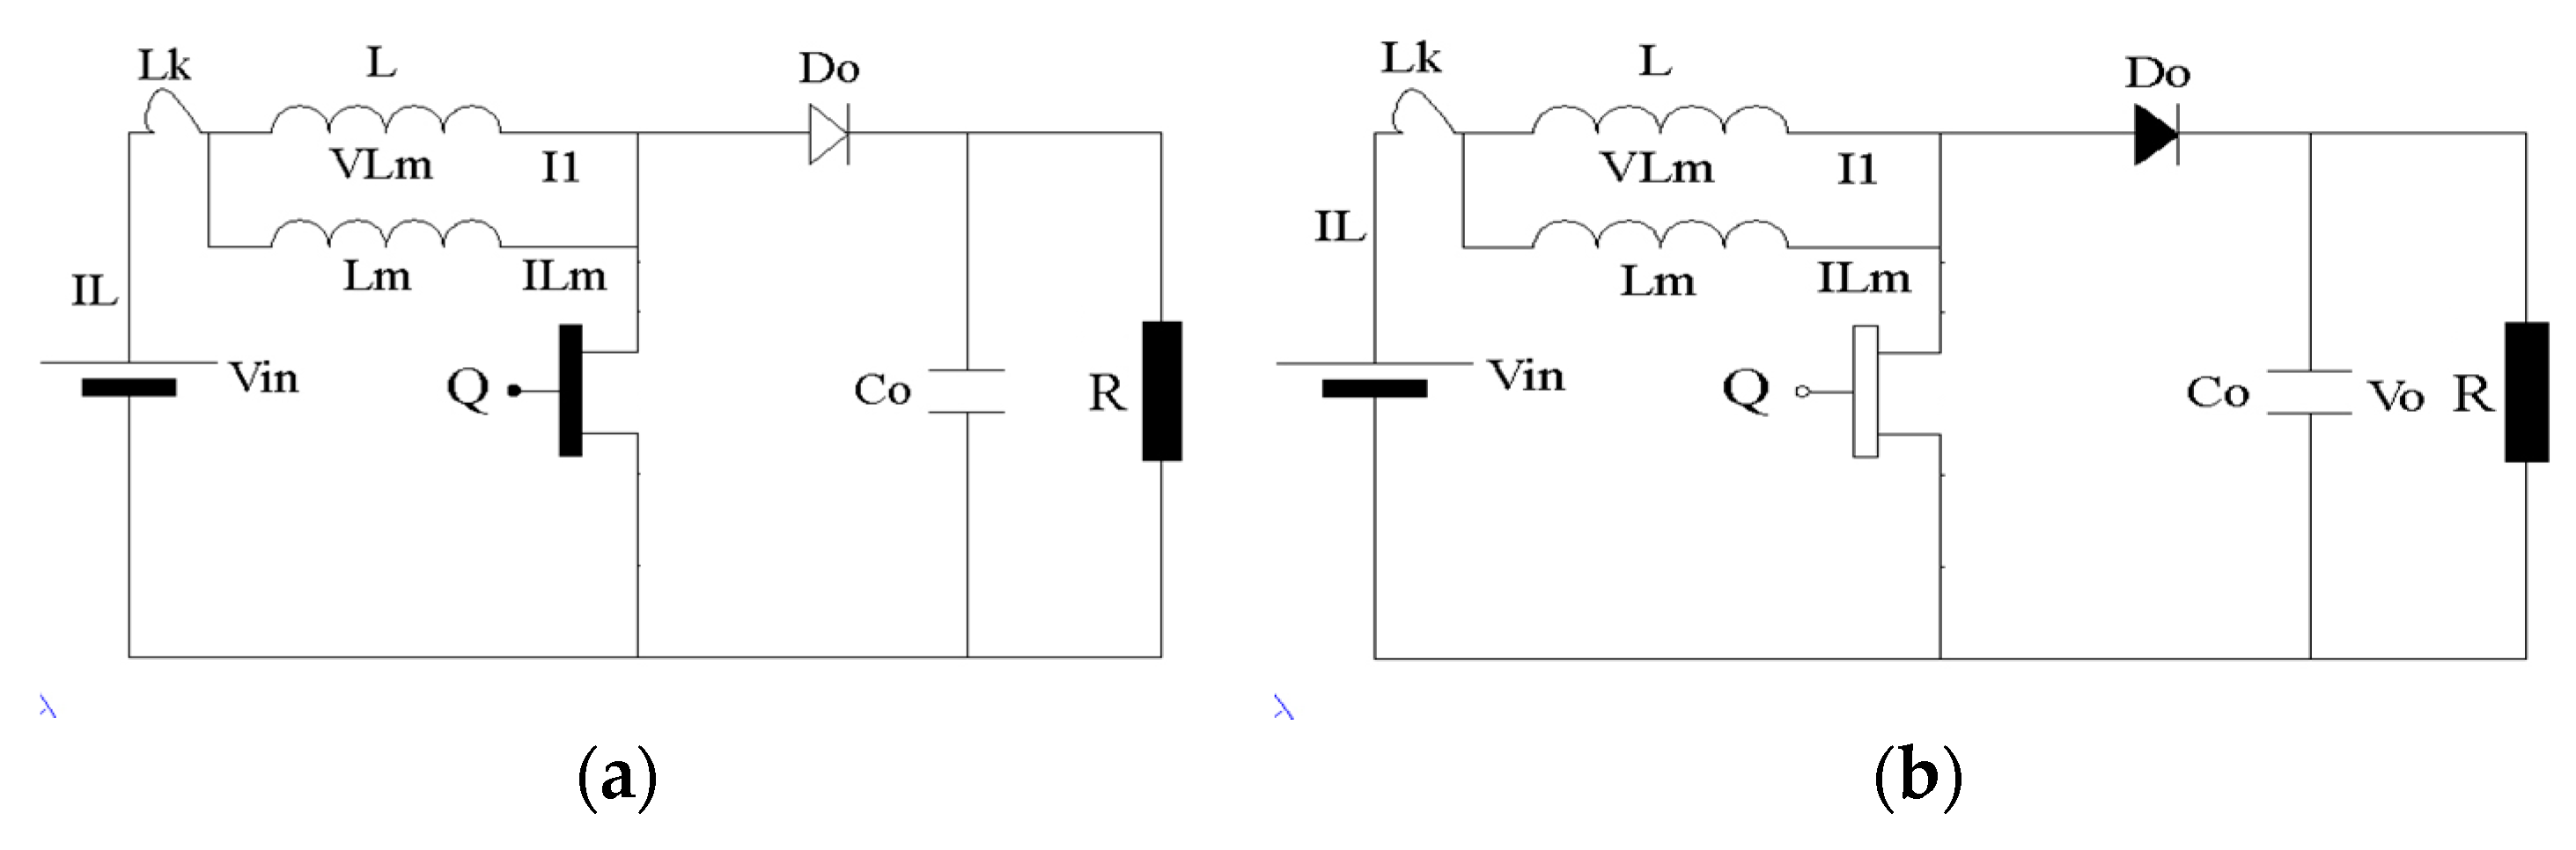
To describe the operation and analysis of the boost converter, two modes of operation are considered namely on mode (when the switch is on) and off mode (when the switch is off). In “on mode” operation, the switch Q is turned on and the voltage, Vin, charges the inductor, L (Figure 4a). The current, ILm, increases linearly due to the magnetization in the inductor. In steady state, the input current, IL = I1 + ILm, has a constant value. The drain-source current, iDS, will also be of square wave shape.
At this mode, during the time interval of 0 < t < T, it can be observed that,
In “off mode” operation, the switch Q is turned off and the output diode, Do voltage falls to zero as shown in Figure 4b. At this time, Do conducts and the voltages, VLK and VLm, charge the capacitor, Co, and supply the load. At this mode, during the time interval of T < t < T + n, the circuit’s equations can be defined as,
Assume a time control input variable, as follows:
By substituting (17) in (15) into (16), the equations become,
To conduct a DC steady state, the variables are given two components which are the DC component (non-hat symbol) and the corresponding perturbation component (hat symbol). For , the DC component is represented by D (duty cycle) while corresponding perturbation component is represented by [18]. Following this, (18) and (19) become,
To perform DC steady state analysis, let and . Then (20) and (21) become,
From (22) and (23), the relation between the input and the output voltages of the boost converter will be,
and the current becomes,
Assuming that the converter is ideal in which the output power is equal to the input power, ,
Substituting (25) into (26), we get the current gain equation of the boost converter which is given by,
The boost converter circuit as shown in Figure 3 consists of inductor, L1, IGBT switch, Q, capacitors, Co, and diode, Do. An inductor with a ferrite core is used and the inductance value is calculated by considering the maximum allowed ripple current at minimum duty cycle (10%) and maximum input voltage (21 V). At a switching frequency, ƒs, the boost inductor value is determined by considering the inductor currents at the continuous and discontinuous modes of operation, which are defined as [19],
and
Equating (28) and (29), the value of the inductance is determined as,
The diode’s, Do, voltage rating is limited to the output voltage of (24 V). Similarly the IGBT’s as the peak current through the diode occurs at low line input voltage and maximum load [19].
where ∆V is the expected variation in the input voltage and Rload is the equivalent resistance of the connected load. is the output voltage.
3.2. Control of the Proposed I-V Curve Testing System
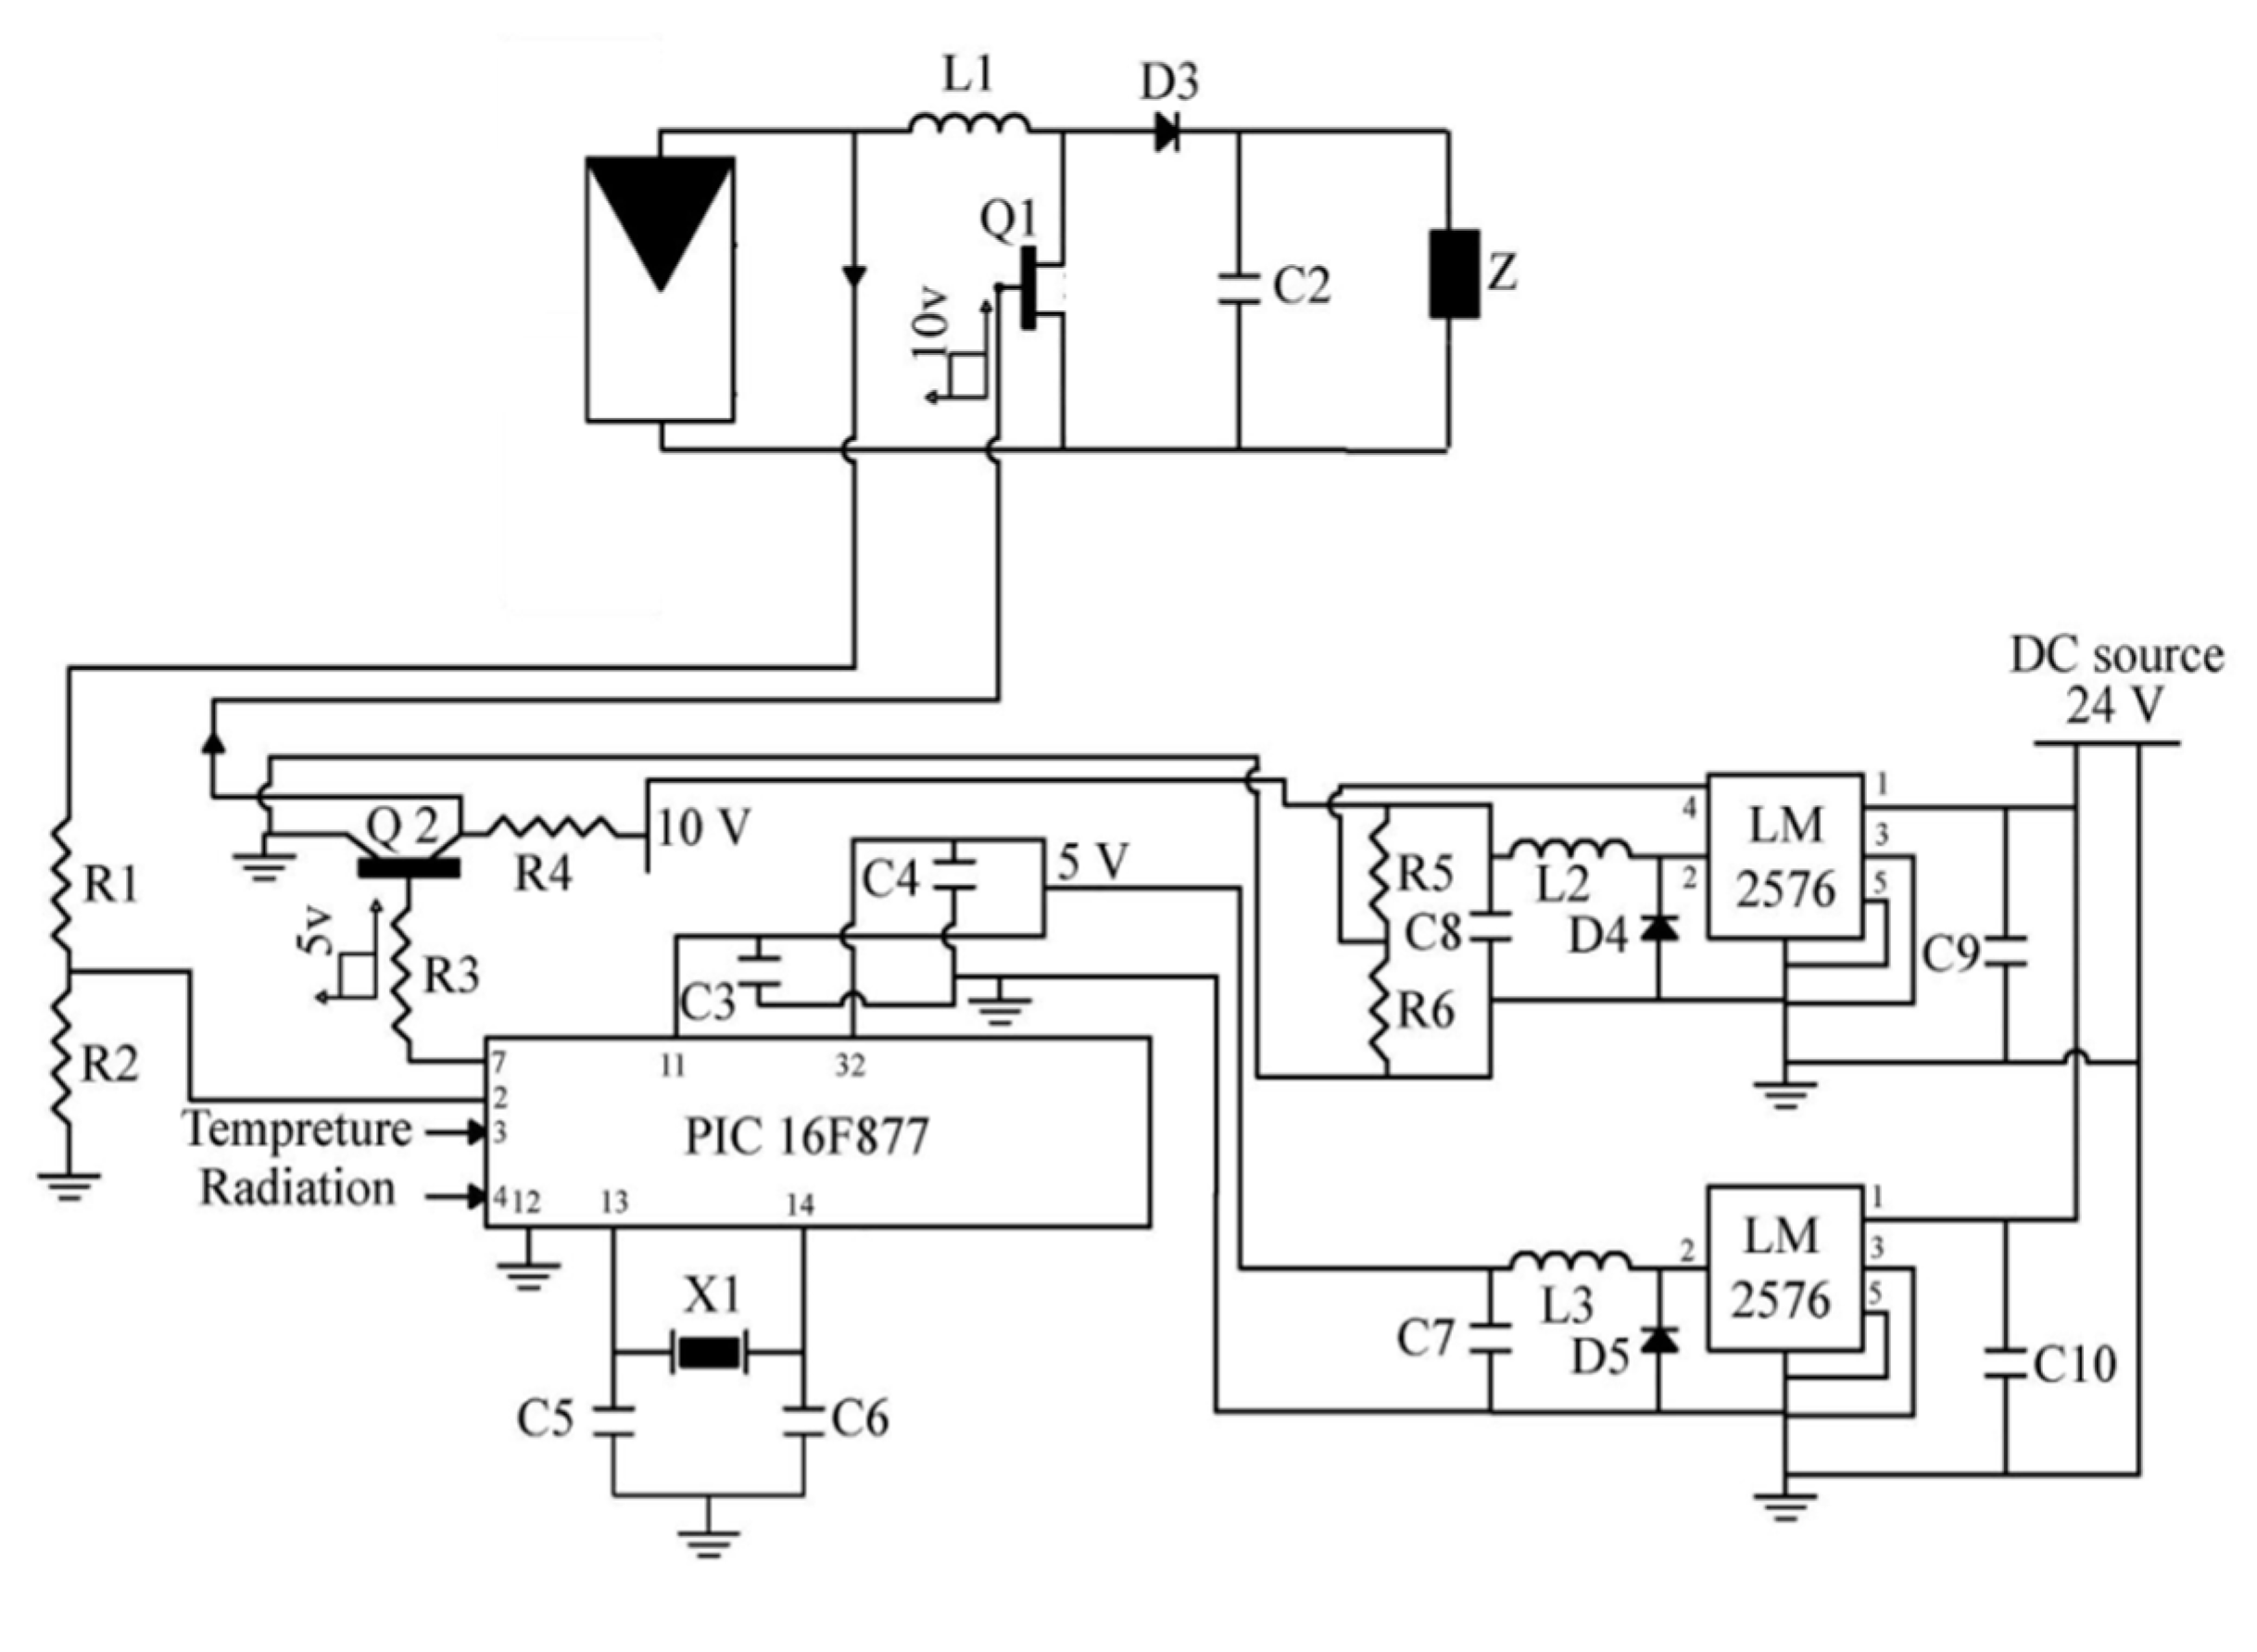
Figure 5 shows a block diagram of the proposed I-V characteristic tester. It is assumed that the PV module is equipped with an MPPT. Thus, the proposed system mainly requires an additional boost converter and a microcontroller to control the boost converter switch. The controller shown in Figure 5 is implemented on a PIC microcontroller that controls the duty cycle in order to extract the I-V characteristic features especially for the zone N-P, as shown in Figure 2 This zone is the most critical zone in extracting the I-V. Any point in the zone of M-N in Figure 2 is equal to the short circuit current. Similarly open circuit voltage value is very close to any measurement recorded in the zone of P-S in Figure 2.
The I-V testing algorithm has been programmed on the PIC16F778 microcontroller using a short C program. This controller has seven data reading ports and one pulse width modulation (PWM) port. During the testing, the controller reads two inputs namely; PV module’s voltage and PV modules current. The peak of the control signal generated by the controller is 5 V, while the switch, Q1 needs 15 V to be fully “on”. Therefore, a gate drive is used to provide the appropriate gate-emitter voltage to the IGBT. The controller circuit and the gate derive circuit are powered by the storage batteries through two voltage regulators. One of the voltage regulators gives a fixed output voltage of 5 V for the PIC controller while the other has an adjustable output set to 15 V for the gate drive.
The proposed tracking algorithm is very simple. Initially, the PV module is operated at high current by applying low resistive load. The resistive load consists of a real resistor connected in parallel to a boost converter triggered by a signal with a low duty cycle (about 10%). At this point, the PV module is expected to generate a current value that is close to short circuit current value with a relatively low voltage. It is assumed that the first current measurement taken is considered equal to the short circuit current value. After the first measurement, the duty cycle value is increased iteratively until reaching an allowable rate (not higher 80%). Eventually, the open circuit is measured separately by measuring the terminal voltage of the PV module at open circuit condition. In addition, the solar radiation and the ambient temperature must be controlled or measured by separated sensors so as to be able to assess the performance of the PV module with respect to environmental conditions.
4. Results and Discussion
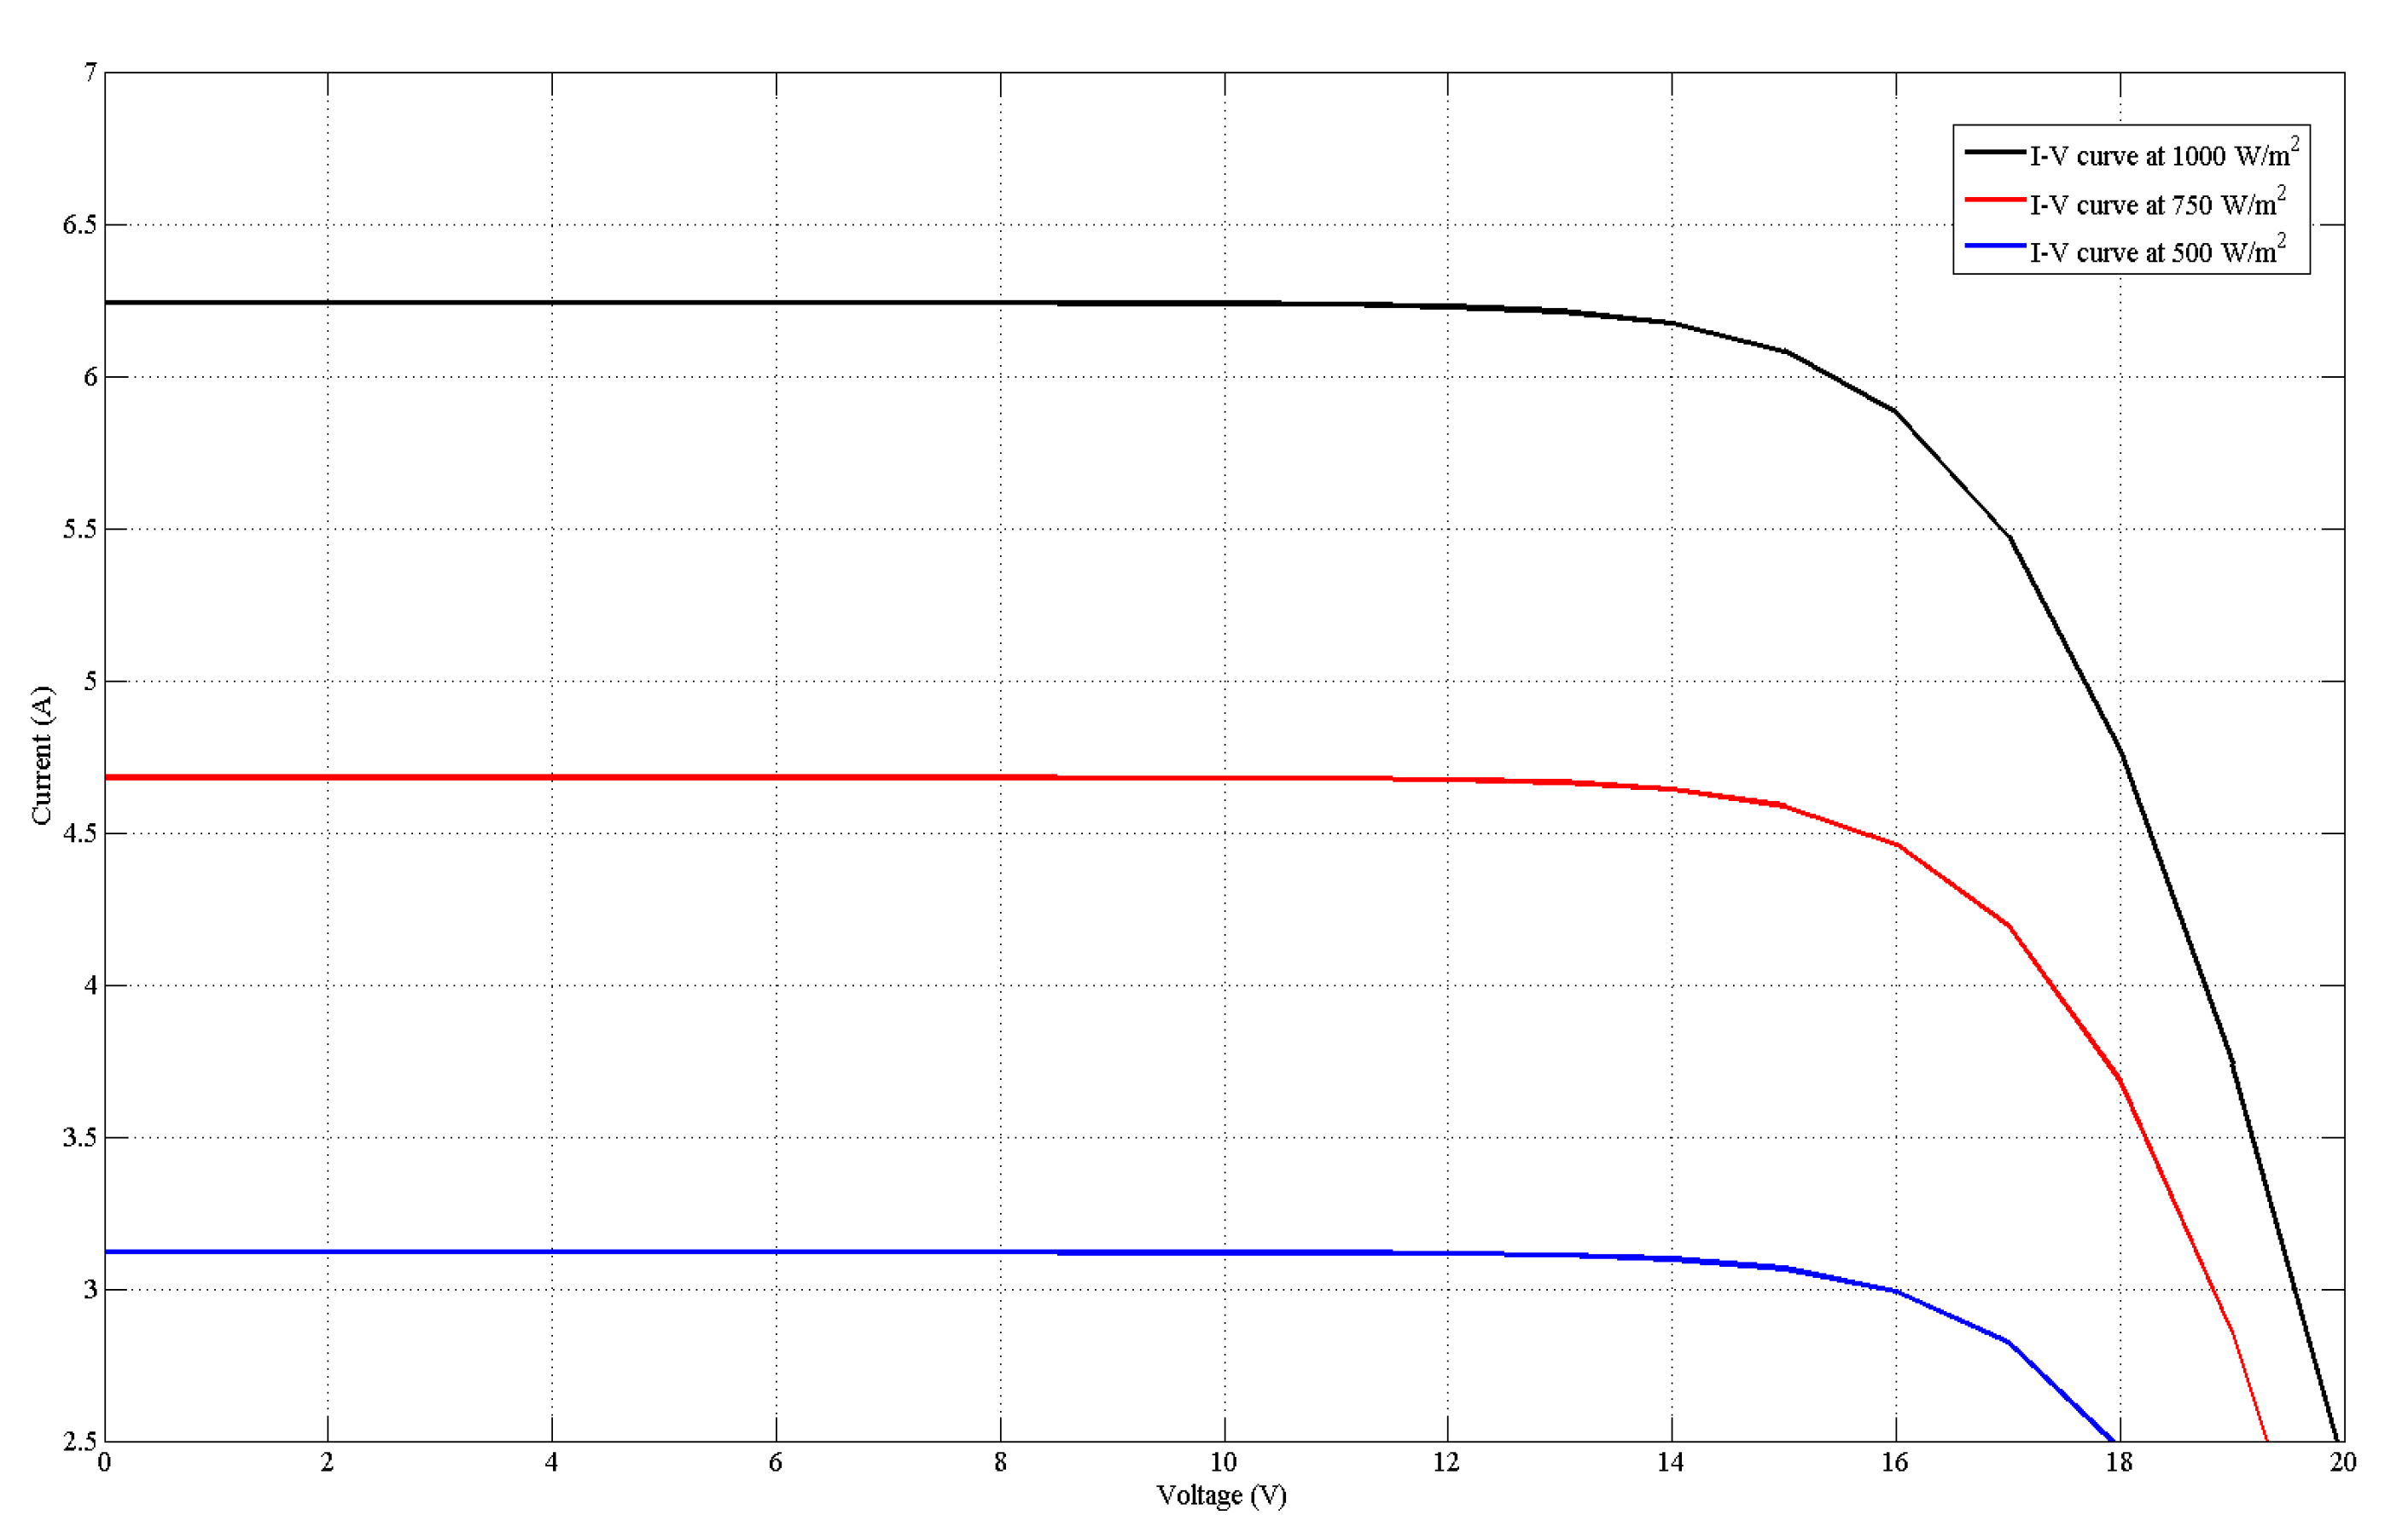
The authors of this study tested an example device experimentally and compared the obtained I-V curves to the data provided in the datasheet. However, in most PV module datasheets, the provided I-V curves are limited to a specific solar radiation and ambient temperature value. Since it is difficult to reproduce these meteorological conditions during testing without further expensive equipment, there is a need to develop a model for PV module I-V curve in order to measure I-V curves under any solar radiation and ambient temperature values. Such a model has been proposed and validated many times before [17]. In this research, the model was developed based on the mathematical model described in Section 2. Figure 6 shows a validation of this model using curves provided in the data sheet. The developed model matches the module’s data sheets parameters; thus, it can be used in validating the proposed device.
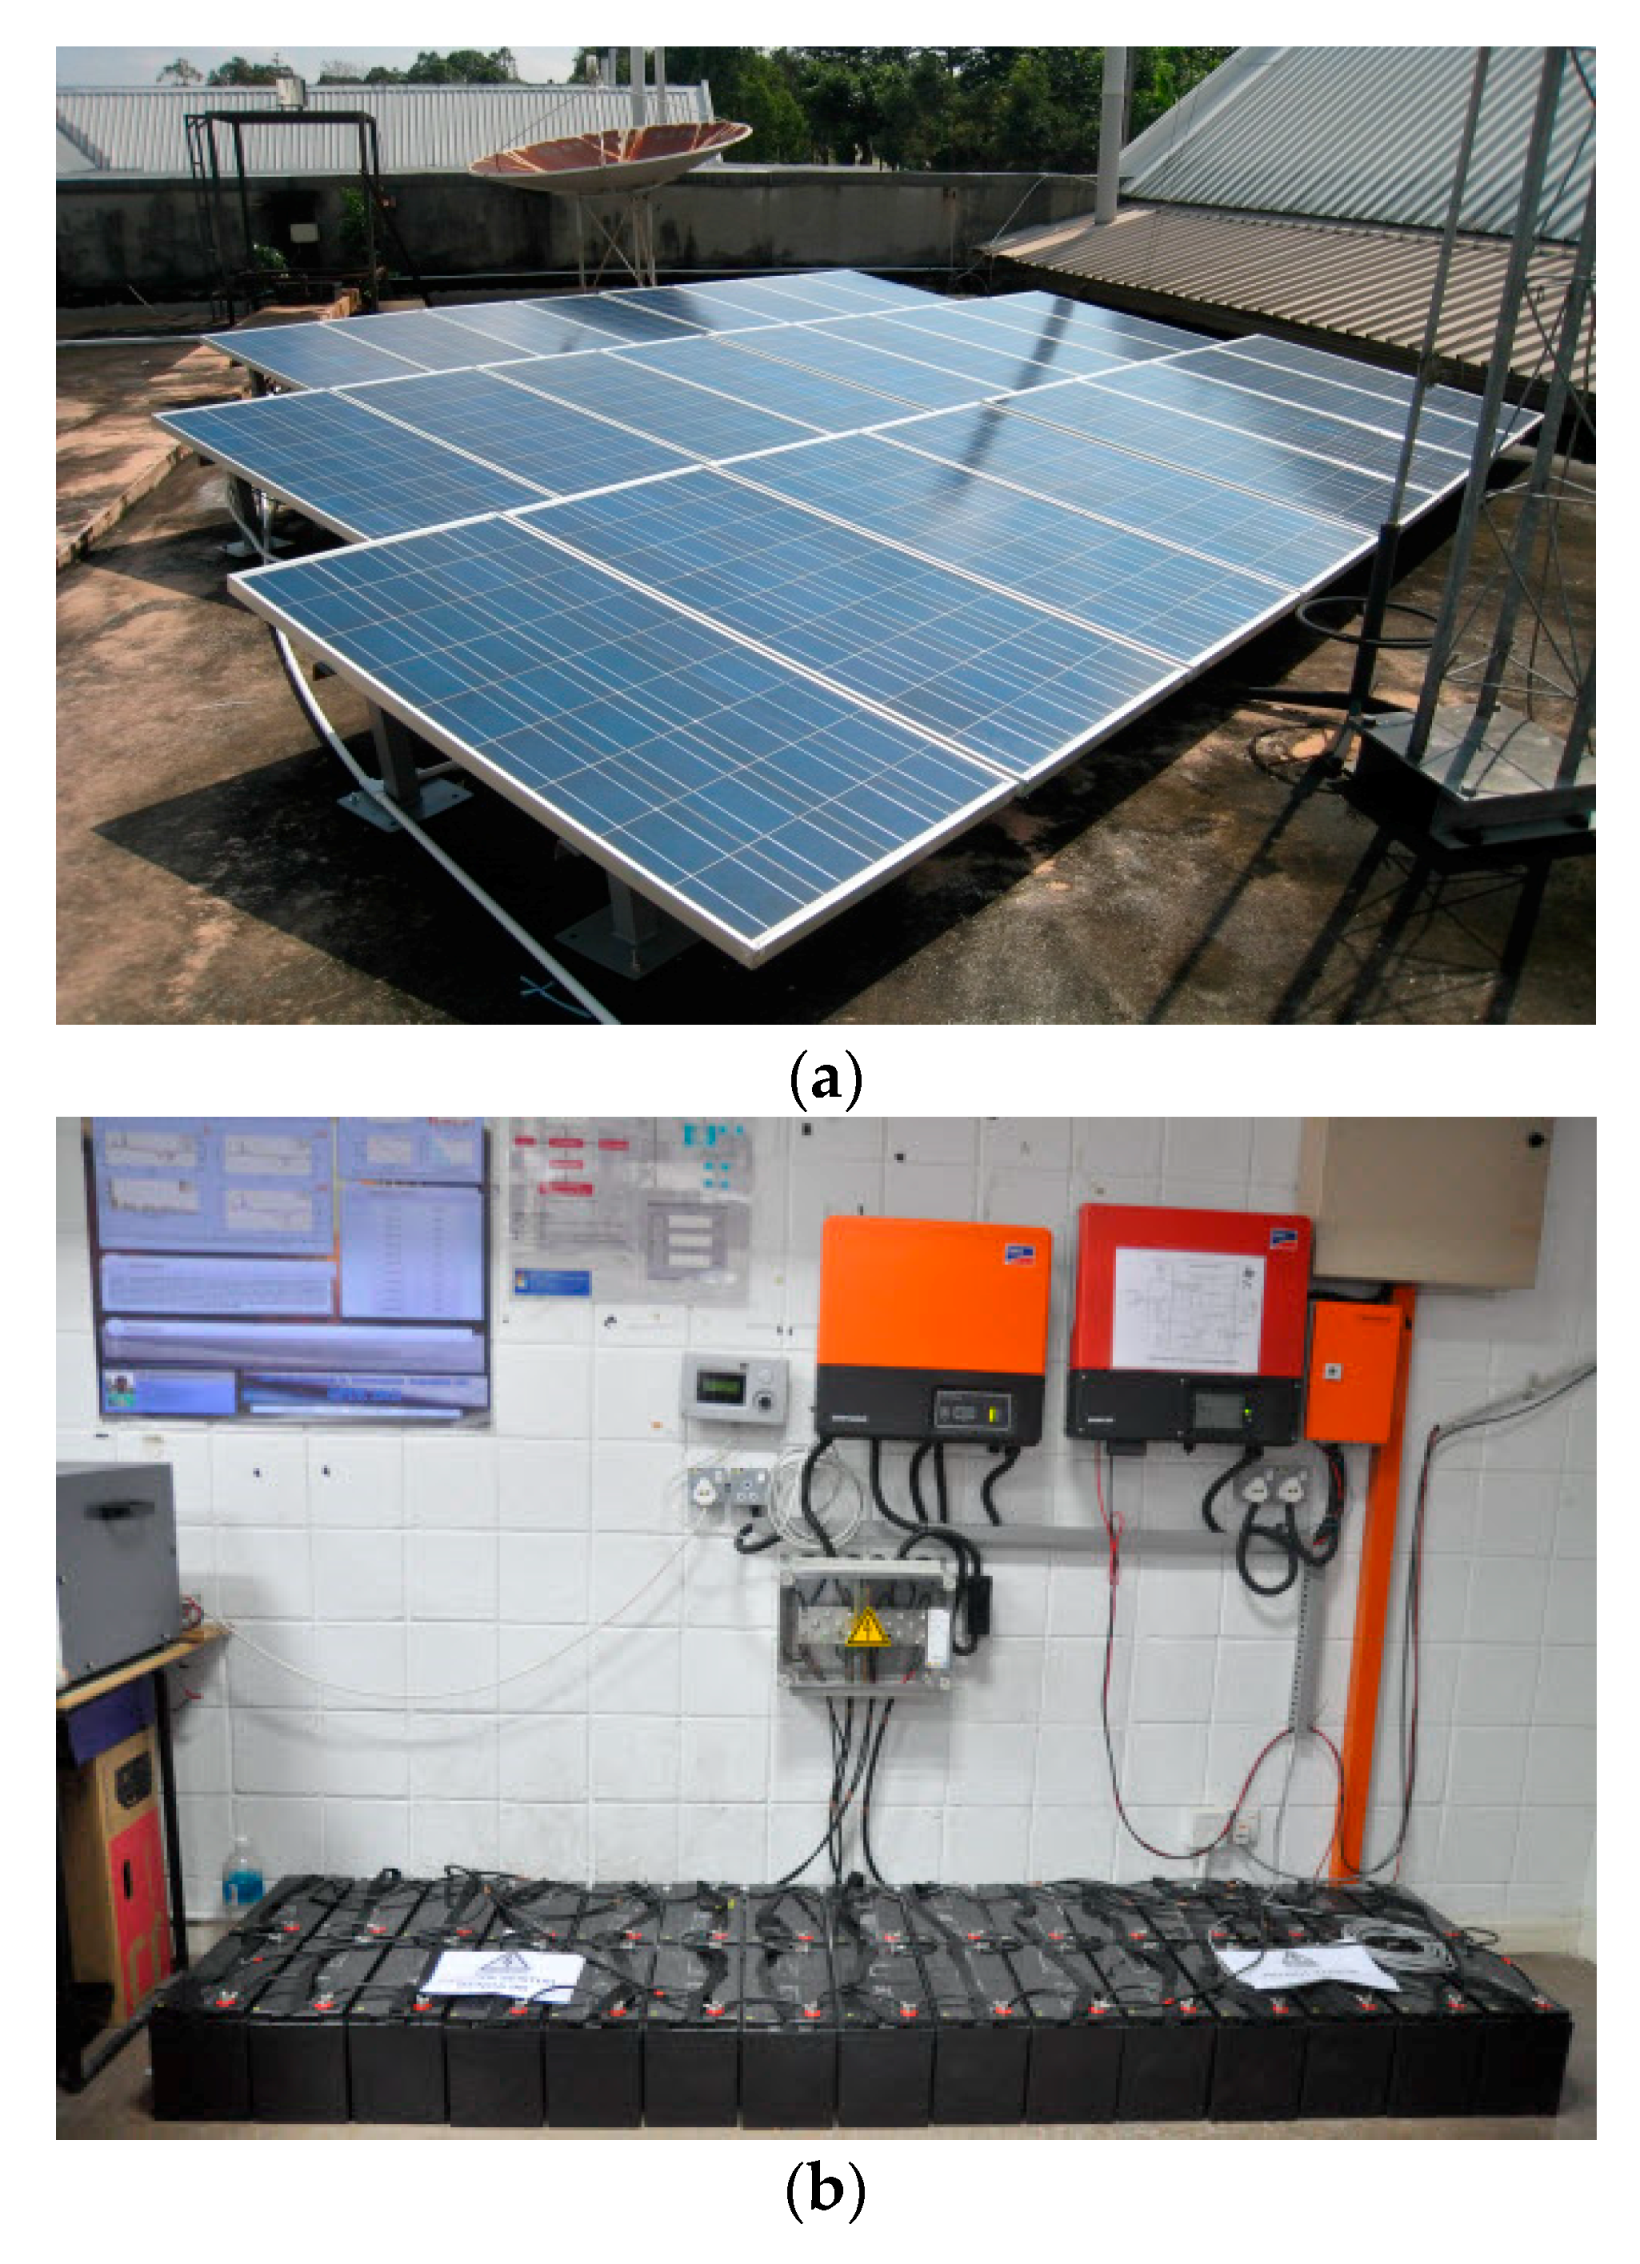
In this paper, a 3 kWp grid connected PV system installed at University Kebangsaan Malaysia (UKM) is used in the test. The used PV system is composed of 25 × 120 W poly-crystalline silicon PV modules. Each module has a maximum power of 120 W, a maximum current of 6.89 A, a maximum voltage of 17.4 V, an open circuit voltage of 21.5 V, and a short circuit current of 7.63 A. Figure 7a,b show captures of the used PV system to test the proposed I-V curve tester.
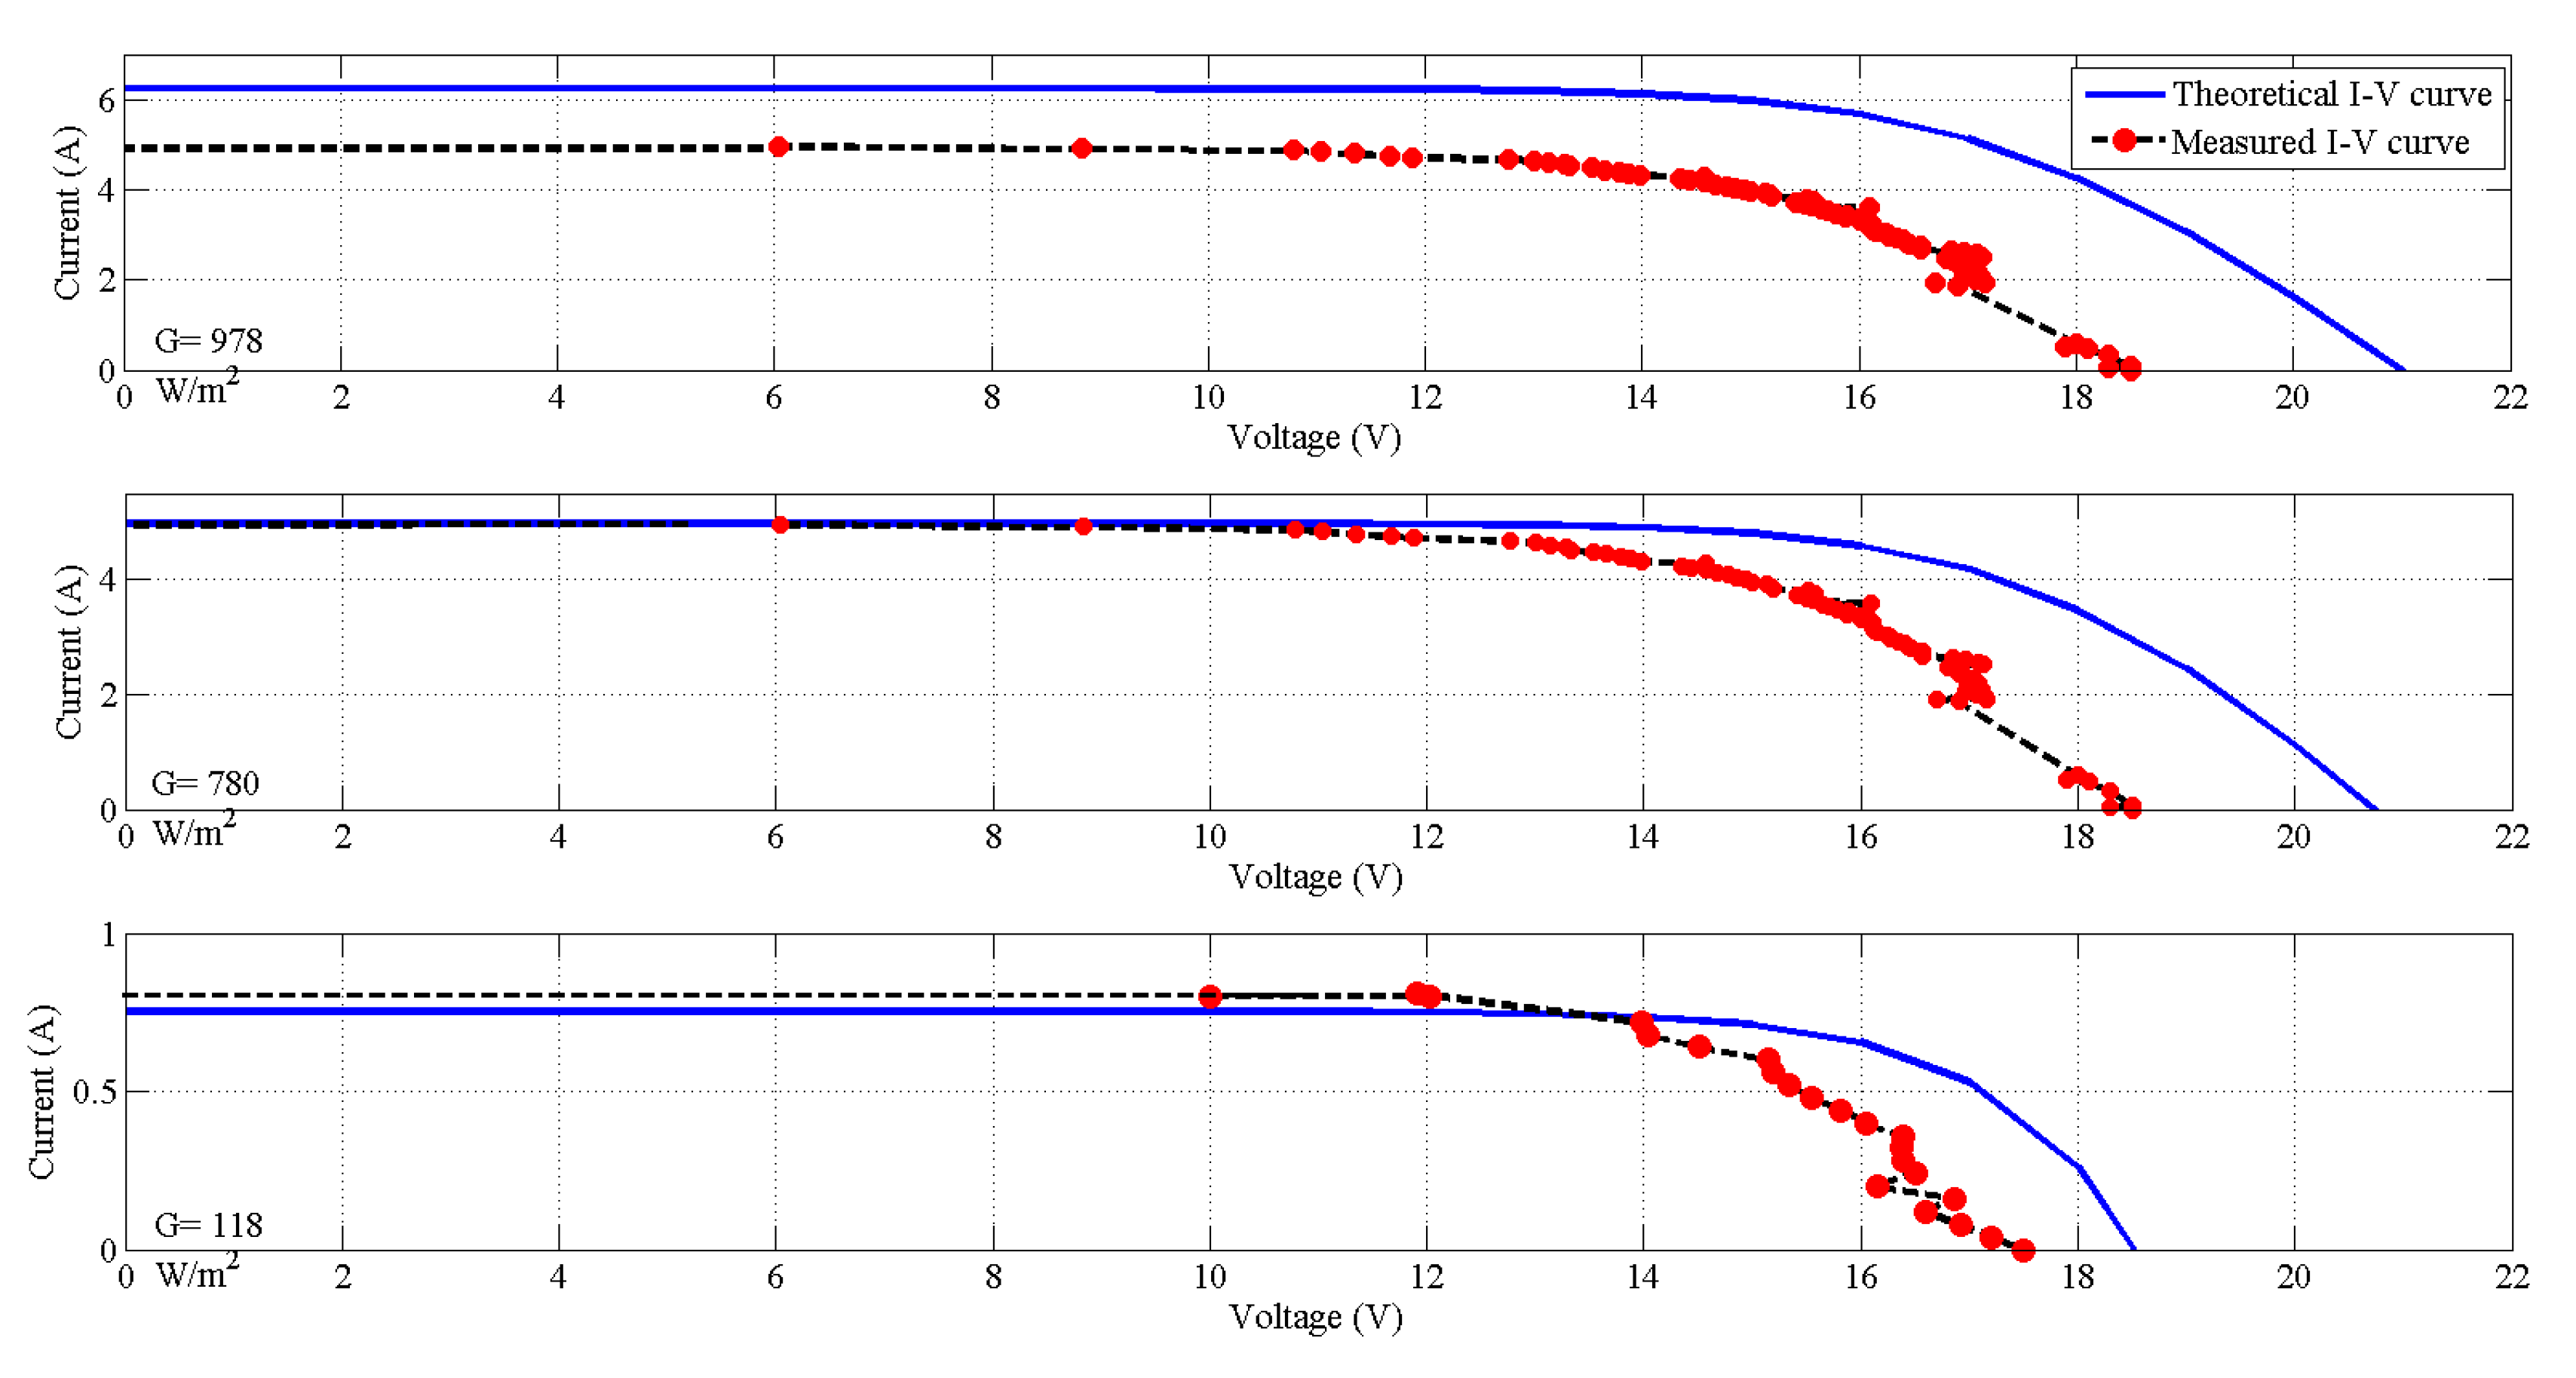
In this research, one of the system’s PV modules was dismantled and used to test the proposed system. The dismantled PV module was connected to a 100 Watt resistive load though a DC-DC boost converter. Figure 8. shows the obtained I-V curves as compared to theoretical one obtained by the developed model.
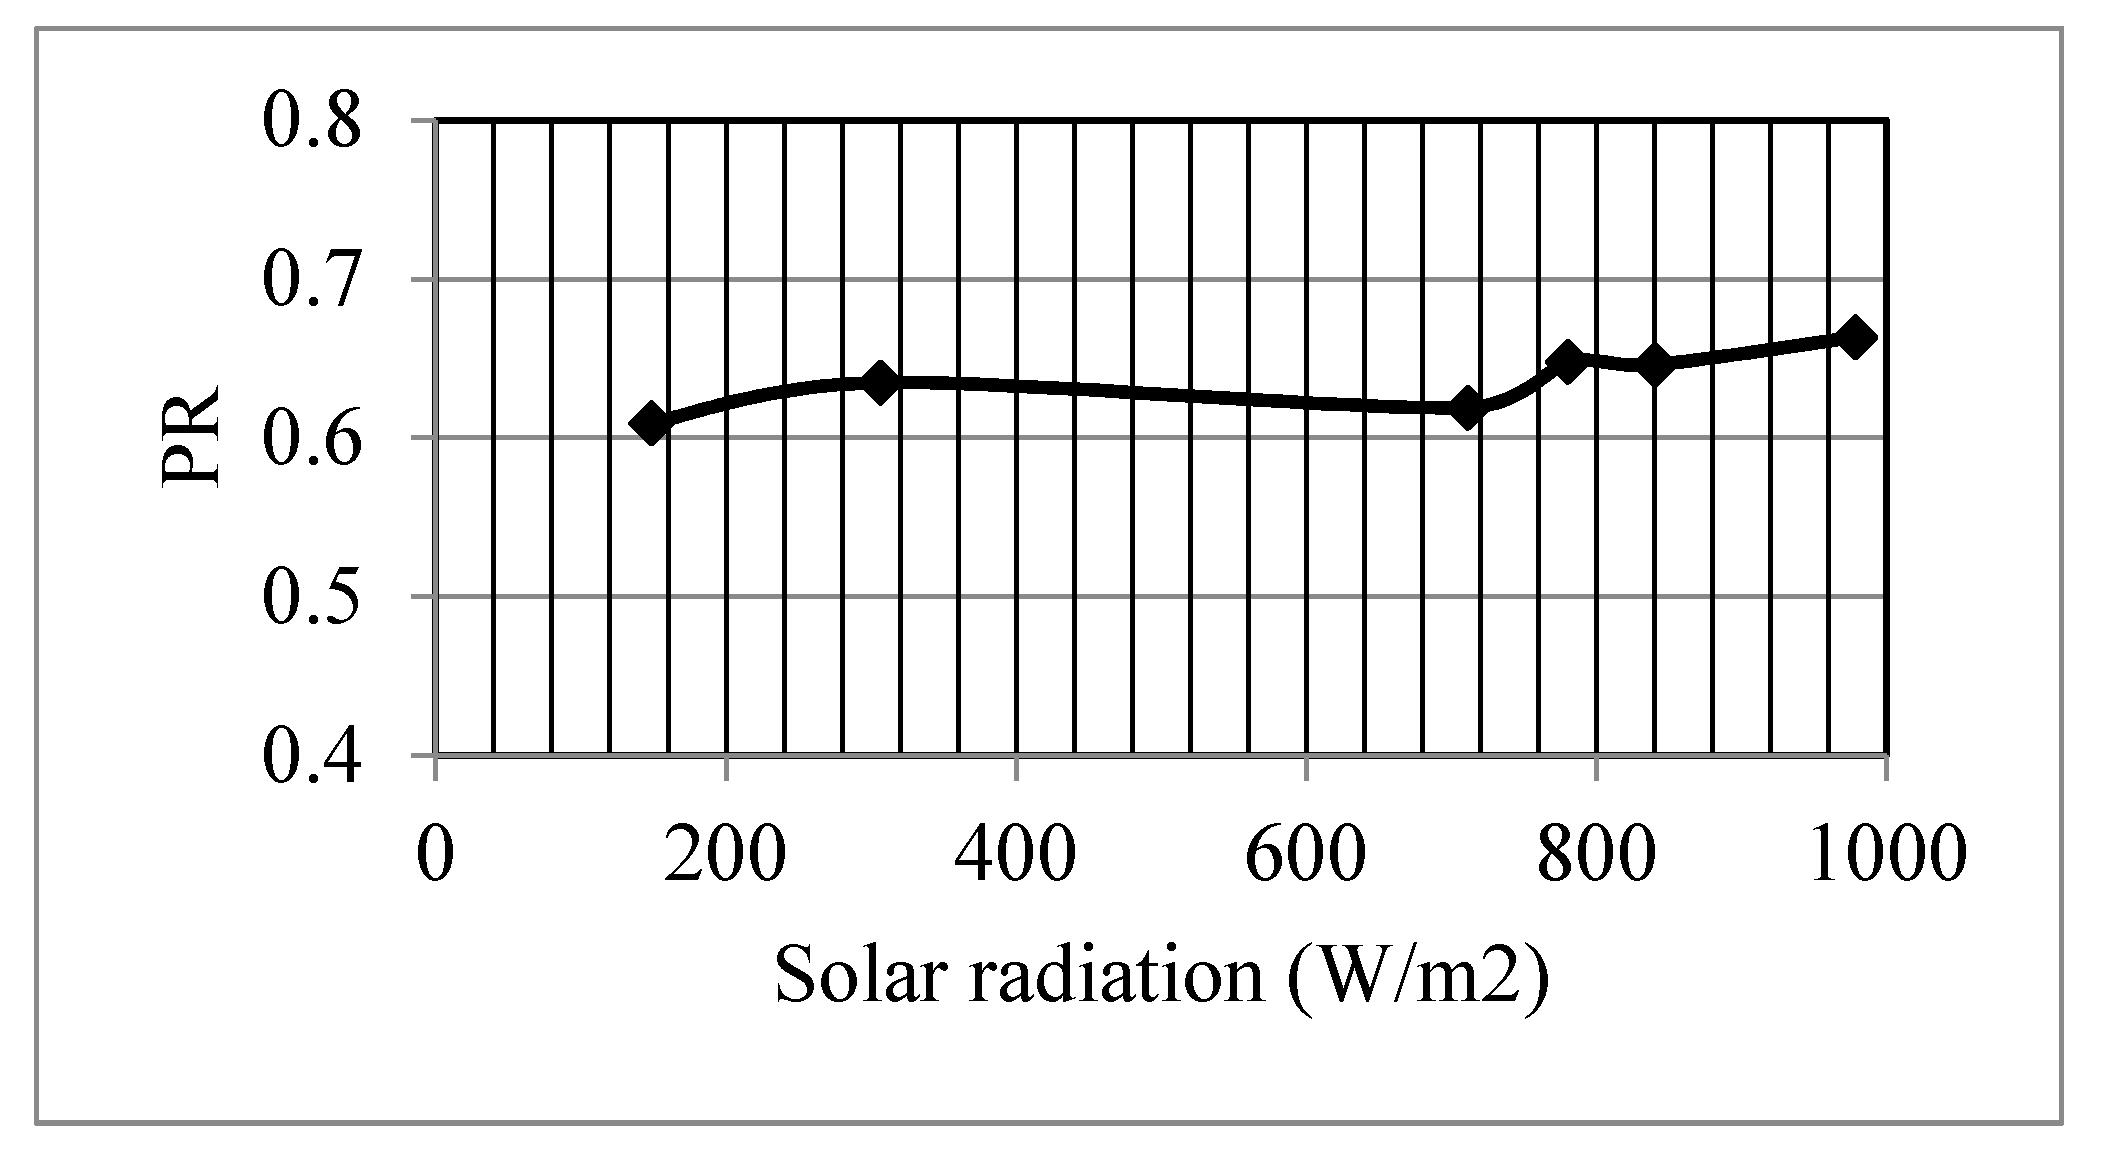
From Figure 8, it is clear that the obtained curve does not match the theoretical curves. This difference is due to the module performance factor. In general, to evaluate a PV module, it is necessary to measure its actual performance and compare it to the theoretical one provided in the data sheet. Consequently, the performance factor (PR) of a PV module can be defined as the ratio of the actual performance to the theoretical performance of the PV module in a specific area. It is extremely important to consider this factor in designing any PV system as it may cause a serious undersizing problem. According to [20,21,22,23,24,25], the average performance factor of PV systems in the selected testing field is about 67.2%. This result is further supported by this research, whereas the average performance factor of the tested module is found to be about 63.4%. Figure 9 shows the performance factor of the PV module at different levels of solar radiation. As shown in the Figure, the performance factor is in the range of (61–67%). In general, increasing solar radiation increases the performance factor.
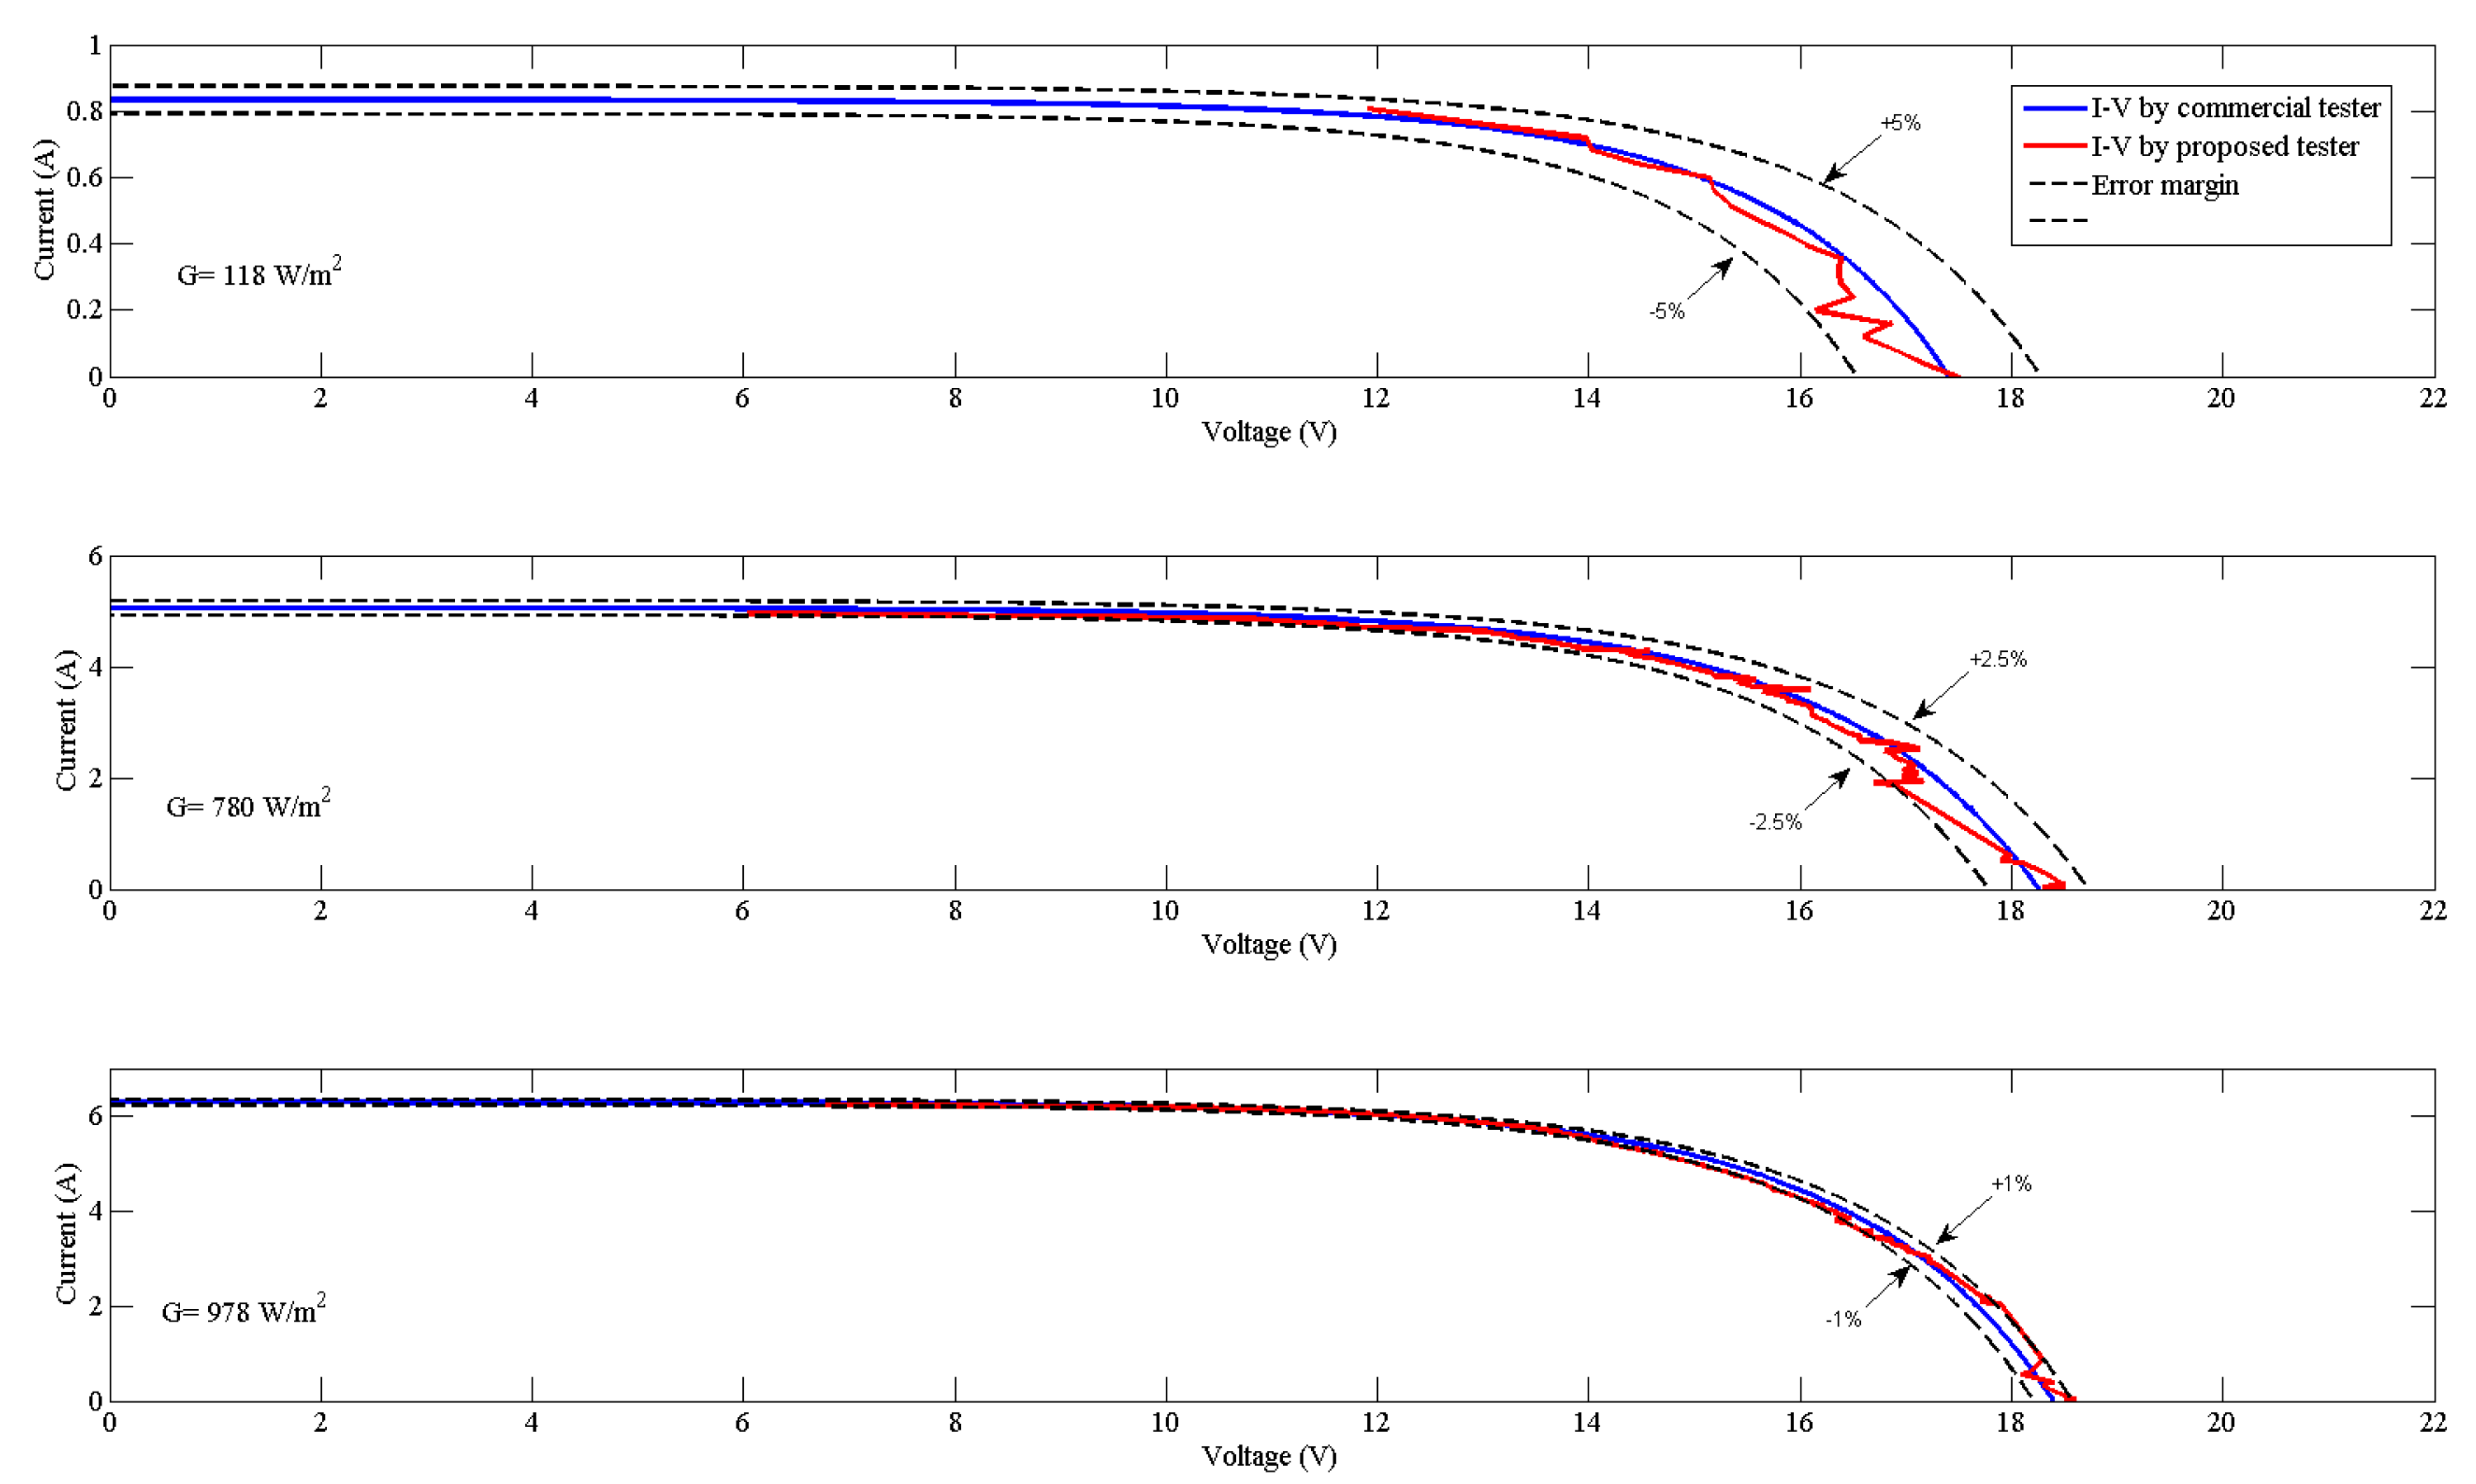
In order to evaluate the obtained I-V curves, a commercial I-V tester was used to test the PV module as well. Figure 10 shows a comparison between the utilized commercial I-V tester and the proposed system. It shows that the proposed system is able to extract the I-V curve of a PV module with acceptable accuracy (in the range of 1–5%). It is worth mentioning here that the data of the commercial I-V curve could not be extracted automatically, as this option is not directly available with the used I-V tester. However, the data points needed to be extracted manually and have been redrawn using Matlab.
5. Conclusions
This study proposed a simple I-V curve tester for PV modules. The system utilizes a simple DC-DC boost converter controlled by a microcontroller. The I-V curve was extracted by modifying the duty cycle of the triggering signal of the boost converter’s switch. The results showed that the proposed system successfully extracted I-V curves of the PV module. However, it is also noted that the performance of the tested module was only 63% of the performance described in the datasheet. The result was confirmed by a more expensive commercial PV characteristic tester. The reasons for the discrepancy between measured performance and datasheets might be due to the testing conditions, tested technology, or the tested PV module’s brand. In any case, these results highlight the importance of actual performance measurements when designing PV systems in order to provide reliable systems. The proposed I-V testing system can be used as a simple low-cost tool to diagnose any shortage or low performance problems in a PV system.
Acknowledgments
We would like to thank Ekanki Sharma for critical comments and pointing out typos. This work was supported by Lakeside Labs GmbH, Klagenfurt, Austria and funding from the European Regional Development Fund and the Carinthian Economic Promotion Fund (KWF) under grant KWF-20214|22935|34445 (Project Smart Mircogrid).
Author Contributions
Tamer Khatib and Wilfried Elmenreich conceived of and designed the experiments; Tamer Khatib performed the experiments; Tamer Khatib and Azah Mohamed analyzed the data; Azah Mohamed contributed reagents/materials/analysis tools; Tamer Khatib, Wilfried Elmenreich, and Azah Mohamed wrote the paper.
Conflicts of Interest
The authors declare no conflict of interest.
References
- Durán, E.; Andújar, J.M.; Galán, J.; Sidrach-De-Cardona, M. Methodology and experimental system for measuring and displaying I-V characteristic curves of PV facilities. Prog. Photovolt. Res. Appl. 2009, 17, 574–586. [Google Scholar] [CrossRef]
- Malik, A.Q.; Damit, S.J.B.H. Outdoor testing of single crystal silicon solar cells. Renew. Energy 2003, 28, 1433–1445. [Google Scholar] [CrossRef]
- Van Dyk, E.E.; Gxasheka, A.R.; Meyer, E.L. Monitoring current-voltage characteristics and energy output of silicon photovoltaic modules. Renew. Energy 2005, 30, 399–411. [Google Scholar] [CrossRef]
- Mahmoud, M.M. Transient analysis of a PV power generator charging a capacitor for measurement of the I-V characteristics. Renew. Energy 2006, 31, 2198–2206. [Google Scholar] [CrossRef]
- Muñoz, J.; Lorenzo, E. Capacitive load based on IGBTs for on-site characterization of PV arrays. Sol. Energy 2006, 80, 1489–1497. [Google Scholar] [CrossRef]
- Kuai, Y.; Yuvarajan, S. An electronic load for testing photovoltaic panels. J. Power Sources 2006, 154, 308–313. [Google Scholar] [CrossRef]
- Forero, N.; Hernandez, J.; Gordillo, G. Development of a monitoring system for a PV solar plant. Energy Convers. Manag. 2006, 47, 2329–2336. [Google Scholar] [CrossRef]
- Guvench, M.G.; Gurcan, C.; Durgin, K.; MacDonald, D. Solar simulator and I-V measurement system for large area solar cell testing. In Proceedings of the American Society for Engineering Education Annual Conference & Exposition, Washington, DC, USA, 20–23 June 2004; pp. 12747–12753. [Google Scholar]
- Fernandez-Reche, J.; Canadas, I.; Sáncheza, M.; Ballestrín, J.; Yebra, L.; Monterreala, R.; Rodrígueza, J.; Garcíaa, G.; Alonsob, M.; Chenlo, F. PSA Solar furnace, A facility for testing PV cells under concentrated solar radiation. Sol. Energy Mater. Sol. Cells 2006, 90, 2480–2488. [Google Scholar] [CrossRef]
- De Bias, M.A.; Torres, J.L.; Prieto, E.; Garcia, A. Selecting a suitable model for characterizing photovoltaic devices. Renew. Energy 2002, 25, 371–380. [Google Scholar] [CrossRef]
- Enrique, J.M.; Duran, E.; Sidrach-de-Cardona, M.; Andujar, J.M.; Boh6rquez, M.A.; Carretero, J.E. A new approach to obtain I-V and P-V curves of PV panels by using DC-DC converters. In Proceedings of the 31st IEEE PVSC, Lake Buena Vista, FL, USA, 3–7 January 2005; pp. 1769–1772. [Google Scholar]
- Duran, E.; Galan, J.; Sidrach-de-Cardona, M.; Andujar, J.M. A new Application of the Buck-Boost-Derived Converters to obtain the I-V curve of PV Modules. In Proceedings of the 38th IEEE PESC, Orlando, FL, USA, 17–21 June 2007; pp. 413–417. [Google Scholar]
- Sanchis, P.; Lopez, J.; Ursua, A.; Marroyo, L. Electronic Controlled Device for the Analysis and Design of Photovoltaic Systems. IEEE Power Electron. Lett. 2005, 3, 1748–1753. [Google Scholar] [CrossRef]
- Durán, E.; Andújar, J.M.; Pérez-Oria, M.E.M. Determination of PV Generator I-V/P-V Characteristic Curves Using a DC-DC Converter Controlled by a Virtual Instrument. Int. J. Photoenergy 2012, 2012, 13. [Google Scholar] [CrossRef]
- Durán, E.; Piliougine, M.; Sidrach-de-Cardona, M.; Galán, J.; Andujar, J.M. Different methods to obtain the I-V curve of PV modules: A review. In Proceedings of the 33rd IEEE Photovoltaic Specialists Conference (PVSC ‘08), San Diego, CA, USA, 11–16 May 2008. [Google Scholar]
- Castaner, L. Modeling Photovoltaic Systems Using PSPICE; Wiley: Hoboken, NJ, USA, 2003. [Google Scholar]
- Gow, J.; Manning, C. Development of a photovoltaic array model for use in power electronics simulation studies. IEE Proc. Electr. Power Appl. 1999, 146, 193–200. [Google Scholar] [CrossRef]
- Xu, J. An Analytical Technique for the Analysis of Switching DC-DC Converters. Available online: http://ieeexplore.ieee.org/document/176586/ (accessed on 14 April 2017).
- Rashid, M.H. Power Electronics Handbook; Florida Academic Press: Miami, FL, USA, 2001. [Google Scholar]
- Khatib, T.; Sopian, K.; Kazem, H. Actual performance and characteristic of a grid connected photovoltaic power system in the tropics: A short term evaluation. Energy Convers. Manag. 2013, 71, 115–119. [Google Scholar] [CrossRef]
- Ya’acob, M.; Hizam, H.; Khatib, T.; Radzi, M. Acomparative study of three types of grid connected photovoltaic systems based on actual performance. Energy Convers. Manag. 2014, 78, 8–13. [Google Scholar] [CrossRef]
- Farhoodnea, M.; Mohamed, A.; Khatib, T.; Elmenreich, W. Performance evaluation and characterization of a 3-kWp grid-connected photovoltaic system based on tropical field experimental results: New results and comparative study. Renew. Sustain. Energy Rev. 2015, 42, 1047–1054. [Google Scholar] [CrossRef]
- Dihrab, S.; Khatib, T.; Sopian, K.; Al-Ani, H. On the Performance of hybrid PV/ unitized regenerative fuel cell system in the tropics. Int. J. Photoenergy 2012, 2012, 1–7. [Google Scholar] [CrossRef]
- Sopian, K.; Shaari, S.; Amin, N.; Zulkifli, R.; Nizam, M. Abdul Rahman. Performance of a grid-connected photovoltaic system in Malaysia. Int. J. Eng. Technol. 2007, 4, 57–65. [Google Scholar]
- Hussin, M.Z.; Omar, A.M.; Zain, Z.M.; Shaari, S. Performance of Grid-Connected Photovoltaic System in Equatorial Rainforest Fully Humid Climate of Malaysia. Int. J. Appl. Power Eng. (IJAPE) 2013, 2, 105–114. [Google Scholar] [CrossRef]
Figure 1.
Equivalent circuit of a solar cell.

Figure 2.
I-V characteristic curve of a solar cell.

Figure 3.
Boost converter circuit.

Figure 4.
(a) “On mode” operation of boost converter; (b) “Off mode” operation of boost converter.

Figure 5.
Proposed I-V curve testing system.

Figure 6.
I-V curves generated by developed model for photovoltaic (PV) module using Matlab.

Figure 7.
(a) Capture of the PV array; (b) Capture of the testing system.

Figure 8.
Results of the developed I-V curve tester.

Figure 9.
Performance factor of the tested module at different levels of solar radiation.

Figure 10.
Validation of the proposed tester.
© 2017 by the authors. Licensee MDPI, Basel, Switzerland. This article is an open access article distributed under the terms and conditions of the Creative Commons Attribution (CC BY) license (http://creativecommons.org/licenses/by/4.0/).
Share and Cite
MDPI and ACS Style
Khatib, T.; Elmenreich, W.; Mohamed, A. Simplified I-V Characteristic Tester for Photovoltaic Modules Using a DC-DC Boost Converter. Sustainability 2017, 9, 657. https://doi.org/10.3390/su9040657
AMA Style
Khatib T, Elmenreich W, Mohamed A. Simplified I-V Characteristic Tester for Photovoltaic Modules Using a DC-DC Boost Converter. Sustainability. 2017; 9(4):657. https://doi.org/10.3390/su9040657
Chicago/Turabian StyleKhatib, Tamer, Wilfried Elmenreich, and Azah Mohamed. 2017. "Simplified I-V Characteristic Tester for Photovoltaic Modules Using a DC-DC Boost Converter" Sustainability 9, no. 4: 657. https://doi.org/10.3390/su9040657
Note that from the first issue of 2016, this journal uses article numbers instead of page numbers. See further details here.