Abstract
This study investigated the effects of soil crust development on the underlying soil properties. The field sampling work was conducted in June 2016 in the Hobq Desert in Inner Mongolia, North China. Soil crust samples and 0–6, 6–12, 12–18, 18–24, and 24–30 cm deep underlying soil samples were taken from five representative areas of different soil crust development stages. All samples were analyzed for physicochemical properties, including water content, bulk density, aggregate content, organic matter content, enzyme activities, and microbial biomass carbon and nitrogen. The results showed that the thickness, water content, macro-aggregate (>250 μm) content, organic matter content, microbial biomass, and enzyme activities of the soil crusts gradually increased along the soil crust development gradient, while the bulk density of the soil crusts decreased. Meanwhile, the physicochemical and biological properties of the soils below the algal and moss crusts were significantly ameliorated when compared with the physical crust. Moreover, the amelioration effects were significant in the upper horizons (~0–12 cm deep) and diminished quickly in the deeper soil layers.
1. Introduction
Soil degradation and desertification control is of great importance to protecting ecological balance and agricultural development in desert regions. Soil crusts, including physical crusts and biological crusts, are widely distributed in arid and semi-arid regions. Physical crusts are formed from the action of water and wind on soil particles on the surface of bare areas [1]. Physical crusts can further develop into biological crusts which are mainly composed of bacteria, fungi, algae, lichens, mosses, and other cryptogams [2]. Soil crusts can support surface ecosystems due to their strong ecological adaptability. The importance of soil crusts in ecosystem lies in the development of soil crust and conversion of soil nutrition by ameliorating physicochemical and biological properties. Specifically, in the vertical direction, soil crusts contribute to the regulation of water content and ecological promotion of nutrient cycle and, therefore, influence soil physicochemical properties, enzyme activities, microbial biomass carbon and nitrogen [3]. In the horizontal direction, soil crusts improve the resistance to wind erosion of the underlying soil due to their stable layered structure and, therefore, provide appropriate conditions for the growth of sand vegetation [4]. The study on soil crusts combining geoscience and biology has become a research focus and leading edge in arid and semi-arid regions.
In arid and semi-arid desert regions, water content is the dominant factor influencing the sandy ecosystem restoration. For example, Li et al. [5] found that the spatial variability of rainfall infiltration depth within the various soil layers significantly influenced the ecological development of soil crusts in the Tengger Desert in Inner Mongolia, North China. The authors also found that the soil crusts influenced the soil water environment by reducing the infiltration and evaporation of precipitation and, therefore, resulted in a vegetation change from shrubs to herbs. Aggregates and organic matter are important soil components. Aggregates are the place where organic carbon exists. Organic matter provides nutrient sources and energy for plant growth and microbial activities. Both aggregates and organic matter influence the stability of soil structure, as well as soil anti-erodibility and fertility and plant growth [6,7]. Numerous studies have demonstrated that the development of biological soil crusts can increases aggregate stability [8], organic matter content [9], and soil fertility [10,11].
Microbial biomass carbon and nitrogen are the most active and variable parts of soil organic matter [12]. Liang et al. [13] demonstrated that microbial biomass carbon and nitrogen were sensitive to planting, fertilization and other management measures. Issa et al. [14] reported that the soil crusts with porous organic bodies increased soil porosity water and nutrient retention. Yu and Steinberger [15] found that the microbial biomass was recorded relatively higher in the two upper (0–20 cm) layers than the deeper layers (20–50 cm). Enzymes are the most active biocatalyst in the material cycle and energy flow of ecosystems, influencing all of the biochemical processes in soil and most organic carbon species [16,17]. To be specific, alkaline phosphatase can hydrolyze organophosphorus ester into inorganic phosphate. Urease can promote the hydrolysis of urea into ammonia and, therefore, supply nitrogen for plant growth and soil microbial activities. Protease can promote the hydrolysis of proteins into amino acids. Peroxidase is involved in the soil organic carbon cycle and transformation.
The desert region of the Hobq Desert in Inner Mongolia, North China was chosen as the study area due to the abundant soil crusts and extreme ecological environment. Many studies have examined the effects of soil crusts on soil hydraulic conductivity [18], soil structure [8], microbial biomass [19], enzyme activities [20,21], and succession process [1] in this region. However, to our knowledge, few studies have investigated how different types of soil crusts and vegetation covers influence the spatial variations in underlying soil properties, which can indicate the soil quality. In addition, the relationships between soil physicochemical properties, microbial biomass and enzyme activities of different types of soil crusts remain unknown in the Hobq Desert.
This study explored the effects of different physical and biological crusts on the physicochemical characteristics, enzyme activities, and microbial biomass of the underlying soils in the Hobq Desert, aiming at providing a reference for vegetation restoration and soil improvement in the desert region of North China. In contrast to previous studies where the 0–5 cm deep underlying topsoil was usually collected, 0–30 cm deep underlying soil samples were collected in this study to investigate the effects of the organic matter accumulation and microbial activities in the upper soil layers. The sampling depth was designed according to the root depth (~30 cm) of Artemisia ordosica which dominates the study area.
2. Material and Methods
2.1. Study Area
The Hobq Desert is located in Inner Mongolia, North China. It has a desert area of 13,358 km2, ranking as the 7th largest desert in China. The field sampling work was conducted in the southern part of the desert (40°16′ N–40°39′ N, 107°45′ E–109°50′ E, 1020–1097 m asl). The desert is located in a typical semi-arid temperate continental monsoonal climate zone. According to the Chinese International Exchange Stations Surface Climate Standard Values Monthly Dataset (1971–2000) (weather station No.: 53463; location: 40°49′ N, 111°41′ E, 1063 m asl) (National Meteorological Information, 2005), the mean annual temperature is 6.1 °C, and the lowest and highest monthly mean temperatures are −34.5 °C and 40.2 °C, respectively. The mean annual precipitation is 250 mm, falling predominantly during summer, and the mean annual pan evaporation is 2160 mm. The mean annual wind speed is 3.9 m/s, and there is a wind erosion period often occurring from March to May with a wind speed up to 30 m/s.
The experimental soil is sandy, weak salt wet cambisol, and arid sandy entisol. A range of engineering measures such as enclosure and afforestation have been undertaken by the national and local governments to control the local desertification and restore vegetation cover. The Hobq Desert is currently covered by drought-tolerant sand vegetation mainly consisting of Agriophyllum squarrosum, Elymus dahuricus, Salsola collina, Sophora alopecuroides, Astragalus adsurgens, Artemisia ordosica, and Aneurolepidium chinense. Physical and biological soil crusts have been formed between the bare sand dune and vegetation. Chen and Duan [22] have recently reported that the local biological soil crusts include algal crust, lichen crust, algal-lichen mixed crust, and moss crust. The dominant species composing the local biological soil crusts are Microcoleus vaginatus, Collema tenax, and Byum argenteum.
2.2. Field Sampling
Vegetation was planted in the study area in the mid-1980s as part of the local desertification control project. Soil crusts have been widely formed on the top of the sandy soil in the region. According to our field survey, five types of soil crusts were selected. For each type of soil crust, a sampling strip 1 m wide and 20 m long was designed. Along each sampling strip, three sampling points were selected to determine soil properties based on the same topography and soil type. Our field survey demonstrated that within the sampling stripes the mean plant height and crown width of the dominant Artemisia ordosica were 35 and 40 cm, respectively. The mean vegetation cover was estimated to be ~50%.
At each sampling point, the soil crust sample and 0–6, 6–12, 12–18, 18–24, and 24–30 cm deep underlying soil samples were collected in June 2016. Briefly, the soil crust was carefully separated from the underlying soil using a shovel. Next the 30 cm deep undisturbed soil column sample was collected using an organic glass sampling tube. The soil column sample was then separated into subsamples of different depths as aforementioned. A total of 75 underlying soil samples were collected. The characteristics of the five soil crust samples are shown in Table 1.

Table 1.
Characteristics of the soil crust samples.
2.3. Laboratory Analyses
All soil crust samples and underlying soil samples were air-dried and passed through a 2 mm sieve to remove roots and other debris. Crust thickness was measured using a Vernier caliper. Water content was determined by the oven-drying method. Bulk density was determined by the cutting ring method. Each soil sample was separated into three fractions, viz., <53, 53–250 and >250 μm, by the wet sieving method as described in [23]. Organic matter content was determined by the potassium dichromate-sulfuric acid oxidation method as described in [24]. Microbial biomass carbon and nitrogen were determined by the chloroform-fumigation extraction method as described in [25].
Enzymes activities were determined by the methods as described in References [26]. For alkaline phosphatase, 1 g soil and 0.25 mL toluene were incubated in 1 mL nitro phenolic sodium phosphate and 4 mL borate buffer at pH = 11 at 37 °C for 1 h. The mixture was then filtered. The amount of phenol released from the filtrate was estimated based on the color reaction. For urease, 5 g soil was mixed with 1 mL toluene, 10 mL 10% urea solution and 20 mL citrate solution at pH = 6.7 at 37 °C for 24 h. The amount of released ammonium was colorimetrically determined using a spectrophotometer at 578 nm. For protease, 5 g soil and 25 mL sodium casein were incubated in 25 mL 50 mol/L tris buffer at pH = 8.1 at 50 °C for 2 h. 5 mL 33% folin solution was then added. The protease activity was colorimetrically quantified using a spectrophotometer at 700 nm. For peroxidase, 2 g soil and 5 mL 0.3% hydrogen peroxide solution were added to a 100 mL conical flask with 40 mL deionized water. After shaking and filtration, the filtrate was titrated to the pink end point with 0.5 mol/L potassium permanganate. The peroxidase activity was then calculated using the following formula: (A–B)*T, where A is the dosage of potassium permanganate used to titrate the 25 mL original hydrogen peroxide solution; B is the dosage of potassium permanganate used to titrate the 25 mL soil filtrate solution; and T is the correction value.
2.4. Data Analyses
IBM® SPSS® Statistics 20 (Statistical Product and Service Solutions, IBM Company, USA) was used to analyze the data. Significant differences among soil physicochemical properties, enzymes activities, microbial biomass carbon and nitrogen were compared by the LSD test at a significance level of 0.05. Results were presented as mean value ± standard deviation. Correlation analysis was conducted at significance levels of 0.01 and 0.05, respectively.
3. Results
3.1. Soil Physicochemical Properties
The water contents of the five soil crusts and their underlying soil layers (crust and layers sample) are shown in Figure 1. Except for Crust and layers 1, the water contents of crust and layers 2, 3, 4, and 5 first increased with depth and peaked at the depth of 6–12 cm and then decreased with depth. Regarding the Artemisia ordosica cover, the water contents of crusts 2 and 3 were 0.9% and 1.2%, respectively. The values reached up to 2.4% and 3.0%, respectively, at the depth of 6–12 cm and then dropped to 1.9% and 1.2%, respectively, at the depth of 24–30 cm. Regarding the Artemisia ordosica and Eragrostis poaeoides cover, the water contents of crusts 4 and 5 were 0.6% and 2.0%, respectively. The values reached up to 0.9% and 3.2%, respectively, at the depth of 6–12 cm and then dropped to 0.7% and 1.4%, respectively, at a depth of 24–30 cm. In contrast, there was an increasing trend in the water content of crust and layers 1 with depth. Moreover, at the depth of <24 cm the water contents of crust and layers 2, 3, and 5 were higher than the corresponding value of crust and layers 1, while at the depth of 24–30 cm these values became quite similar.
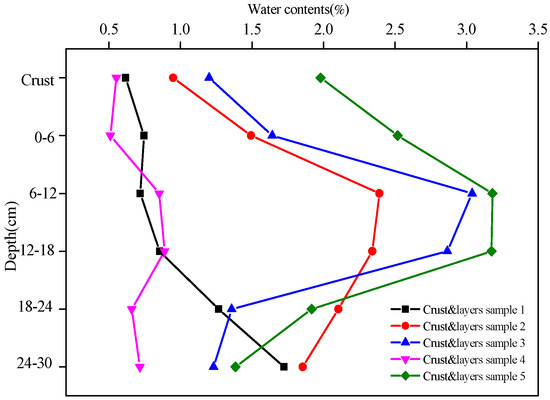
Figure 1.
The water contents of the five crust and layers samples at different depths.
The bulk density of the five soil crusts and their underlying soil layers are shown in Figure 2. The bulk density of crust 1 (1.4 g/cm3) was higher than those of crusts 2, 3, 4, and 5 (range 0.9–1.3 g/cm3). Moreover, the bulk density of the algal crust (e.g., crusts 2 and 4) was higher than that of the moss crust (e.g., crusts 3 and 5). The above trend was also found among the corresponding soil layers at the same depth. In addition, all the bulk density of the five crust and layers samples tended to increase with depth.
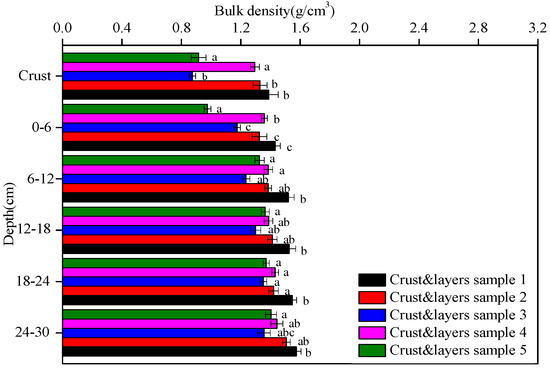
Figure 2.
The bulk density of the five crust and layers samples at different depths. Data with the same letter at the same depth are not significantly different at p = 0.05 by the LSD test.
The aggregate contents of the five soil crusts and their underlying soil layers are shown in Figure 3. The <53 μm aggregate content of crust 1 (88%) was higher than those of crusts 2, 3, 4, and 5 (range 24–79%). Moreover, both crusts 1 and 2 were dominated by the <53 μm aggregates, while crusts 3 and 5 were dominated by the 53–250 and >250 μm aggregates, respectively. There was a relatively higher content of <53 μm aggregates than the contents of 53–250 and >250 μm aggregates present in crust 4. Except for crust and layers 4, the <53 μm aggregate content of the soil layers below crust 1 was higher than those of the corresponding soil layers below crusts 2, 3, 4, and 5 at the depth of 6–24 cm. In contrast, the soil layers below crust 4 had the highest <53 μm aggregate contents at the depth of 0–6 and 24–30 cm, respectively. Additionally, the soil layers below crust 1 were dominated by the <53 μm aggregates at all the depths. The soil layers below crusts 2 and 3 were dominated by the <53 μm aggregates at shallow depths (e.g., 0–12 cm), while the soil layers were dominated by the >53 μm aggregates at deep depths (e.g., 12–30 cm). The soil layers below crust 4 were dominated by the <53 μm aggregates at all the depths except for the depth of 6–12 cm, where the dominant aggregates fell into the range of >53 μm. The soil layers below crust 5 were dominated by the >53 μm aggregates at all the depths with a dominant amount of >250 μm aggregates at deep depths (e.g., 12–30 cm).
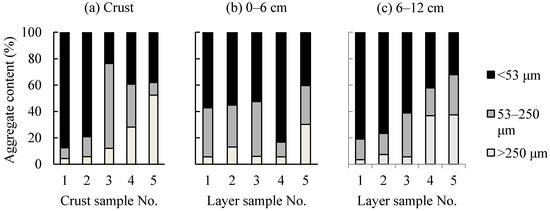
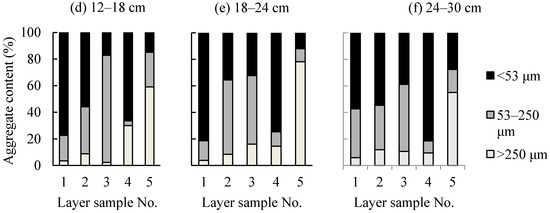
Figure 3.
The aggregate contents of the five crust and layers samples at different depths. (a) Crust (b) 0–6 cm (c) 6–12 cm (d) 12–18 cm (e) 18–24 cm (f) 24–30 cm.
The organic matter contents of the five soil crusts and their underlying soil layers are shown in Figure 4. The organic matter contents increased with soil crust development from the physical crust (3.4 g/kg in crust 1) to the algal crust (5.3 g/kg in crust 2 and 7.5 g/kg in crust 4) and, finally, to the moss crust (9.6 g/kg in crust 3 and 17.6 g/kg in crust 5). In contrast, all the organic matter contents of the five crust and layers samples tended to decrease with depth. Except for crust and layers 1, a conspicuous decline was observed in the organic matter contents of crust and layers 2, 3, 4, and 5 at the depth of 0–6 cm, while only a slight decline was observed at the depth of 6–30 cm for all the five crust and layers samples.
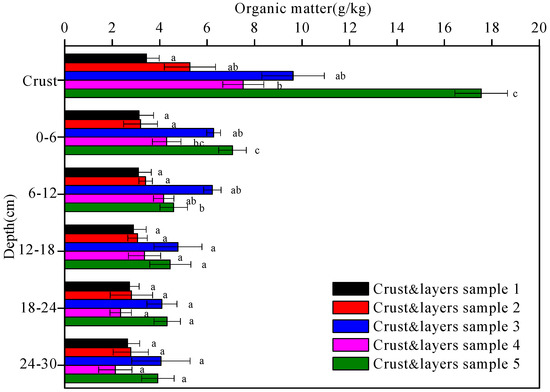
Figure 4.
The organic matter contents of the five crust and layers samples at different depths. Data with the same letter at the same depth are not significantly different at p = 0.05 by the LSD test.
3.2. Enzyme Activities
The activities of alkaline phosphatase, urease, protease, and peroxidase in the five soil crusts and their underlying soil layers are shown in Figure 5, Figure 6, Figure 7 and Figure 8, respectively. In general, all the enzyme activities increased with soil crust development while decreased with depth. The enzymes were more active in biological crusts than in physical crust. For example, the alkaline phosphatase activity in the algal crust (crusts 2 and 4) and moss crust (crusts 3 and 5) was 1.1–1.4-times and 3.4–7.2-times higher than in the physical crust (crust 1). In the 0–30 cm deep soil layers, the alkaline phosphatase activity was, again, in the following decreasing order: moss crust > algal crust > physical crust.
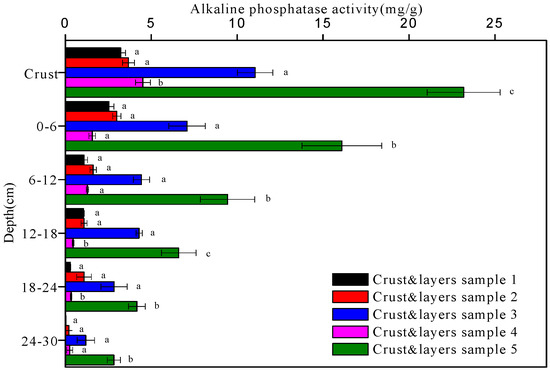
Figure 5.
The alkaline phosphatase activity of the five crust and layers samples at different depths. Data with the same letter at the same depth are not significantly different at p = 0.05 by the LSD test.
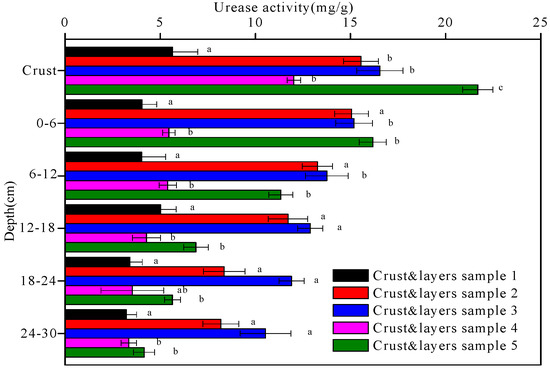
Figure 6.
The urease activity of the five crust and layers samples at different depths. Data with the same letter at the same depth are not significantly different at p = 0.05 by the LSD test.
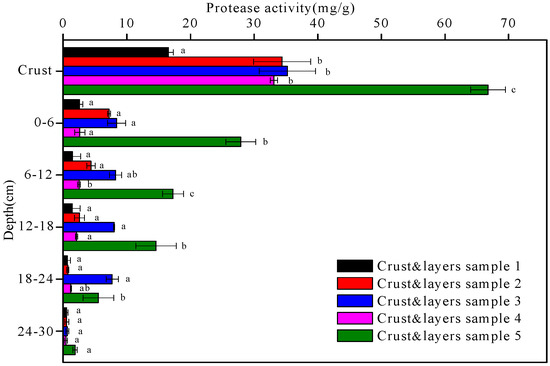
Figure 7.
The protease activity of the five crust and layers samples at different depths. Data with the same letter at the same depth are not significantly different at p = 0.05 by the LSD test.
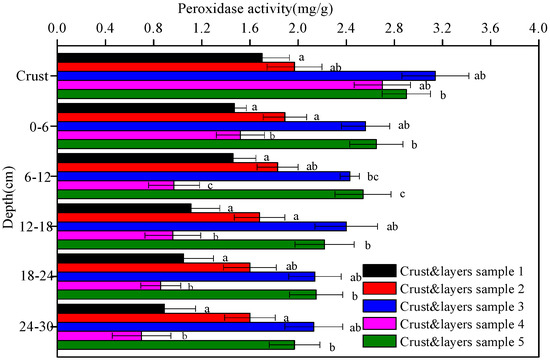
Figure 8.
The peroxidase activity of the five crust and layers samples at different depths. Data with the same letter at the same depth are not significantly different at p = 0.05 by the LSD test.
3.3. Microbial Biomass Carbon and Nitrogen Contents
Soil microbial biomass, defined as the living microbial component of the soil by [27], is the nutrients and energy pool that provides the conditions for soil biochemical processes, thus being frequently proposed as an indicator to evaluate soil fertility and biological activity.
The microbial biomass carbon and nitrogen contents of the five soil crusts and their underlying soil layers are shown in Figure 9 and Figure 10, respectively. The microbial biomass carbon and nitrogen contents of the biological crusts (crusts 2, 3, 4, and 5) were higher than those of the physical crust (crust 1). There was a decreasing trend in all the microbial biomass carbon and nitrogen contents of the five crust and layers samples with depth (p < 0.05). Under the Artemisia ordosica cover, the microbial biomass carbon and nitrogen contents of the moss crust (crust 3) and underlying soil layers were higher than those of the algal crust (crust 2) and underlying soil layers at the same depth. Similarly, under the Artemisia ordosica and Eragrostis poaeoides cover, the microbial biomass carbon and nitrogen contents of the moss crust (crust 5) and underlying soil layers were higher than those of the algal crust (crust 4) and underlying soil layers at the same depth.
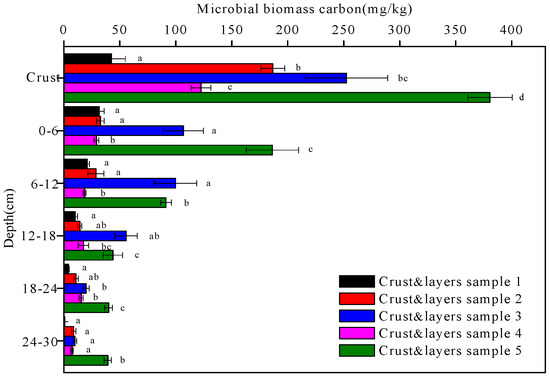
Figure 9.
The microbial biomass carbon contents of the five crust and layers samples at different depths. Data with the same letter at the same depth are not significantly different at p = 0.05 by the LSD test.
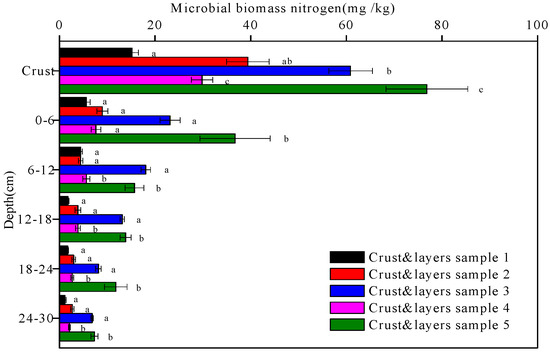
Figure 10.
The microbial biomass nitrogen contents of the five crust and layers samples at different depths. Data with the same letter at the same depth are not significantly different at p = 0.05 by the LSD test.
3.4. Relationships between Physicochemical Properties and Microbial Parameters of Soil Crusts
The relationships between water content, bulk density, organic matter content, microbial biomass carbon content, microbial biomass nitrogen content, and enzyme activities of the five soil crusts are listed in Table 2. The water content was strongly related to the alkaline phosphatase activity (R2 = 0.96, p < 0.01). Negative correlations were found between the bulk density and other parameters. The organic matter content was positively strongly correlated with the alkaline phosphatase activity (R2 = 0.98, p < 0.01) and protease activity (R2 = 0.96, p < 0.01), respectively. The microbial biomass carbon content was positively strongly correlated with the microbial biomass nitrogen content (R2 = 0.99, p < 0.01) and urease activity (R2 = 0.97, p < 0.01), respectively.
Table 2.
Correlation coefficients between physicochemical and microbial parameters of soil crusts.
The statistical analysis of the enzyme activities showed that all the alkaline phosphatase, urease, protease and peroxidase activities were strongly related to crust type (p < 0.05). As shown in Table 3, vegetation cover also had a significant influence on enzyme activities. Moreover, the interaction between crust type and vegetation cover was obvious.
Table 3.
Statistical analysis of enzyme activities.
4. Discussion
4.1. Relationships between Soil Crust Development and Soil Properties
In the Hobq Desert of North China the physical crust has been formed at the surface of the bare area through the accumulation and subsidence of deposited atmospheric dust. The deposition process and plant roots can compact the physical crust. The fertility of the subsoil layer can be improved after long-term migration and leaching of humus and mineral elements. By this time, the microorganisms will have begun to accumulate organic matter, leading to the development of biological soil crust from algal crust to moss crust, as the biological soil crust is mainly composed of bacteria, fungi, algae, lichens, mosses, and other cryptogams [2].
The results showed that the water retention, macro-aggregate content, organic matter content, enzyme activities, and microbial biomass carbon and nitrogen contents of the soils below the biological crusts (algal crusts 2 and 4, and moss crusts 3 and 5) were significantly higher than the corresponding values of the soil below the physical crust (crust 1) (p < 0.05). This finding indicated that the soil crusts significantly improved the properties of the sandy soil, and the well-developed moss crust had a more significant amelioration effect when compared to the physical crust and other less-developed biological crusts. Moreover, the crust thickness was in the following increasing order: physical crust < algal crust < moss crust. Similarly, Guo et al. [1] observed that the succession process of biological crust was from algal crust to moss crust with an increase in thickness from 0.68 to 1.79 cm.
Due to the dry and windy climate, and sandy land in the Hobq Desert, soil fertility and structure have been subjected to severe long-term degradation. The structure of small aggregates can be easily broken up, and the organic carbon content is low (~6 mg/kg) [22]. In this study, the establishment and development of soil crust reduced the bulk density and micro-aggregate content. For example, the amount of <53 μm aggregates in crust 1 was 88%, indicating a potentially poor surface structure. In contrast, the aggregate size was significantly increased in well-developed crusts 2, 3, 4, and 5, contributing to increasing aggregate stability against wind erosion. Moreover, soil crust development can stabilize the loose desert surface and improve its resistance to wind erosion. This may be attributed to the accumulation and deposit of atmospheric dust and microbial activities. This finding is in accordance with Chamizo et al. [2], who found that the aggregate stability was higher under well-developed moss crust than under physical crust. Biological crust can improve aggregate stability, which contributes to a more stable soil structure by wrapping loose particles through rhizoid and plant [6,28].
The development of soil crust resulted in an increase in the water contents of the crusts and their underlying soils in the upper horizons. In the 0–12 cm deep soil layer, for example, the dense root of vascular plant and microbial secretion could increase the water content [29]. In addition, the reduction in the surface evapotranspiration can contribute to the increase in the underlying water content. The water content decreased in the 18–30 cm deep soil layer, possibly because after the interception of precipitation by soil crusts, precipitation was consumed by the shallow (0–30 cm deep) roots of the dominant Artemisia ordosica and evaporation of the crusts, instead of recharging to deeper soil. Yu and Steinberger [15] observed that the water content slightly increased in the 10–20 cm deep soil layer and then decreased in the 20–40 cm deep soil layer under Hammada scoparia, in the Negev Desert in Israel.
The organic matter content of crust 1 which is physical crust was below 5 g/kg, indicating the depletion of soil fertility. The organic matter content of the well-developed moss crust was 5.1-times greater than that in the physical crust. The establishment and development of soil crust enhanced the accumulation of organic matter through extracellular polysaccharides [30]. This finding is consistent with the results of Guo et al. [1] who found that the contents of organic matter, total nitrogen, and total phosphorus in the bare Horqin Sand Land in Inner Mongolia ranged from 6.64 to 31.91, 0.48 to 1.33, and 0.13 to 0.23 g/kg, respectively, indicating the inherent infertility after long-term migration and leaching of humus and mineral elements.
The activities of alkaline phosphatase, urease, protease, peroxidase, and the microbial biomass carbon and nitrogen contents increased simultaneously with the development of soil crust from the physical crust to the algal crust to the moss crust. This finding indicated that the moss crust was desirable for microbial growth and reproduction, as well as enzyme activities due to its higher contents of water and organic matter, when compared to algal and physical crusts. Enzyme activities can accelerate the enzymatic reaction of organic matter, promote the circulation of organic compounds and, therefore, improve soil properties benefiting plant growth, and enhance biological soil crust formation. Yang et al. [31] and Pajares et al. [32] reported that soil enzymes and microbes promoted soil nutrient transformation and cycling, and can be used as indicators of quality changes of soils. The results of this study also suggested that soil crust formation is mainly accompanied by microbial activities. Additionally, the results supported previous studies that demonstrated that the development of soil crust can increase water availability, improve soil stability, and increase contents of organic matter, carbon, and nitrogen. These properties are the factors that are significantly affecting soil enzyme activities and microbial biomass in arid and semi-arid areas.
The properties of the 0–30 cm deep soils below the algal and moss crusts were significantly improved when compared to those of the soil below the physical crust. Moreover, the moss crust had the most significant amelioration effect on the underlying soil. However, the influence of vegetation coverage and vegetation litter appeared to be limited as the amelioration effect decreased with depth. Furthermore, water content varied dramatically with depth. Organic matter content, microbial biomass carbon and nitrogen contents, and enzyme activities all decreased with depth. These findings are in accordance with Chamizo et al. [2], who reported that the underlying soil properties (e.g., aggregate stability, water content, organic carbon and nitrogen content) were higher under the moss crust than the physical crust. Similarly, Bolton et al. [33] indicated that soil microbial biomass carbon and nitrogen contents and soil enzyme activity were 2–15 times higher in the top 5 cm of soil than at the 5–15-cm depth regardless of plant type. In this study, at the depth of 0–6 cm, the underlying soil physicochemical and biological characteristics were significantly (except for organic matter content, alkaline phosphatase activity, peroxidase activity) improved from physical crust to moss crust (p < 0.05). Moreover, the amelioration effect mainly occurred under the well-developed moss crust rather than under the less-developed algal crust and physical crust. Guo et al. [1] demonstrated that biological crusts pose a significant influence on the properties (e.g., bulk density, organic matter content, nitrogen content, phosphorus content, electrical conductivity, pH and CaCO3 content) of the 0–5-cm deep layer underlying topsoil.
Under the Artemisia ordosica cover, for example, the highest contents of organic matter, microbial biomass carbon and nitrogen, and enzyme activities in the crusts and 0–30 cm deep layers underlying soils were found in Crust and layers sample 3 (moss crust). Crust and layers sample 3 was dominated by the 53–250 μm aggregates. In contrast, under the Artemisia ordosica and Eragrostis poaeoides cover, Crust and layers sample 5 was dominated by the >250 μm aggregates, exhibiting an increasing trend in organic matter content with increasing aggregate size. Similarly, Jastrow et al. [34] demonstrated that organic matter content was greater in macro-aggregates (>212 µm) than in micro-aggregates (53–212 µm). This can be attributed to the different carbon sequestration ways between large aggregates and micro-aggregates. Large aggregates derived most of their organic matter from the decomposition of roots and hyphae which are easily affected by the environment and transformation, while micro-aggregates sequestrate carbon through the combination of organic and inorganic colloids [35]. Therefore, the organic carbon in micro-aggregates mainly consists of stable humus carbon, which is not easy to be mineralized. The contents of >250 μm aggregates and organic matter, microbial biomass carbon and nitrogen and enzyme activities under Artemisia ordosica and Eragrostis poaeoides cover were greater than those under Artemisia ordosica cover. Franzluebbers and Arshad [36] also observed that the microbial content and activity were greater in large aggregates in the Canadian Prairies.
4.2. Relationships between Vegetation Types and Soil Properties
Regarding the same type of soil crust, the water retention, aggregate stability, organic matter content, enzyme activities, and microbial biomass carbon and nitrogen contents of the soil under the Artemisia ordosica and Eragrostis poaeoides cover (algal crust 4 and moss crust 5) were significantly higher than the corresponding values of the soil under the Artemisia ordosica cover (algal crust 2 and moss crust 3) (p < 0.05). Thus, the complex crust-soil-vegetation system interaction has affected the physicochemical and biological properties of crusts and their underlying soils. The vegetation effects are dominated by the vegetation litter and root system.
On the one hand, shrub can intercept and deposit atmospheric dust, and then the vegetation litter intercepts rainfall and suppresses transpiration [37]. In the current study, the cover of Artemisia ordosica helps the desert surface to resist wind erosion and promote crust development. Therefore, it is easy to form a feedback mechanism among vegetation litter, soil structure, and soil nutrients. Schlesinger and Pilmanis [38] found a high infiltration rate below desert shrubs as a result of better soil crumb structure and lower impact energy of raindrops. Read et al. [39] confirmed that biological crusts are generally developed from shrub vegetation as it can increase the surface roughness and surface clay content by capturing aeolian dust through dense foliage. On the other hand, vegetation roots provide effective carbon and nitrogen contents for microbial and enzyme activities by secreting metabolites into the rhizosphere during growth [40]. The herbaceous vegetation Eragrostis poaeoides is more conducive to nutrient accumulation and soil properties improvement due to its very large root system, and the decomposition of dead roots can gradually improve the underlying soil properties [5].
The type of vegetation cover is also of great importance to soil quality. It is a contributing factor for the better soil properties found in, for example, algal crust and layers sample 4 than crust and layers sample 2, and moss crust and layers sample 5 than crust and layers sample 3.
5. Conclusions
The influence of the soil crust development on a range of properties of crust and layer samples collected from the Hobq Desert was investigated. The results demonstrated that organic matter, microbial biomass carbon and nitrogen contents, and enzyme activities of the crusts were significantly different at different soil crust development stages. The thickness, water content, and aggregate stability of the soil crusts increased with soil crust development, while the bulk density of soil crusts decreased with the soil crust development. The findings also indicated that the soil crusts significantly improved the soil properties. In addition, the moss crust had a more significant amelioration effect when compared to other less-developed crusts. The physicochemical and biological properties of the soils below the algal and moss crusts were significantly improved when compared to the physical crust. However, the effect of the soil crust development on the underlying soil quality was significant at shallow depths (~0–12 cm deep) and decreased quickly with depth. The results suggested that the development of soil crust played a crucial role in improving the physicochemical and biological properties of the underlying soil. The development of soil crust can promote the growth of microorganisms and, ultimately, improve the soil microenvironment and ecological restoration in the desert region.
Acknowledgments
This work was supported by the National Natural Science Foundation of China (No. 51379211).
Author Contributions
Jiping Niu, Kai Yang, Zejun Tang, and Yitong Wang conceived and designed the experiments. Jiping Niu, Zejun Tang and Yitong Wang performed the experiments. Jiping Niu analyzed the data. Jiping Niu and Kai Yang wrote the paper.
Conflicts of Interest
The authors declare no conflict of interest.
References
- Guo, Y.; Zhao, H.; Zuo, X.; Drake, S.; Zhao, X. Biological soil crust development and its topsoil properties in the process of dune stabilization, Inner Mongolia, China. Environ. Geol. 2008, 54, 653–662. [Google Scholar] [CrossRef]
- Chamizo, S.; Cantón, Y.; Miralles, I.; Domingo, F. Biological soil crust development affects physicochemical characteristics of soil surface in semiarid ecosystems. Soil Biol. Biochem. 2012, 49, 96–105. [Google Scholar] [CrossRef]
- Enwall, K.; Nyberg, K.; Bertilsson, S.; Cederlund, H.; Stenström, J.; Hallin, S. Long-term impact of fertilization on activity and composition of bacterial communities and metabolic guilds in agricultural soil. Soil Biol. Biochem. 2007, 39, 106–115. [Google Scholar] [CrossRef]
- Prasse, R.; Bornkamm, R. Effect of microbiotic soil surface crusts on emergence of vascular plants. Plant Ecol. 2000, 150, 65–75. [Google Scholar] [CrossRef]
- Li, X.; Wang, X.; Li, T.; Zhang, J. Microbiotic soil crust and its effect on vegetation and habitat on artificially stabilized desert dunes in Tengger Desert, North China. Biol. Fertil. Soils 2002, 35, 147–154. [Google Scholar]
- Eldridge, D.; Leys, J. Exploring some relationships between biological soil crusts, soil aggregation and wind erosion. J. Arid Environ. 2003, 53, 457–466. [Google Scholar] [CrossRef]
- Coxson, D. Biological soil crusts: Structure, function, and management. Bryologist 2002, 105, 500–501. [Google Scholar] [CrossRef]
- Zhang, Y.; Wang, H.; Wang, X.; Yang, W.; Zhang, D. The microstructure of microbiotic crust and its influence on wind erosion for a sandy soil surface in the Gurbantunggut Desert of Northwestern China. Geoderma 2006, 132, 441–449. [Google Scholar] [CrossRef]
- Eldridge, J.; Greene, R. Microbiotic soil crusts-a review of their roles in soil and ecological processes in the rangelands of Australia. Soil Res. 1994, 32, 389–415. [Google Scholar] [CrossRef]
- Maestre, F.; Bowker, M.; Cantón, Y.; Castillo-Monroy, A.; Cortina, J.; Escolar, C.; Escudero, A.; Lázaro, R.; Martínez, I. Ecology and functional roles of biological soil crusts in semi-arid ecosystems of Spain. J. Arid Environ. 2011, 75, 1282–1291. [Google Scholar] [CrossRef] [PubMed]
- Mager, D.; Thomas, A. Extracellular polysaccharides from cyanobacterial soil crusts: A review of their role in dryland soil processes. J. Arid Environ. 2011, 75, 91–97. [Google Scholar] [CrossRef]
- Kirk, J.; Beaudette, L.; Hart, M.; Moutoglis, P.; Klironomos, J.; Lee, H.; Trevors, J. Methods of studying soil microbial diversity. J. Microbiol. Methods. 2004, 58, 169–188. [Google Scholar] [CrossRef] [PubMed]
- Liang, Q.; Chen, H.; Gong, Y.; Fan, M.; Yang, H.; Lal, R.; Kuzyakov, Y. Effects of 15 years of manure and inorganic fertilizers on soil organic carbon fractions in a wheat-maize system in the North China Plain. Nutr. Cycl. Agroecosyst. 2012, 92, 21–33. [Google Scholar] [CrossRef]
- Issa, O.; Trichet, J.; Défarge, C.; Couté, A.; Valentin, C. Morphology and microstructure of microbiotic soil crusts on a tiger bush sequence (Niger, Sahel). Catena 1999, 37, 175–196. [Google Scholar] [CrossRef]
- Yu, J.; Steinberger, Y. Vertical distribution of soil microbial biomass and its association with shrubs from the Negev Desert. J. Arid Environ. 2012, 78, 110–118. [Google Scholar] [CrossRef]
- Acosta-Martinez, V.; Cruz, L.; Sotomayor-Ramirez, D.; Pérez-Alegría, L. Enzyme activities as affected by soil properties and land use in a tropical watershed. Appl. Soil Ecol. 2007, 35, 35–45. [Google Scholar] [CrossRef]
- García, R.; Ochoa, V.; Viñegla, B.; Hinojosa, M.; Pena, R.; Liébanas, G.; Carreira, J. Soil enzymes, nematode community and selected physico-chemical properties as soil quality indicators in organic and conventional olive oil farming: influence of seasonality and site features. Appl. Soil Ecol. 2009, 41, 305–314. [Google Scholar] [CrossRef]
- Li, X.; Zhang, J.; Wang, X.; Liu, L.; Xiao, H. Study on soil microbiotic crust and its influences on sand-fixing vegetation in arid desert region. Acta Botanica Sin. 1999, 42, 965–970. [Google Scholar]
- Chen, L.; Xie, Z.; Hu, C.; Li, D.; Wang, G.; Liu, Y. Man-made desert algal crusts as affected by environmental factors in Inner Mongolia, China. J. Arid Environ. 2006, 67, 521–527. [Google Scholar] [CrossRef]
- Zhao, Y.; Xu, M.; Belnap, J. Potential nitrogen fixation activity of different aged biological soil crusts from rehabilitated grasslands of the hilly Loess Plateau, China. J. Arid Environ. 2010, 74, 1186–1191. [Google Scholar] [CrossRef]
- Zhang, W.; Zhang, G.; Liu, G.; Dong, Z.; Chen, T.; Zhang, M.; An, L. Bacterial diversity and distribution in the southeast edge of the Tengger Desert and their correlation with soil enzyme activities. J. Environ. Sci. 2012, 24, 2004–2011. [Google Scholar] [CrossRef]
- Chen, X.; Duan, Z. Impacts of soil crusts on soil physicochemical characteristics in different rainfall zones of the arid and semi-arid desert regions of northern China. Environ. Earth Sci. 2015, 73, 3335–3347. [Google Scholar] [CrossRef]
- Cambardella, C.A.; Elliott, E.T. Carbon and nitrogen distribution in aggregates from cultivated and native grassland soils. Soil Sci. Soc. Am. J. 1993, 57, 1071–1076. [Google Scholar] [CrossRef]
- Nelson, D.; Sommers, L. Total carbon, organic carbon, and organic matter. Methods of soil analysis. Part 2. Chem. Microbiol. Prop. 1982, 2, 539–579. [Google Scholar]
- Witt, C.; Gaunt, J.; Galicia, C.; Ottow, J.; Neue, H. A rapid chloroform-fumigation extraction method for measuring soil microbial biomass carbon and nitrogen in flooded rice soils. Biol. Fertil. Soils 2000, 30, 510–519. [Google Scholar] [CrossRef]
- Guan, S. Soil Enzymes and its Research Methods; Agriculture Press: Beijing, China, 1986. (In Chinese) [Google Scholar]
- Wardle, D. A comparative assessment of factors which influence microbial biomass carbon and nitrogen levels in soil. Biol. Rev. 1992, 67, 321–358. [Google Scholar] [CrossRef]
- Belnap, J.; Eldridge, D. Disturbance and recovery of biological soil crusts. In Biological Soil Crusts: Structure, Function, and Management; (Ecological Studies 150); Springer: Berlin/Heidelberg, Germany, 2001; pp. 363–383. [Google Scholar]
- Shamir, I.; Steinberger, Y. Vertical distribution and activity of soil microbial population in a sandy desert ecosystem. Microb. Ecol. 2007, 53, 340–347. [Google Scholar] [CrossRef] [PubMed]
- Chenu, C.; Guerif, J. Mechanical strength of clay minerals as influenced by an adsorbed polysaccharide. Soil Sci. Soc. Am. J. 1991, 55, 1076–1080. [Google Scholar] [CrossRef]
- Yang, Z.; Hao, J.; Miao, G. Effect of immature loess subsoil fertilization in current year on rhizospheric soil biological activity and nutrient of mixture cropping. J. Soil Water Conserv. 2010, 24, 223–227. [Google Scholar]
- Pajares, S.; Gallardo, J.; Masciandaro, G.; Ceccanti, B.; Etchevers, J. Enzyme activity as an indicator of soil quality changes in degraded cultivated Acrisols in the Mexican Trans-Volcanic Belt. Land Degrad. Dev. 2011, 22, 373–381. [Google Scholar] [CrossRef]
- Bolton, H.; Smith, J.L.; Link, S.O. Soil microbial biomass and activity of a disturbed and undisturbed shrub-steppe ecosystem. Soil Biol. Biochem. 1993, 25, 545–552. [Google Scholar] [CrossRef]
- Jastrow, J.; Miller, R.; Boutton, T. Carbon dynamics of aggregate-associated organic matter estimated by carbon-13 natural abundance. Soil Sci. Soc. Am. J. 1996, 60, 801–807. [Google Scholar] [CrossRef]
- Zi, C.Z.; Shu, Q.H.; Ting, X.L.; Yong, D.W. Effect of land use patterns on stability and distributions of organic carbon in the hilly region of Western Sichuan, China. Afr. J. Biotechnol. 2013, 10, 13107–13114. [Google Scholar]
- Franzluebbers, A.; Arshad, M. Soil organic matter pools with conventional and zero tillage in a cold, semiarid climate. Soil Tillage Res. 1996, 39, 1–11. [Google Scholar] [CrossRef]
- Wezel, A.; Rajot, J.; Herbrig, C. Influence of shrubs on soil characteristics and their function in Sahelian agro-ecosystems in semi-arid Niger. J. Arid Environ. 2000, 44, 383–398. [Google Scholar] [CrossRef]
- Schlesinger, W.; Pilmanis, A. Plant-soil interactions in deserts. Biogeochemistry 1998, 42, 169–187. [Google Scholar] [CrossRef]
- Read, C.; Duncan, D.; Vesk, P.; Elith, J. Biological soil crust distribution is related to patterns of fragmentation and landuse in a dryland agricultural landscape of southern Australia. Landsc. Ecol. 2008, 23, 1093–1105. [Google Scholar] [CrossRef]
- Thomas, A.; Dougill, A. Distribution and characteristics of cyanobacterial soil crusts in the Molopo Basin, South Africa. J. Arid Environ. 2006, 64, 270–283. [Google Scholar] [CrossRef]
© 2017 by the authors. Licensee MDPI, Basel, Switzerland. This article is an open access article distributed under the terms and conditions of the Creative Commons Attribution (CC BY) license (http://creativecommons.org/licenses/by/4.0/).