1. Introduction
As the world’s largest developing country, China has increased its GDP by more than 80 times since its reform and opening-up of its economy in 1978. Meanwhile, China has faced more and more emerging conflicts in terms of energy supply and demand. In 2007, China became the largest carbon emitter [
1], with a GDP of
$5.8786 trillion USD in 2010, also becoming the world’s largest energy consumer [
2]. There is no doubt that the energy demand will soar in the future as China is on a path to rapid urbanization and industrialization. Therefore, improving energy efficiency is vitally important for energy savings and CO
2 emission reduction. This problem has attracted much interest from both academia and the government. China has made substantial efforts to improve energy efficiency in the past decades.
Since 2006, plans for energy reduction have been incorporated into the national strategic plans and policies in China [
3]. The 11th ”Five-Year Plan” set the target of reducing energy intensity, and the energy consumption per unit of GDP would be reduced by 20% from 2006 to 2010. In 2009, China’s government put forward the target that CO
2 emissions per GDP would be lower by 40–45% in 2020 when compared to CO
2 emissions per GDP in 2005. Furthermore, China’s 12th ”Five-Year Plan” proposed to decrease the aggregate energy intensity by 17% from 2011 to 2015. Additionally, the Chinese government promised that its carbon emissions would reach the peak around 2030. To achieve these ambitious goals, all industries in China have to spare no effort to find appropriate ways to promote technical change and reduce carbon emissions [
4,
5,
6].
As the primary energy consumer in China, the overall energy consumption of construction projects accounted for nearly one-sixth of the total economy’s energy consumption in China [
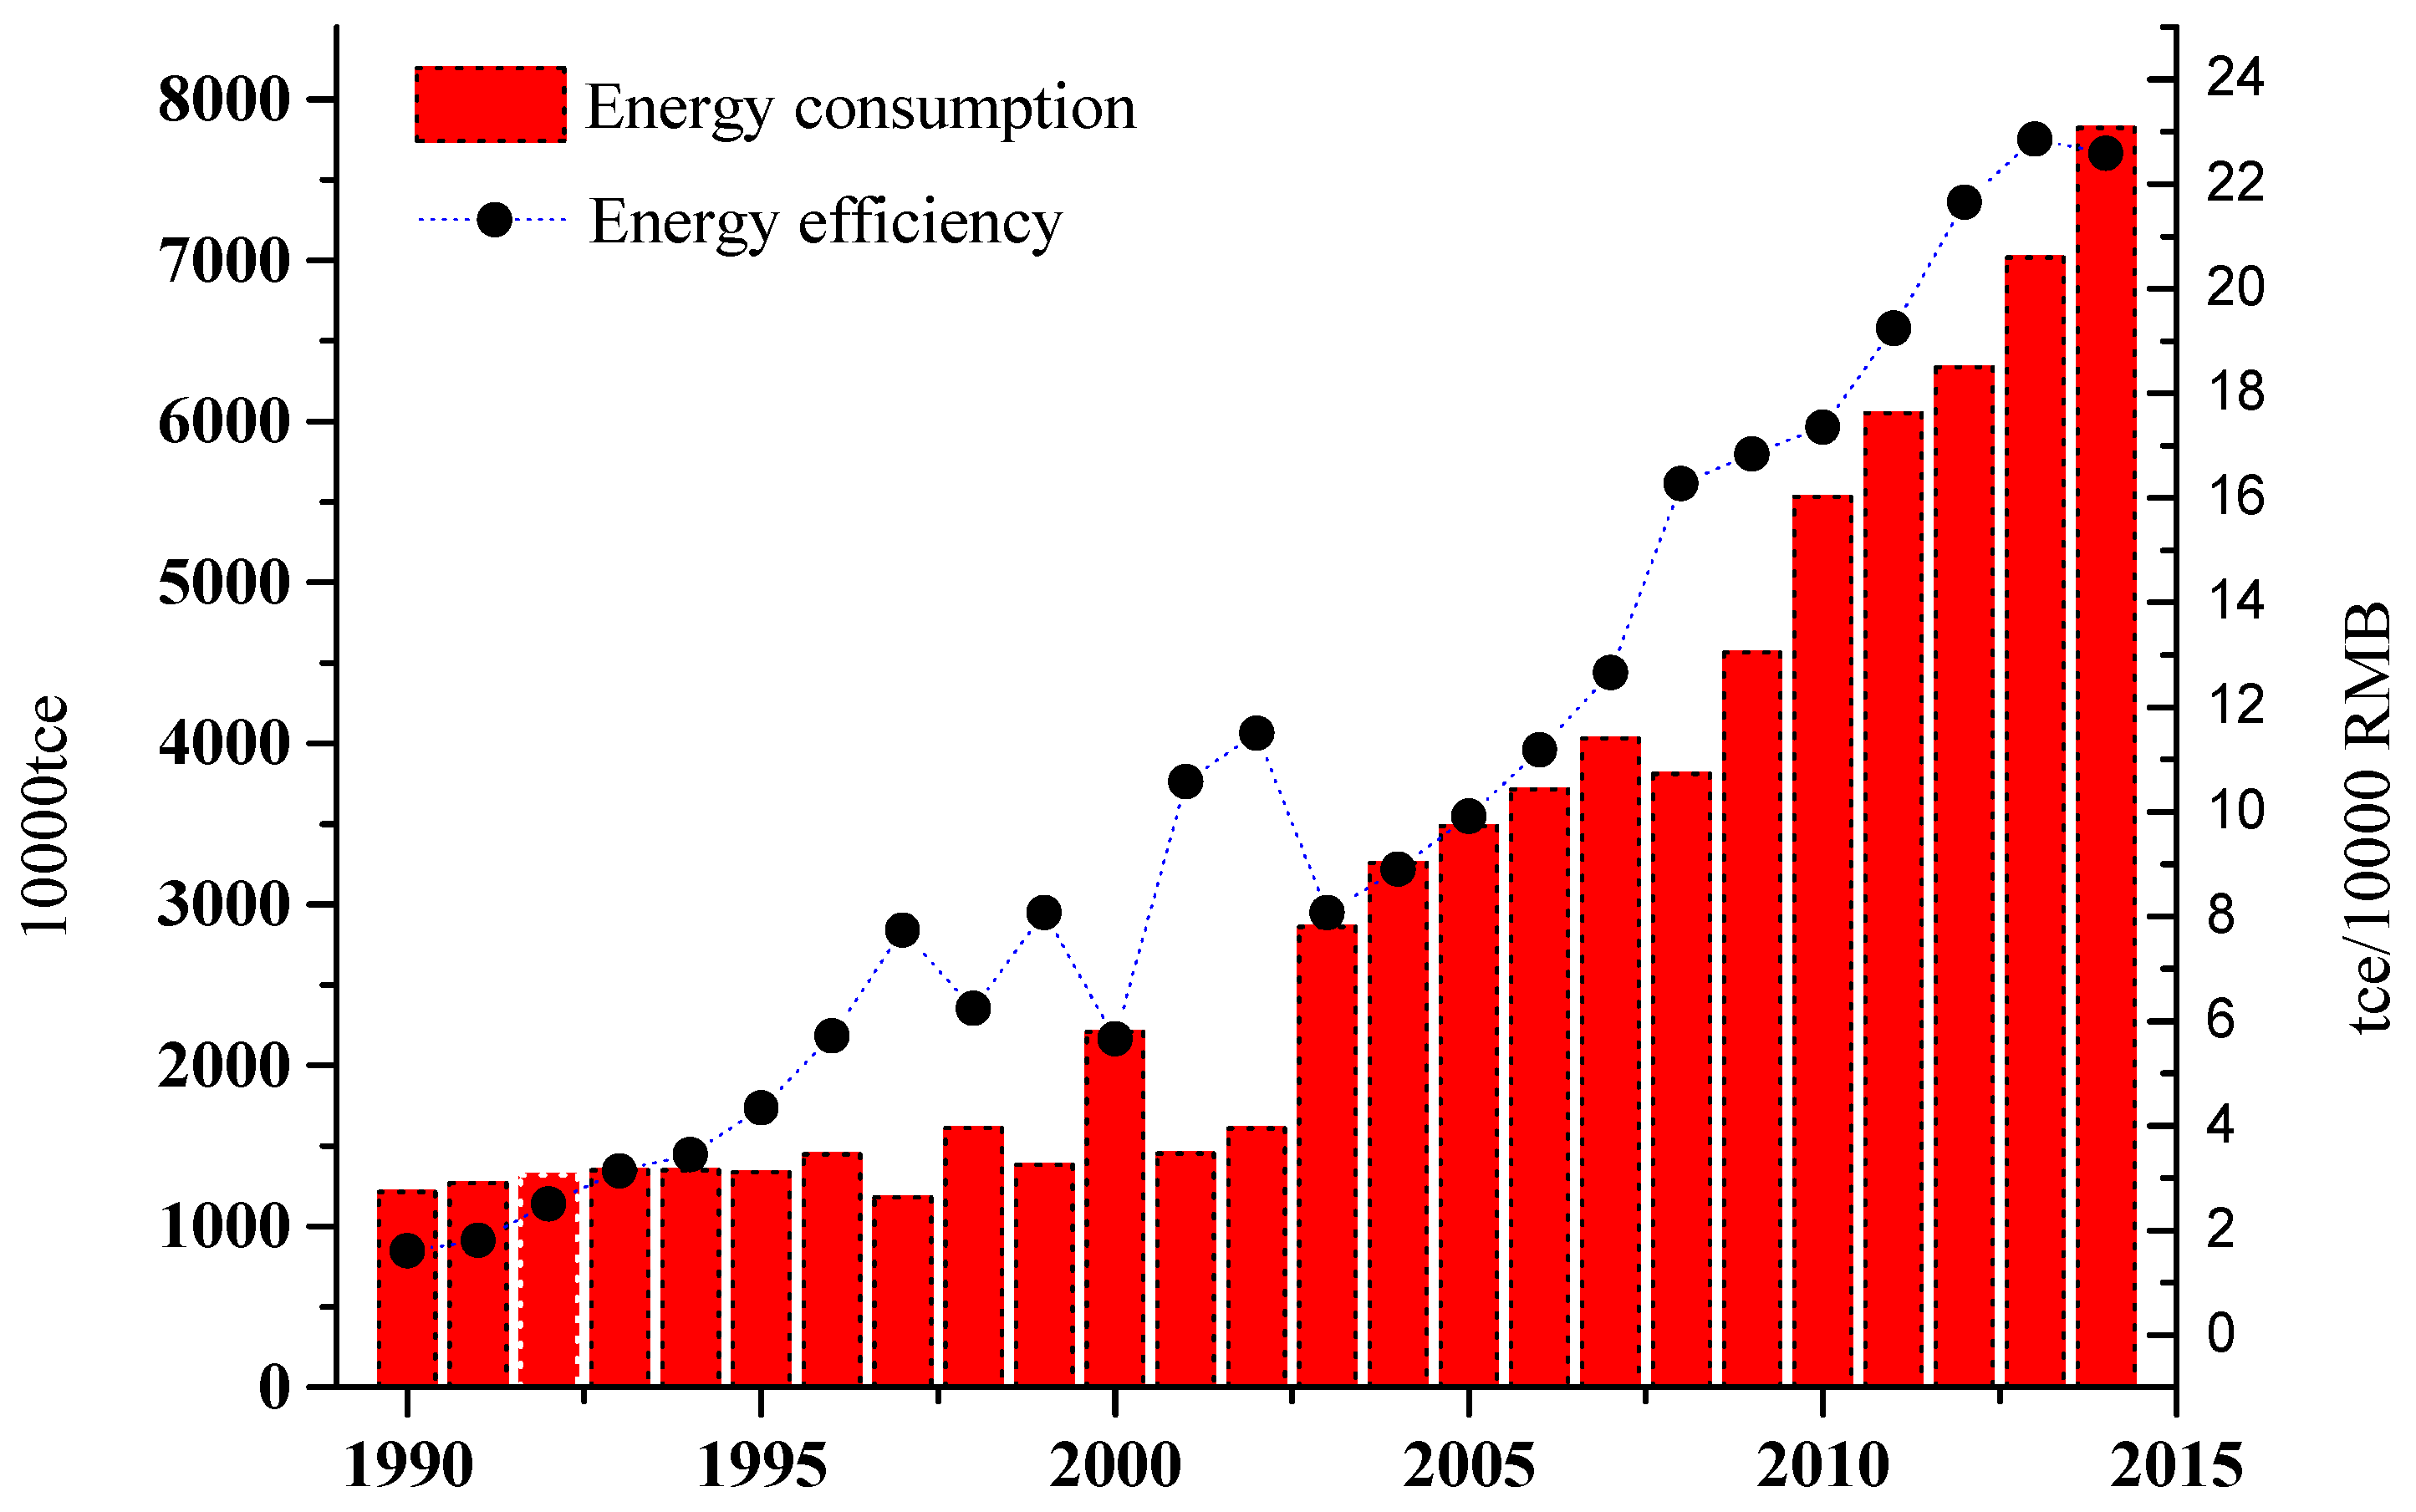
7] in 2007. Considering the requirement of sustainable development in China, the construction industry is supposed to take great responsibility for mitigating energy consumption and carbon emissions. Therefore, it is necessary to develop its energy-related technologies and improve its energy efficiency in the construction industry. The China Energy Statistical Yearbook shows that the energy efficiency of the Chinese construction industry has been continuously increasing, from 1.61 10,000 RMB/tce in 1990 to 22.59 10,000 RMB/tce in 2014 (1990 constant price), with an obvious increasing trend.
However, in contrast to the expected effect, the energy consumption is still increasing rather than decreasing (
Figure 1), from 12.13 Mtce in 1990 to 78.23 Mtce in 2014, with a growth rate of 545%. The most important reason is that the large energy demands are driven by rapid economic growth, while the “rebound effect” could also be an important aspect not to be neglected [
8,
9].
The “rebound effect” is an important issue in energy economics. Potential energy saving from improved energy efficiency can be partly, or even totally, offset by additional energy demand and consumption, caused by some economic effects, such as the substitution effect, income effect, and output effect [
10]. This phenomenon is called the “energy rebound effect”, which implies that, although energy efficiency enhancement induced by technical change would reduce energy consumption, technical change and energy efficiency enhancement can promote economic growth, thus generating new energy demand. Therefore, the energy saved by improved energy efficiency is partially offset by additional energy consumption. This lost part of the potential energy savings is defined as the rebound effect [
11].
In fact, technical change in the construction industry would help improve energy efficiency and mitigate carbon emissions; at the same time, the energy price might decrease due to the accelerating technical change, which might stimulate energy demand and offset the positive role of technical change in energy saving. Therefore, the energy rebound effect has to be taken into consideration when making energy policies.
The aim of this paper is to investigate whether the energy rebound effect exists in the construction industry, and to determine the magnitude of the energy rebound effect, if any, in China. Considering the data unavailability and non-market characteristics of energy prices in China, this paper applied Solow residual and ridge regression to investigate the energy rebound effect for the construction industry in China.
The structure of this paper is organized as follows:
Section 2 provides a literature review about the energy rebound effect;
Section 3 presents the models and methodology; detailed discussions of empirical results are conducted in
Section 4; and
Section 5 provides the conclusions.
2. Literature Review
Since the earliest studies on the energy rebound effect in the estimation of energy savings [
12], the energy rebound effect has received increasing attention. In China, the evolution of the rebound effect was later than in Western countries. Over the past decade, there have been some studies proving that the energy rebound effect can be very significant in China [
13,
14,
15].
From 2006, the studies mainly employed two types of methods to estimate the energy rebound effect in China at the macroeconomic level: the CGE (computable general equilibrium) model and the econometric approach. Based on the CGE model, Glomsrød and Wei [
16] simulated the influence of an emerging market for cleaned coal on Chinese energy consumption and pollutant emission. They found that coal cleaning stimulates economic growth and reduces particle emissions, but total energy use, coal use, and CO
2 emissions increase through a rebound effect supported by the vast reserve of underemployed laborers. Zha and Zhou [
17] used the CGE model to estimate the rebound effect. The authors concluded that the 4% increase of energy efficiency could induce a 33% rebound, while the latter argued that, in the long term, the 5% increase of energy efficiency could generate a 178.61% backfire effect. The CGE model takes into account many related influential factors of energy efficiency in order to reflect the complexity of the economic system, such as factor substitution, income level, industrial structure, policy guidance, and technical change. While this method conducts simulation analysis by subjectively setting the growth rate of energy efficiency, it is difficult to attain the actual rebound effect resulting from empirically-estimated energy efficiency change.
Econometric approaches were also used to estimate China’s economy-wide energy rebound effect. Zhou and Lin [
18] used the econometric model to estimate the energy rebound effect in China at the macroeconomic level firstly, and the result showed that the energy rebound effect fluctuates from 30% to 80%. After that, most studies followed their thinking, but used various econometric approaches and data samples. For instance, Feng and Ye [
19] further considered the spatial spillover effect between the regions’ economic growth and estimated the energy rebound effect in China’s 29 provinces from 1995 to 2011. They found that there exist significant time and spatial spillover characteristics in China’s energy consumption rebound effect, and the rebound effect does not appear in all periods; it appears relatively concentrated in the eastern provinces, and less in economically underdeveloped provinces.
At present, compared with the significant studies on China’s economy-wide energy rebound effect, the energy rebound effect in specific industrial sectors has received much less attention. Meanwhile, the magnitude of the energy rebound effect varies in different sectors. Guo and Ling [
20] estimated the rebound effect in industrial sectors in China during the period of 1978–2007. The result shows that the rebound effect in the study period was roughly 46.38%. Lin and Li [
21] estimated the rebound effect in China’s heavy industry later on and found that the rebound effect for the heavy industry in China was about 74.3%. The energy rebound effect was also proved to exist in other sectors [
22,
23,
24].
The construction industry, as the main energy consumer in China, is examined in this paper. This paper provides some empirical evidence on the energy rebound effect for the construction industry in China, which is the largest energy-consuming country in the world. The magnitude of the rebound effect is particularly important for the design of an effective set of energy conservation policies. A large rebound effect estimation implies that efficiency policies require commensurately higher energy prices; otherwise, energy saving would not be realized due to the rebound effect, and it will be better to implement energy policies when the rebound effect is relatively small. Hence, it would be meaningful to investigate the energy rebound effect in China’s construction industry.
3. Methodology
The energy rebound effect in China’s construction industry is estimated through the following mechanism: we assume that there is a technical change in the construction industry. Energy efficiency improvement will promote technical change; then, it will accelerate economic growth; finally, it will increase energy consumption. On the other hand, improvement of energy efficiency would result in a decline in energy prices, which may stimulate the energy demand and consumption.
This paper estimates the energy rebound effect in China’s construction industry by comparing the energy consumption changes mainly caused by output growth after technical change. Therefore, the key to energy rebound effect estimation is to evaluate the potential energy savings (SE) caused by technical change and the additional energy consumption (AE) due to output growth caused by technical change (energy efficiency improvement). In this way, we can define the energy rebound effect in China’s construction industry as follows:
Energy intensity is one of the most popular indicators for measuring energy efficiency of a country or industry because improvements in energy efficiency are frequently indicated by a decrease in energy intensity. It is convenient and objective to measure energy efficiency through energy consumption per GDP when energy input structure changes slightly [
25]. The relationship between energy consumption and GDP can be represented as follows:
where
is the output of China’s construction industry in year
,
is the energy consumption of China’s construction industry in year
t, and
represents energy consumption per GDP.
If energy efficiency is improved, energy intensity will decrease. Then, the potential energy saving (SE) in China’s construction industry in year
is as follows:
Therefore, the additional energy consumption (AE) due to output growth caused by technical change in China’s construction industry in year
is as follows:
where
denotes the contribution of technical change to China’s construction industry in year
.
Thus, the estimation formula of the energy rebound effect in year
can be expressed as:
According to Equation (5), the key to estimating the rebound effect is to precisely estimate the contribution of technical change to China’s construction industry. Considering the data unavailability and non-market characteristics of China’s energy price, this paper presents a model incorporating three input factors (capital, labor, and energy) of developed C-D production function and Solow residual methodology to calculate the technical change in China’s construction industry.
In neo-classical economics, economic growth is commonly defined as growth in production (Y) in the economy, which is a function of capital (K) and labor (L).
where
is the time index.
This study regards energy as an input factor that combines with capital and labor to produce the output of the whole economy, or of a sector of the economy (for example, the construction industry in this paper). Based on Hicks neutral C-D production function, the developed production function of the three elements of China’s construction industry is described as follows:
where
denotes the contributions to the total output increase of China’s construction industry in year
.
is the capital stock of China’s construction industry in year
.
is the labor input of China’s construction industry in year
.
is the energy consumption of China’s construction industry in year
.
is Hicks neutral technological parameter, which can be defined by
. Then, we can obtain a model incorporating the three input factors (capital, labor, and energy) of neoclassical product functions:
Taking the natural logarithm of Equation (8):
where
,
, and
denote the output elasticities of capital, labor, and energy.
Previously, some studies used the OLS (ordinary least square) to estimate the result of Equation (9). When the predictor variables are highly correlated, ridge regression produces coefficients which predict and extrapolate better than ordinary least squares and it is a safe procedure for selecting variables. Thus, this paper employs ridge regression to estimate the result of Equation (9).
This paper uses
,
,
, and
to represent the growth rate of output, capital, labor, and energy of the construction industry in year
. Thus, we can obtain:
here
is the Solow residual, which represents the contribution of technical change in year
. Thus, the technical change rates of the construction industry in year
can be presented as follows:
We can obtain the contribution of technical change to China’s construction industry. Finally, based on Equations (8)–(11), and using relevant statistical data, we can validate whether the energy rebound effect exists in China’s construction industry.
4. Empirical Results
4.1. Data Description
Considering the development of the construction industry and the availability of data, we use a data sample over the period of 1990–2014. Details of the input–output data in Equation (8) are as follows:
Output : the real GDP at 1990 constant price deflated by the GDP deflator, sourced from China Statistical Yearbook and China’s Construction Industry Statistical Yearbook.
Labour input : We use the average employment numbers at the beginning and end of each year to measure labor input. The original data is from the China Statistical Yearbook and China’s Construction Industry Statistical Yearbook.
Energy input : The energy involved in China’s construction industry includes coal, oil, natural gas, and coke. The statistical yearbooks give the consumption of each energy type. In order to ensure that the units are consistent and comparable, all energy types are converted into the standard coal equivalent. The aggregation is the total energy consumption in the power generation sector measured by the standard coal equivalence.
Capital stock
: The data of capital stock in each sector is unavailable in China’s current statistics, but the methodology of the capital stock estimation has been well developed. There are a few studies estimating the capital stock in China’s industrial sector [
26,
27]. This paper adopts the perpetual inventory method (PIM) to calculate the capital stock in China’s construction industry. The PIM is defined as:
where
denotes the investment in year
,
denotes the capital stock in year
, and
is capital depreciation rate assigned (18.53%) [
27]. The original data is from the China Statistical Yearbook and China’s Construction Industry Statistical Yearbook.
4.2. Parameter Estimation
To avoid spurious regression, properties of the time series data should be tested by the unit root test. The results are presented below:
Table 1 indicates that although output, capital, labor, and energy are all non-stationary time series, their first difference forms are all stationary time series at the 5% significance level. Therefore, we can say that all the four variables are integrated of order one, which means that a long-run cointegration relationship does exist among the four variables.
Meanwhile, we adopt the Pearson correlation test to check whether our predictor variables are highly correlated. The results in
Table 2 indicate that output, capital, labor, and energy are highly correlated. Therefore, to avoid spurious regression, we should employ ridge regression to estimate the result of Equation (9).
4.3. Estimated Result of Ridge Regression
The estimated result of ridge regression of Equation (9) is as follows:
The value of achieved is 0.96 and all coefficients are statistically significant at the 5% significant level, which indicates that the result of ridge regression is reasonable. The result of ridge regression shows that the elasticity of the labor input to net output is 0.6712, the elasticity of the capital input to net output is 0.3565, and the elasticity of the energy input to net output is 0.4208. It indicates that for each additional percentage point of labor, capital and energy input increase by 0.6712, 0.3565 and 0.4208 respectively, the output of China’s construction industry will increase a percentage point. In microeconomic theory, it is well known that for the developed production function, if , the production has an increasing return to scale.
Meanwhile, the output elasticity of labor input of China’s construction industry (0.6712) is higher than that of the energy input (0.4208) and capital input (0.3565) which means that China’s construction industry depends on labor-driven development, and the development of China’s construction industry largely depends on labor input. The labor input is the major driving factor. As a labor-intensive industry, China’s abundant labor resources provide a good force for the development of China’s construction industry, so the construction enterprises inevitably ignore the investment in technical change; especially, many small- and medium-sized enterprises are unlikely to increase their investment in technical change. Although this situation has improved in recent years, the construction industry is still slightly less invested in technical change compared with other pillar industries. Technical change should be seen as a lasting force in the development of the construction industry, and enterprises should be more concerned about it. Only by increasing investment in technical change, speeding up technical change, promoting new technologies, new processes, and new materials in the industry can the construction industry shift from a labor-intensive industry to a technology-intensive industry.
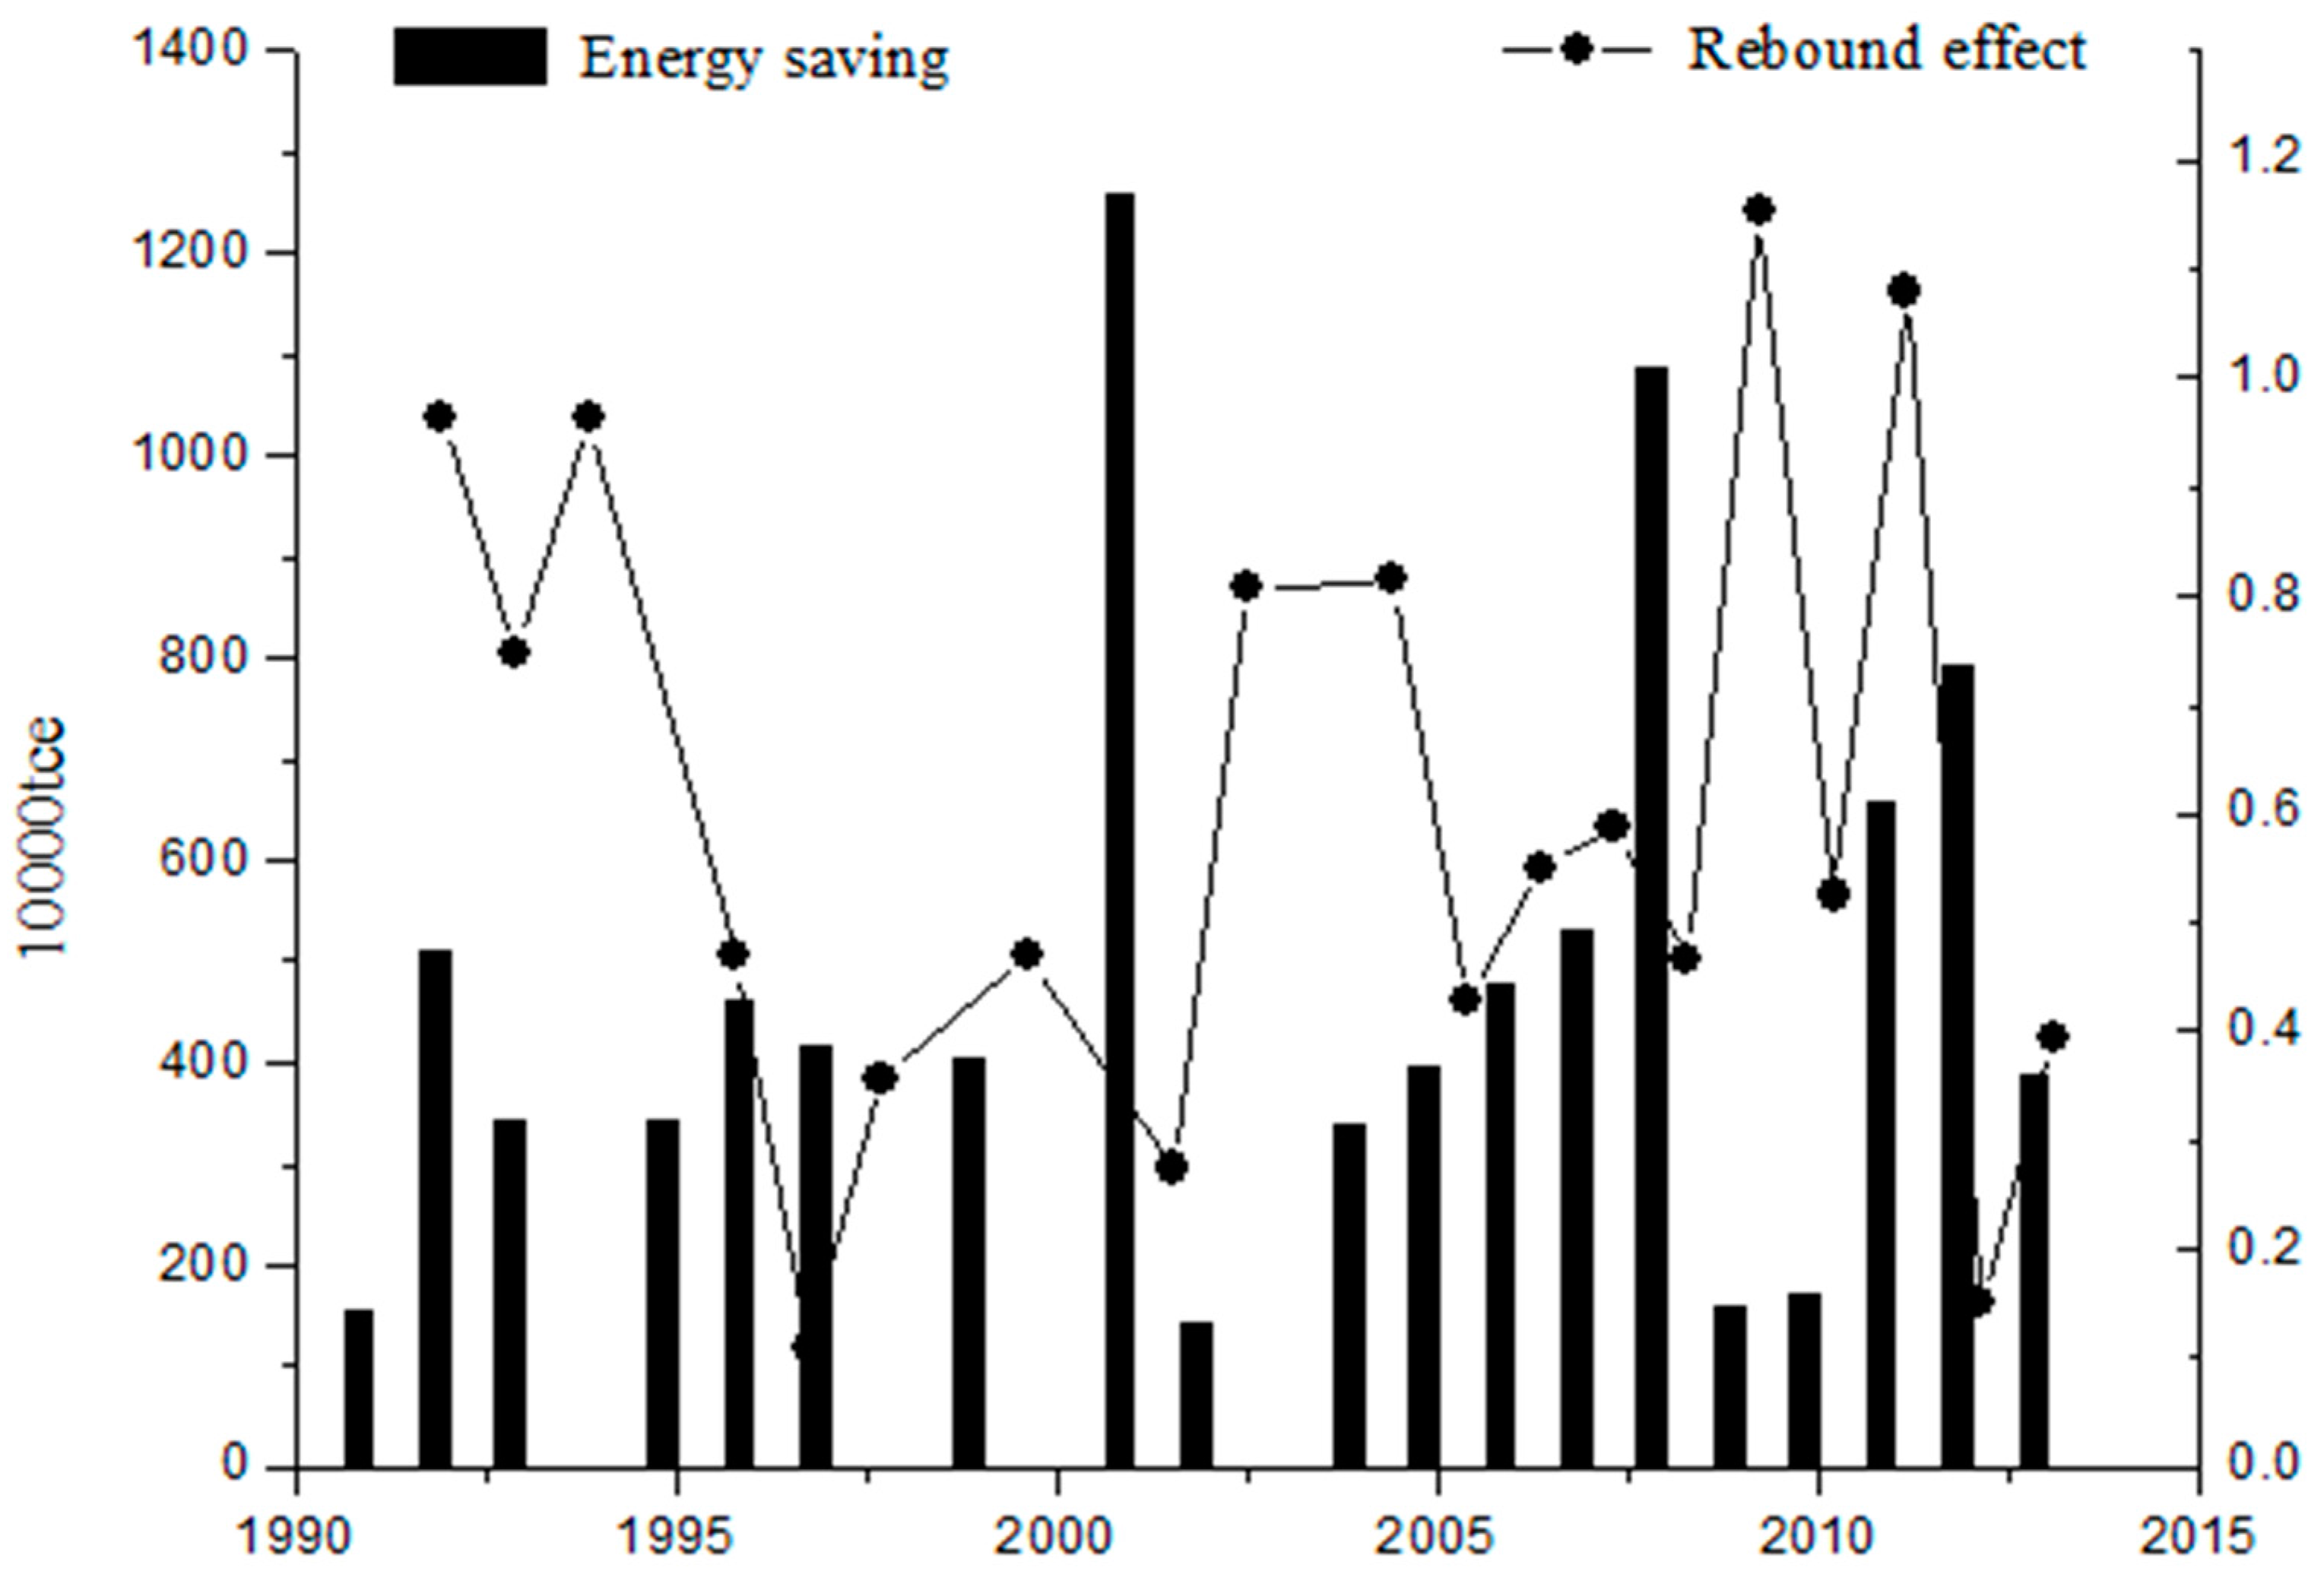
Based on the above estimated results and Equations (8)–(11), using relevant statistical data, we can determine the potential energy saving and additional energy consumption, and calculate the energy rebound effect in China’s construction industry from 1990 to 2014. The results are shown in
Table 3 and
Figure 2.
5. Discussion
The empirical results proved that the energy rebound effect indeed exists in China’s construction industry. The energy rebound effect is also shown to vary from 10% to 96% and to fluctuate during different periods. This paper discusses these findings further here.
From
Table 3, it is shown that the impact of technical change on energy intensity and energy savings is a dynamic change process. In 1994, 1998, 2000, 2003, and 2014, the value of five years of construction industry energy savings was negative. Excluding these five special years, we can see that the trend of the energy rebound effect of China’s construction industry is downward, but very tortuous (see as
Figure 2). This is related to the development background of China’s construction industry in different years. From 1991 to 2014, the average energy rebound effect of China’s construction industry was 59.5%. Compared to the previous literature on the estimation of the energy rebound effect for a particular sector in Western countries [
28,
29], empirical results in this paper reveal that the energy rebound effect for China’s construction industry is more remarkable than the energy rebound effect for the construction industry in Western countries. Considering the current situation of China’s national economic development and that China’s construction industry is still in an extensive development stage, the result is reasonable. It is also similar to the conclusion that the energy rebound effect presents a declining trend by Guo et al. [
20]. Furthermore, the energy rebound effect estimated in China’s aggregate industry ranged from 20% to 76% during the period 1995–2012 by Zhang et al. [
9], which supports the credibility of the result obtained from this research.
From 1991 to 1999, the energy rebound effect of China’s construction industry experienced a dramatic fall from 96.5% down to about 30% while the average value was 58%. From 2000 to 2009, the average energy rebound effect of the industry was 63.5%, slightly higher than that of the 1990s. This can be attributed to the government starting to implement the commercialization of housing in 1998, and the construction sector—closely related to real estate—which also developed rapidly. In this period, the gross output value of China’s construction industry rose from 1249.76 billion RMB to 7680.77 billion RMB. The expansion of the construction industry brought significant amounts of energy demand, prompting technical change to save less energy than the amount needed for the growth of the construction industry. After 2009, the average energy rebound effect was 53.7%. With the development of the construction industry becoming stable, the rebound effect decreased, and the energy saving effect brought by technical change was more obvious.
In addition, the energy rebound effect of the construction industry is greater than, or close to, 100% in 1991, 1993, 2009, and 2011. In these years, China’s government increased its economic input and stimulated economic growth, promoting new energy consumption to a level greater than the savings in energy consumption. Especially in 2009 and 2011, there was a backfire effect.
Through the empirical results, it is shown that the energy rebound effect indeed exists in China’s construction industry, and in different periods there are different fluctuations. Overall, the energy intensity of China’s construction industry presented a declining trend. For special years, in 1994, 1998, 2000, 2003, and 2014—a total of five years—the energy savings in the construction industry were negative. In 1998, 2000, 2003, and 2014, there was a slight increase in the intensity of energy, but in this study, this does not mean that technical change cannot reduce the energy intensity of the construction industry. The construction industry is closely related to the development of China’s national economy, real estate, and other sectors. There are many times where micro-control of real estate in China’s economic development process has occurred, and the development of the construction industry has also changed several times. For this reason, the energy intensity of the construction industry may rise in some years, resulting in negative energy savings.
On the whole, compared with the developed countries, the rebound effect of China’s construction industry is slightly higher, but the overall energy rebound effect is less than 100%. This indicates that the technical change of China’s construction industry promotes the increase of energy efficiency, and the energy rebound effect presents a circuitously downward trend. The overall technical change of the construction industry played a significant role in energy saving and low-carbon development.
6. Conclusions
Based on the discussions above, we can draw some conclusions as follows. First of all, the results verified that the energy rebound effect indeed exists in China’s construction industry. The average energy rebound effect of China’s construction industry was 59.5% in the period 1990–2014, and a fluctuating declining trend of the energy rebound effect can be obtained during the study period, indicating that approximately half of the potential energy saving by technical change is achieved. The technical change of the construction industry played a significant role in energy conservation. In addition, due to political and economic turbulence, energy efficiency was not enhanced in some special years, presenting an ineffective energy-saving state.
In addition, the results of ridge regression indicated that the development of China’s construction industry largely depends on labor input. This revealed that the investment of technical change in the construction industry is insufficient. Only by increasing investment in technical change, speeding up technical change, promoting new technologies, new processes, and new materials in the industry, can the construction industry reduce carbon emissions and energy consumption.
Finally, it is obvious that the energy rebound effect exists in China’s construction industry. This means that policies, especially a reasonable control on the energy consumption adjustment, should be taken as supplementary to technical change. The related research demonstrates that it is low energy pricing that leads to the high-energy consumption of China [
30,
31,
32]. The lower energy prices thanks to government intervention cannot truly reflect the supply–demand relation of the energy market and the external environment brought by energy use. On the one hand, it reduces the driving force for enterprises’ energy conservation; on the other hand, it also reduces the alternative effect of the other input factors on energy, resulting from changes to the relative price of energy. Therefore, China should not only promote technical change, but should also have appropriate energy prices, taxation, and other macro-control means to enable the maximum energy efficiency brought by technical change, and to promote the sustainable development of China’s construction industry.


