
A Novel Hybrid Approach Based on Instance Based Learning Classifier and Rotation Forest Ensemble for Spatial Prediction of Rainfall-Induced Shallow Landslides using GIS

 ,
,
Abstract
:
1. Introduction
2. Study Area and Data
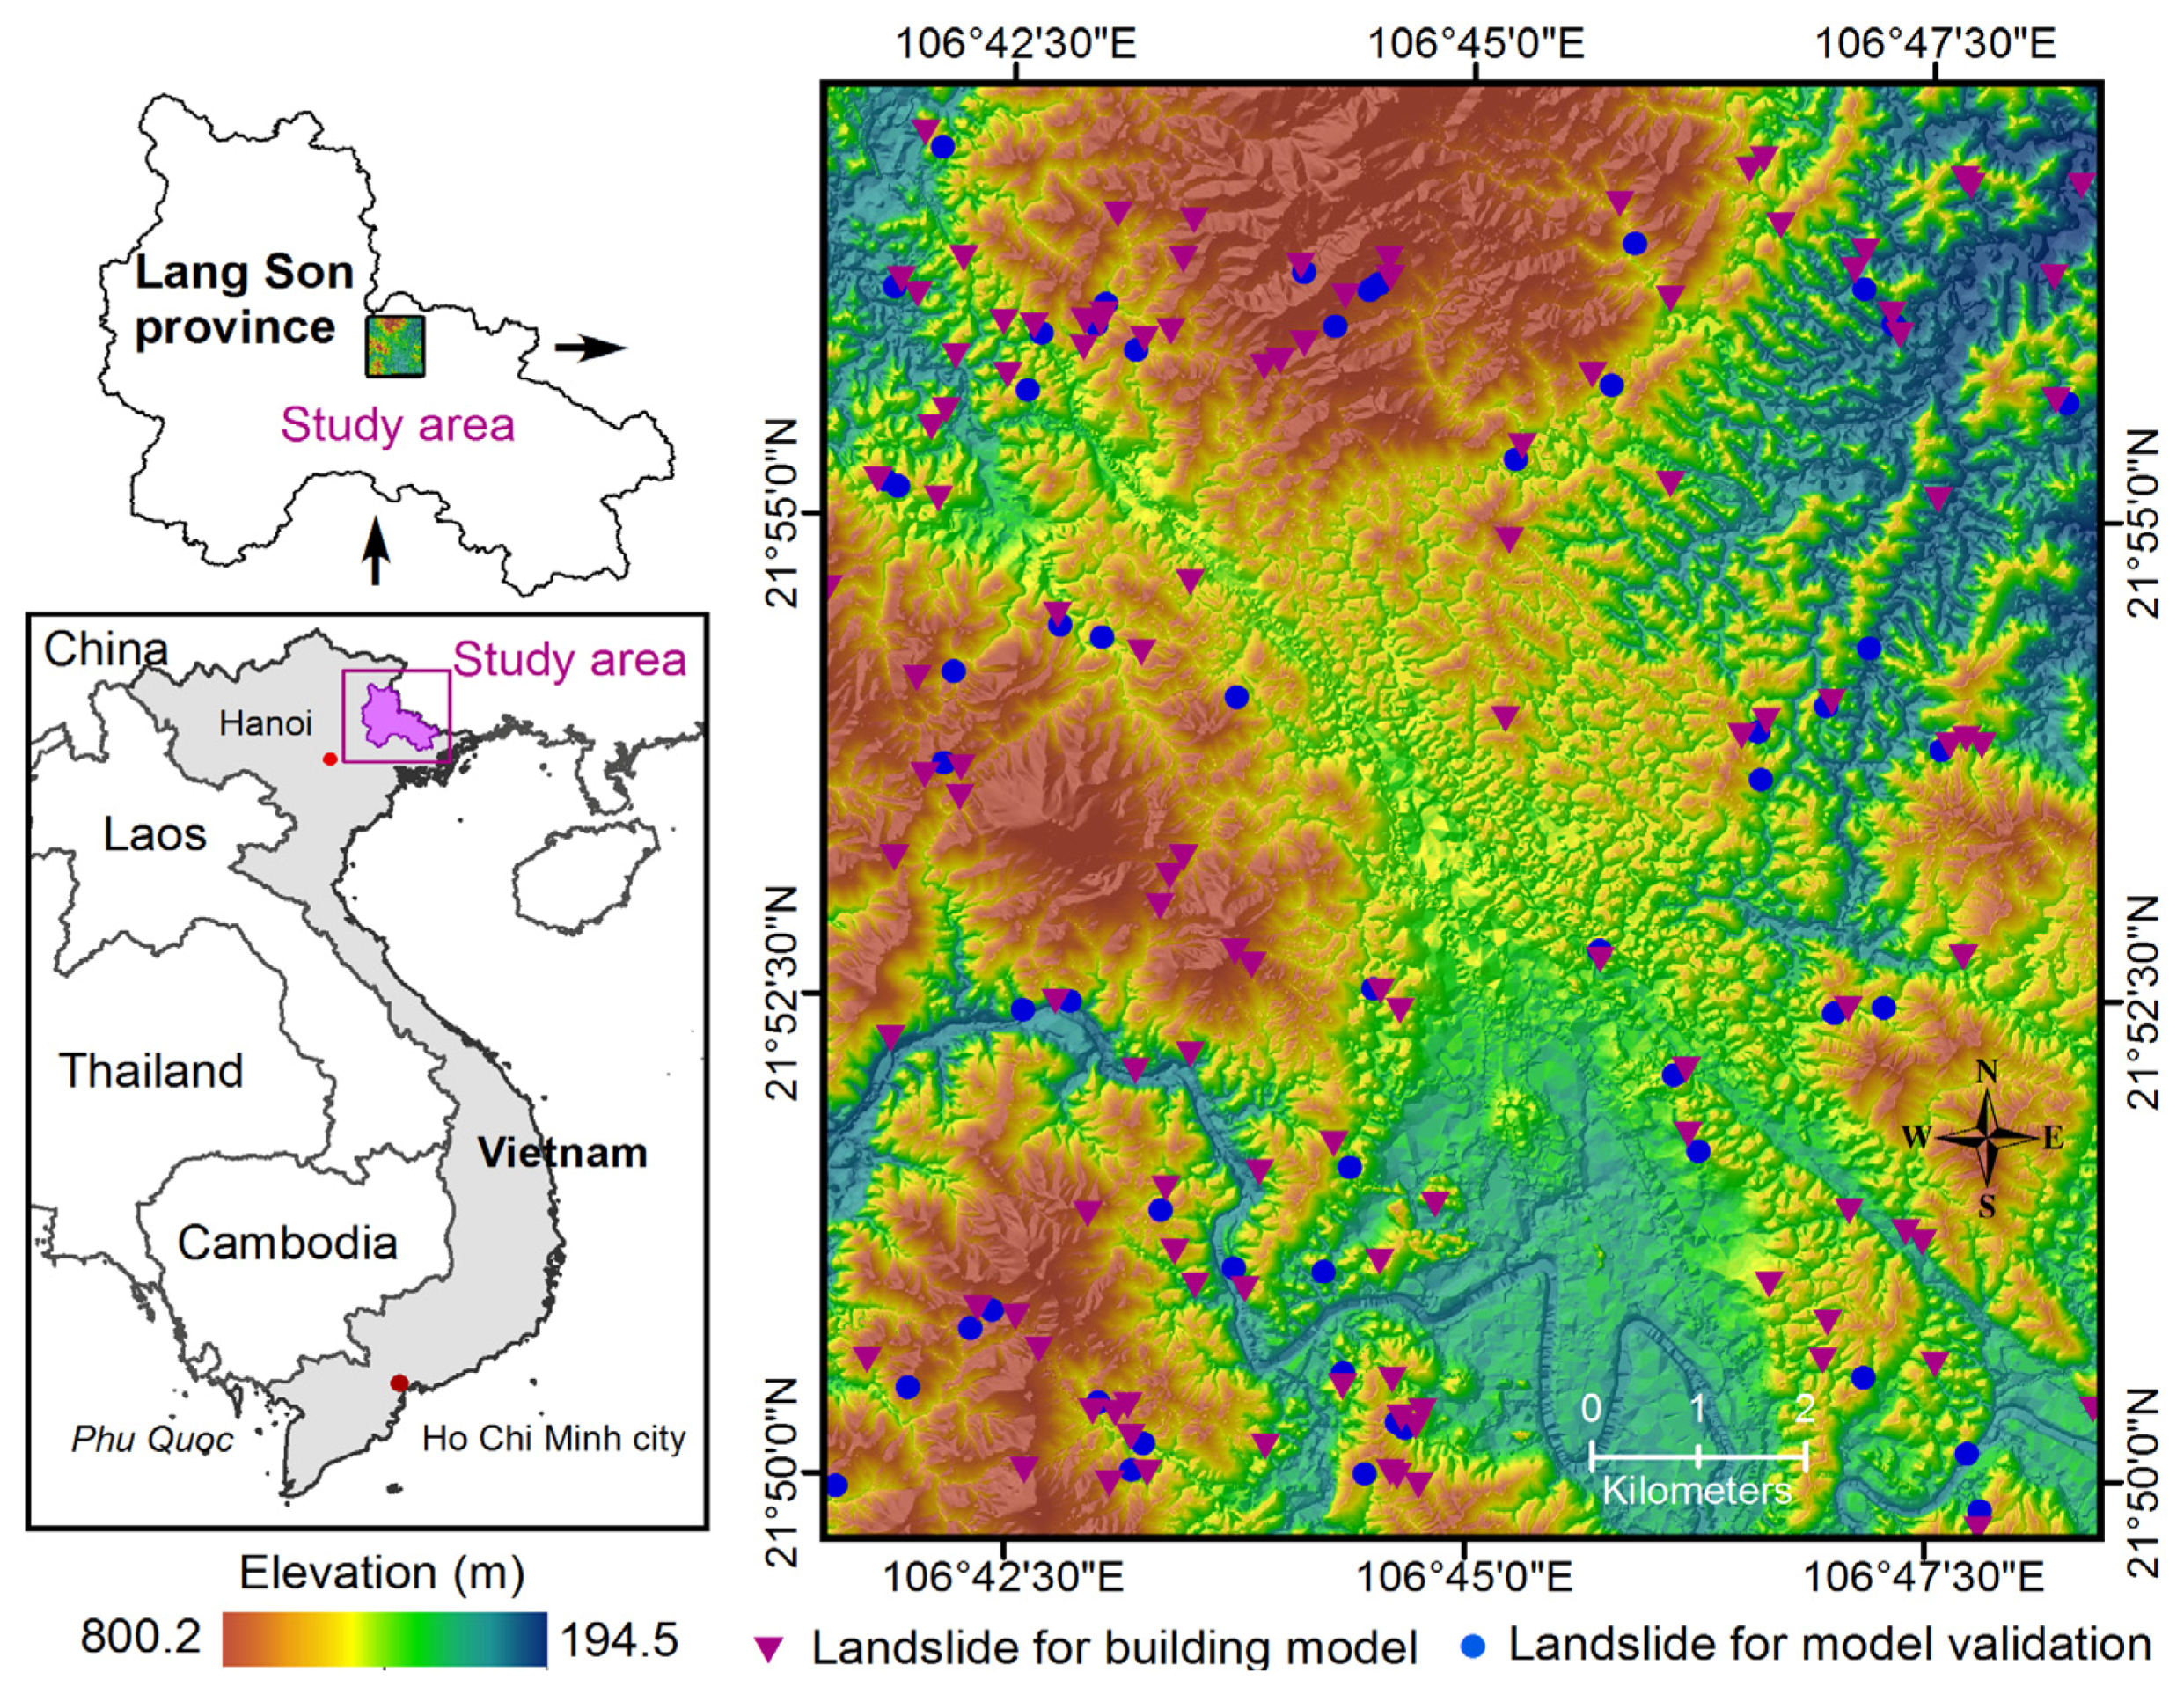
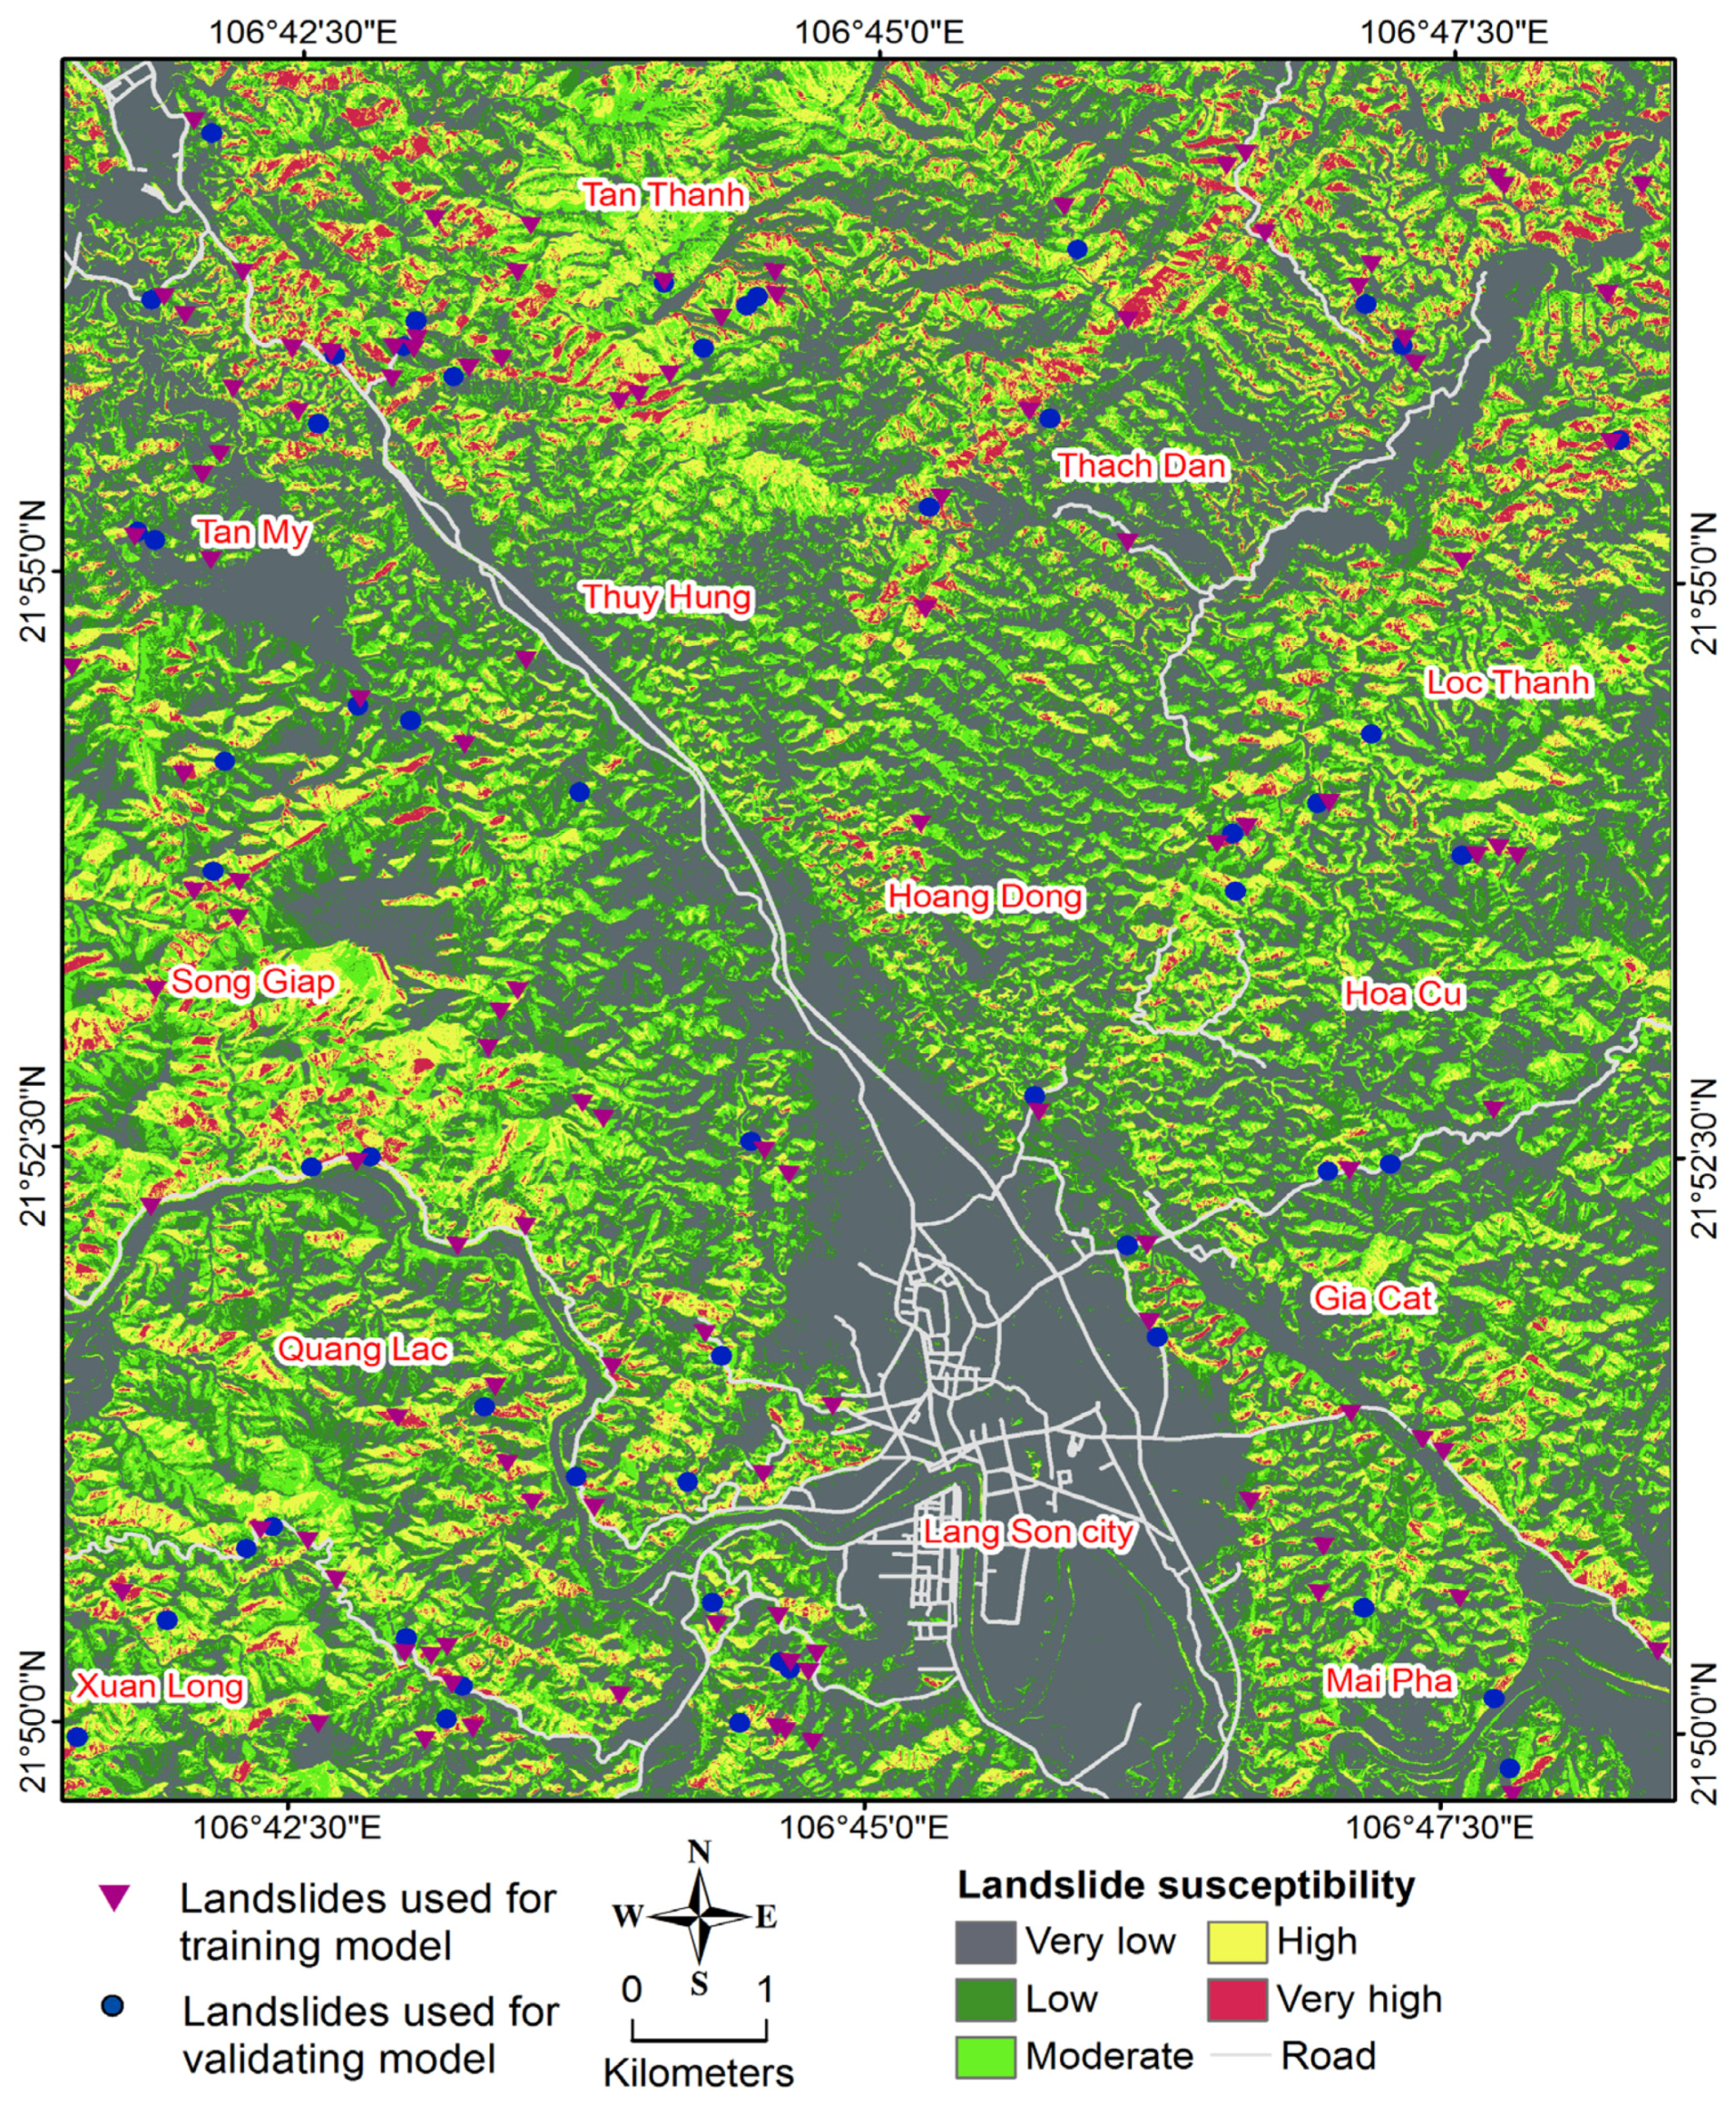
2.1. Study Area
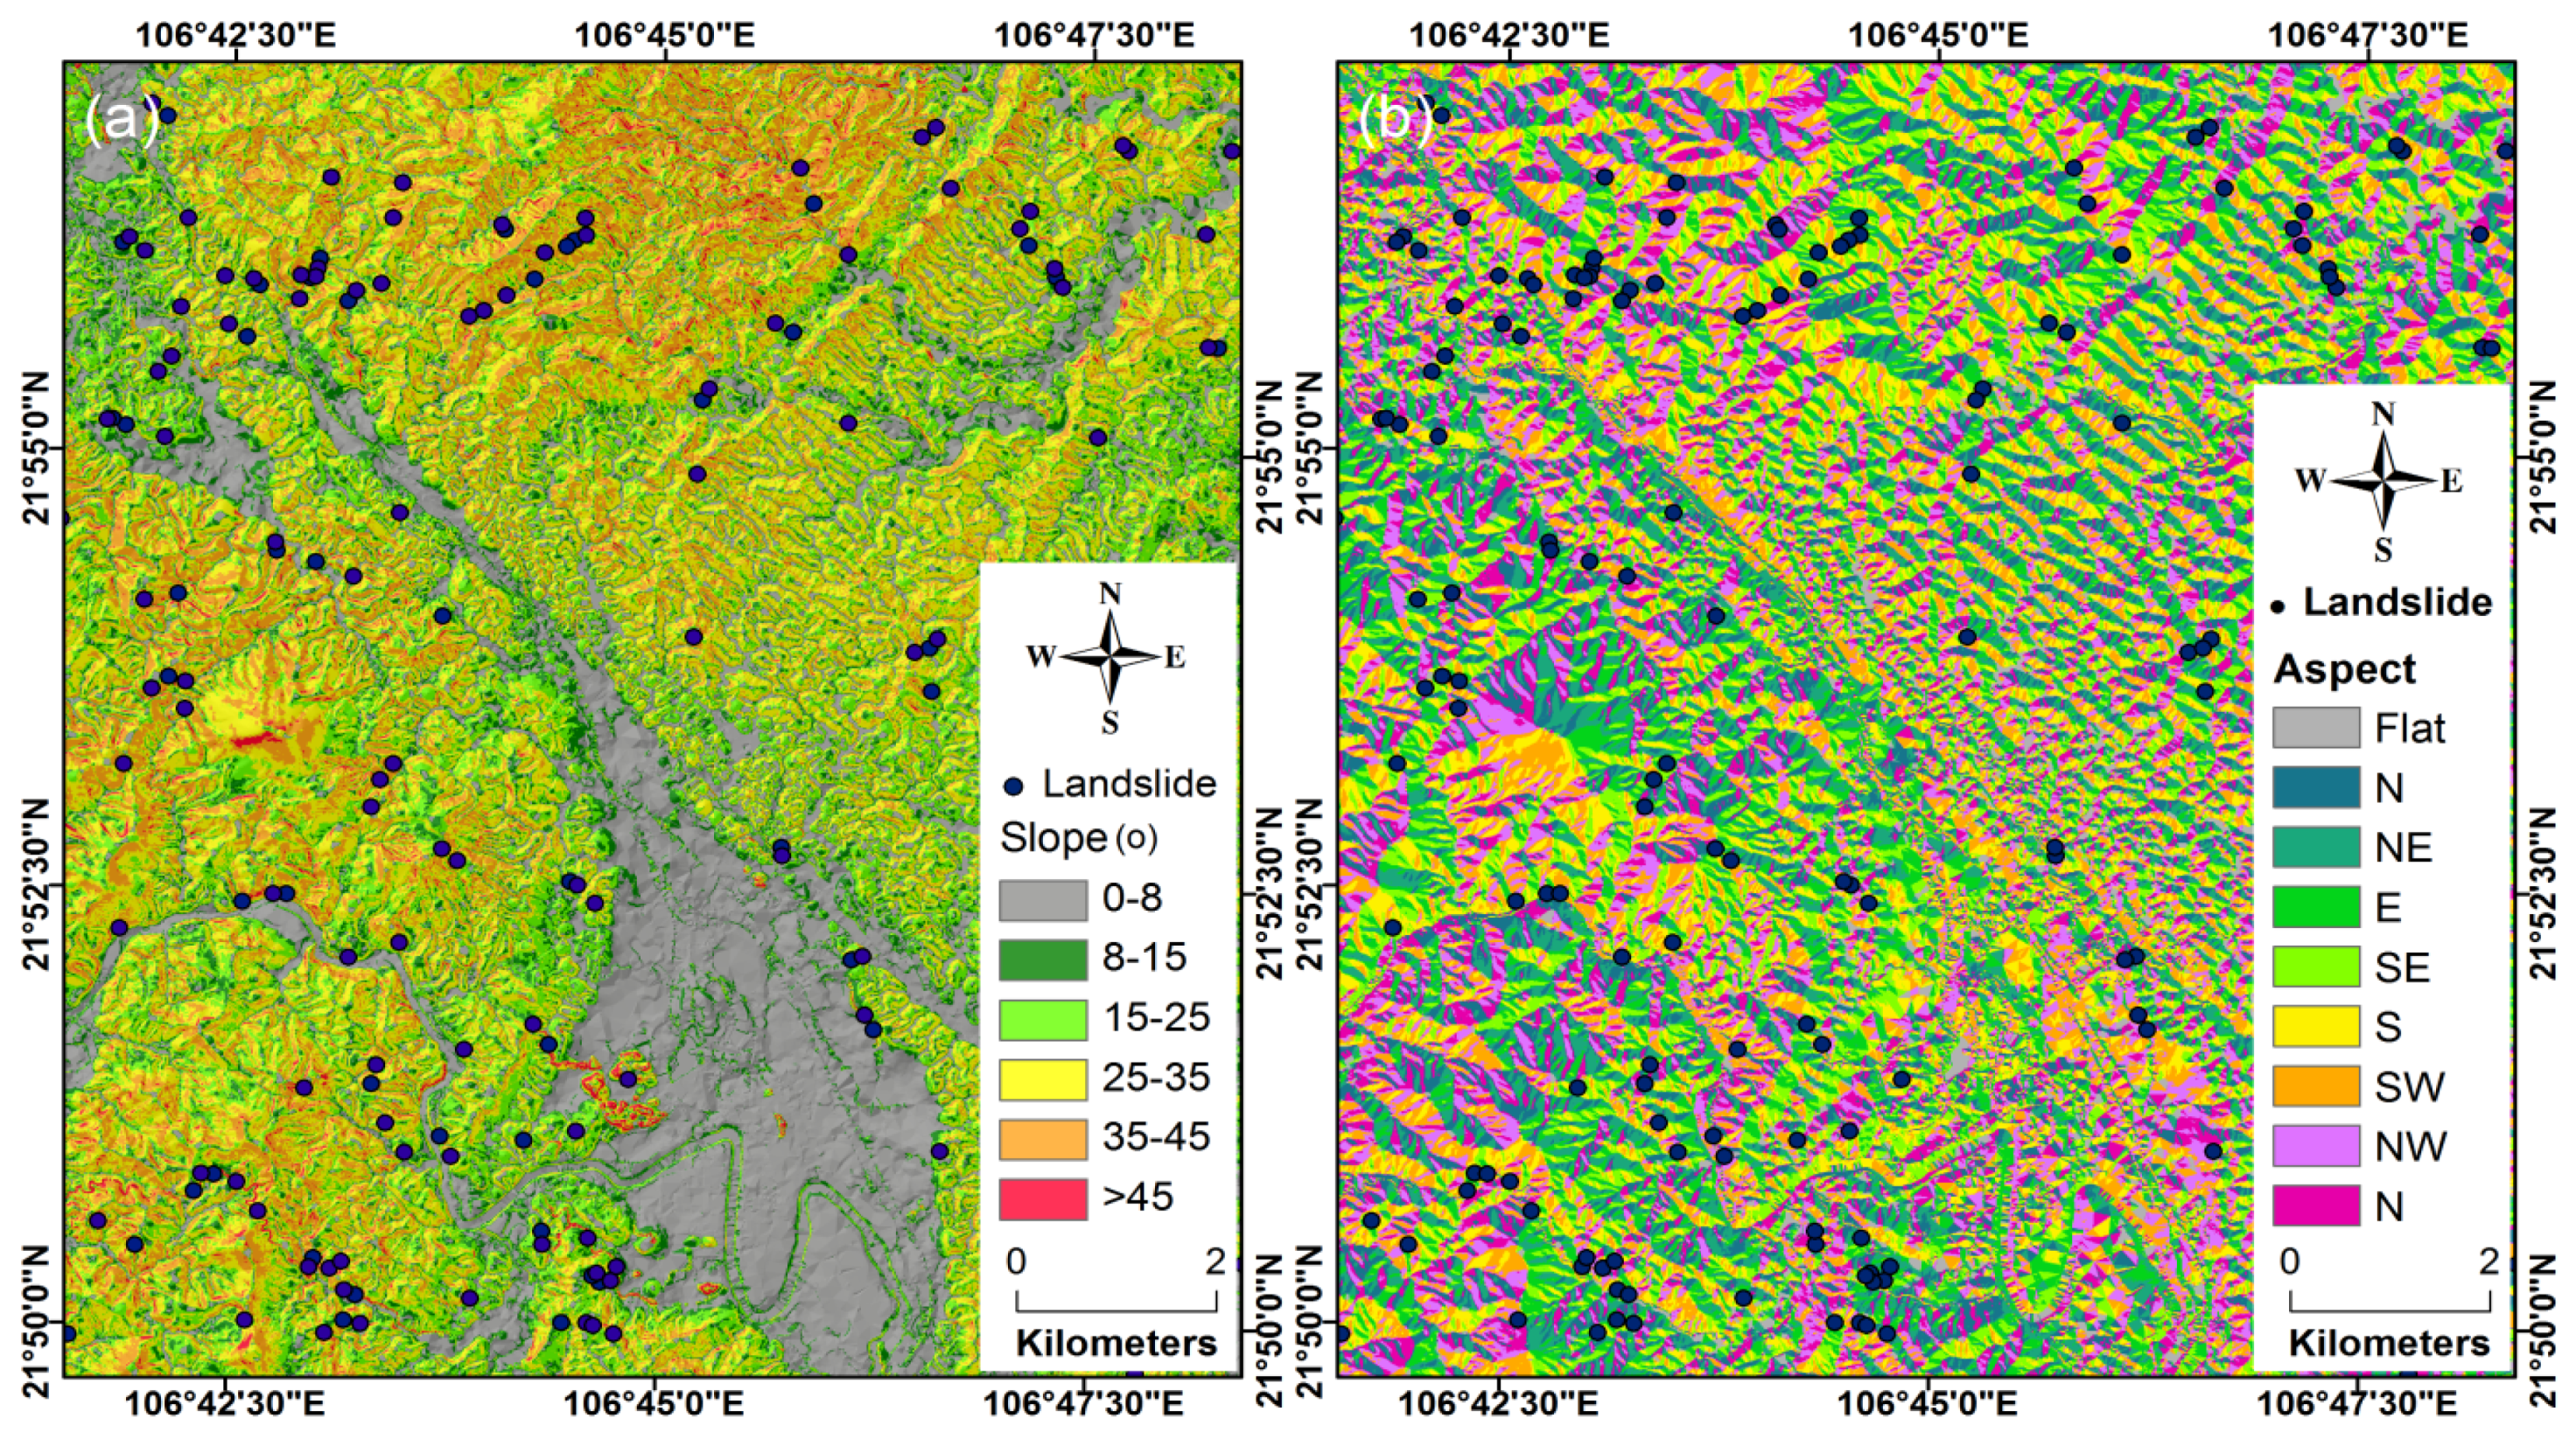
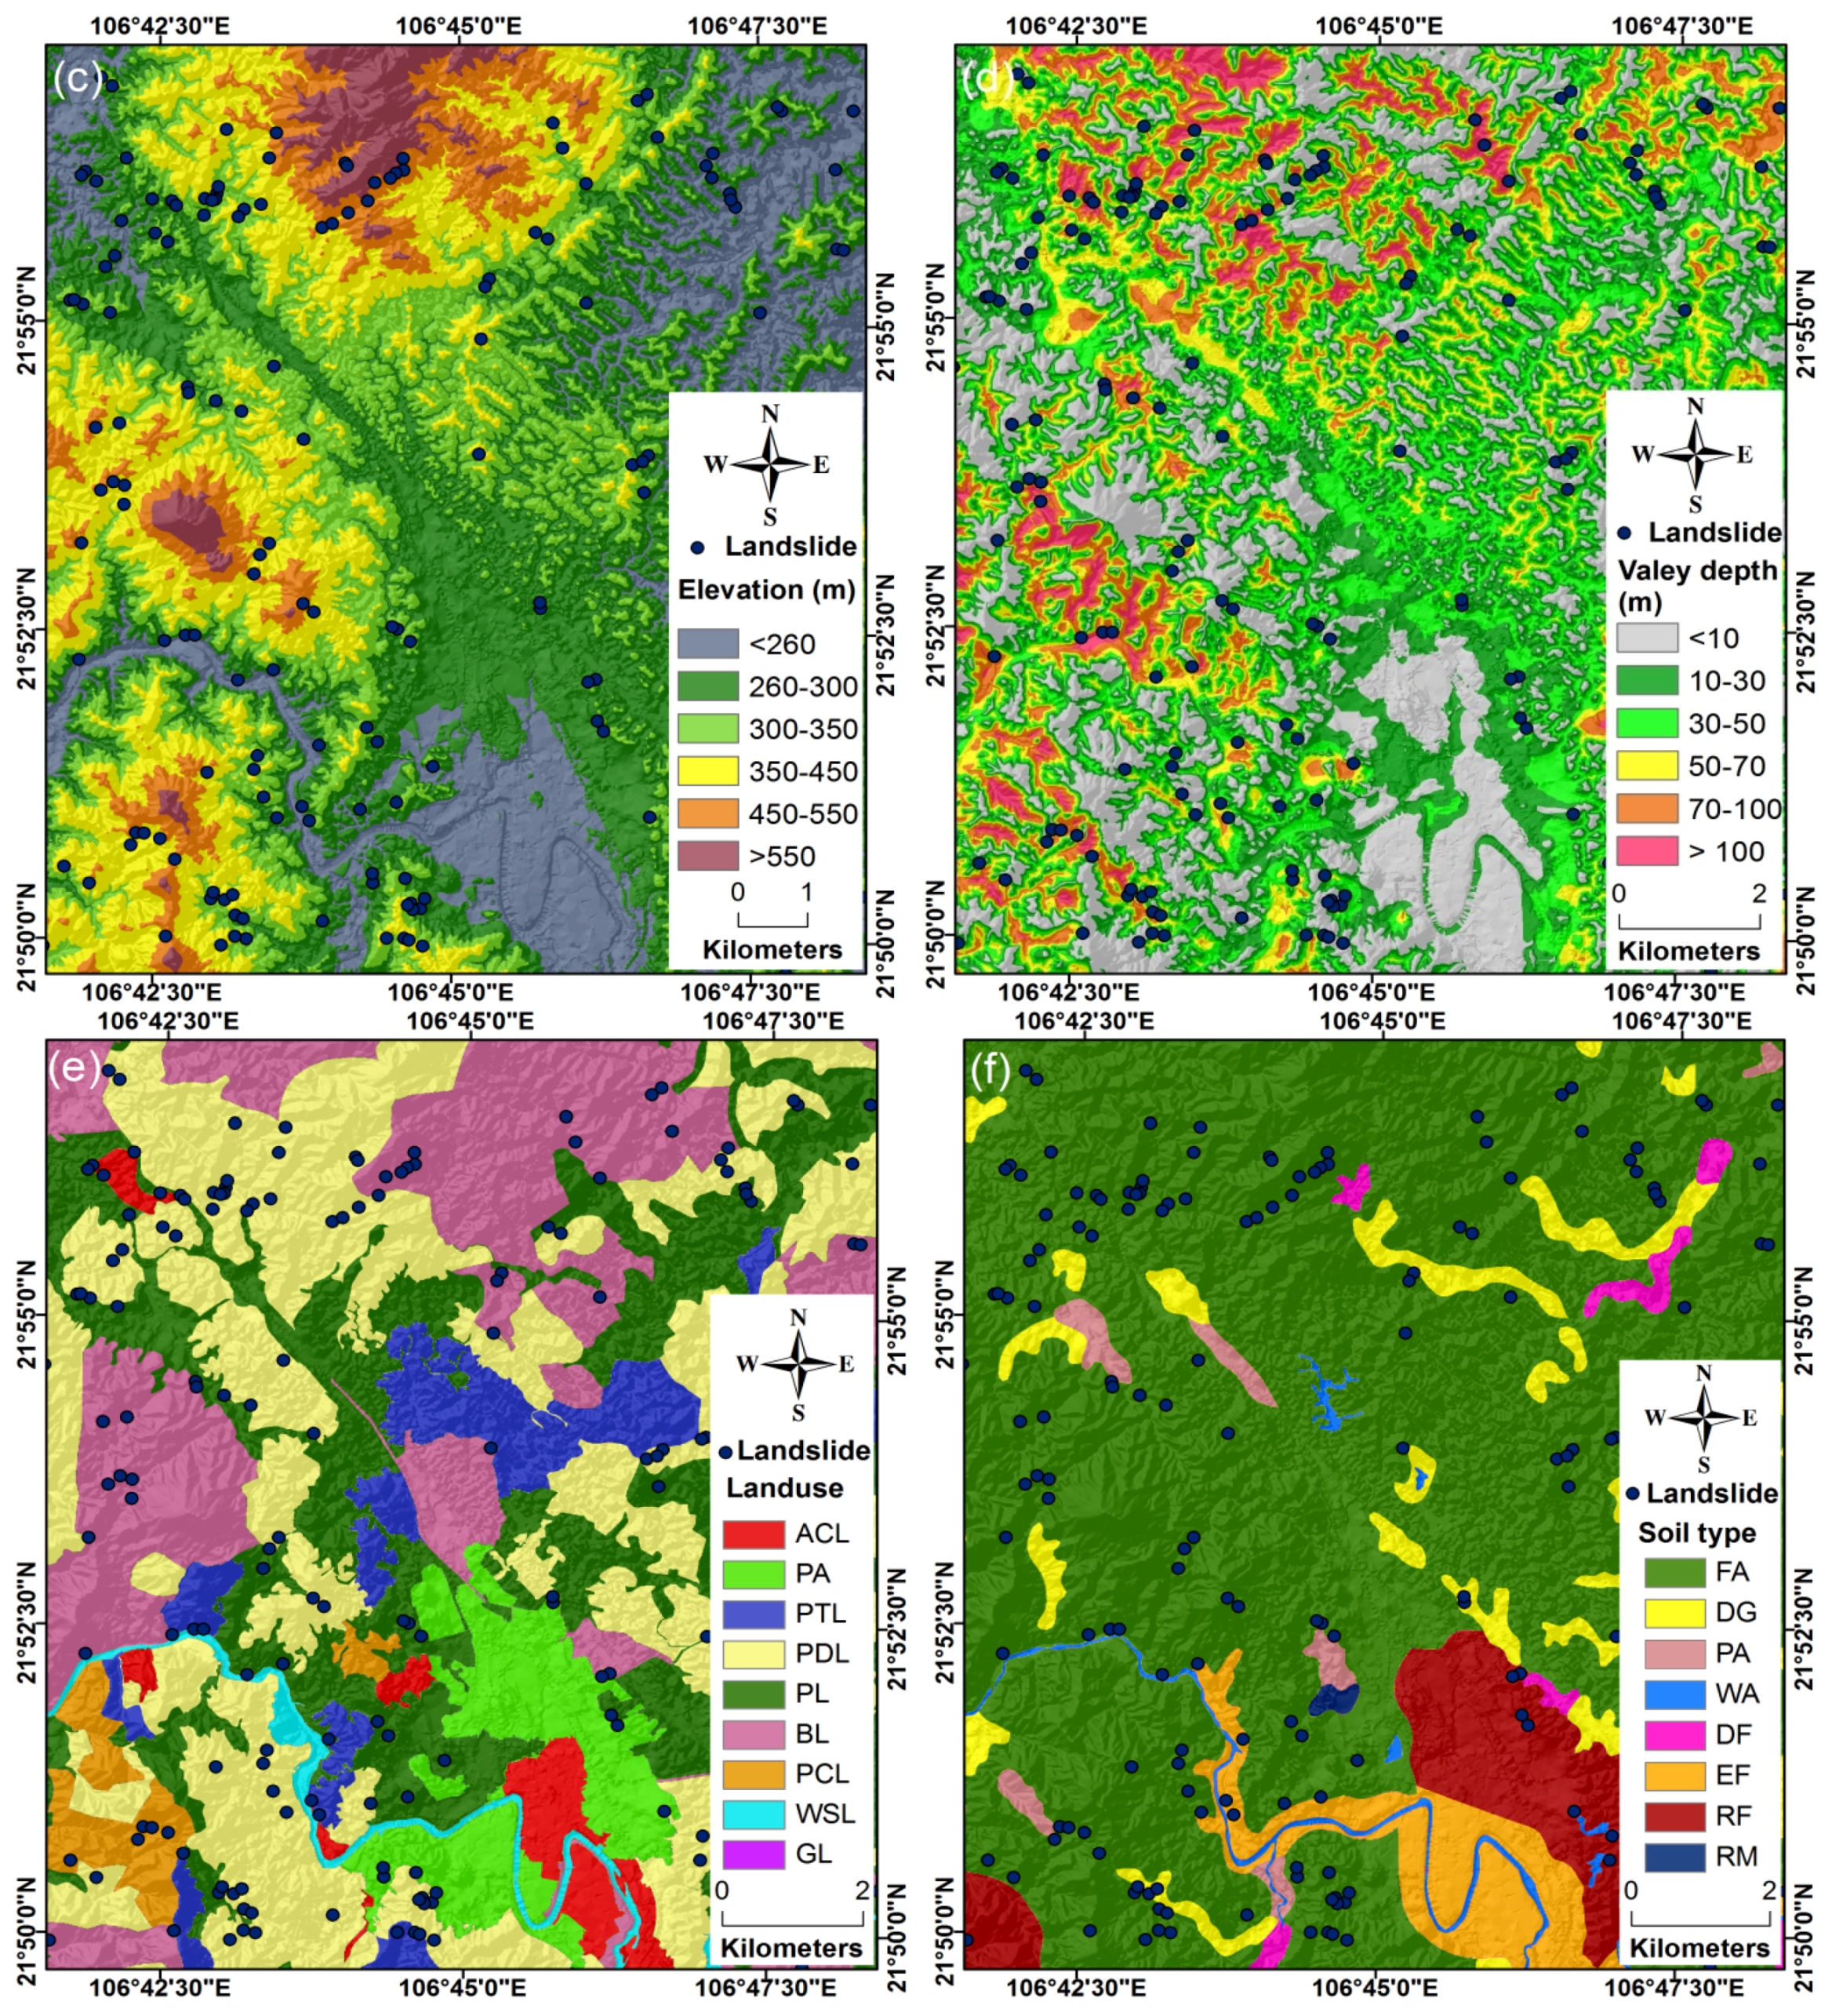
2.2. Data Used
3. Theoretical Background of the Methods Used
3.1. Instance Based Learning Algorithm
3.2. Rotation Forest Ensemble
- (a)
- Split X into K subsets (each subset contains M features): Si, j for j = 1…KGenerate S’i, j by eliminating randomly a subset of classes.Generate new set S”i, j by selecting a bootstrap sample with a size 75% from S’i, j.Perform Principle Component Analysis on S’i, j to obtain coefficients and then store in a matrix Ci, j.Arrange the matrix Ci, j in a rotation matrix Ri:Construct by rearrange the rows of Ri to match the order of the influencing factors in the training dataset.
- (b)
- Construct base classifier Di using the training set .
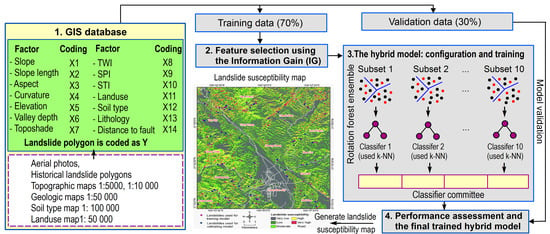
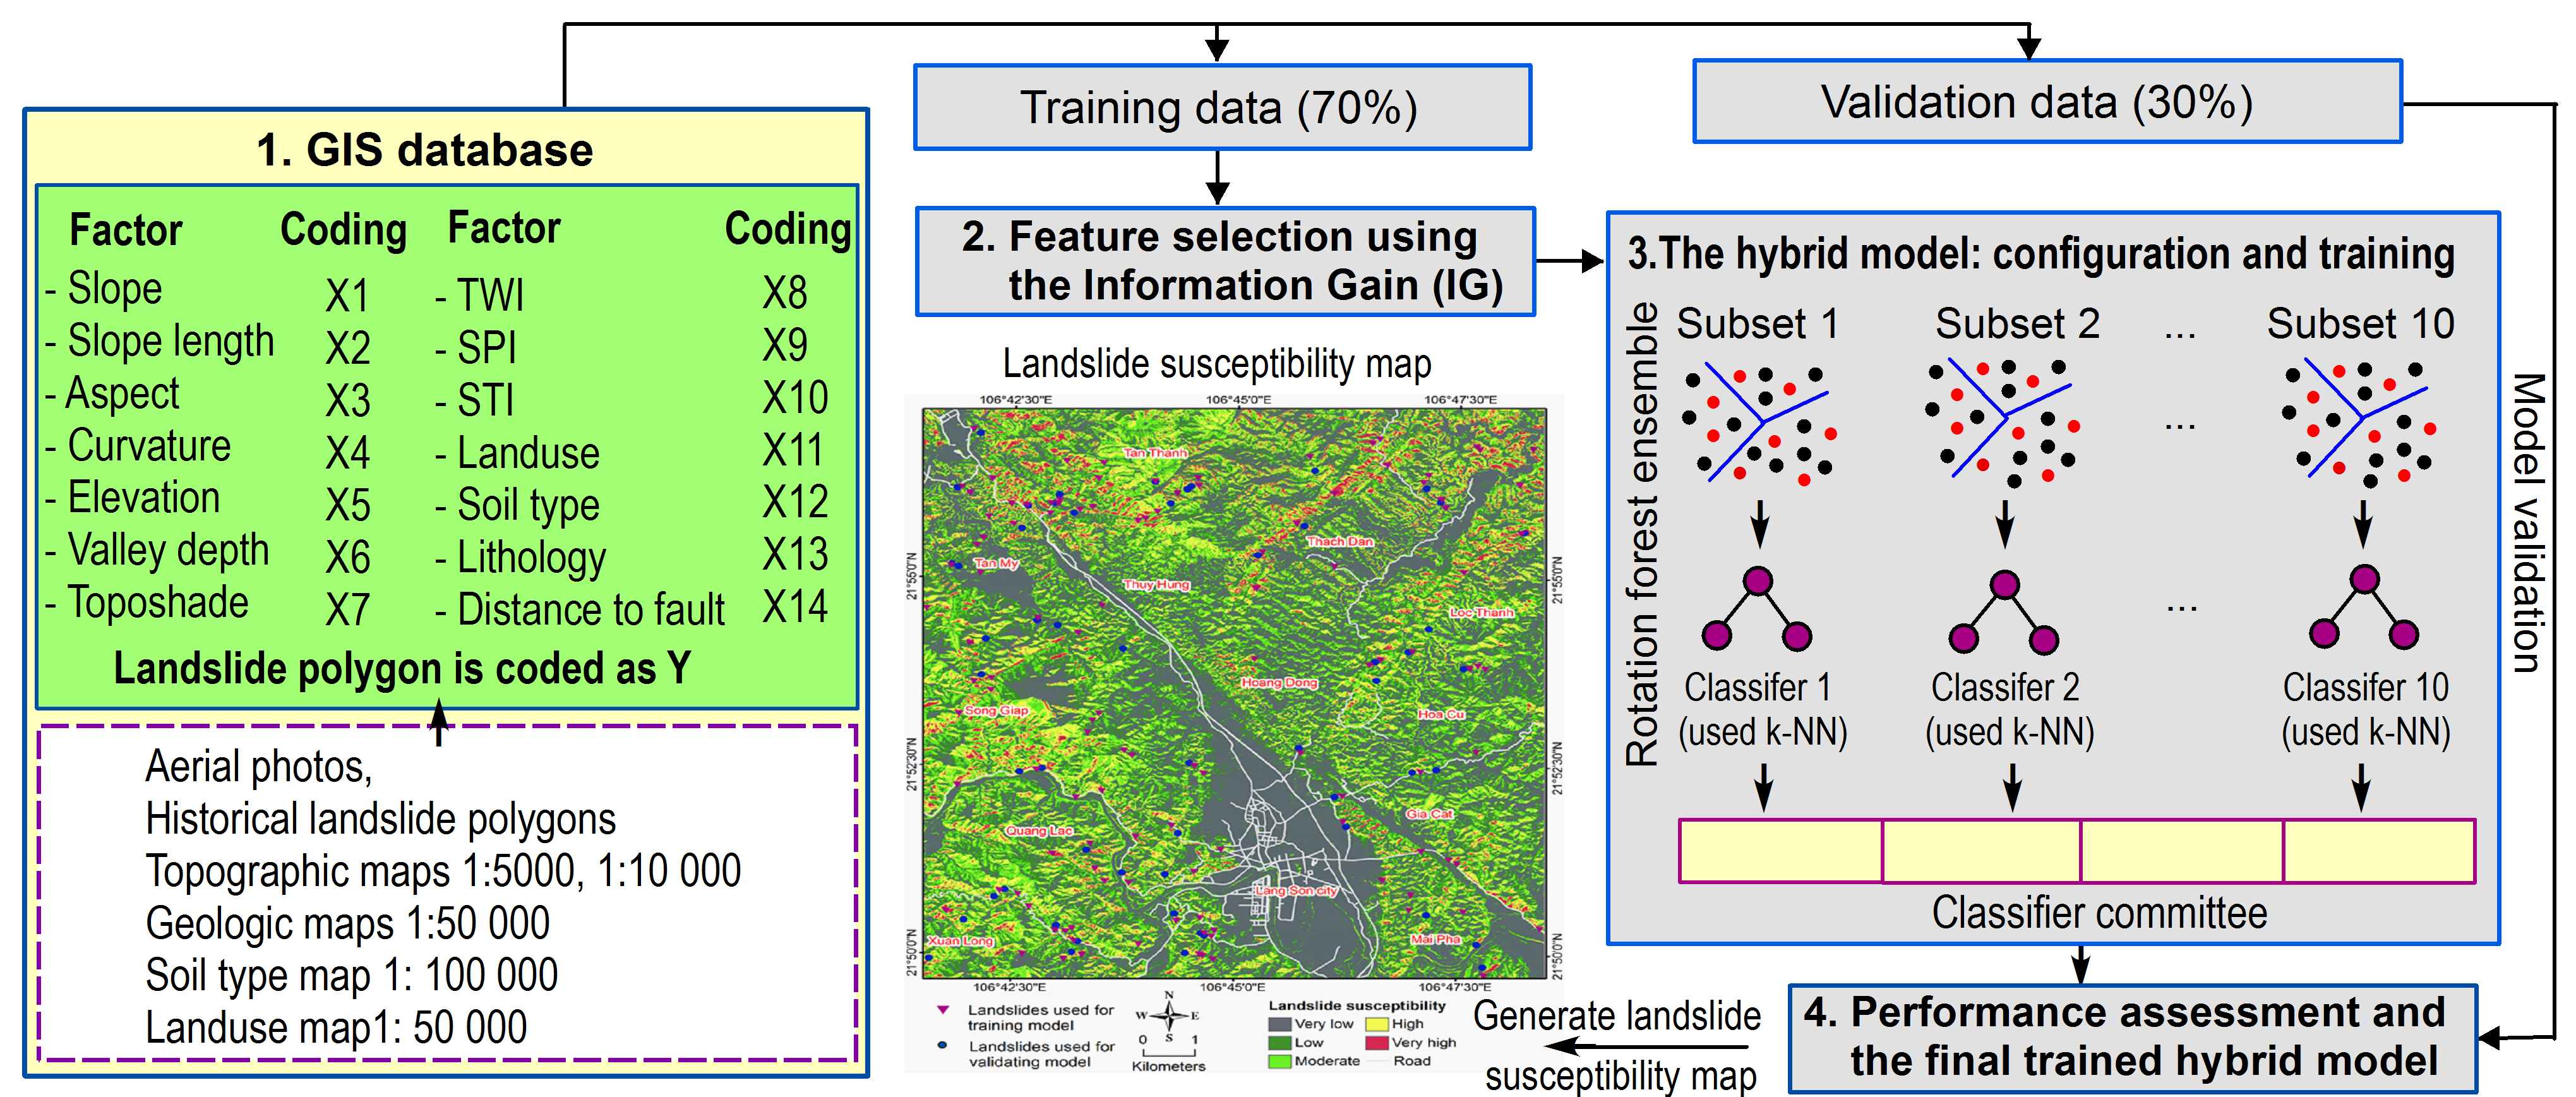
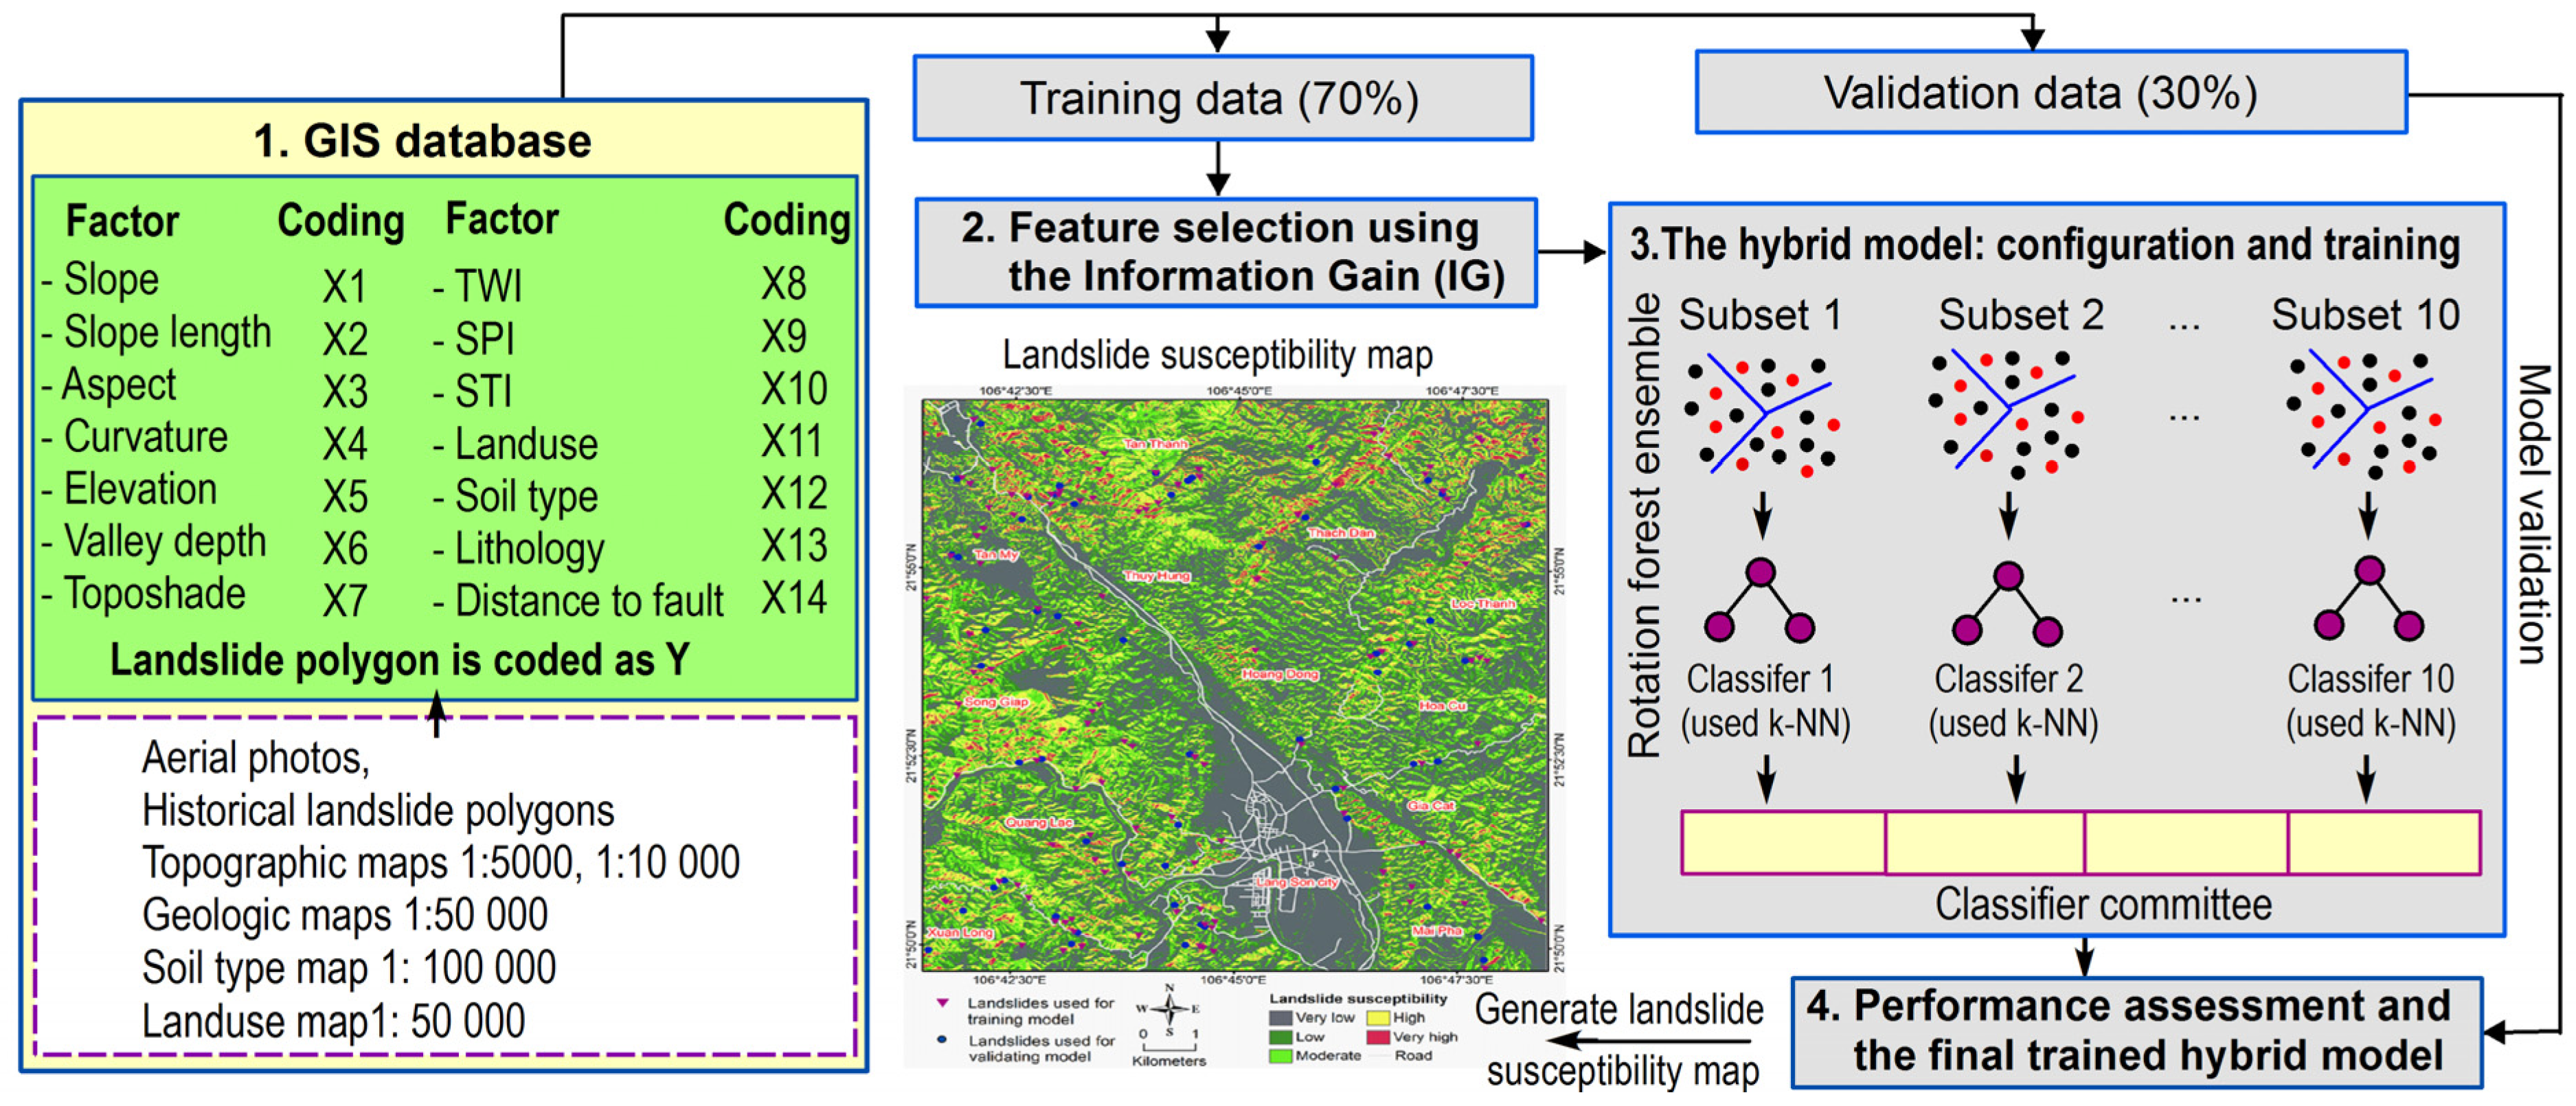
4. Proposed Hybrid Modeling Approach Based on Instance Based Learning Algorithm and Rotation Forest Ensemble for Spatial Prediction of Rainfall-Induced Shallow Landslides
4.1. The GIS Database
4.2. Feature Selection
4.3. The Hybrid Model: Configuration and Training
4.4. Performance Assessment and the Final Trained Hydrid Model
5. Results and Analysis
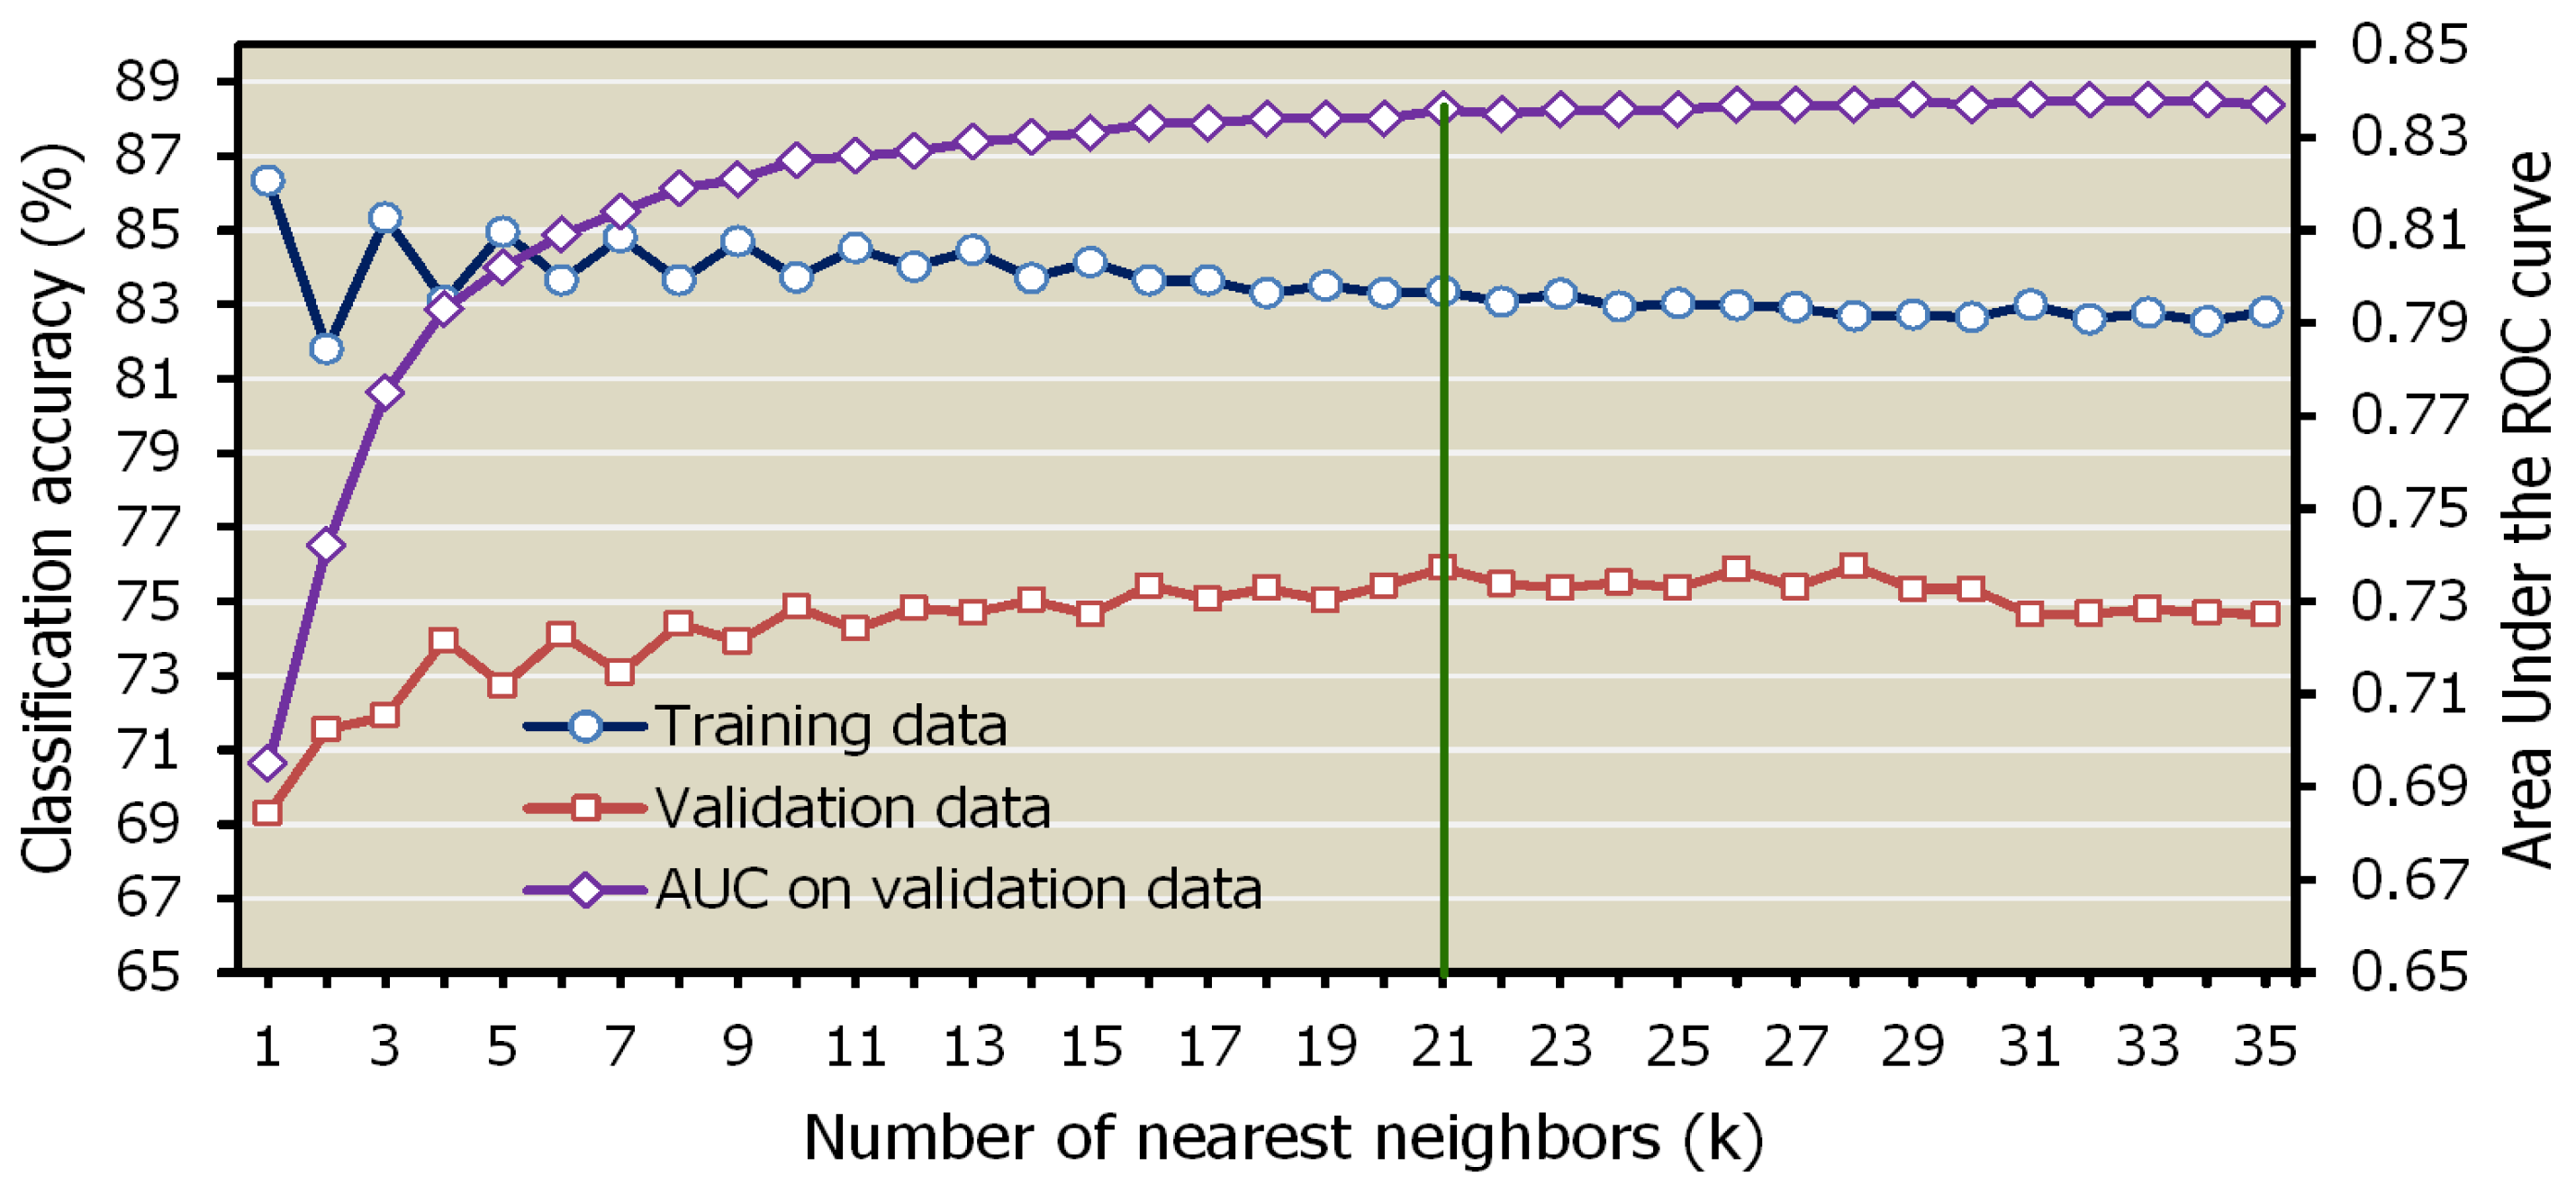
5.1. Determination of the Best Distance Metric and k Value
5.2. Feature Selection and Predictive Ability of Landslide Influencing Factors
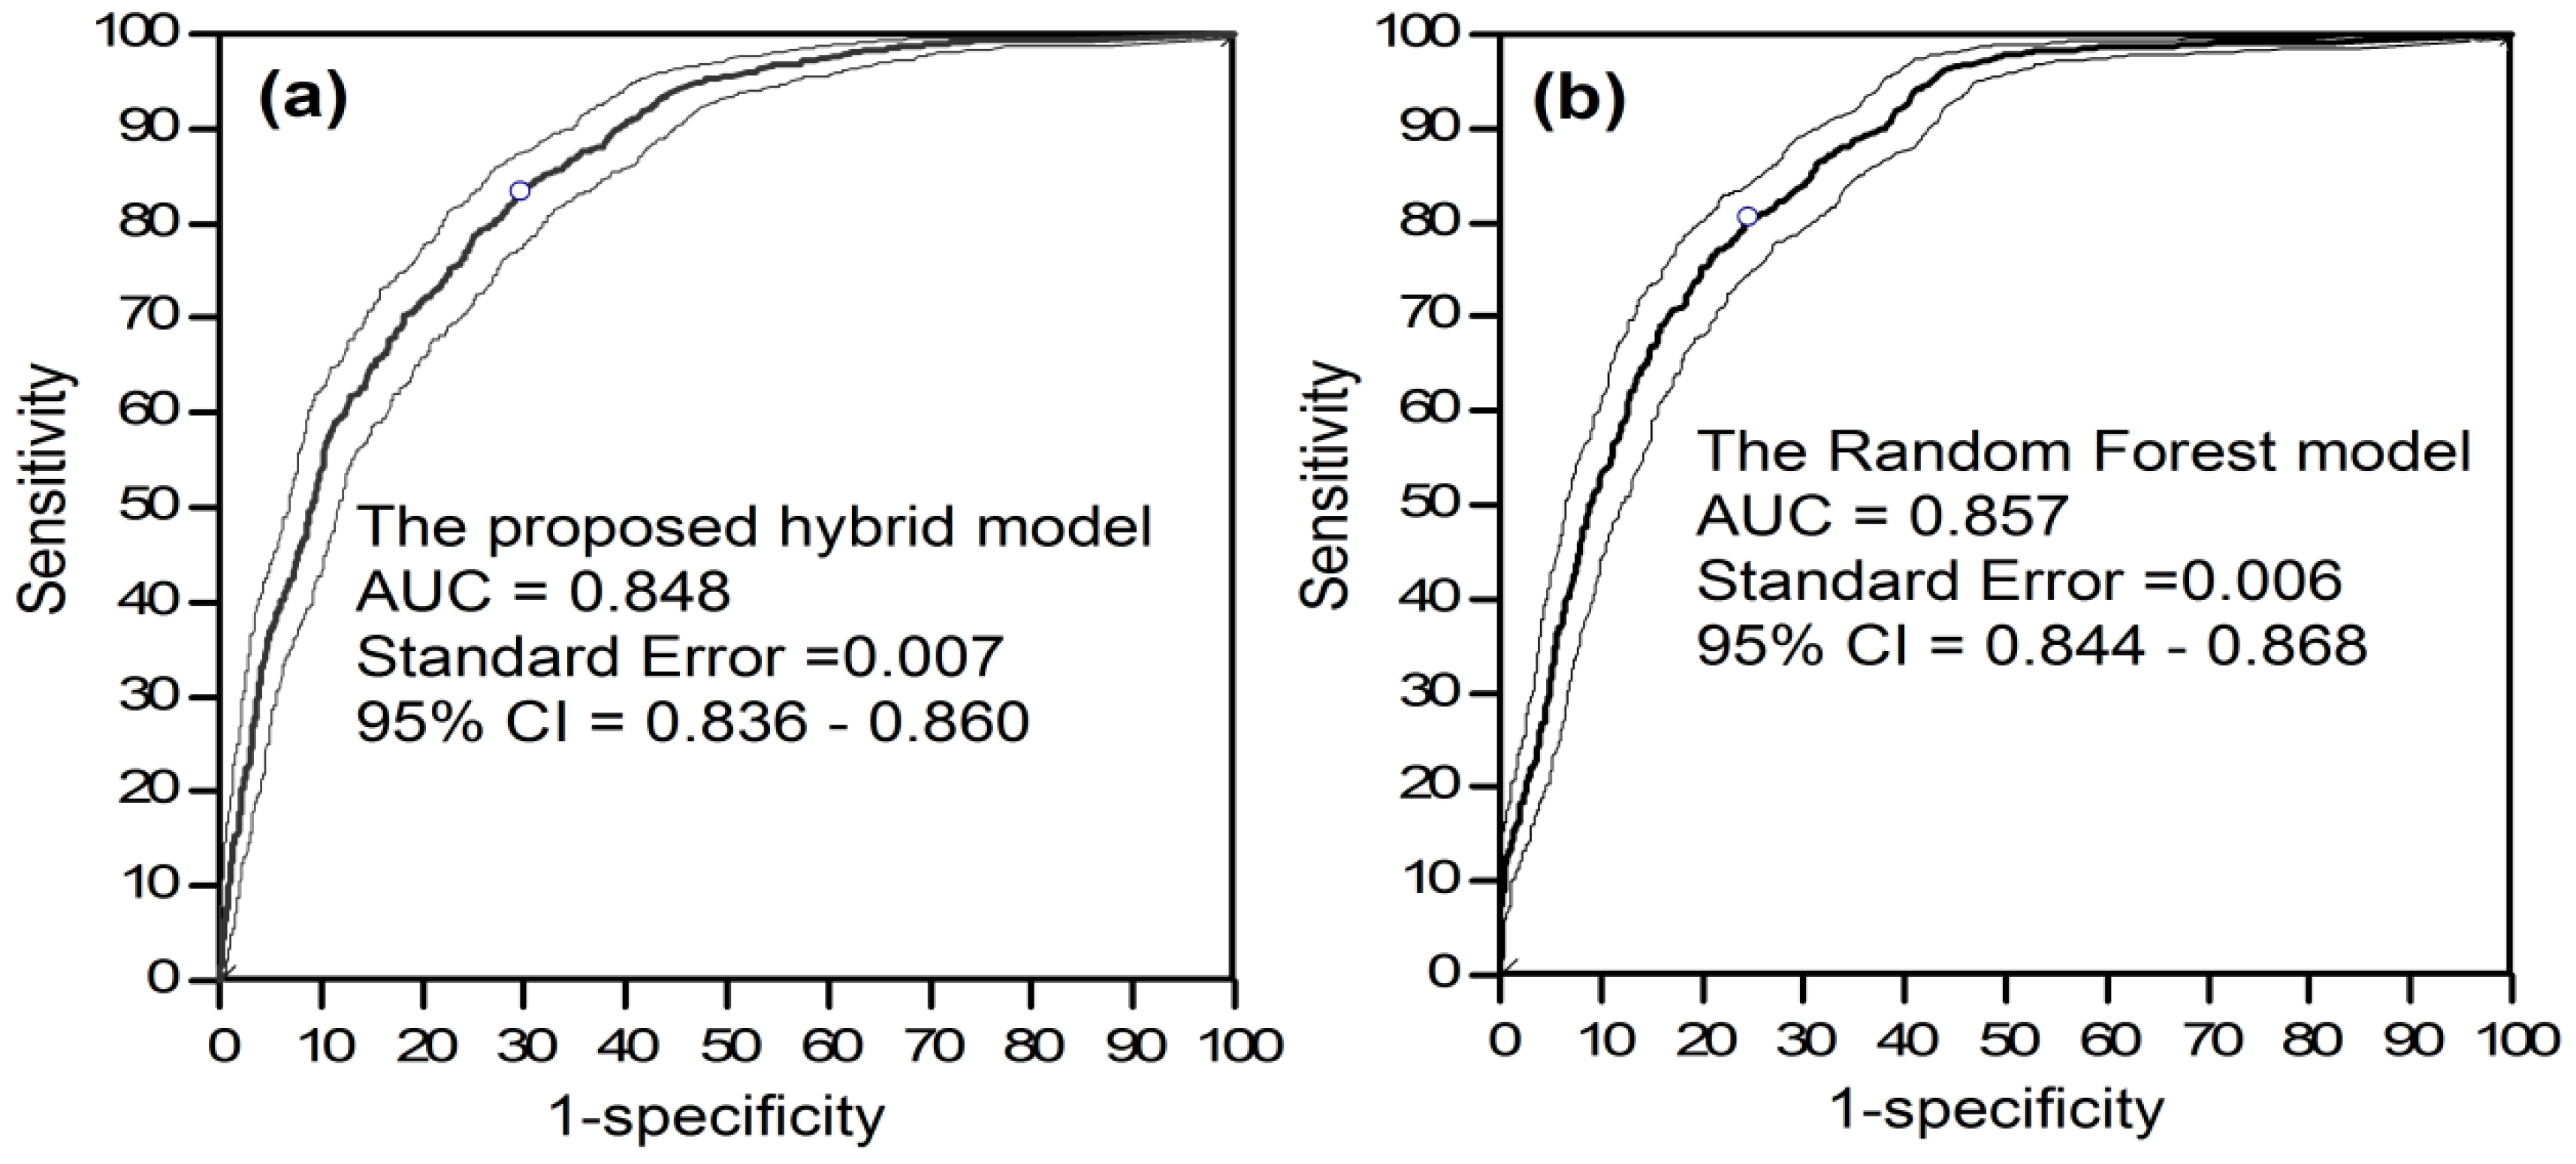
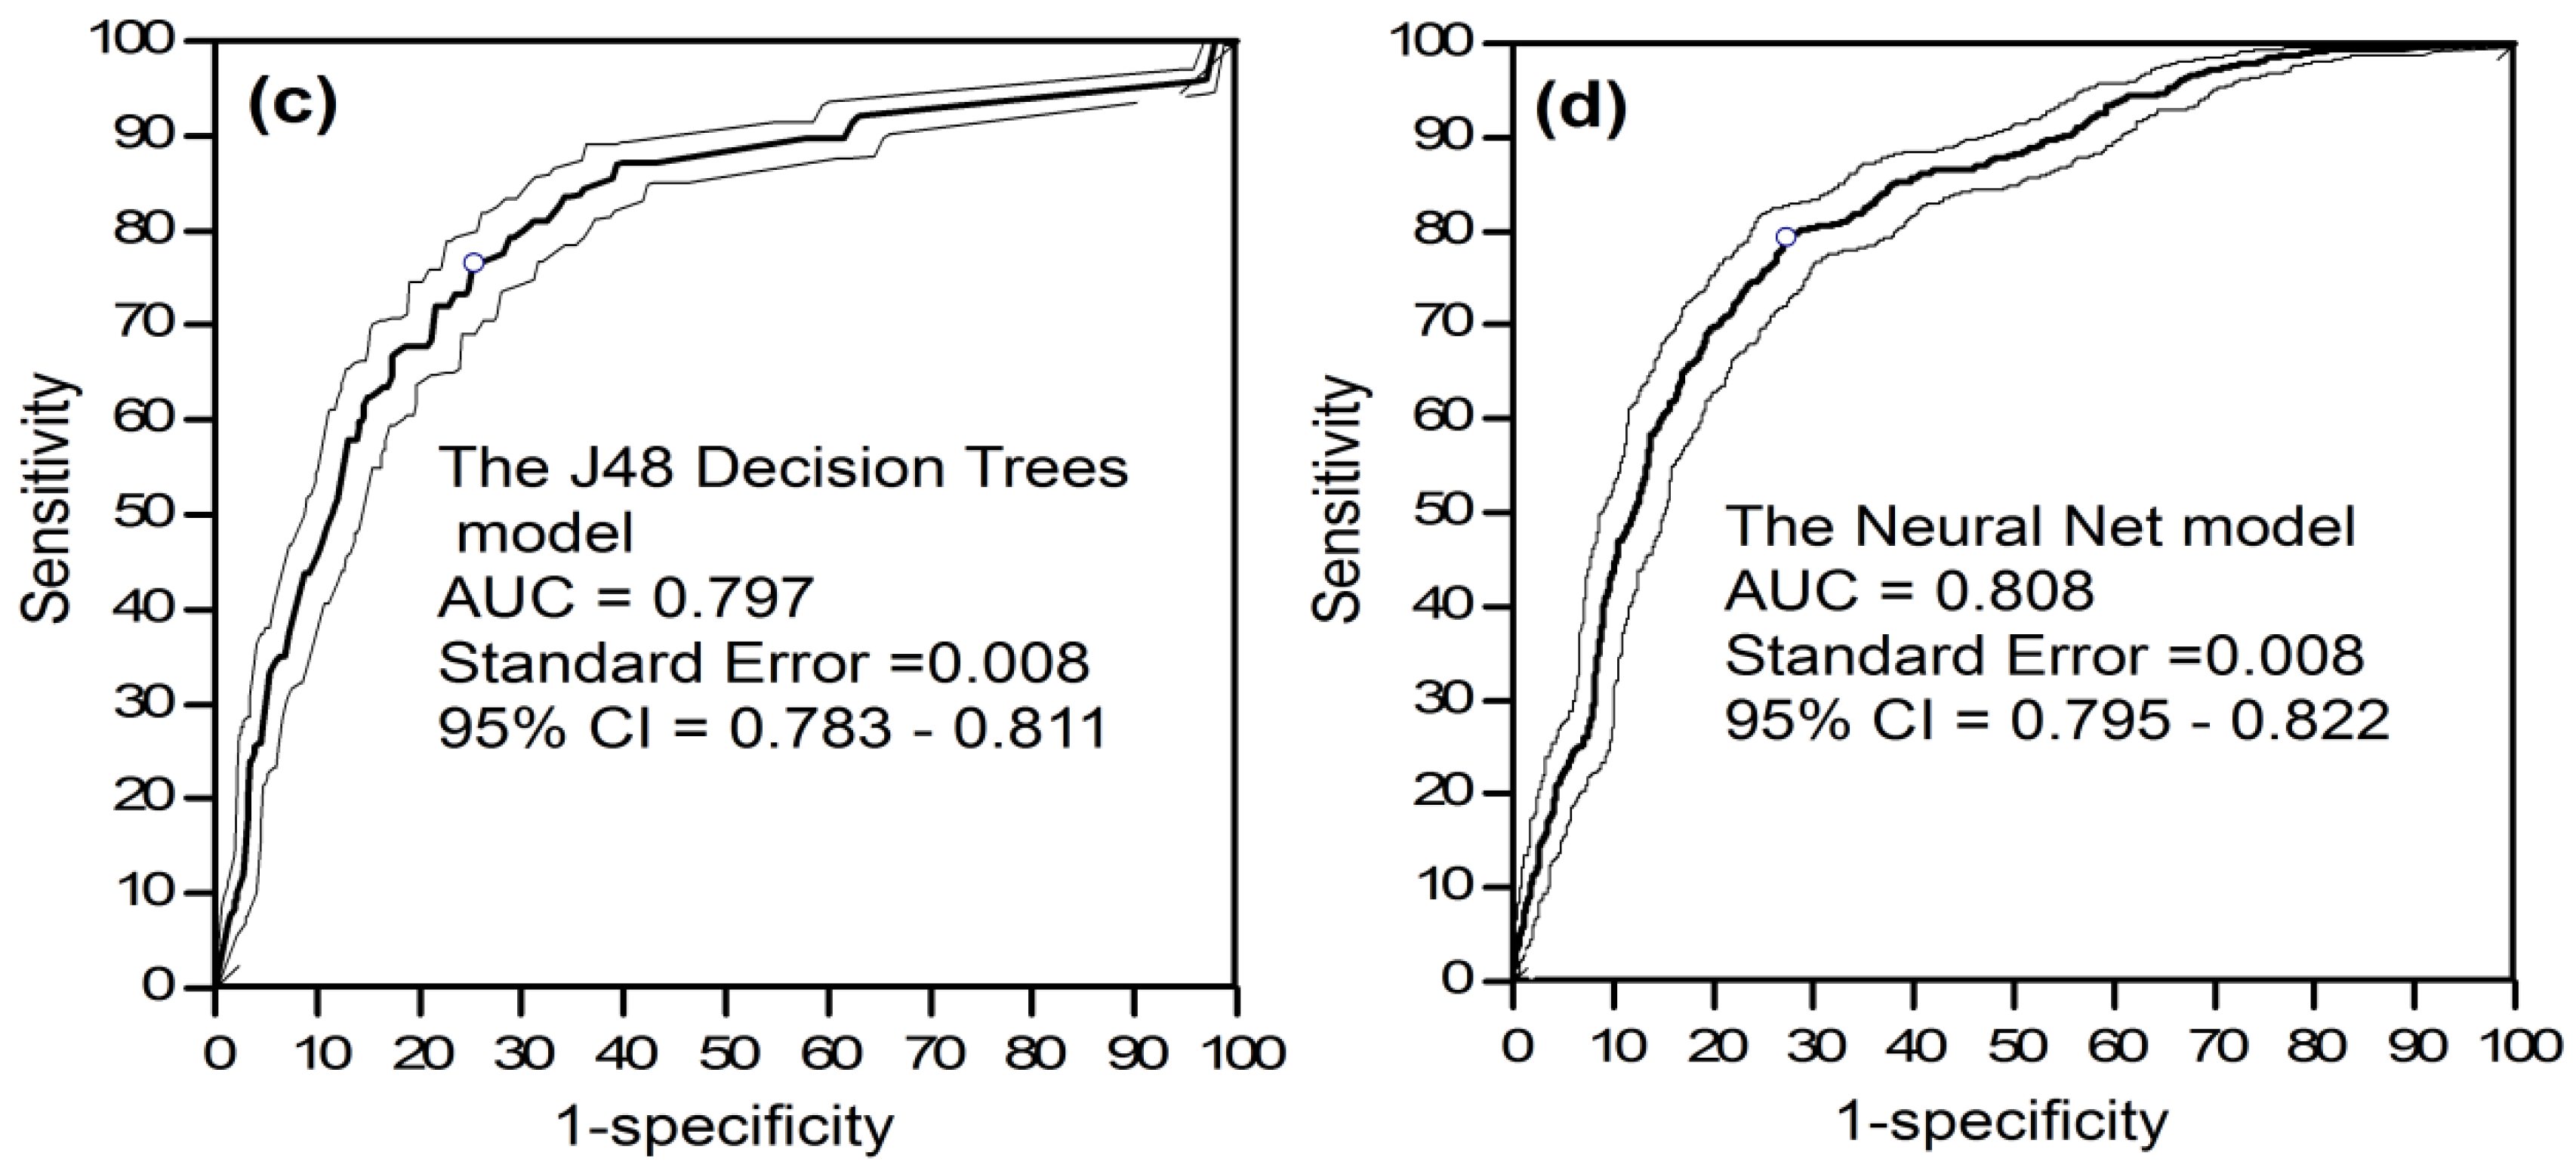
5.3. Model Training and Assessment
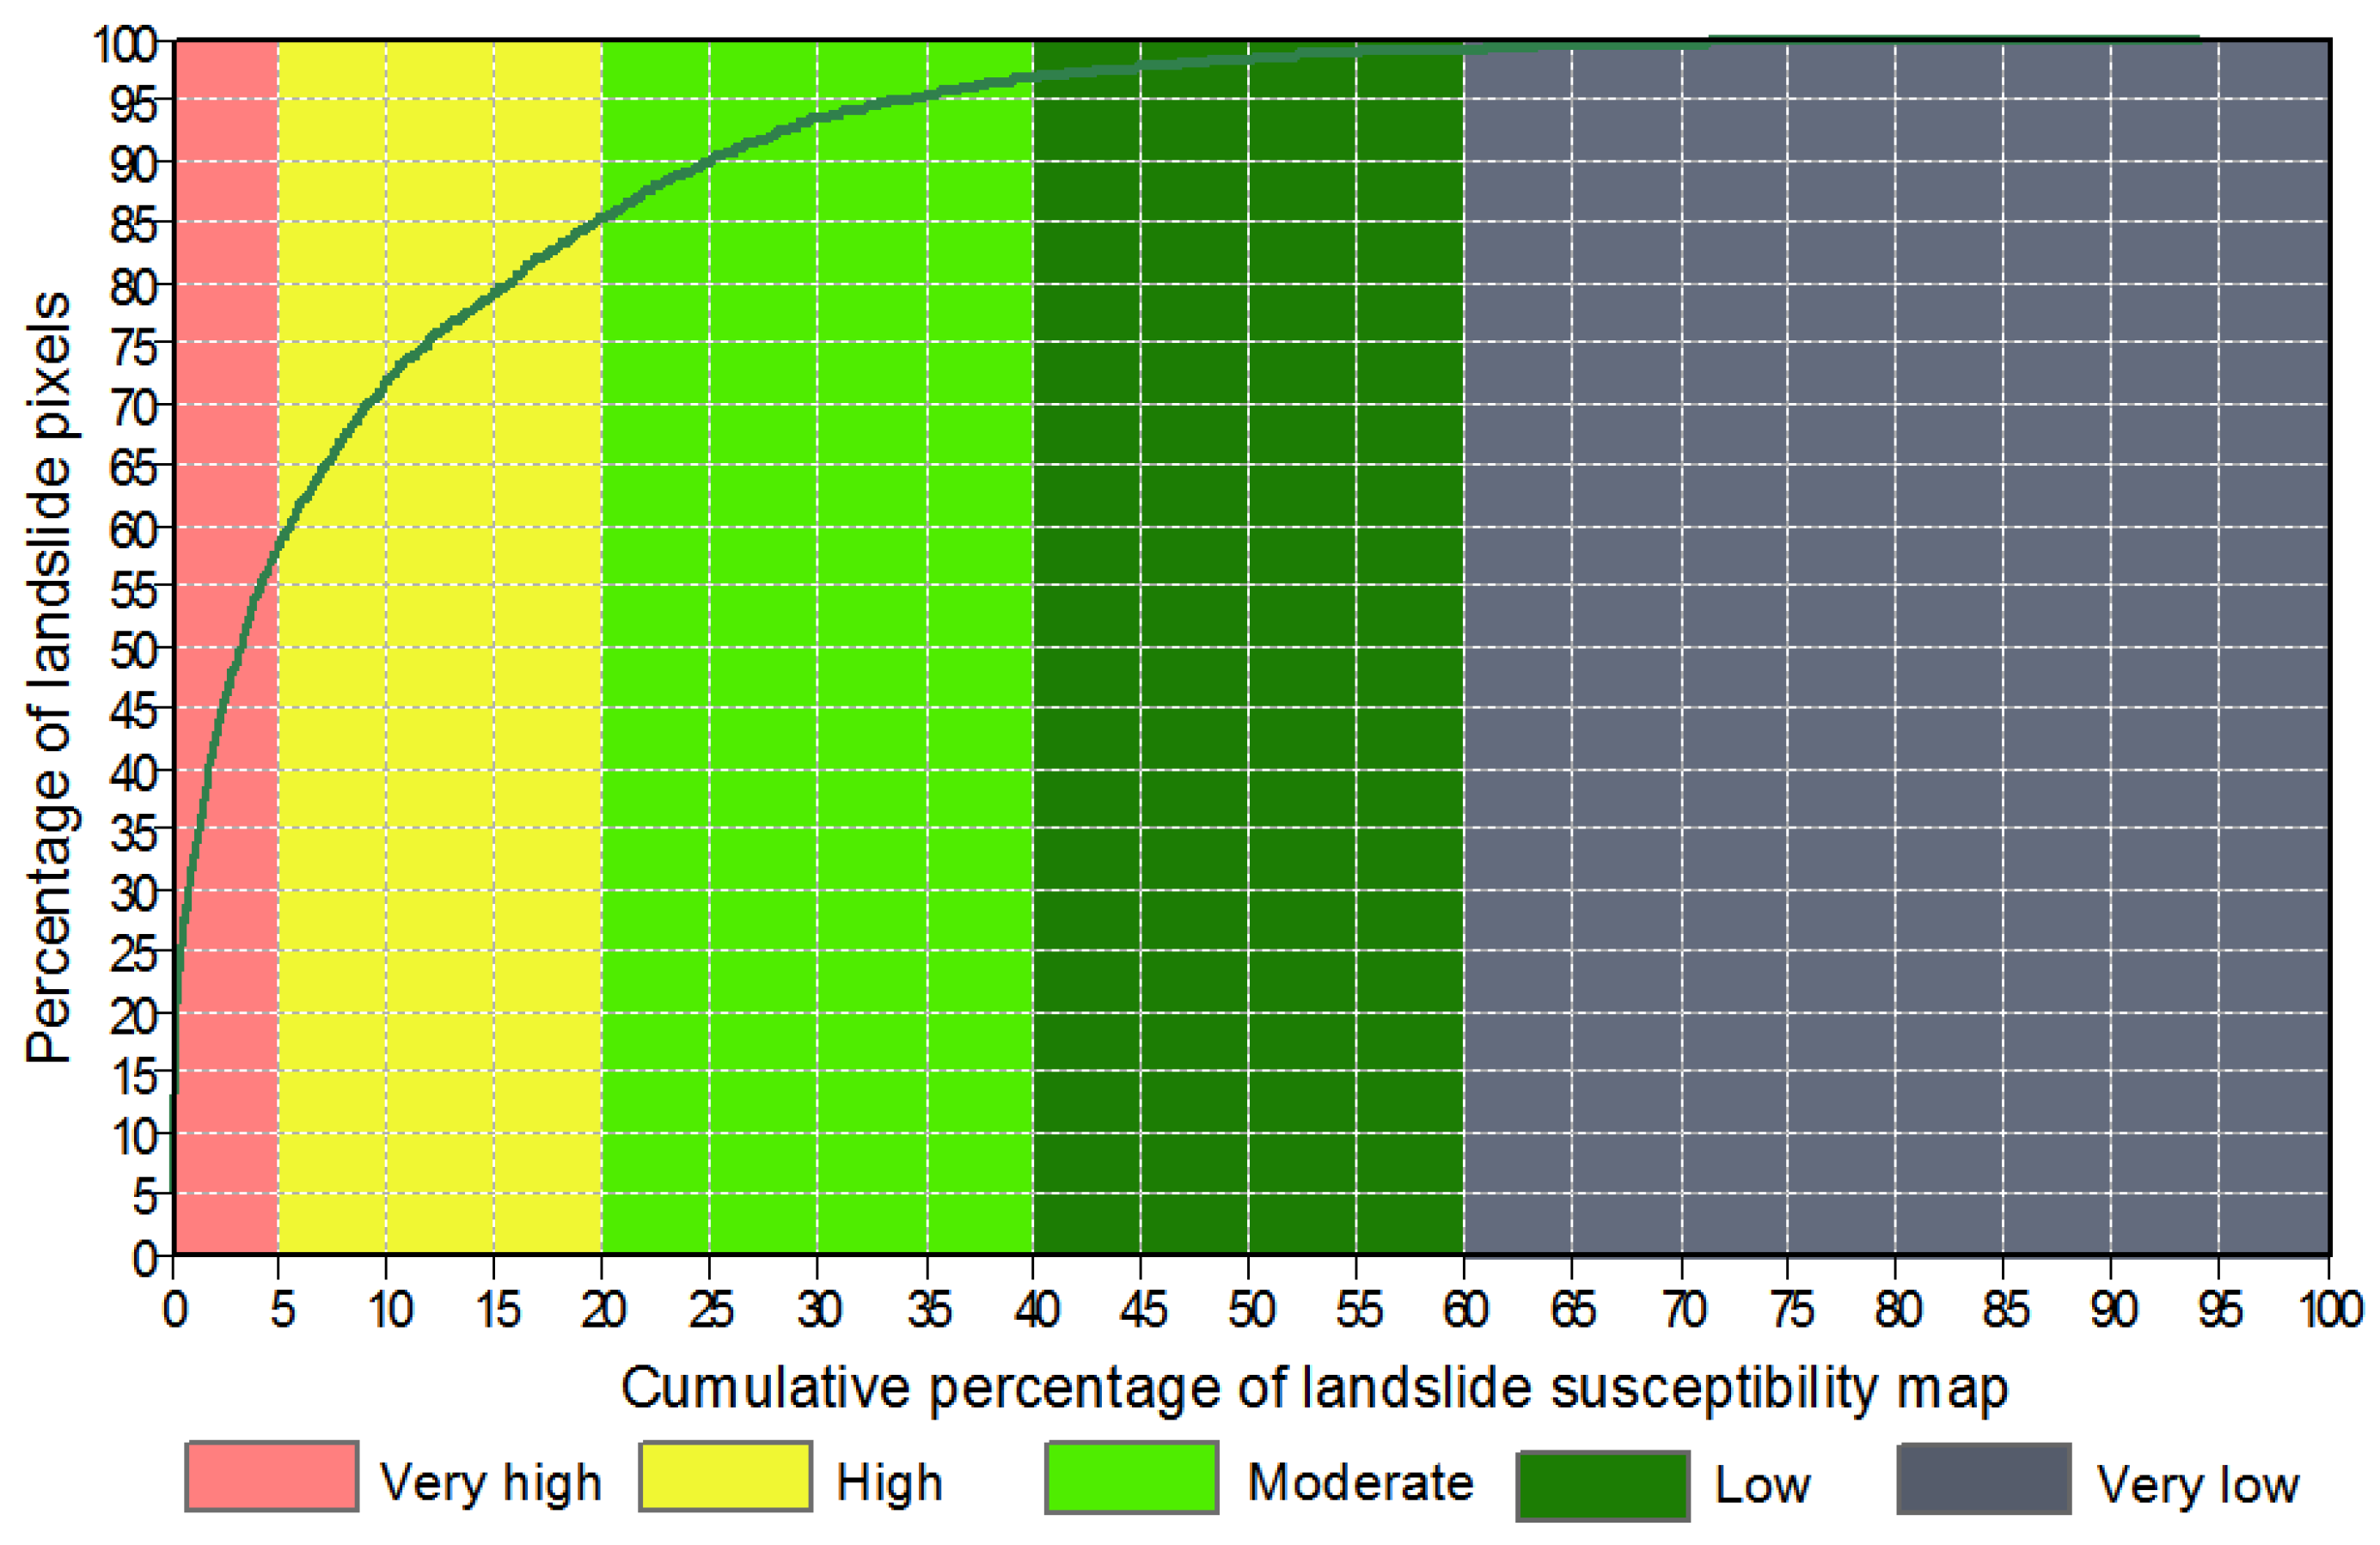
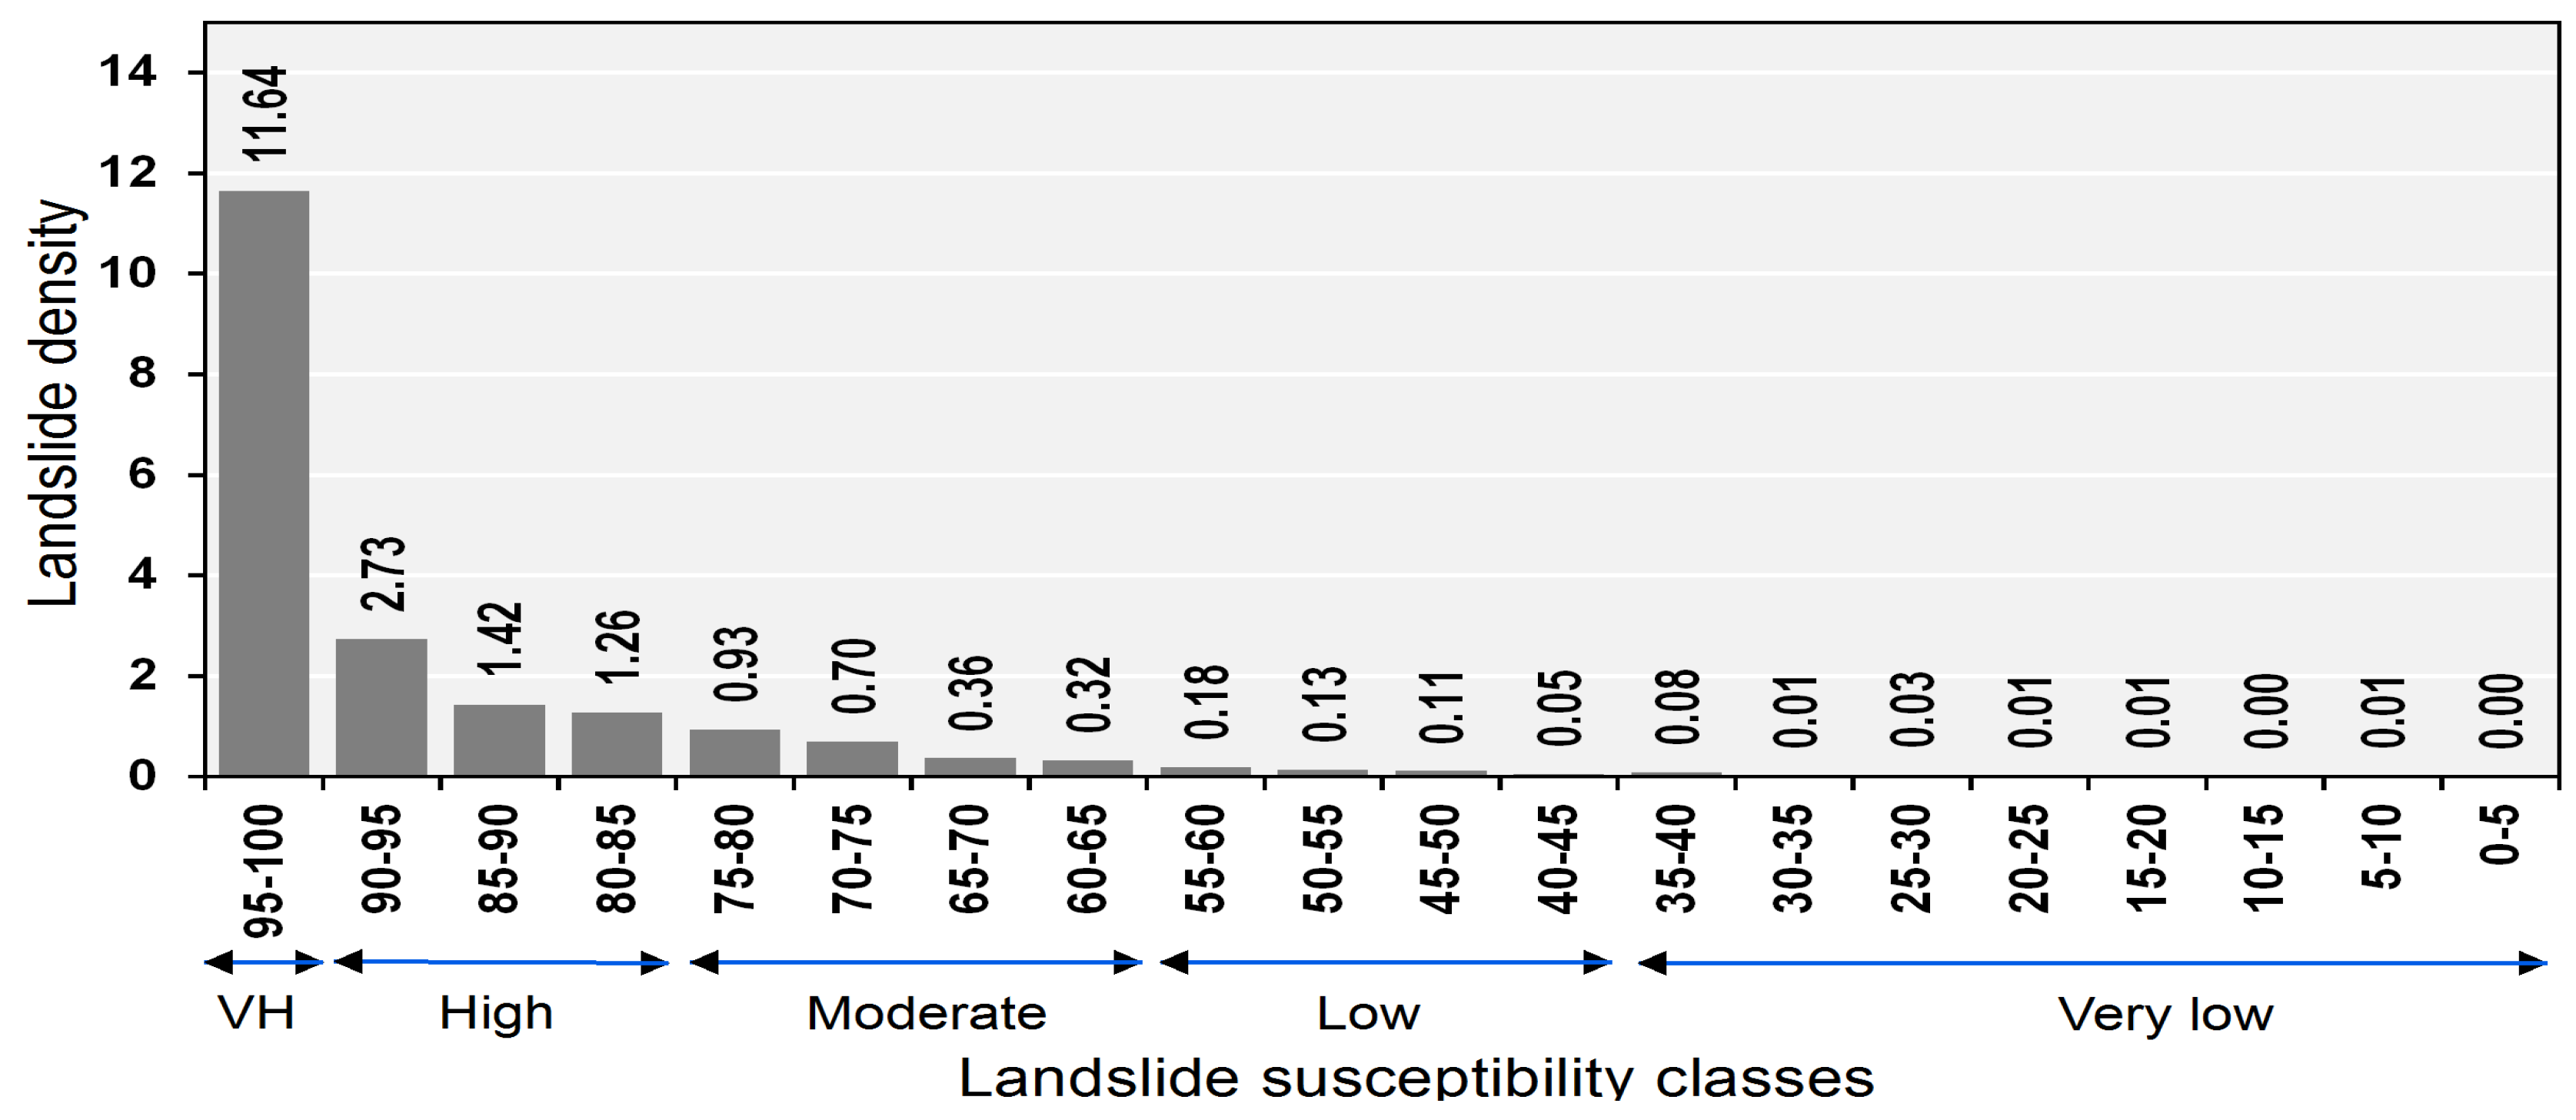
5.4. Cartographic Presentation of the Landslide Susceptibility Map
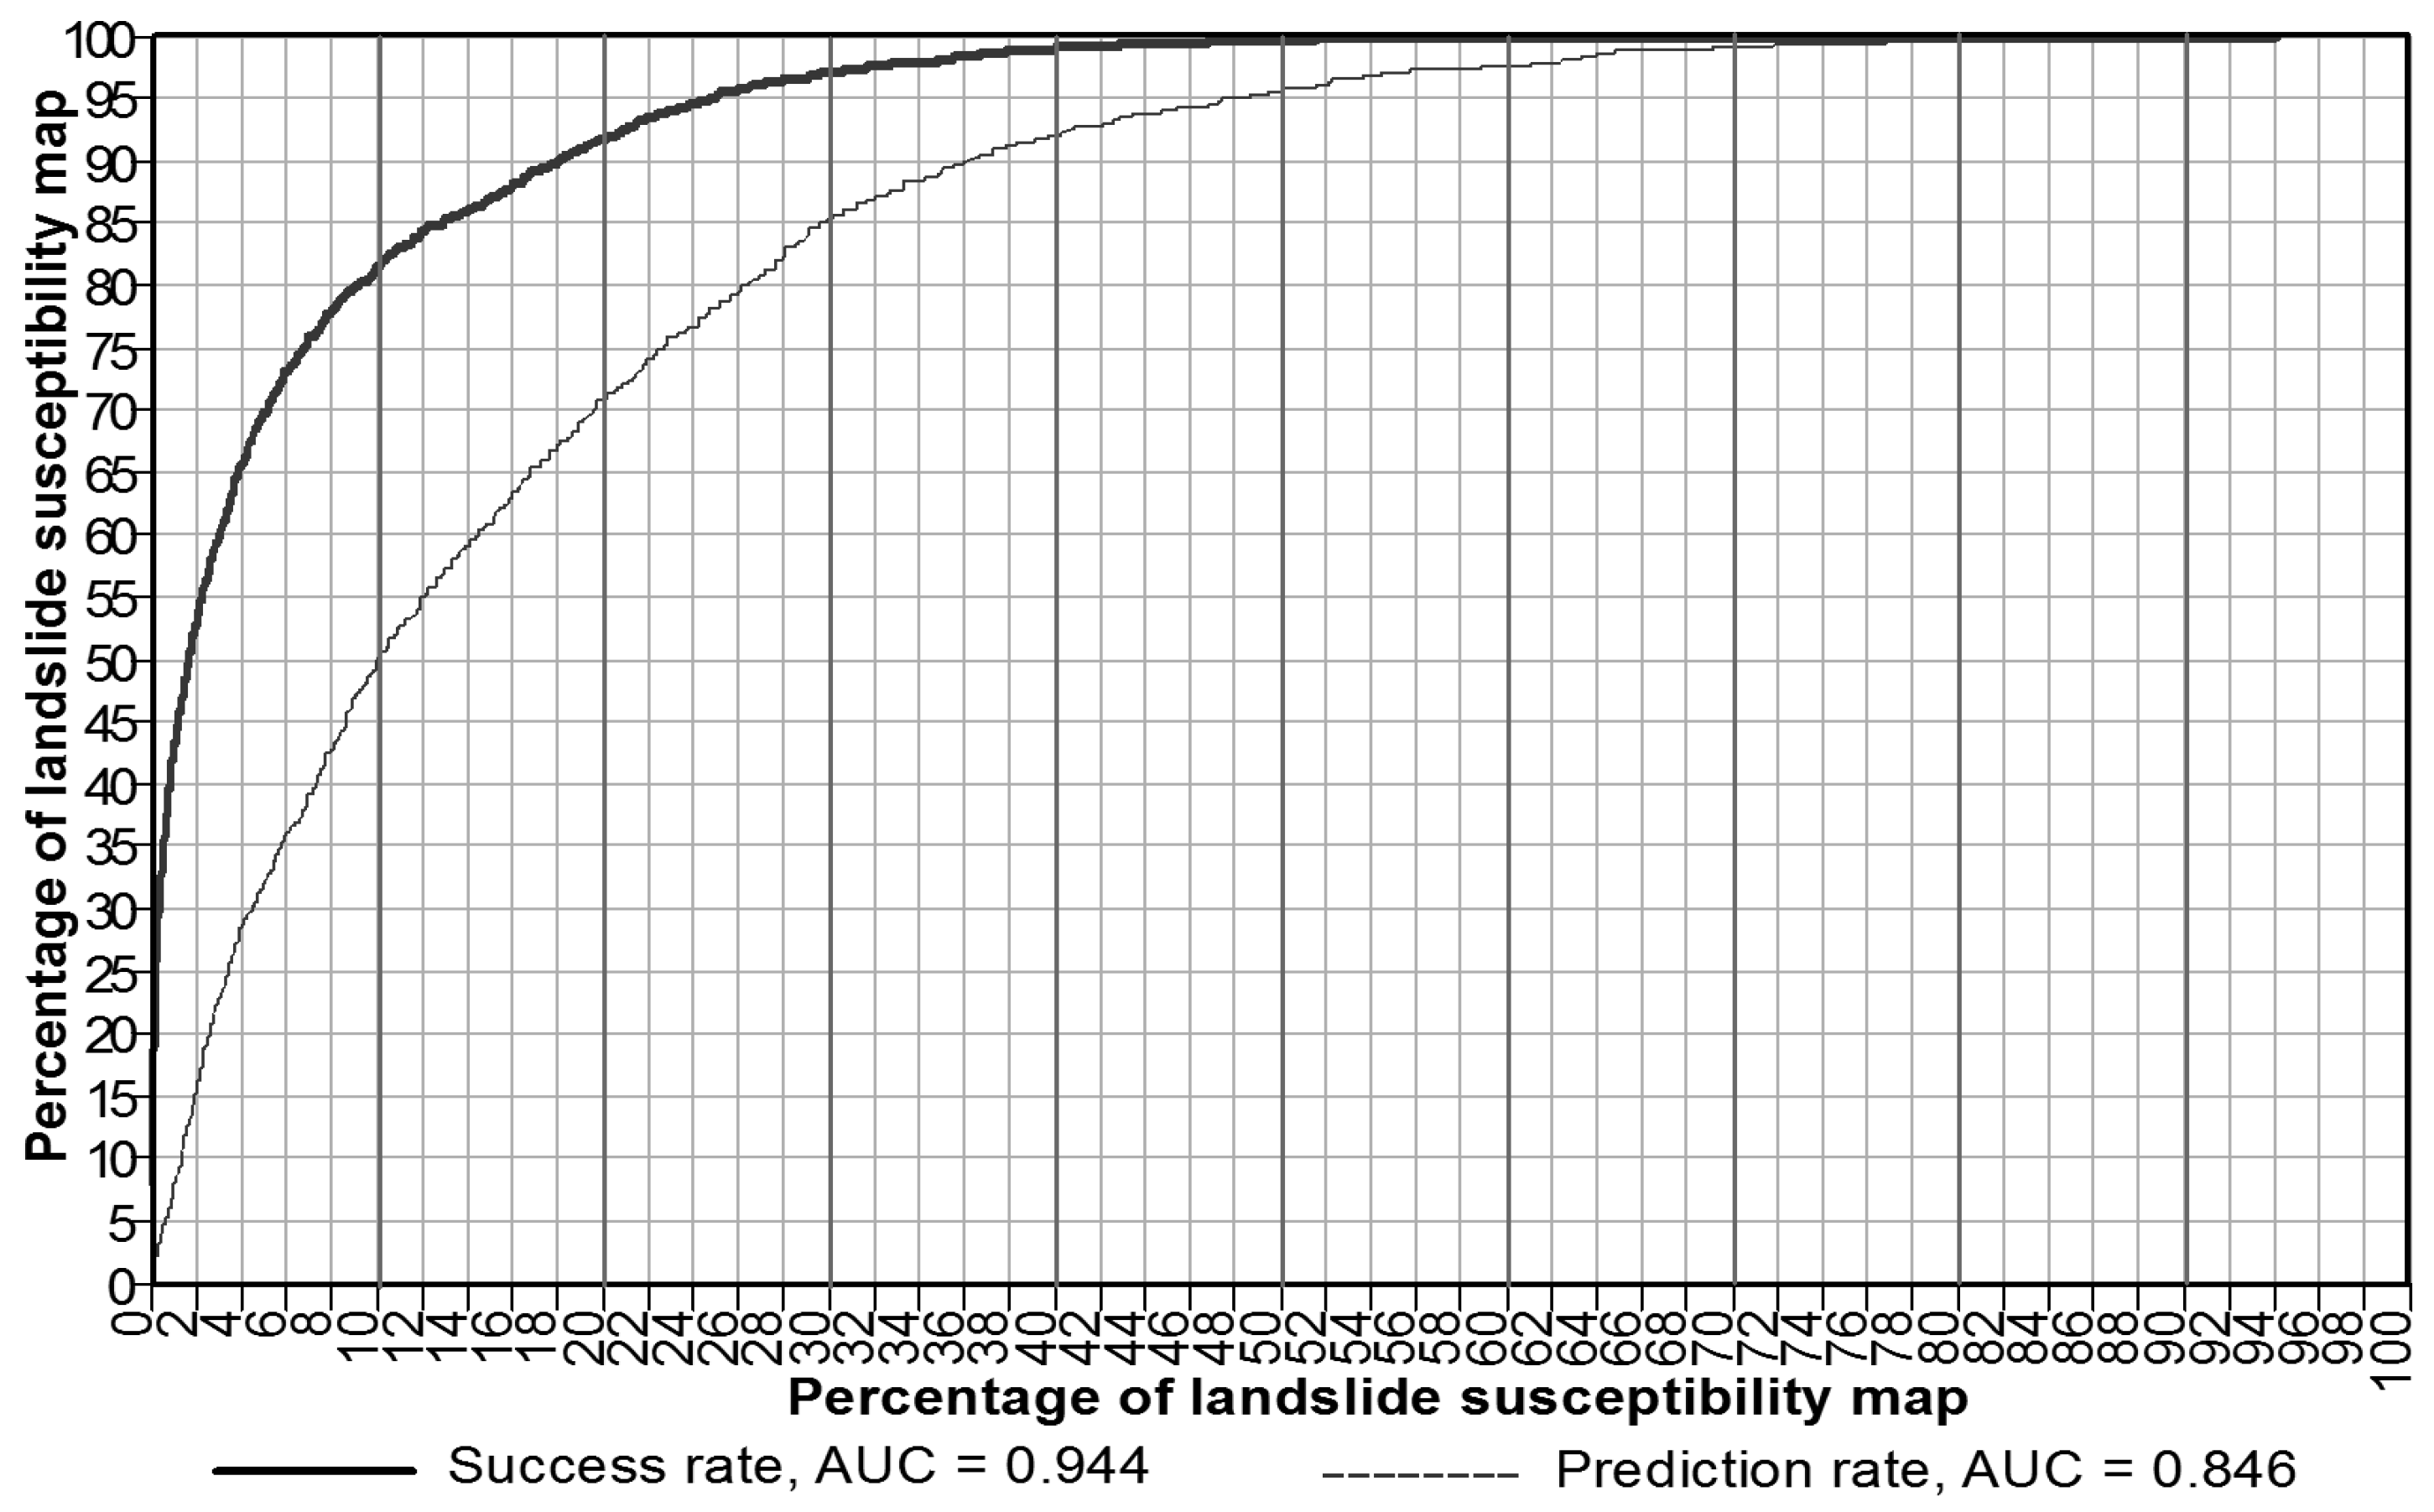
5.5. Usability Assessment of the Proposed Hybrid Model
6. Discussion and Conclusion
Acknowledgments
Author Contributions
Conflicts of Interest
References
- Elliott, C.S.; Paula, L.G. National Landslide Hazards Mitigation Strategy–A Framework for Loss Reduction; U.S. Geological Survey: Reston, VA, USA, 2005; p. 64.
- United Nations. International Strategy for Disaster Reduction: LIVING with Risk: A Global Review of Disaster Reduction Initiatives; United Nations Publications: New York, NY, USA, 2004; Volume 1. [Google Scholar]
- Tien Bui, D.; Tuan, T.A.; Klempe, H.; Pradhan, B.; Revhaug, I. Spatial prediction models for shallow landslide hazards: A comparative assessment of the efficacy of support vector machines, artificial neural networks, kernel logistic regression, and logistic model tree. Landslides 2016, 13, 361–378. [Google Scholar] [CrossRef]
- Hong, H.; Pradhan, B.; Xu, C.; Tien Bui, D. Spatial prediction of landslide hazard at the yihuang area (China) using two-class kernel logistic regression, alternating decision tree and support vector machines. Catena 2015, 133, 266–281. [Google Scholar] [CrossRef]
- Althuwaynee, O.F.; Pradhan, B.; Lee, S. A novel integrated model for assessing landslide susceptibility mapping using chaid and ahp pair-wise comparison. Int. J. Remote Sens. 2016, 37, 1190–1209. [Google Scholar] [CrossRef]
- Dou, J.; Tien Bui, D.; Yunus, A.P.; Jia, K.; Song, X.; Revhaug, I.; Xia, H.; Zhu, Z. Optimization of causative factors for landslide susceptibility evaluation using remote sensing and gis data in parts of niigata, Japan. PLoS ONE 2015, 10, e0133262. [Google Scholar] [CrossRef] [PubMed]
- Chung, C.-J.; Fabbri, A.G. Predicting landslides for risk analysis—Spatial models tested by a cross-validation technique. Geomorphology 2008, 94, 438–452. [Google Scholar] [CrossRef]
- Fell, R.; Corominas, J.; Bonnard, C.; Cascini, L.; Leroi, E.; Savage, W.Z. Guidelines for landslide susceptibility, hazard and risk zoning for land-use planning. Eng. Geol. 2008, 102, 99–111. [Google Scholar] [CrossRef]
- Gokceoglu, C.; Aksoy, H. Landslide susceptibility mapping of the slopes in the residual soils of the mengen region (Turkey) by deterministic stability analyses and image processing techniques. Eng. Geol. 1996, 44, 147–161. [Google Scholar] [CrossRef]
- Pradhan, B. A comparative study on the predictive ability of the decision tree, support vector machine and neuro-fuzzy models in landslide susceptibility mapping using gis. Comput. Geosci. 2013, 51, 350–365. [Google Scholar] [CrossRef]
- Tien Bui, D.; Pradhan, B.; Lofman, O.; Revhaug, I.; Dick, O.B. Landslide susceptibility assessment in the hoa binh province of Vietnam: A comparison of the levenberg-marquardt and bayesian regularized neural networks. Geomorphology 2012, 171–172, 12–29. [Google Scholar] [CrossRef]
- Mennis, J.; Guo, D. Spatial data mining and geographic knowledge discovery—An introduction. Comput. Environ. Urban Syst. 2009, 33, 403–408. [Google Scholar] [CrossRef]
- Shamseldin, A.Y.; O’Connor, K.M. A non-linear neural network technique for updating of river flow forecasts. Hydrol. Earth Syst. Sci. 2001, 5, 577–598. [Google Scholar] [CrossRef]
- Fayyad, U.M.; Piatetsky-Shapiro, G.; Smyth, P.; Uthurusamy, R. Advances in Knowledge Discovery and Data Mining; AAAI Press/The MIT Press: Menlo Park, CA, USA; Cambridge, MA, USA; London, UK, 1996. [Google Scholar]
- Yilmaz, I. Landslide susceptibility mapping using frequency ratio, logistic regression, artificial neural networks and their comparison: A case study from kat landslides (Tokat-Turkey). Comput. Geosci. 2009, 35, 1125–1138. [Google Scholar] [CrossRef]
- Dou, J.; Yamagishi, H.; Pourghasemi, H.R.; Yunus, A.P.; Song, X.; Xu, Y.; Zhu, Z. An integrated artificial neural network model for the landslide susceptibility assessment of osado island, Japan. Nat. Hazards 2015, 1–28. [Google Scholar] [CrossRef]
- Yao, X.; Tham, L.G.; Dai, F.C. Landslide susceptibility mapping based on support vector machine: A case study on natural slopes of Hong Kong, China. Geomorphology 2008, 101, 572–582. [Google Scholar] [CrossRef]
- Yilmaz, I. Comparison of landslide susceptibility mapping methodologies for Koyulhisar, Turkey: Conditional probability, logistic regression, artificial neural networks, and support vector machine. Environ. Earth Sci. 2010, 61, 821–836. [Google Scholar] [CrossRef]
- Kavzoglu, T.; Sahin, E.; Colkesen, I. Landslide susceptibility mapping using gis-based multi-criteria decision analysis, support vector machines, and logistic regression. Landslides 2014, 11, 425–439. [Google Scholar] [CrossRef]
- Tien Bui, D.; Pradhan, B.; Lofman, O.; Revhaug, I. Landslide susceptibility assessment in Vietnam using support vector machines, decision tree and naïve bayes models. Math. Probl. Eng. 2012, 2012, 1–26. [Google Scholar] [CrossRef]
- Tien Bui, D.; Pradhan, B.; Lofman, O.; Revhaug, I.; Dick, O.B. Application of support vector machines in landslide susceptibility assessment for the Hoa Binh Province (Vietnam) with kernel functions analysis. In Proceedings of the iEMSs Sixth Biennial Meeting, International Congress on Environmental Modelling and Software (iEMSs 2012), International Environmental Modelling and Software Society, Leipzig, Germany, July 2012; Available online: http://scholarsarchive.byu.edu/cgi/viewcontent.cgi?article=1875&context=iemssconference (accessed on 12 February 2016).
- Nefeslioglu, H.A.; Sezer, E.; Gokceoglu, C.; Bozkir, A.S.; Duman, T.Y. Assessment of landslide susceptibility by decision trees in the metropolitan area of Istanbul, Turkey. Math. Probl. Eng. 2010, 2010, 242–256. [Google Scholar] [CrossRef]
- Tien Bui, D.; Pradhan, B.; Lofman, O.; Revhaug, I.; Dick, O.B. Landslide susceptibility mapping at Hoa Binh Province (Vietnam) using an adaptive neuro-fuzzy inference system and gis. Comput. Geosci. 2012, 45, 199–211. [Google Scholar] [CrossRef]
- Pradhan, B.; Sezer, E.A.; Gokceoglu, C.; Buchroithner, M.F. Landslide susceptibility mapping by neuro-fuzzy approach in a landslide-prone area (Cameron Highlands, Malaysia). IEEE Trans. Geosci. Remote Sens. 2010, 48, 4164–4177. [Google Scholar] [CrossRef]
- Dou, J.; Chang, K.-T.; Chen, S.; Yunus, A.P.; Liu, J.-K.; Xia, H.; Zhu, Z. Automatic case-based reasoning approach for landslide detection: Integration of object-oriented image analysis and a genetic algorithm. Remote Sens. 2015, 7, 4318–4342. [Google Scholar] [CrossRef]
- Pham, B.T.; Tien Bui, D.; Prakash, I.; Dholakia, M.B. Hybrid integration of multilayer perceptron neural networks and machine learning ensembles for landslide susceptibility assessment at Himalayan area (India) using gis. Catena 2017, 149, 52–63. [Google Scholar] [CrossRef]
- Tien Bui, D.; Pham, T.B.; Nguyen, Q.-P.; Hoang, N.-D. Spatial prediction of rainfall-induced shallow landslides using hybrid integration approach of least squares support vector machines and differential evolution optimization: A case study in central Vietnam. Int. J. Digit. Earth 2016. [Google Scholar] [CrossRef]
- Tien Bui, D.; Nguyen, Q.-P.; Hoang, N.-D.; Klempe, H. A novel fuzzy k-nearest neighbor inference model with differential evolution for spatial prediction of rainfall-induced shallow landslides in a tropical hilly area using gis. Landslides 2016. [Google Scholar] [CrossRef]
- Van Liem, N.; Dat, N.P.; Bui Tien, D.; Van Phai, V.; Trinh, P.T.; Vinh, H.Q.; Van Phong, T. Assessment of geomorphic processes and active tectonics in con voi mountain range area (northern vietnam) using the hypsometric curve analysis method. Vietnam J. Earth Sci. 2016, 38, 202–216. [Google Scholar]
- Lu, N.T.; Rodkin, M.; Tuyen, N.H.; Hang, P.T.T.; Phuong, T.V. Prediction of maximum earthquake magnitude for northern vietnam region based on the gev distribution. Vietnam. J. Earth Sci. 2016, 38. [Google Scholar] [CrossRef]
- Tien Bui, D.; Ho, T.C.; Revhaug, I.; Pradhan, B.; Nguyen, D. Landslide susceptibility mapping along the national road 32 of Vietnam using gis-based j48 decision tree classifier and its ensembles. In Cartography from Pole to Pole; Buchroithner, M., Prechtel, N., Burghardt, D., Eds.; Springer: Berlin/Heidelberg, Germany, 2013; pp. 303–317. [Google Scholar]
- Tien Bui, D.; Pradhan, B.; Lofman, O.; Revhaug, I.; Dick, O. Regional prediction of landslide hazard using probability analysis of intense rainfall in the Hoa Binh province, Vietnam. Nat. Hazards 2013, 66, 707–730. [Google Scholar] [CrossRef]
- Cheng, M.-Y.; Hoang, N.-D. A swarm-optimized fuzzy instance-based learning approach for predicting slope collapses in mountain roads. Knowl. Based Syst. 2015, 76, 256–263. [Google Scholar] [CrossRef]
- Tien Bui, D.; Pradhan, B.; Revhaug, I.; Trung Tran, C. A comparative assessment between the application of fuzzy unordered rules induction algorithm and j48 decision tree models in spatial prediction of shallow landslides at Lang Son City, Vietnam. In Remote Sensing Applications in Environmental Research; Srivastava, P.K., Mukherjee, S., Gupta, M., Islam, T., Eds.; Springer International Publishing: Cham, Switzerland, 2014; pp. 87–111. [Google Scholar]
- Tien Bui, D.; Ho, T.-C.; Pradhan, B.; Pham, B.-T.; Nhu, V.-H.; Revhaug, I. Gis-based modeling of rainfall-induced landslides using data mining based functional trees classifier with adaboost, bagging, and multiboost ensemble frameworks. Environ. Earth Sci. 2016. [Google Scholar] [CrossRef]
- Xiong, L.; O'connor, K.M. Comparison of four updating models for real-time river flow forecasting. Hydrol. Sci. J. 2002, 47, 621–639. [Google Scholar] [CrossRef]
- Shamseldin, A.Y.; O’connor, K.M.; Nasr, A.E. A comparative study of three neural network forecast combination methods for simulated river flows of different rainfall—Runoff models. Hydrol. Sci. J. 2007, 52, 896–916. [Google Scholar] [CrossRef]
- Young, C.-C.; Liu, W.-C. Prediction and modelling of rainfall—Runoff during typhoon events using a physically-based and artificial neural network hybrid model. Hydrol. Sci. J. 2015, 60, 2102–2116. [Google Scholar] [CrossRef]
- Young, C.-C.; Liu, W.-C.; Chung, C.-E. Genetic algorithm and fuzzy neural networks combined with the hydrological modeling system for forecasting watershed runoff discharge. Neural Comput. Appl. 2015, 26, 1631–1643. [Google Scholar] [CrossRef]
- Young, C.-C.; Liu, W.-C.; Wu, M.-C. A physically based and machine learning hybrid approach for accurate rainfall-runoff modeling during extreme typhoon events. Appl. Soft Comput. 2017, 53, 205–216. [Google Scholar] [CrossRef]
- Hoang, N.-D.; Tien Bui, D. Predicting earthquake-induced soil liquefaction based on a hybridization of kernel fisher discriminant analysis and a least squares support vector machine: A multi-dataset study. Bull. Eng. Geol. Environ. 2016, 1–14. [Google Scholar] [CrossRef]
- Shirzadi, A.; Bui, D.T.; Pham, B.T.; Solaimani, K.; Chapi, K.; Kavian, A.; Shahabi, H.; Revhaug, I. Shallow landslide susceptibility assessment using a novel hybrid intelligence approach. Environ. Earth Sci. 2017, 76, 60. [Google Scholar] [CrossRef]
- Rodriguez, J.J.; Kuncheva, L.I.; Alonso, C.J. Rotation forest: A new classifier ensemble method. IEEE Trans. Pattern Anal. Mach. Intell. 2006, 28, 1619–1630. [Google Scholar] [CrossRef] [PubMed]
- Witten, I.H.; Frank, E.; Mark, A.H. Data Mining: Practical Machine Learning Tools and Techniques, 3rd ed.; Morgan Kaufmann: Burlington, NC, USA, 2011; p. 558. [Google Scholar]
- Pham, B.T.; Tien Bui, D.; Dholakia, M.; Prakash, I.; Pham, H.V.; Mehmood, K.; Le, H.Q. A novel ensemble classifier of rotation forest and naïve bayer for landslide susceptibility assessment at the luc yen district, yen bai province (viet nam) using GIS. Geomat. Nat. Hazard Risk. 2016, 1–23. [Google Scholar] [CrossRef]
- Tien Bui, D.; Pradhan, B.; Revhaug, I.; Nguyen, D.; Pham, H.; Bui, Q. A novel hybrid evidential belief function based fuzzy logic model in spatial prediction of rainfall-induced shallow landslides in the Lang Son City area (Vietnam). Geomat. Nat. Hazards Risk. 2013. [Google Scholar] [CrossRef]
- Tam, V.T.; Tuy, P.K.; Nam, N.X.; Tuan, L.C.; Tuan, N.D.; Trung, N.D.; Thang, D.V.; Ha, P.V. Geohazard Investigation in Some Key Areas of the Northern Mountainous Area of Vietnam for the Planning of Socio-Economic Development; Vietnam Institute of Geosciences and Mineral Resources: Hanoi, Vietnam, 2006; p. 83. [Google Scholar]
- Truong, P.D.; Nghi, T.H.; Phuc, P.N.; Quyet, H.B.; The, N.V. Geological Mapping and Mineral Resource Investigation at 1:50 000 Scale for Lang Son Area; Northern Geological Mapping Division: Hanoi, Vietnam, 2009. [Google Scholar]
- Tien Bui, D. Modeling of Rainfall-Induced Landslide Hazard for the Hoa Binh Province of Vietnam. Ph.D. Thesis, Norwegian University of Life Sciences, Aas, Norway, 2012. [Google Scholar]
- Meinhardt, M.; Fink, M.; Tünschel, H. Landslide susceptibility analysis in central Vietnam based on an incomplete landslide inventory: Comparison of a new method to calculate weighting factors by means of bivariate statistics. Geomorphology 2015, 234, 80–97. [Google Scholar] [CrossRef]
- Lanni, C.; Borga, M.; Rigon, R.; Tarolli, P. Modelling shallow landslide susceptibility by means of a subsurface flow path connectivity index and estimates of soil depth spatial distribution. Hydrol. Earth Syst. Sci. 2012, 16, 3959–3971. [Google Scholar] [CrossRef]
- Kavzoglu, T.; Kutlug Sahin, E.; Colkesen, I. An assessment of multivariate and bivariate approaches in landslide susceptibility mapping: A case study of Duzkoy district. Nat. Hazards 2015, 76, 471–496. [Google Scholar] [CrossRef]
- Nefeslioglu, H.A.; Duman, T.Y.; Durmaz, S. Landslide susceptibility mapping for a part of tectonic Kelkit Valley (eastern black sea region of Turkey). Geomorphology 2008, 94, 401–418. [Google Scholar] [CrossRef]
- Tien Bui, D.; Pradhan, B.; Lofman, O.; Revhaug, I.; Dick, O.B. Spatial prediction of landslide hazards in Hoa Binh Province (Vietnam): A comparative assessment of the efficacy of evidential belief functions and fuzzy logic models. Catena 2012, 96, 28–40. [Google Scholar] [CrossRef]
- Mancini, F.; Ceppi, C.; Ritrovato, G. Gis and statistical analysis for landslide susceptibility mapping in the Daunia area (Italy). Nat. Hazards Earth Syst. Sci. 2010, 10, 1851–1864. [Google Scholar] [CrossRef]
- Ayalew, L.; Yamagishi, H. The application of gis-based logistic regression for landslide susceptibility mapping in the Kakuda-Yahiko Mountains, central Japan. Geomorphology 2005, 65, 15–31. [Google Scholar] [CrossRef]
- Quoc, N.K.; Dan, T.H.; Hung, L.; Huyen, D.T. Geological Map (Binh Gia Group); Vietnam Institute of Geosciences and Mineral Resources: Hanoi, Vietnam, 1992. [Google Scholar]
- Brideau, M.-A.; Yan, M.; Stead, D. The role of tectonic damage and brittle rock fracture in the development of large rock slope failures. Geomorphology 2009, 103, 30–49. [Google Scholar] [CrossRef]
- Wan, C.H.; Lee, L.H.; Rajkumar, R.; Isa, D. A hybrid text classification approach with low dependency on parameter by integrating k-nearest neighbor and support vector machine. Expert Syst. Appl. 2012, 39, 11880–11888. [Google Scholar] [CrossRef]
- Wu, X.; Kumar, V.; Quinlan, J.R.; Ghosh, J.; Yang, Q.; Motoda, H.; McLachlan, G.J.; Ng, A.; Liu, B.; Philip, S.Y. Top 10 algorithms in data mining. Knowl. Inf. Syst. 2008, 14, 1–37. [Google Scholar] [CrossRef]
- Polikar, R.; DePasquale, J.; Mohammed, H.S.; Brown, G.; Kuncheva, L.I. Learn++. Mf: A random subspace approach for the missing feature problem. Pattern Recognit. 2010, 43, 3817–3832. [Google Scholar] [CrossRef]
- Team, R.C. The R Project for Statistical Computing. Available online: www.R-project.org/ (accessed on 31 October 2014).
- Kuncheva, L.I. Combining Pattern Classifiers: Methods and Algorithms, 2nd ed.; John Wiley & Sons: Hoboken, NJ, USA, 2014. [Google Scholar]
- Martínez-Álvarez, F.; Reyes, J.; Morales-Esteban, A.; Rubio-Escudero, C. Determining the best set of seismicity indicators to predict earthquakes. Two case studies: Chile and the iberian peninsula. Knowl. Based Syst. 2013, 50, 198–210. [Google Scholar] [CrossRef]
- Pandya, D.; Upadhyay, S.; Harsha, S. Fault diagnosis of rolling element bearing with intrinsic mode function of acoustic emission data using apf-knn. Expert Syst. Appl. 2013, 40, 4137–4145. [Google Scholar] [CrossRef]
- Premaratne, P. Effective hand gesture classification approaches. In Human Computer Interaction Using Hand Gestures; Springer: Berlin/Heidelberg, Germany, 2014; pp. 105–143. [Google Scholar]
- Kuncheva, L.I.; Rodríguez, J.J. An experimental study on rotation forest ensembles. In Multiple Classifier Systems; Springer: Berlin/Heidelberg, Germany, 2007; pp. 459–468. [Google Scholar]
- Tien Bui, D.; Anh Tuan, T.; Hoang, N.-D.; Quoc Thanh, N.; Nguyen, B.D.; Van Liem, N.; Pradhan, B. Spatial prediction of rainfall-induced landslides for the Lao Cai area (Vietnam) using a novel hybrid intelligent approach of least squares support vector machines inference model and artificial bee colony optimization. Landslides 2016. [Google Scholar] [CrossRef]
- Pham, B.T.; Pradhan, B.; Tien Bui, D.; Prakash, I.; Dholakia, M.B. A comparative study of different machine learning methods for landslide susceptibility assessment: A case study of Uttarakhand area (India). Environ. Model. Softw. 2016. [Google Scholar] [CrossRef]
- Hoang, N.-D.; Tien Bui, D. A novel relevance vector machine classifier with cuckoo search optimization for spatial prediction of landslides. J. Comput. Civ. Eng. 2016. [Google Scholar] [CrossRef]
- Kantardzic, M. Data Mining: Concepts, Models, Methods, and Algorithms; John Wiley & Sons: Hoboken, NJ, USA, 2011. [Google Scholar]
- Bours, P. Continuous keystroke dynamics: A different perspective towards biometric evaluation. Inf. Secur. Tech. Rep. 2012, 17, 36–43. [Google Scholar] [CrossRef]
- Simari, G.I.; Earp, D.; Martinez, M.V.; Sliva, A.; Subrahmanian, V. Forecasting group-level actions using similarity measures. In Handbook of Computational Approaches to Counterterrorism; Springer: Berlin/Heidelberg, Germany, 2013; pp. 181–199. [Google Scholar]
- Tien Bui, D.; Lofman, O.; Revhaug, I.; Dick, O. Landslide susceptibility analysis in the Hoa Binh province of Vietnam using statistical index and logistic regression. Nat. Hazards 2011, 59, 1413–1444. [Google Scholar]
- O’brien, R.M. A caution regarding rules of thumb for variance inflation factors. Qual. Quant. 2007, 41, 673–690. [Google Scholar] [CrossRef]
- Mansfield, E.R.; Helms, B.P. Detecting multicollinearity. Am. Stat. 1982, 36, 158–160. [Google Scholar] [CrossRef]
- Dormann, C.F.; Elith, J.; Bacher, S.; Buchmann, C.; Carl, G.; Carré, G.; Marquéz, J.R.G.; Gruber, B.; Lafourcade, B.; Leitão, P.J. Collinearity: A review of methods to deal with it and a simulation study evaluating their performance. Ecography 2013, 36, 27–46. [Google Scholar] [CrossRef]
- Van Den Eeckhaut, M.; Vanwalleghem, T.; Poesen, J.; Govers, G.; Verstraeten, G.; Vandekerckhove, L. Prediction of landslide susceptibility using rare events logistic regression: A case-study in the Flemish Ardennes (Belgium). Geomorphology 2006, 76, 392–410. [Google Scholar] [CrossRef]
- Pradhan, B.; Lee, S. Regional landslide susceptibility analysis using back-propagation neural network model at Cameron Highland, Malaysia. Landslides 2010, 7, 13–30. [Google Scholar] [CrossRef]
- Costanzo, D.; Rotigliano, E.; Irigaray, C.; Jiménez-Perálvarez, J.D.; Chacón, J. Factors selection in landslide susceptibility modelling on large scale following the gis matrix method: Application to the River Beiro Basin (Spain). Nat. Hazards Earth Syst. Sci. 2012, 12, 327–340. [Google Scholar] [CrossRef]
- Chen, T.-C.; Huang, W.-R.; Yen, M.-C. Interannual variation of the late spring–early summer monsoon rainfall in the northern part of the south China sea. J. Clim. 2011, 24, 4295–4313. [Google Scholar] [CrossRef]
- Simon Wang, S.-Y.; Promchote, P.; Truong, L.H.; Buckley, B.; Li, R.; Gillies, R.; Trung, N.T.Q.; Guan, B.; Minh, T.T. Changes in the autumn precipitation and tropical cyclone activity over central vietnam and its east sea. Vietnam J. Earth Sci. 2016, 36. [Google Scholar] [CrossRef]
- Chung, C.J.F.; Fabbri, A.G. Validation of spatial prediction models for landslide hazard mapping. Nat. Hazards 2003, 30, 451–472. [Google Scholar] [CrossRef]
- Chung, C.J.F.; Fabbri, A.G.; Van westen, C.J. Multivariate regression analysis for landslide hazard zonation. In Geographical Information Systems in Assessing Natural Hazards; Carrara, A., Guzzetti, F., Eds.; Springer: New York, NY, USA, 1995; Volume 5, pp. 107–133. [Google Scholar]
- Trigila, A.; Iadanza, C.; Esposito, C.; Scarascia-Mugnozza, G. Comparison of logistic regression and random forests techniques for shallow landslide susceptibility assessment in Giampilieri (Ne Sicily, Italy). Geomorphology 2015, 249, 119–136. [Google Scholar] [CrossRef]
- Catani, F.; Lagomarsino, D.; Segoni, S.; Tofani, V. Landslide susceptibility estimation by random forests technique: Sensitivity and scaling issues. Nat. Hazards Earth Syst. Sci. 2013, 13, 2815–2831. [Google Scholar] [CrossRef]
- Stevens, F.R.; Gaughan, A.E.; Linard, C.; Tatem, A.J. Disaggregating census data for population mapping using random forests with remotely-sensed and ancillary data. PLoS ONE 2015, 10, e0107042. [Google Scholar] [CrossRef] [PubMed]
- Were, K.; Tien Bui, D.; Dick, Ø.B.; Singh, B.R. A comparative assessment of support vector regression, artificial neural networks, and random forests for predicting and mapping soil organic carbon stocks across an afromontane landscape. Ecol. Indic. 2015, 52, 394–403. [Google Scholar] [CrossRef]
- Tien Bui, D.; Pradhan, B.; Nampak, H.; Quang Bui, T.; Tran, Q.-A.; Nguyen, Q.P. Hybrid artificial intelligence approach based on neural fuzzy inference model and metaheuristic optimization for flood susceptibility modelling in a high-frequency tropical cyclone area using gis. J. Hydrol. 2016, 540, 317–330. [Google Scholar] [CrossRef]
- Zêzere, J.; Pereira, S.; Melo, R.; Oliveira, S.; Garcia, R. Mapping landslide susceptibility using data-driven methods. Sci. Total Environ. 2017, 589, 250–267. [Google Scholar] [CrossRef] [PubMed]
- Francke, T.; López-Tarazón, J.; Schröder, B. Estimation of suspended sediment concentration and yield using linear models, random forests and quantile regression forests. Hydrol. Process. 2008, 22, 4892–4904. [Google Scholar] [CrossRef]
- Shah, A.D.; Bartlett, J.W.; Carpenter, J.; Nicholas, O.; Hemingway, H. Comparison of random forest and parametric imputation models for imputing missing data using mice: A caliber study. Am. J. Epidemiol. 2014, 179, 764–774. [Google Scholar] [CrossRef] [PubMed]
- Bui, K.-T.T.; Tien Bui, D.; Zou, J.; Van Doan, C.; Revhaug, I. A novel hybrid artificial intelligent approach based on neural fuzzy inference model and particle swarm optimization for horizontal displacement modeling of hydropower dam. Neural Comput. Appl. 2016, 1–12. [Google Scholar] [CrossRef]
- Bell, F.G. Engineering Geology, 2nd ed.; Butterworth-Heinemann, Elsevier: Oxford, UK, 2007. [Google Scholar]
- Chau, K.T.; Sze, Y.L.; Fung, M.K.; Wong, W.Y.; Fong, E.L.; Chan, L.C.P. Landslide hazard analysis for Hong Kong using landslide inventory and gis. Comput. Geosci. 2004, 30, 429–443. [Google Scholar] [CrossRef]
- Costanzo, D.; Chacón, J.; Conoscenti, C.; Irigaray, C.; Rotigliano, E. Forward logistic regression for earth-flow landslide susceptibility assessment in the Platani River Basin (southern Sicily, Italy). Landslides 2014, 11, 639–653. [Google Scholar] [CrossRef]
- Jebur, M.N.; Pradhan, B.; Tehrany, M.S. Optimization of landslide conditioning factors using very high-resolution airborne laser scanning (Lidar) data at catchment scale. Remote Sens. Environ. 2014, 152, 150–165. [Google Scholar] [CrossRef]
- Garcia, S.; Derrac, J.; Cano, J.R.; Herrera, F. Prototype selection for nearest neighbor classification: Taxonomy and empirical study. IEEE Trans. Pattern Anal. Mach. Intell. 2012, 34, 417–435. [Google Scholar] [CrossRef] [PubMed]
- Rodríguez, J.; García-Osorio, C.; Maudes, J.; Díez-Pastor, J. An experimental study on ensembles of functional trees. In Multiple Classifier Systems; El Gayar, N., Kittler, J., Roli, F., Eds.; Springer: Berlin/Heidelberg, Germany, 2010; Volnme 5997, pp. 64–73. [Google Scholar]
- Althuwaynee, O.F.; Pradhan, B.; Park, H.-J.; Lee, J.H. A novel ensemble decision tree-based chi-squared automatic interaction detection (Chaid) and multivariate logistic regression models in landslide susceptibility mapping. Landslides 2014, 11, 1063–1078. [Google Scholar] [CrossRef]
- Glade, T.; Anderson, M.; Crozier, M.J. Landslide Hazard and Risk; Wiley: West Sussex, UK, 2005. [Google Scholar]


| No | Influencing Factors | Classes |
|---|---|---|
| 1 | Slope (°) | (1) 0–8; (2) 8–15; (3)15–25; (4) 25–35; (5) 35–45; (6) >45 |
| 2 | Slope length (m) | (1) 0–10; (2) 10–30; (3) 30–50; (4) 50–80; (5) 80–120; (6) >120 |
| 3 | Aspect | (1) Flat; (2) North; (3) Northeast; (4) East; (5) Southeast; (6) South; (7) Southwest; (8) West; (9) Northwest |
| 4 | Curvature | (1) <−2; (2) −2 to −0.01; (3) −0.01 to 0.01; (4) 0.01 to 2; (5) >2 |
| 5 | Elevation (m) | (1) <260; (2) 230–300; (3) 300–350; (4) 350–450; (5) 450–550; (6) >550 |
| 6 | Valley depth (m) | (1) <10; (2) 10–30; (3) 30–50; (4) 50–70; (5) 70–100; (6) >100 |
| 7 | Toposhape | (1) Ridge; (2) Saddle; (3) Flat; (4) Ravine; (5) Convex hillside; (6) Saddle hillside; (7) Slope hillside; (8) Concave hillside; (9) Inflection hillside; (10) Unknown hillside |
| 8 | TWI | (1) <5; (2) 5–6; (3) 6–7; (4) 7–8; (5) 8–9; (6) >9 |
| 9 | SPI | (1) <30; (2) 30–100; (3) 100–200; (4) 200–300; (5) >300 |
| 10 | STI | (1) <10; (2) 10–30; (3) 30–50; (4) 50–70; (5) >70 |
| 11 | Landuse | (1) Annual crop land; (2) Populated area; (3) Protective forest land; (4) Productive forest land; (5) Paddy land; (6) Barren land; (7) Perennial crop land; (8) Water surface land ; (9) Grass land |
| 12 | Soil type | (1) Ferralic acrisols; (2) Dystric gleysols; (3) Plinthic acrisols; (4) Water area; (5) Dystric fluvisols; (6) Eutric fluvisols; (7) Rhodic ferralsols; (8) Rocky mountain |
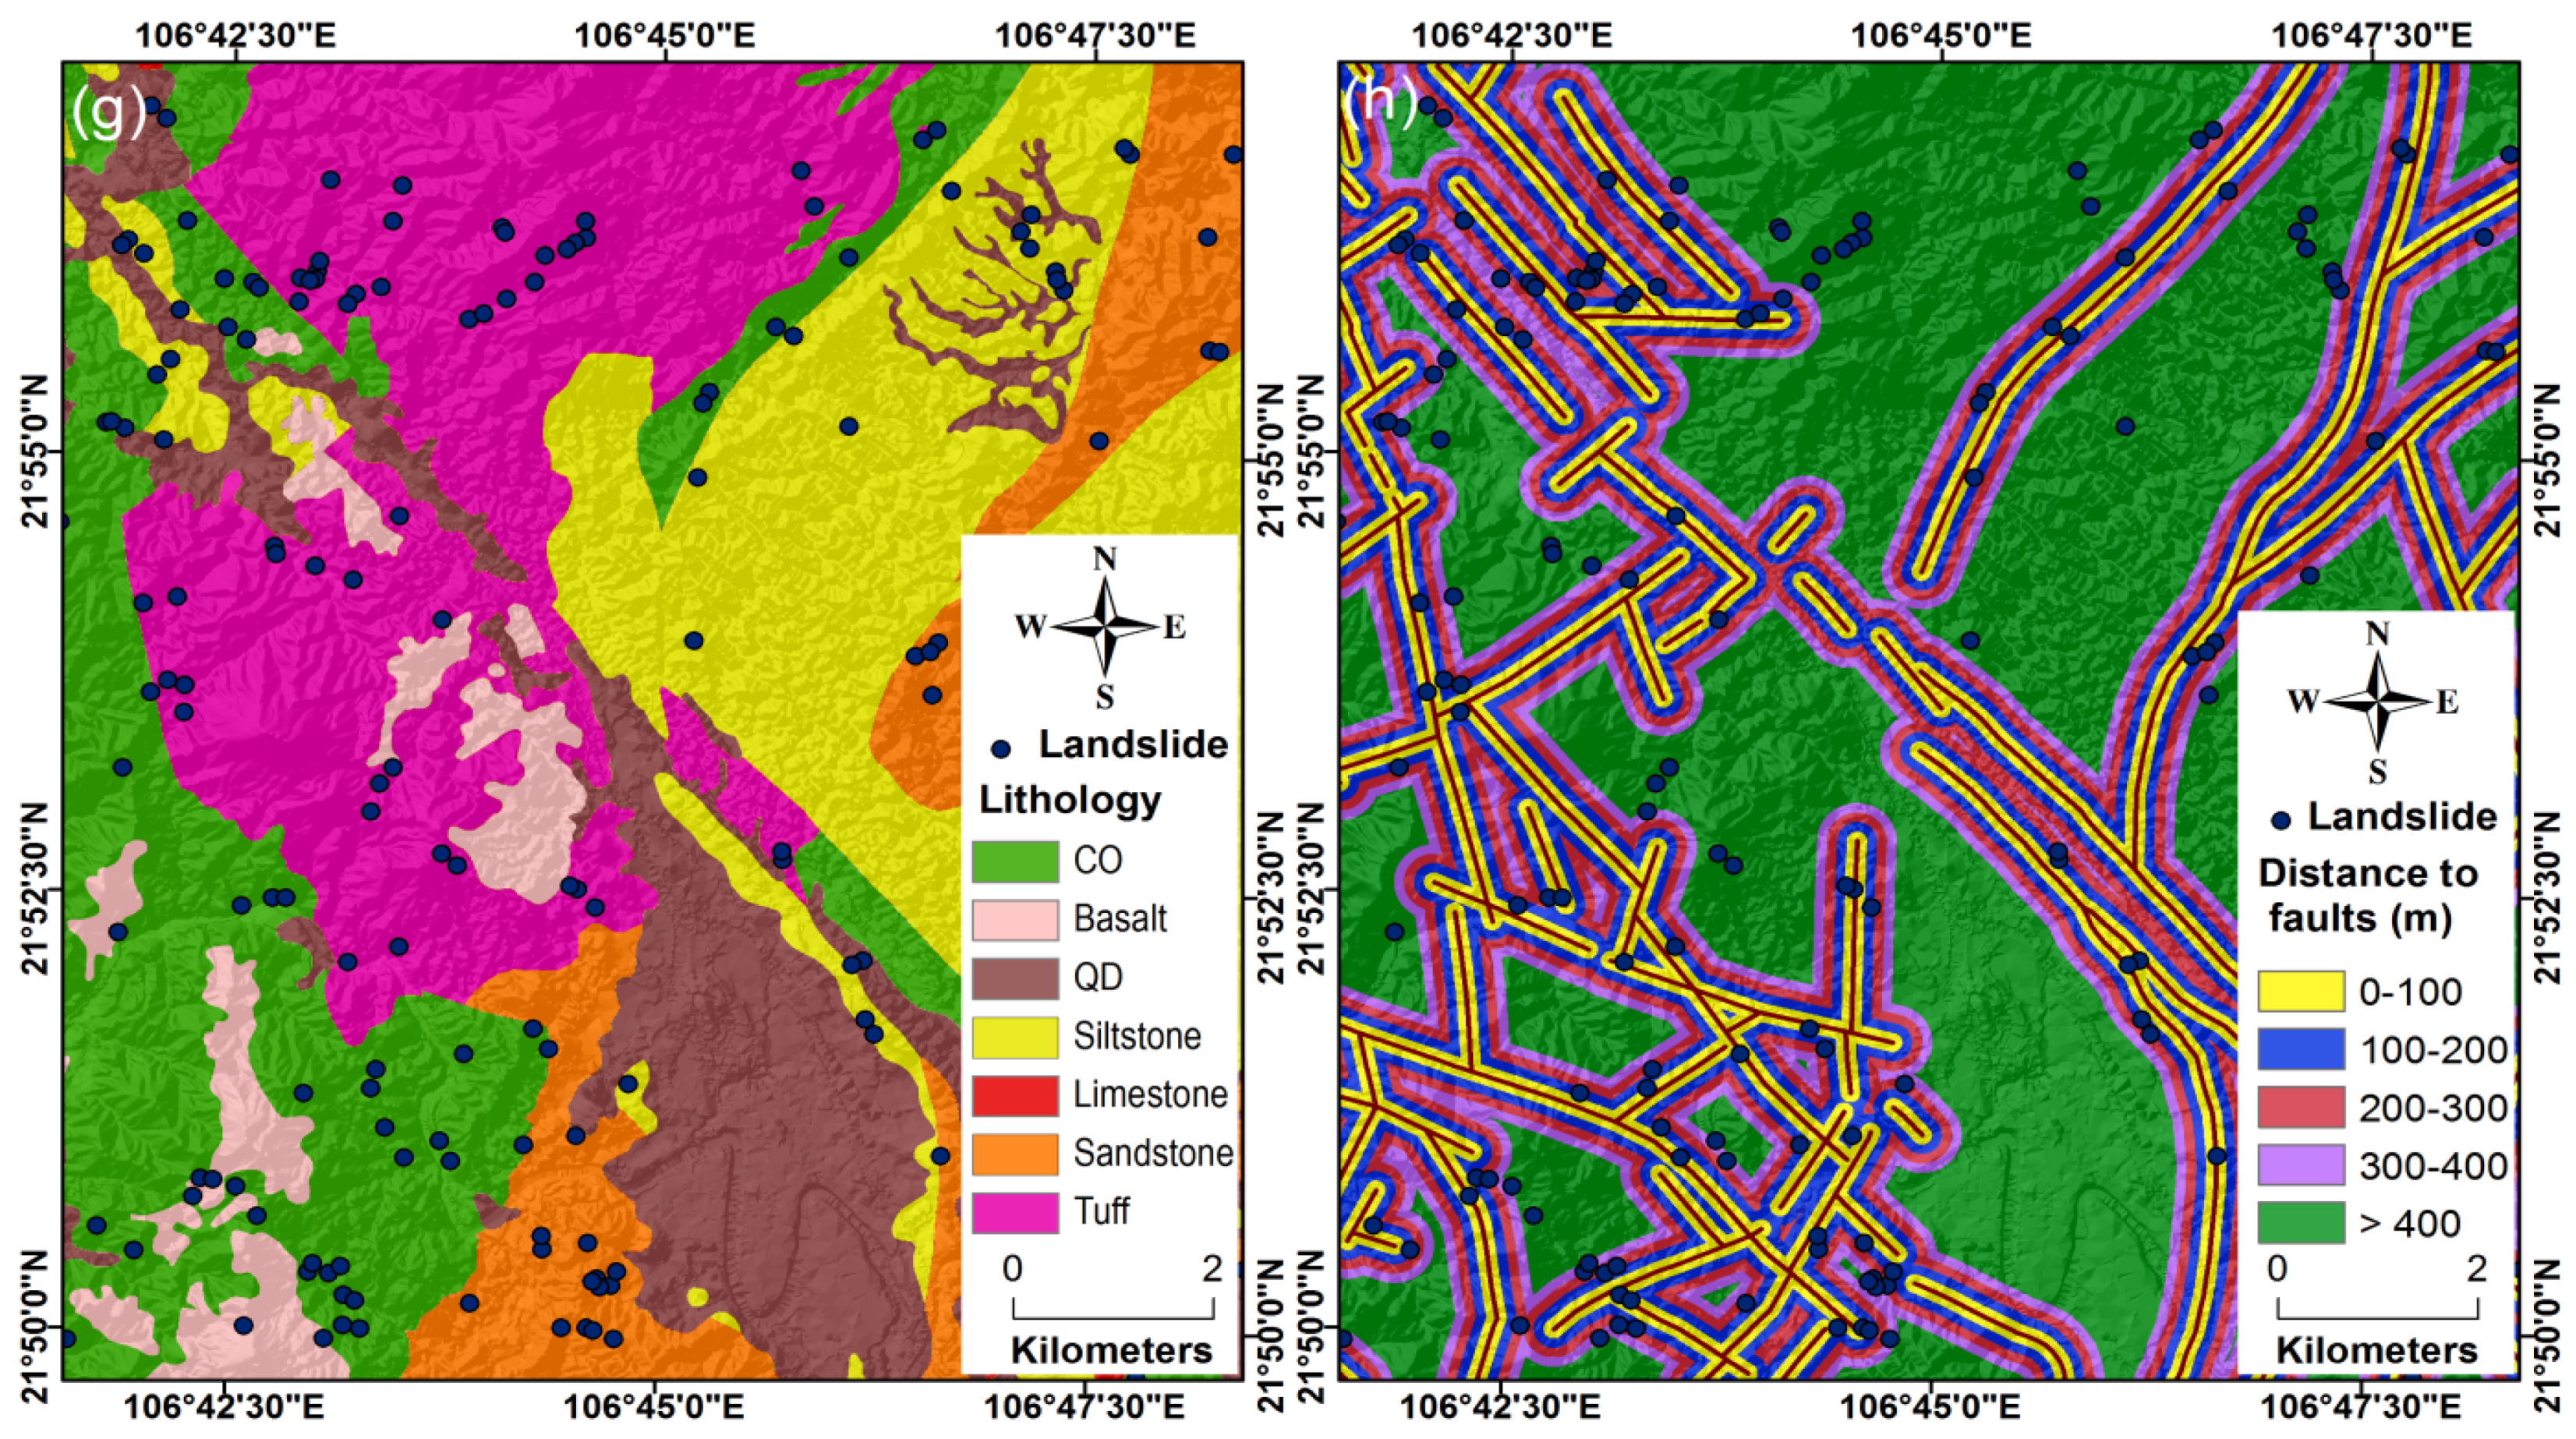
| 13 | Lithology | (1) Conglomerate; (2) Basalt; (3) Quaternary deposit; (4) Siltstone; (5) Limestone; (6) Sandstone; (7) Tuff |
| 14 | Distance to faults (m) | (1) 0–100; (2) 100–200; (3) 200–300; (4) 300–400; (5) >400 |
| No | Distance Metrics | Classification Accuracy (%) | |
|---|---|---|---|
| Training Data | Validation Data | ||
| 1 | Euclidean | 83.3 | 74.4 |
| 2 | Manhattan | 83.4 | 75.9 |
| 3 | Chebyshev | 79.6 | 73.4 |
| 4 | Minkowski | 83.3 | 74.4 |
| No. | Influencing Factor | Tolerance | VIF | IG |
|---|---|---|---|---|
| 1 | Aspect | 0.88 | 1.14 | 0.20 |
| 2 | Slope | 0.38 | 2.63 | 0.19 |
| 3 | Sediment transport index | 0.16 | 6.15 | 0.11 |
| 4 | Stream power index | 0.18 | 5.68 | 0.06 |
| 5 | Distance to faults | 0.90 | 1.11 | 0.05 |
| 6 | Toposhade | 0.68 | 1.46 | 0.05 |
| 7 | Topographic wetness index | 0.59 | 1.69 | 0.05 |
| 8 | Curvature | 0.68 | 1.47 | 0.05 |
| 9 | Lithology | 0.88 | 1.14 | 0.04 |
| 10 | Landuse | 0.91 | 1.10 | 0.03 |
| 11 | Slop length | 0.46 | 2.19 | 0.03 |
| 12 | Soil type | 0.94 | 1.07 | 0.03 |
| 13 | Valley depth | 0.91 | 1.10 | 0.02 |
| 14 | Elevation | 0.91 | 1.11 | 0.01 |
| No | Parameter | Proposed Hybrid Model | Random Forest Model | J48 Decision Trees Model | Neural Nets Model |
|---|---|---|---|---|---|
| 1 | True positive | 3579 | 3637 | 3531 | 3528 |
| 2 | True negative | 2931 | 3385 | 3296 | 2781 |
| 3 | False positive | 214 | 156 | 262 | 265 |
| 4 | False negative | 862 | 408 | 497 | 1012 |
| 5 | PPV (%) | 94.4 | 95.9 | 93.1 | 93.0 |
| 6 | NPV (%) | 77.3 | 89.2 | 86.9 | 73.3 |
| 7 | Sensitivity (%) | 80.6 | 89.9 | 87.7 | 77.7 |
| 8 | Specificity (%) | 93.2 | 95.6 | 92.6 | 91.3 |
| 9 | Accuracy (%) | 85.8 | 92.6 | 90.0 | 83.2 |
| 10 | Kappa index | 0.716 | 0.851 | 0.799 | 0.663 |
| 11 | AUC | 0.948 | 0.981 | 0.942 | 0.905 |
| No | Parameter | Proposed Hybrid Model | Random Forest Model | J48 Decision Trees Model | Neural Nets Model |
|---|---|---|---|---|---|
| 1 | True positive | 1256 | 762 | 1017 | 1227 |
| 2 | True negative | 1278 | 1528 | 1421 | 1176 |
| 3 | False positive | 408 | 902 | 647 | 437 |
| 4 | False negative | 386 | 135 | 242 | 488 |
| 5 | PPV (%) | 75.5 | 45.8 | 61.1 | 73.7 |
| 6 | NPV (%) | 76.8 | 91.9 | 85.5 | 70.7 |
| 7 | Sensitivity (%) | 76.5 | 85.0 | 80.78 | 71.6 |
| 8 | Specificity (%) | 75.8 | 62.9 | 68.71 | 72.9 |
| 9 | Accuracy (%) | 76.1 | 68.8 | 73.3 | 72.2 |
| 10 | Kappa index | 0.523 | 0.376 | 0.466 | 0.444 |
| No | Pairwise Comparison | Chi-Square (χ2) | p-value | Significance |
|---|---|---|---|---|
| 1 | The hybrid model vs. Random Forest | 687.077 | <0.0001 | Yes |
| 2 | The hybrid model vs. J48 Decision Trees | 181.845 | <0.0001 | Yes |
| 3 | The hybrid model vs. Neural Net | 10.081 | 0.0015 | Yes |
© 2017 by the authors. Licensee MDPI, Basel, Switzerland. This article is an open access article distributed under the terms and conditions of the Creative Commons Attribution (CC BY) license (http://creativecommons.org/licenses/by/4.0/).
Share and Cite
Nguyen, Q.-K.; Tien Bui, D.; Hoang, N.-D.; Trinh, P.T.; Nguyen, V.-H.; Yilmaz, I. A Novel Hybrid Approach Based on Instance Based Learning Classifier and Rotation Forest Ensemble for Spatial Prediction of Rainfall-Induced Shallow Landslides using GIS. Sustainability 2017, 9, 813. https://doi.org/10.3390/su9050813
Nguyen Q-K, Tien Bui D, Hoang N-D, Trinh PT, Nguyen V-H, Yilmaz I. A Novel Hybrid Approach Based on Instance Based Learning Classifier and Rotation Forest Ensemble for Spatial Prediction of Rainfall-Induced Shallow Landslides using GIS. Sustainability. 2017; 9(5):813. https://doi.org/10.3390/su9050813
Chicago/Turabian StyleNguyen, Quang-Khanh, Dieu Tien Bui, Nhat-Duc Hoang, Phan Trong Trinh, Viet-Ha Nguyen, and Isık Yilmaz. 2017. "A Novel Hybrid Approach Based on Instance Based Learning Classifier and Rotation Forest Ensemble for Spatial Prediction of Rainfall-Induced Shallow Landslides using GIS" Sustainability 9, no. 5: 813. https://doi.org/10.3390/su9050813