
Adaptive Effectiveness of Irrigated Area Expansion in Mitigating the Impacts of Climate Change on Crop Yields in Northern China †

1
State Key Laboratory of Atmospheric Boundary Layer Physics and Atmospheric Chemistry, Institute of Atmospheric Physics, Chinese Academy of Sciences, Beijing 100029, China
2
School of Advanced Agricultural Sciences, Peking University, Beijing 1000871, China
3
BICIC, Beijing Normal University, Beijing 1000875, China
*
Author to whom correspondence should be addressed.
†
This paper was presented at the Global Land Programme 3rd Open Science Meeting, Beijing, China, 24–27 October 2016.
Sustainability 2017, 9(5), 851; https://doi.org/10.3390/su9050851
Submission received: 22 February 2017
/
Revised: 3 May 2017
/
Accepted: 12 May 2017
/
Published: 19 May 2017
(This article belongs to the Special Issue Sustainable Agriculture and Climate Change)
Abstract
:To improve adaptive capacity and further strengthen the role of irrigation in mitigating climate change impacts, the Chinese government has planned to expand irrigated areas by 4.4% by the 2030s. Examining the adaptive potential of irrigated area expansion under climate change is therefore critical. Here, we assess the effects of irrigated area expansion on crop yields based on county-level data during 1980–2011 in northern China and estimate climate impacts under irrigated area scenarios in the 2030s. Based on regression analysis, there is a statistically significant effect of irrigated area expansion on reducing negative climate impacts. More irrigated areas indicate less heat and drought impacts. Irrigated area expansion will alleviate yield reduction by 0.7–0.8% in the future but associated yield benefits will still not compensate for greater adverse climate impacts. Yields are estimated to decrease by 4.0–6.5% under future climate conditions when an additional 4.4% of irrigated area is established, and no fundamental yield increase with an even further 10% or 15% expansion of irrigated area is predicted. This finding suggests that expected adverse climate change risks in the 2030s cannot be mitigated by expanding irrigated areas. A combination of this and other adaptation programs is needed to guarantee grain production under more serious drought stresses in the future.
1. Introduction
Climate change poses serious challenges to Chinese agriculture [1,2,3]. In recent years, the ability to meet these challenges has been tested by several major extreme climate events. For example, the devastating drought in southwestern China in 2010 critically impaired local agriculture, resulting in an estimated loss of 317 million USD [4]. The average annual total cost of climate disasters is approximately 80 billion USD in China [5]. Climate extremes are anticipated to be aggravated and increasingly influenced by climate change. These conditions will constrain future growth in agricultural sectors; therefore, it is important to take actions to mitigate future climate risks.
Countervailing the current and future adverse climate risks will require adaptation measures. In 2011, the Chinese government announced an important policy requiring that 600 billion USD be invested in agricultural irrigation [6]. The policy set several quantitative targets for improving irrigation over 10 years, starting in 2011. The most important plan is to expand the irrigated area by 2.67 million ha (equivalent to a 4.4% increase). Although the quantitative target is clearly framed, concerns have been raised about the effectiveness of irrigated area expansion in climate risk mitigation [7].
To our knowledge, no study has evaluated the extent that the above irrigated area expansion plan [7] reduces the impacts of future climate change in China. Using process-based crop model and associated assumptions, some studies have evaluated the adaptation effectiveness of potential irrigation in facing climate change risks on Chinese agriculture. For example, assuming no crop water stress was predicted to mitigate 5–15% of the yield reduction in China under future climate scenarios [8,9]. However, the assumption of no water stress is unrealistic and difficult to link with the government plan. Several recent studies were encouraged to the integration of farming management methods into impact assessments as these methods greatly determine the degree of climate impacts on crops. For instance, fertilizer intensive farmers can largely reduce the negative effects of heat stresses in the UK, France and Italy, while the effect is small or even negative in other European countries [10]. On a global scale, vulnerability of key food crops to drought is also greatly dependent on socio-economic conditions and agricultural investments [11]. In China, recent studies have quantified the relationship among climate, crop and irrigation based on statistical data [3,12]. They employed a new data-driven approach, but the major disadvantage is a lack of socioeconomic data with fine spatial-temporal resolution. Furthermore, few of these analyses addressed potential adaptation under future climate scenarios.
Therefore, to understand the adaptation effectiveness of expanding the irrigated area in mitigating climate change impacts, the following objectives are specified in our study: (i) we quantitatively identify crop yield responses to climate and irrigated area based on county-level data during 1980–2011; (ii) we establish a statistical model to assess the adaptive effects of the irrigated areas expansion plan already underway on climate change mitigation; (iii) we explore future climate impacts on crop yields across different irrigated area scenarios.
2. Materials and Methods
2.1. Data and Pretreatment
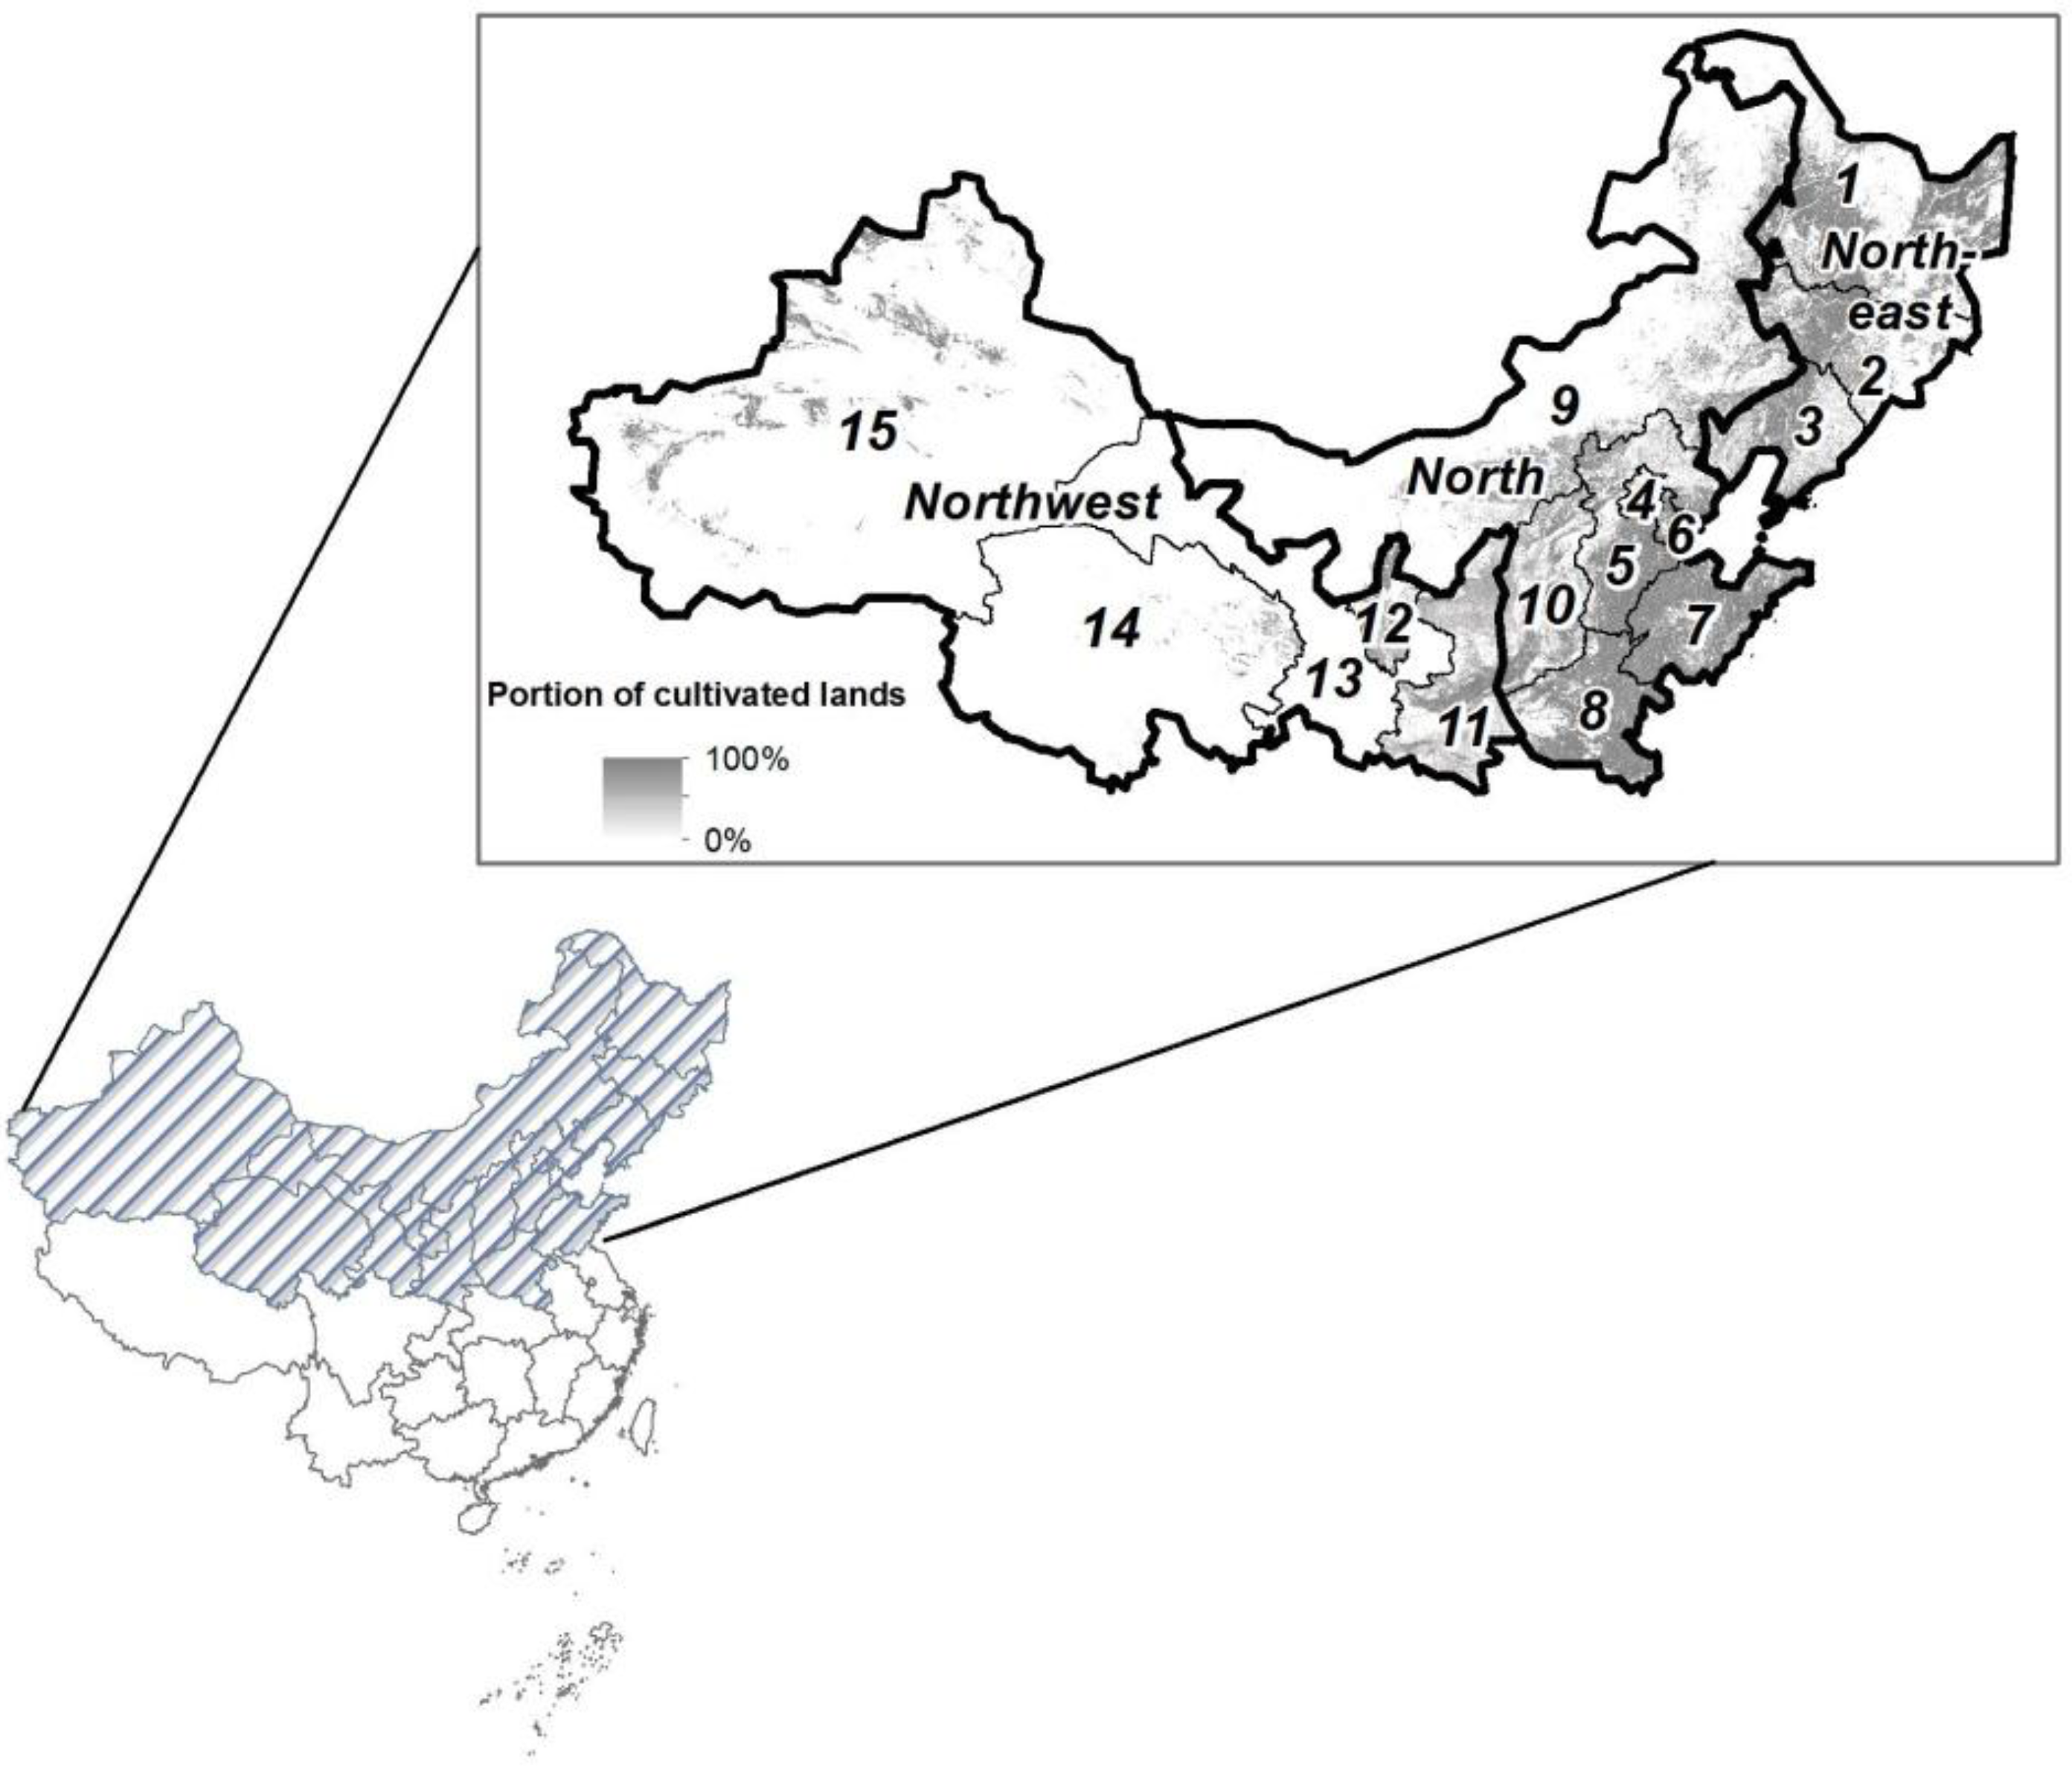
Our study region is in northern China (Figure 1) because of the increasingly important role the region plays in grain production. The region encompasses 50% of cultivated land and produces 56% of the annual grain production in China. The major grain production areas are the northeastern, northern, and eastern parts of northwestern China. Due to low precipitation and the uneven seasonal distribution of precipitation, crop production in northern China largely depends on irrigation.
Crop data used in the study were obtained from the Chinese Academy of Agricultural Sciences. These data include county-level sown areas and production data for rice, wheat, maize and soybean, which are the four major food crops in our study region, over the period 1980–2011. In addition, we considered county-level irrigated areas and cultivated land areas in our study region and period. Based on the definition by the National Standard of the People’s Republic of China [13] and the Food and Agriculture Organization of the United Nations [14], “irrigated area” is the area equipped to be irrigated and it is the most often-used index to quantify irrigation level in earlier studies [3,12]. Percentage of irrigated area (PIA) was calculated based on Equation (1), which represents the irrigated areas relative to sowing areas, an index quantifying irrigated conditions, for each county in each year.
where PIAc,t is the percentage of irrigated area (%), IRRIc,t is the irrigated area (ha), and CulAreac,t is the cultivated land area (ha) of county c in year t.
As crop-specific data for irrigated area are not available, we lump data of the four crops to match the PIA data (Equation (2)).
where is the yields of the four crops weighted in each county by sown area (ton ha−1); ricePc,t, wheatPc,t, maizePc,t and soybeanPc,t (ton) are the production of rice, wheat, maize, and soybean, respectively; and riceAc,t, wheatAc,t, maizeAc,t and soybeanAc,t (ha) are the sown area of rice, wheat, maize and soybean, respectively, of county c in year t.
Daily temperature and precipitation data in 756 climate stations were downloaded from the China Meteorology Data Sharing Service System [15]. Quality controls and homogenization of these climate data have been executed by the Chinese Meteorological Administration. To derive climate data for each county, we estimated daily climate data using the algorithm presented by Thornton et al. [16]. This algorithm interpolates the abovementioned data of the 756 climate stations into 10 km grid cells and then extracts climatic information for each county from the grid data. The daily grid climatic dataset has been used in a previous study [17]. Subsequently, we calculated the daily climate data for each county by zonal averaging, and then aggregated the daily data into monthly climate data. To represent drought severity, we calculated the monthly Standardized Precipitation Evapotranspiration Index (SPEI) for each county. SPEI is a multi-scalar drought index calculated based on a climatic water balance model [18] considering the role of both precipitation and evapotranspiration. An R package, “SPEI” (https://cran.r-project.org/web/packages/SPEI/), was used to calculate the index with the lag set to 1 month to quantify the monthly moisture conditions due to the climate of the same month. Next, we calculated the mean-growing-season average temperature (Tavg) and SPEI for each crop. The growing season period for each crop was derived from the Chinese Agricultural Phenology Atlas [19] (Table 1). Finally, to match the PIA data, Tavg and SPEI were aggregated as weighted by the sown area of the four crops in each year (Equations (3) and (4)).
where Tavgc,t is the mean-growing-season average temperature weighted by sown area; riceTavgc,t, wheatTavgc,t, maizeTavgc,t and soybeanTavgc,t are the mean growing season average temperature for rice, wheat, maize and soybean, respectively; and riceAc,t, wheatAc,t, maizeAc,t and soybeanAc,t are the sown area for rice, wheat, maize and soybean, respectively, of county c in year t.
where SPEIc,t is the mean-growing-season average SPEI weighted by sown area; riceSPEIc,t, wheatSPEIc,t, maizeSPEIc,t and soybeanSPEIc,t are the mean growing season average SPEI for rice, wheat, maize, and soybean, respectively; and riceAc,t, wheatAc,t, maizeAc,t and soybeanAc,t are the sown area for rice, wheat, maize, and soybean, respectively, of county c in year t.
2.2. Statistical Model
To evaluate the relationship of climate, yield and PIA, we established a fixed-effect regression model, as given in Equation (5).
where Yc,t is yield for the four crops weighted by sown area in Equation (2) (ton ha−1), PIAc,t is the percentage of irrigated area in Equation (1) (%); Tavgc,t and SPEIc,t are respectively the mean-growing-season temperature (Equation (3)) and SPEI (Equation (4)) weighted by the sown area of the four crops of county c in year t; County is the dummy variable for county; Year denotes time; and is the error term. are the regression coefficients for each term.
In this model, we used quadratic terms for PIA, Tavg, and SPEI to account for the fact that crops perform best under moderate management and climate conditions and are harmed by extreme cold, hot, dry, or wet field conditions. In addition, we considered the potential interactions between irrigation and climate variables in this model, which represent the changes in climate impacts under different irrigation conditions. Unobserved possible nonlinear time trends at the county level were controlled by using county-by-year linear and quadratic terms and unobserved time-constant variations between counties using a county fixed effect. Consistent with other studies based on statistical model [20], CO2 effects were not considered. Therefore, results in this study reflect the possible largest impacts from climate change.
The accuracy of the model was evaluated using a bootstrap analysis [21]. By constructing a number of re-samples and replacing the observations, this analysis evaluated the model accuracy defined by confidence intervals. More specifically, years were chosen randomly with replacements for 1000 iterations to estimate the regression coefficients of the model. Then, 1000 sets of regression coefficients were derived, which were then used to calculate yield changes by inputting future climate conditions. The confidence interval not spanning zero indicates a significant effect. Here, the median value and 95% confidence interval (95% CI) of those regression coefficients are reported.
2.3. Climate Scenarios
The climate change projections were taken from the Program for Climate Model Diagnosis and Inter-comparison—Coupled Model Inter-comparison Project Phase 5 for two representative concentration pathways (RCP2.6 and RCP8.5) in our study region. This ensemble climate scenarios were simulated by 26 climate models (Supplementary Materials Table S1). RCP2.6 represents a low emission pathway, i.e., greenhouse gas emissions peak between 2010 and 2020 with emissions declining substantially thereafter; RCP8.5 is a high emission pathway, i.e., emissions continue to rise throughout the 21st century.
The baseline period was set to 1980–2011, consistent with our observations, and the future period was 2020–2039 (referred to as 2030s hereafter), the target period for the abovementioned irrigated areas expansion plan. Following the steps for processing observed climate data described in Section 2.1, we derived the mean-growing-season Tavg and SPEI weighted by the sown areas of four crops for each county-year pair based on the future climate scenarios (here, we assume there is no change in the growing areas of the four crops). The difference in anticipated growing-season Tavg and SPEI relative to the baseline climate was input into our statistical model.
2.4. Irrigated Area Scenarios
To explore the effectiveness of irrigated area expansion on mitigating climate impacts, we considered four scenarios of irrigated areas: no change in PIA, 4.4% increase in PIA, 10% increase in PIA, and 15% increase in PIA. Note the maximum value of PIA is 100%. So, in cases where the PIA was greater than 100% after the addition, we reset it to 100%. No change in PIA indicates the scenario without adaptation, a 4.4% increase in PIA is consistent with the existing irrigated area expansion plan, and the last two scenarios (increased PIA by 10% and 15%) indicate potential adaptations if irrigated areas are further amplified.
3. Results
3.1. Irrigated Areas and Crop Yields under the Baseline Climate
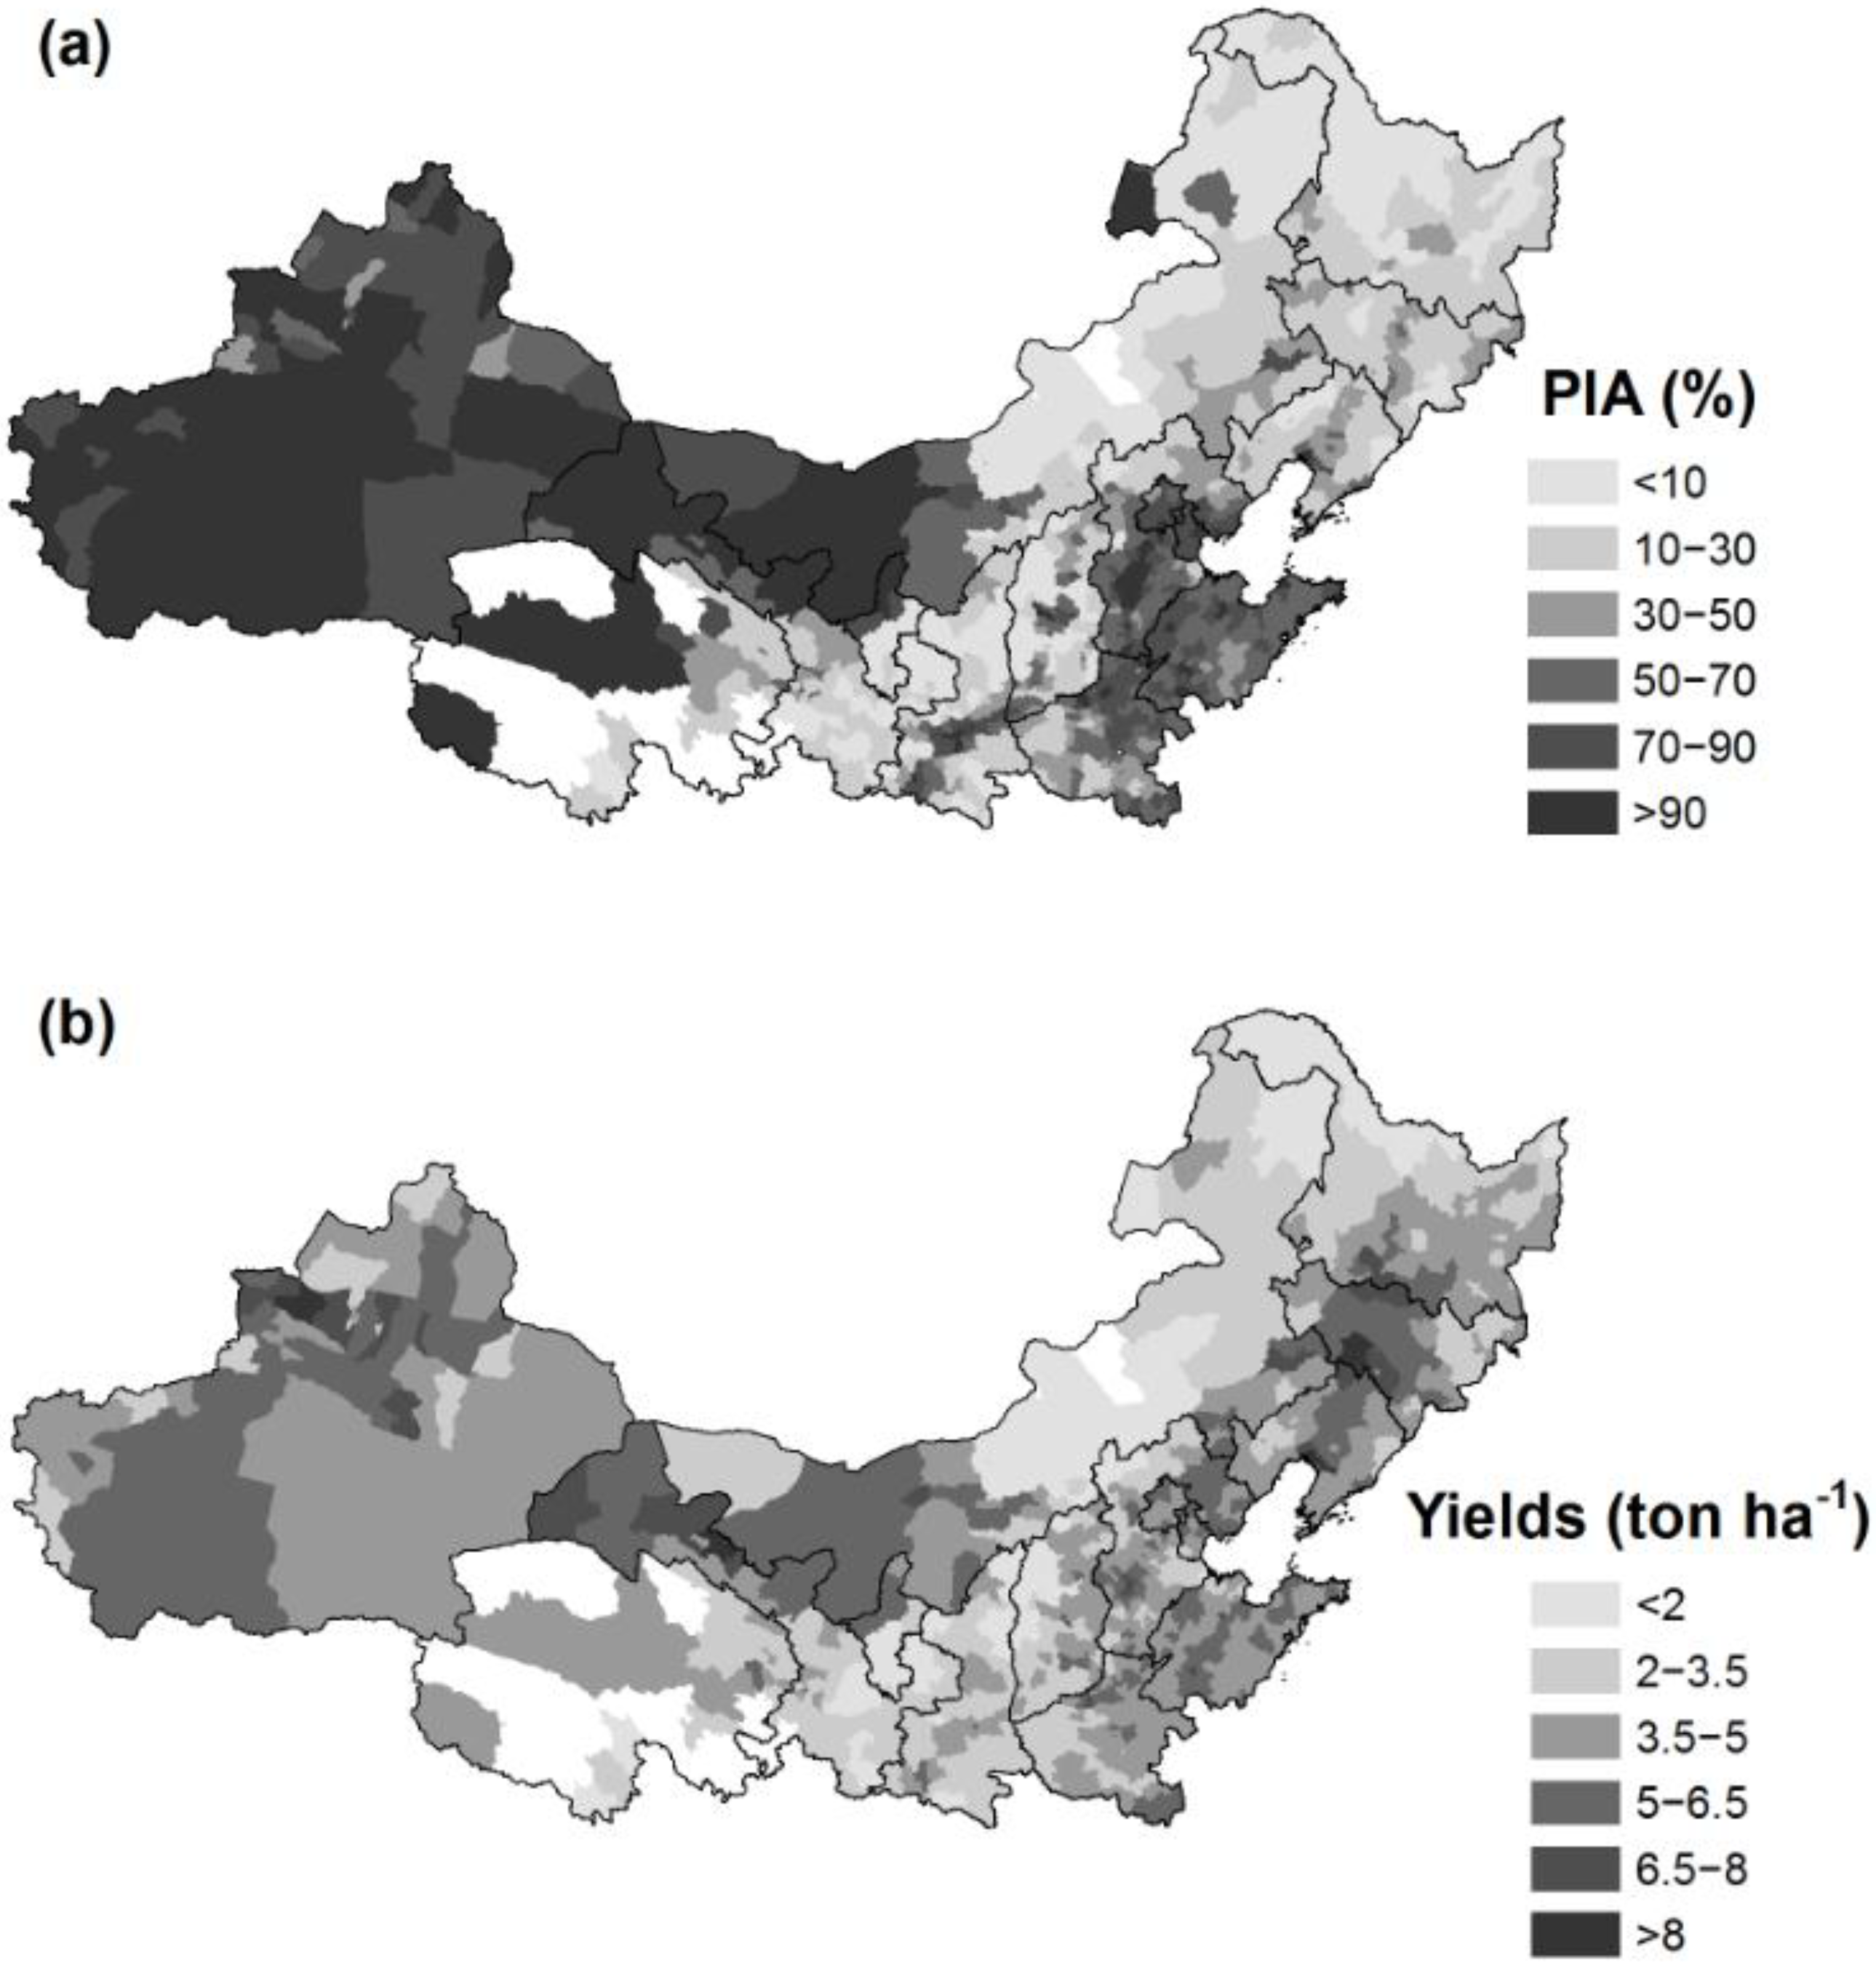
Figure 2 demonstrates the average observed PIA and crop yield sover the 1980—2011. The PIA varies by locations (Figure 2a). Better irrigation conditions are exhibited particularly in northwestern China (more than 70%) compared with northern (10–70%) and northeastern (less than 50%) China. This result is a major reflection of climatic moisture status, with the dryer climate in the Northwest requiring more irrigation to maintain the local agriculture than in northern and northeastern China. In terms of the crop yields, the spatial distribution is less clear (Figure 2b). Crop yields in most counties vary between 3.5 and 6.5 t ha−1. Regions with relatively low yield include the northern region of the North and the southeastern region of northwestern China; yields vary between 2.0 and 3.5 t ha−1.
3.2. Effects of Climate and Irrigation on Crop Yields
A statistical model was established based on our data. Regression results of Tavg, SPEI, and PIA are presented in Table 2. We have also provided a graphical demonstration of the effects of the three individual variables on yields by artificially increasing Tavg by 1 °C, decreasing SPEI by 0.5, and increasing PIA by 10% based on above statistical model.
The full model shows a good agreement, with an R2 of 0.9771 (p < 0.001). The effect of the linear Tavg term on yields is statistically insignificant (p > 0.05 with 95% CI between −0.031 and 0.0088). In contrast, there is a significant relationship between the Tavg quadratic term and yields (p < 0.05 with 95% CI between −0.001 and −0.0001), as shown in Table 2. Given the present climate, 1 °C further warming would reduce yields by 0–3% in the majority of counties when the Tavg over the growing season is greater than 0°C (Figure 3a). For SPEI, both the linear and quadratic terms on yields are statistically significant (p < 0.001 with 95% CI between 0.24 and 0.28 for the linear term and between −0.16 and −0.12 for the quadratic term). With SPEI reduced by 0.5, crops growing above an SPEI of approximately 0.5 in the mean-growing season tend to benefit from the drought, whereas crops grown below this threshold are likely to show a declined yield (Figure 3b).
The effects of PIA and PIA2 on yields are both statistically insignificant (p > 0.05). The 95% CIs vary between −0.0013 and 0.0019 for the linear term and between −1.53 × 10⁻⁵ and 5.62 × 10⁻⁶ for the quadratic term (Table 2). CIs spanning zero suggest an inconsistent regression coefficient in the sign for each sub-sample generated using the bootstrap analysis. However, significant interaction effects of PIA on climate variables are shown (p < 0.001). The 95% CI for PIA × Tavg is between 0.00002 and 0.00013, while the 95% CI for PIA×SPEI is between −0.0033 and −0.0027 (Table 2). The estimated yield change is approximately 2% when the PIA increases by 10% (Figure 3c). This indicates that irrigated area expansion can alter the magnitude of climate impacts on yields.
3.3. Future Climate Scenario
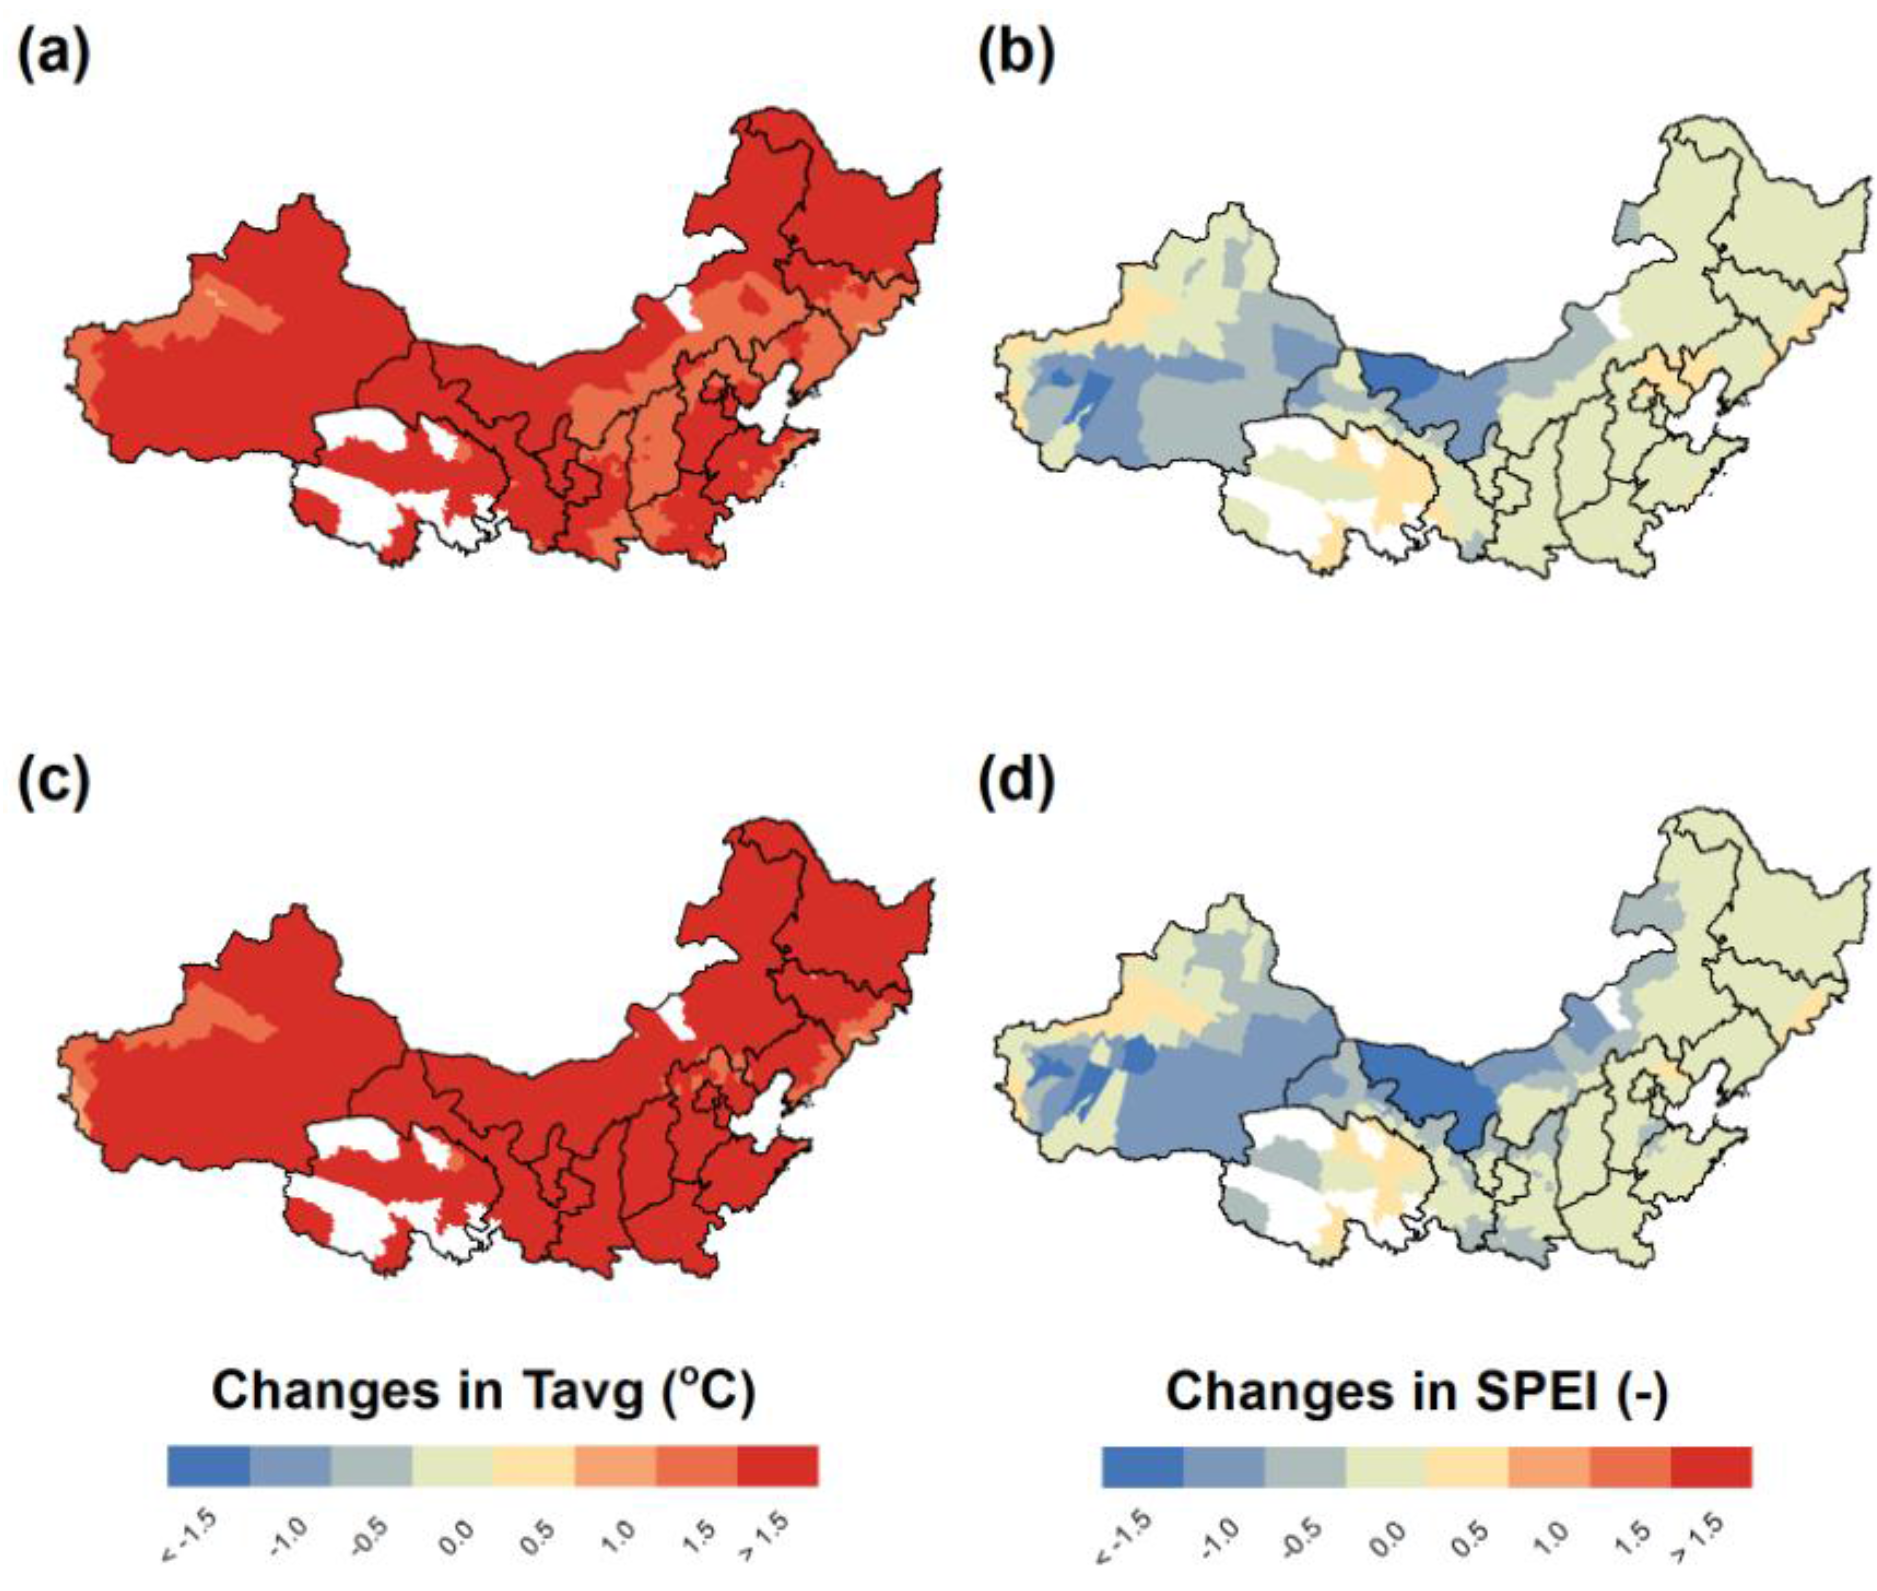
Based on climate model outputs, a warmer and dryer climate was projected in our study region (Figure 4). Under RCP2.6, it was predicted that Tavg would increase by 1–1.5 °C in northern China as well as the southern region of northeastern China and by more than 1.5 °C in other regions (Figure 4a). In addition, a dryer climate will prevail in most counties: SPEI will experience a 0.0–0.5 reduction in northeastern and most areas of northern China, and more serious decreases in SPEI (0.5–1.5) will occur in northwestern China and parts of northern China (Figure 4b). Under the RCP8.5 scenario, the increase in Tavg will be at least 1.0 °C and most counties will experience a warming with more than 1.5 °C (Figure 4c) relative to the baseline climate. The magnitude of SPEI reduction is also greater (Figure 4d) than in RCP2.6, especially in the central region of northwestern China, where SPEI is estimated to be reduced by approximately 1.0.
3.4. Climate Impacts on Yields under Three Irrigated Area Scenarios
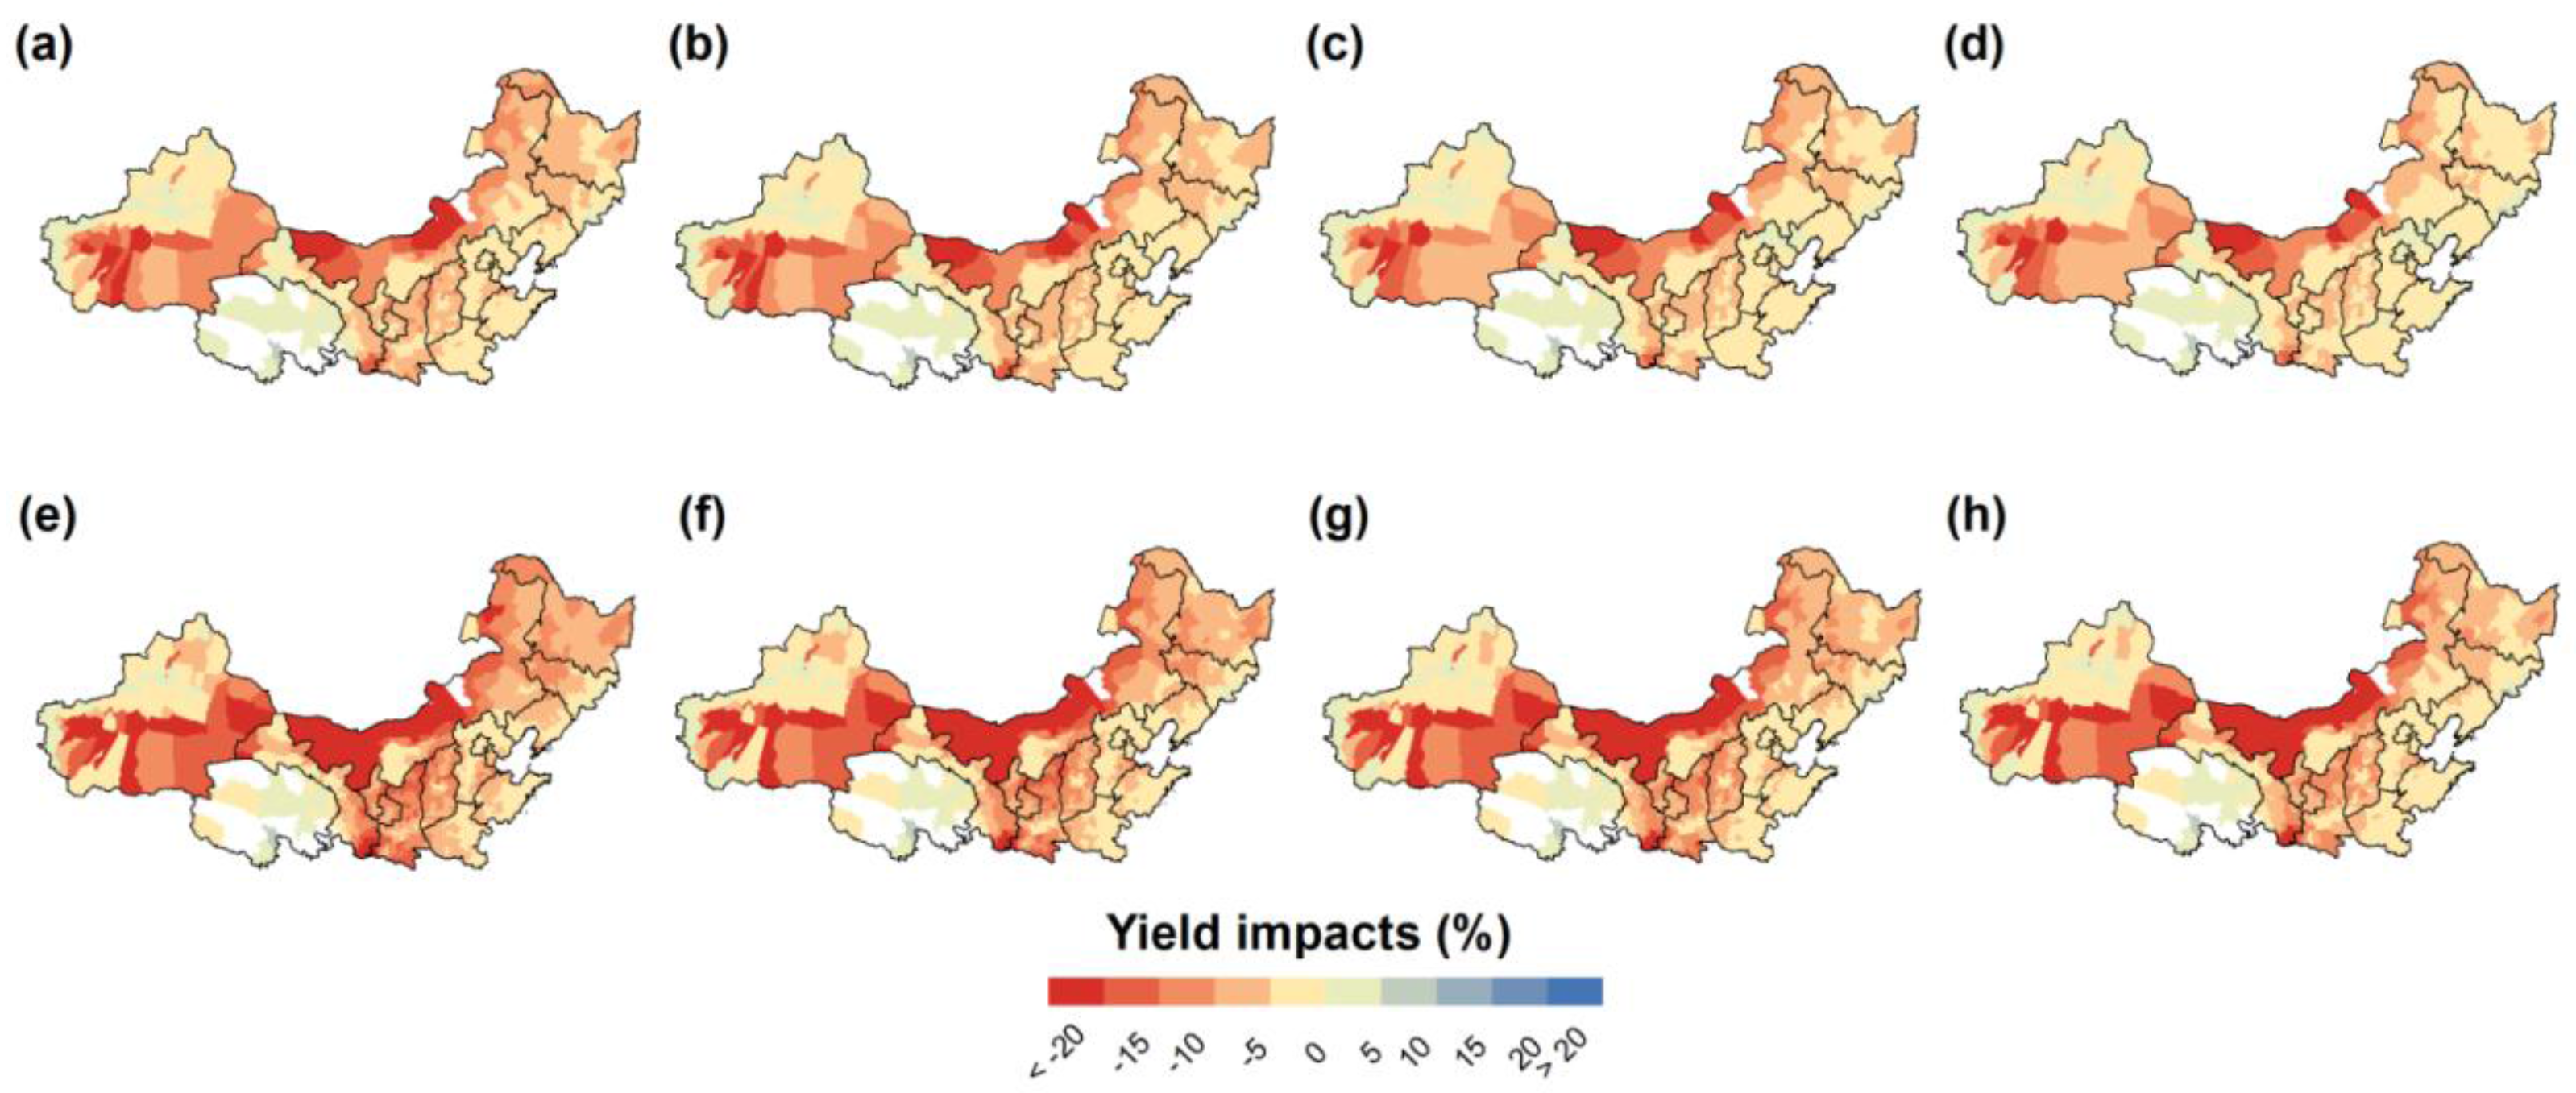
Maintaining the PIA at the baseline climate is anticipated to reduce yields under future climate scenarios, with yields decreasing by 4.7% for the climate under the RCP2.6 scenario averaged over the study region (Table 3). More specifically, we predict 0–5% yield reductions in northeastern and the southern part of northern China, and certain counties in north and northwestern China would experience even more serious reductions, varying between 10% and 20% (Figure 5a). Under the RCP8.5 scenario, the reduction in yields is estimated to be approximately 7.3% (Table 3). Regions with the greatest yield reduction are predicted in the northern part of northern China and central northwestern China, where losses could exceed 20%. In the remaining areas, yields are projected to be reduced by 5–15% (Figure 5e).
Expanding irrigated areas can alleviate the yield reductions associated with climate impacts. Our model estimates that approximately 0.7% of yields could be saved by a 4.4% increase in PIA under the RCP2.6 climate scenario, and the predicted yield improvement is 0.8% under RCP8.5 (Table 3). Further expansions in PIA are projected to result in greater yield gains. Yield increases are 1.5% under RCP2.6 and 1.8% under RCP8.5 if PIA is expanded by 10%, and the values are 2.2% under RCP2.6 and 2.7% under RCP8.5 if PIA is expanded by 15% (Table 3). However, these yield benefits are still limited relative to adverse climate impacts. The regions with the greatest yield reductions are the northern part of northern China and central northwestern China. Yield could decrease by 5–20% under the RCP2.6 scenario (Figure 5b–d) and by 10–20% under the RCP8.5 scenario (Figure 5f–h). Yield decreases are comparably lower in the northeastern and southern regions of northern China, with 0–15% decreases under RCP2.6 (Figure 5b–d) and 5–15% decreases under RCP8.5 (Figure 5f–h).
4. Discussion
4.1. Yield Responses to Climate and Irrigated Areas
Our results demonstrate a significant effect of climate variables on crop yields. Increases in Tavg are harmful to yields, with a 0–2% yield reduction per additional 1 °C Tavg, because of the associated shorter growing season [14]. Lower yields will be caused by drought in most counties except under very moist climate conditions (i.e., SPEI is approximately 0.5), where yields will be increased. The inverse yield responses to SPEI are associated with less severe water logging and disease under a very wet climate, and hence higher yields, when SPEI is reduced [22,23].
Our model detected a statistically significant effect for the interaction terms of irrigation and climate variables, suggesting that expanding irrigated areas can reduce climate impacts. More specifically, with more irrigated areas, yield reductions caused by heat and drought stresses would be lower. However, our results also indicate that the effects of irrigated area expansion are still very weak on crop yields; the median magnitude is only an approximately 2% yield increase with 10% higher PIA. This finding suggests that the extent to which current irrigation practices will mitigate the negative impacts of climate are quite insufficient in China.
Two primary factors might explain the weak yield response to increased irrigated areas. First and potentially most important, expansions in irrigated areas are not associated with more irrigation water. As noted by theFood and Agriculture Organization of the United Nationsin regard to the definition of irrigated area [14]: “Due to several reasons (e.g., crop rotation, water shortages, and damage of infrastructure) the area actually irrigated maybe significantly lower than the area equipped for irrigation”. This means that irrigated area data do not reflect the actual accessibility of irrigation water, even though the data of irrigated area is the current primary data to quantify irrigation level. Agricultural water shortage growing in magnitude and frequency in the current [24] and future [25] climate is the main reason. Second, the household contract system was created in 1979, and the use rights of farmland were evenly distributed to the farmers by group farmland ownership [26]. These contracts encouraged farmers to work on their own farmlands but also partially shifted responsibilities previously taken care of by the government to individual farmers, which the farmers could not afford, such as irrigation infrastructure maintenance and repair [27]. Based on a survey conducted by the Ministry of Water Resources of the People’s Republic of China in 2006, only 50% of household-based irrigation infrastructures are available to irrigate and 35% of areas categorized as irrigated areas cannot be irrigated [28].
4.2. Future Climate Impacts and Adaptation by Expanding Irrigated Areas
In the 2030s, a warmer and dryer climate is anticipated, posing a serious challenge to agricultural outputs and irrigation water resources over our study region. Expanding irrigated area was projected to save yields from harmful climate impacts. However, such yield benefits are quite limited compared with the negative climate impacts. Similar yield reductions were projected even when irrigated areas are increased by 15%. The scenario experiments demonstrate that yield losses are difficult to avoid under future climate no matter how the irrigated area will be increased.
The model output in our study is not consistent with earlier assessments, which investigated the potential adaptive effects of expanding irrigation using process-based models by assuming different irrigation schemes [29] or assuming no water stress [8]. In theory, there is significant potential for improving irrigation to mitigate the harmful impacts of both of heat and drought on crops [30]. However, in practice, the adaptive potential will not be fully realized. As our study has quantified, the effects of expansion of the irrigated area have little influence on yields due to the aforementioned reasons and thus cannot fundamentally countervail the expected adverse climate change impacts in the 2030s. This finding suggests that the effects of expanding the irrigated area are restricted.
4.3. Implications for the Adaptive Policies for Climate Change in China
Anticipated yield reductions across the irrigated area scenarios suggest that expanding the irrigated area alone cannot achieve our expected climate risk mitigation in the 2030s. Therefore, other solutions are needed. For example, water-saving irrigation technology has been found to reliably increase grain yields while using less water [31]. The adoption of water-saving irrigation technology in sown areas is currently very limited in China [32,33]. According to a farmers’ survey across seven provinces in China, only 32% and 4% of sown areas are equipped with household-based and community-based water-saving irrigation technologies, respectively [34]. In northern China, water saving technologies have been reported to show a great potential to reduce water use and improve crop productivities. By using these new technologies, irrigated water reduces by 11.7% and water use efficiency (i.e., yield produced per unit of water) increases by 27.8% for wheat; and the irrigated water saving and water use efficiency improvements are 23.0% and 17.6% for maize, respectively [35]. Therefore, with the low application and substantial potential, water-saving irrigation technology innovation appears to be a more promising approach than establishing more irrigated areas.
Other adaptive measures helpful to improving water use efficiency should not be overlooked. For instance, due to advances in breeding technology, new rice cultivars with high-water efficiency have been bred in China [36], exhibiting a yield advantage of 31–36% under drought [37]. Therefore, policies aimed at climate stress-tolerance cultivars appear to be beneficial to adapting to climate stresses in the future. In addition, the major reason for the future drought is increased evapotranspiration associated with warming [38], thus some technologies that can reduce evapotranspiration, such as plastic sheeting and low-tillage, will be also very helpful. Linking seasonal climate forecasting with crop choice can thus provide another potential climate adaptation. Other adaptation options, including multiple rather than individual adaptive measures, appear more realistic to help reduce future climate risks and should be addressed in future studies.
Finally, it is necessary to develop a new index to represent actual irrigation and water availability at fairly fine resolution. Even though irrigated area is widely used in many earlier works [3,12], its use tends to lack adequate consideration of actual irrigation water and associated adaptive effectsas we showed in this study. Such a new index will prove critical when developing relevant agricultural water use policies.
5. Conclusions
To address the effectiveness of expanding the irrigated area in order to mitigate future climate stresses, this study used county-level data to quantify the adaptive effects of irrigated areas on crop yields and anticipated change in yields under future climate across different irrigated area scenarios. We concluded that expanding irrigated areas cannot countervail future adverse climate impacts on crop yields in northern China. This limitation is primarily attributed to the underutilization of the irrigated area during drought due to water shortage and impaired irrigation infrastructure. Therefore, we hypothesize that the key to improving the resilience of Chinese agriculture under climate impacts is not the size of the irrigated area but, rather, modernizing irrigation. This target change needs to be quantitatively addressed, as it has not been clearly framed in existing policy. Furthermore, the irrigated area expansion plan will require the complementation of other adaptation programs, such as crop breeding and seasonal forecasting. These practices will be particularly useful in regions facing shortages of agricultural water resources. The suitability of different adaptation programs in different regions must be identified in future investigations.
Within the limits of available data, the statistical models used here have been applied to groups of crops and irrigated areas together without crop-specific analysis. These limitations could be overcome with further work by developing an enhanced spatially intensive dataset that further separates agricultural resource inputs for individual crops. In addition, clear knowledge and integrated assessment models to inform farmers’ adaptive reactions to climate extremes are in high demand. Such information would enable more accurate predictions of the adaptation potential, costs and benefits, and the agricultural system could be modified based on predicted climate change scenarios.
Supplementary Materials
The following are available online at www.mdpi.com/2071-1050/9/5/851/s1, Table S1: Climate models used to simulate ensemble climate scenarios.
Acknowledgments
This work was funded by the National Natural Science Foundation of China (41661144006; 31661143012; 41301044). We appreciated the insightful suggestions of anonymous reviewers and Zhi Chen in helping to improve this paper.
Author contributions
Tianyi Zhang and Jinxia Wang conceived and designed the study; Tianyi Zhang and Jinxia Wang performed the analysis; Tianyi Zhang and Yishu Teng collected data; Tianyi Zhang wrote the paper and all other authors provided comments on the earlier versions of this manuscript.
Conflicts of Interest
The authors declare no conflict of interest.
References
- Lin, E.; Xiong, W.; Ju, H.; Xu, Y.; Li, Y.; Bai, L.; Xie, L. Climate Change Impacts on Crop Yield and Quality with CO2 Fertilization in China. Philos. Trans. R. Soc. B 2005, 360, 2149–2154. [Google Scholar]
- Xiong, W.; Lin, E.; Ju, H.; Xu, Y. Climate Change and Critical Thresholds in China’s Food Security. Clim. Chang. 2007, 81, 205–221. [Google Scholar] [CrossRef]
- Zhang, T.; Simelton, E.; Huang, Y.; Shi, Y. A Bayesian Assessment of the Current Irrigation Water Supplies Capacity under Projected Droughts for the 2030s in China. Agric. For. Meteorol. 2013, 178, 56–65. [Google Scholar] [CrossRef]
- The Food and Agriculture Organization of the United Nations (FAO). Drought. 2015. Available online: http://www.fao.org/docrep/017/aq191e/aq191e.pdf (accessed on 12 March 2016).
- Asian Development Bank. Addressing Climate Change Risks, Disasters, and Adaptation in the People’s Republic of China; Asian Development Bank: Mandaluyong City, Philippines, 2015. [Google Scholar]
- Communist Party of China (CPC). Chinese Central Government’s Official Web Portal, China’s Spending on Water Conservation Doubles During 11th Five-Year Plan. 2011. Available online: http://www.gov.cn/jrzg/2011–01/29/content_1795245.htm (accessed on 12 March 2016).
- Yu, C. China’s water crisis needs more than words. Nature 2011, 470, 307. [Google Scholar] [CrossRef] [PubMed]
- Challinor, A.; Simelton, E.; Fraser, E.; Hemming, D.; Collins, M. Increased crop failure due to climate change: Assessing adaptation options using models and socio-economic data for wheat in China. Environ. Res. Lett. 2010, 5, 3. [Google Scholar] [CrossRef]
- Ju, H.; van der Velde, M.; Lin, E.; Xiong, W.; Li, Y. The impacts of climate change on agricultural production systems in China. Clim. Chang. 2013, 120, 313–324. [Google Scholar] [CrossRef]
- Reidsma, P.; Ewert, F.; Oude Lansink, A.; Leemans, R. Adaptation to climate change and climate variability in European agriculture: The importance of farm level responses. Eur. J. Agron. 2010, 32, 91–102. [Google Scholar] [CrossRef]
- Simelton, E.; Fraser, E.; Termansen, M.; Benton, T.; Gosling, S.; South, A. The socioeconomics of food crop production and climate change vulnerability: A global scale quantitative analysis of how grain crops are sensitive to drought. Food Secur. 2012, 4, 163–179. [Google Scholar] [CrossRef]
- Simelton, E.; Fraser, E.; Termansen, M.; Forster, P.; Dougill, A. Typologies of crop-drought vulnerability: An empirical analysis of the socio-economic factors that influence the sensitivity and resilience of drought of three major food crops in China (1961–2001). Environ. Sci. Policy 2009, 12, 438–452. [Google Scholar] [CrossRef]
- Ministry of Water Resources of China. Technical Terminology for Irrigation and Drainage; Ministry of Water Resources of China: Beijing, China, 1993; pp. 56–93.
- The Food and Agriculture Organization of the United Nations (FAO). Global Map of Irrigated Areas. 2010. Available online: http://www.fao.org/nr/water/aquastat/irrigationmap/index30.stm (accessed on 12 March 2016).
- China Meteorology Data Sharing Service. Daily climate dataset. Available online: http://cdc.nmic.cn/ (accessed on 12 March 2016).
- Thornton, P.; Running, S.; White, M.A. Generating surfaces of daily meteorological variables over large regions of complex terrain. J. Hydrol. 1997, 190, 214–251. [Google Scholar] [CrossRef]
- Zhang, T.; Huang, Y.; Yang, X. Climate warming over the past three decades has shortened 20 rice growth duration in China and cultivar shifts have further accelerated the 21 process for late rice. Glob. Chang. Biol. 2013, 19, 563–570. [Google Scholar] [CrossRef] [PubMed]
- Vicente-Serrano, S.; Begueria, S.; Lopez-Moreno, J. A multi-scalar drought index sensitive to global warming: The Standardized Precipitation Evapotranspiration Index-SPEI. J. Clim. 2010, 23, 1696–1718. [Google Scholar] [CrossRef]
- Zhang, F. Chinese Agricultural Phenology Atlas; Science Press: Beijing, China, 1987. [Google Scholar]
- Liu, B.; Asseng, S.; Müller, C.; Ewert, F.; Elliott, J.; Lobell, D.; Martre, P.; Ruane, A.; Wallach, D.; Jones, J.W.; et al. Similar estimates of temperature impacts on global wheat yield by three independent methods. Nat. Clim. Chang. 2016, 6, 1130–1136. [Google Scholar] [CrossRef]
- Lobell, D.; Burke, M.; Tebaldi, C.; Mastrandrea, M.; Falcon, W.; Naylor, R. Prioritizing climate change adaptation needs for food security in 2030. Science 2008, 319, 607–610. [Google Scholar] [CrossRef] [PubMed]
- Deng, X.; Huang, J.; Qiao, F.; Naylor, R.; Falcon, W.; Burke, M. Impacts of El Nino-Southern Oscillation events on China’s rice production. J. Geogr. Sci. 2010, 20, 3–16. [Google Scholar] [CrossRef]
- Zhang, T.; Zhu, J.; Wassmann, R. Responses of rice yields to recent climate changein China: An empirical assessment based on long-term observations at different spatial scales (1981–2005). Agric. For. Meteorol. 2010, 150, 1128–1137. [Google Scholar] [CrossRef]
- Shalizi, Z. Addressing China’s Growing Water Shortages and Associated Social and Environmental Consequences; World Bank Policy Research Working Paper: No. 3895; World Bank: Washington, DC, USA, 2006. [Google Scholar]
- Wang, S.; Zhang, Z. Effects of climate change on water resources in China. Clim. Res. 2011, 47, 77–82. [Google Scholar] [CrossRef]
- Chen, T.; Yabe, M. Study on the Formation of Household Management in Chinese Agriculture; Faculty of Agriculture Publications: Fukuoka, Japan, 2009. [Google Scholar]
- Xu, K. Why do irrigation infrastructures abandoned? Coop. Econ. China 2009, 2, 5. [Google Scholar]
- Zhang, C.; Li, D. The concept of reinforcing rural irrigation infrastructure constructions in modern China. China Rural Water Hydropower 2009, 7, 1–3. [Google Scholar]
- Chen, C.; Wang, E.; Yu, Q. Modeling wheat and maize productivity as affected by climate variation and irrigation supply in North China Plain. Agron. J. 2010, 102, 1037–1049. [Google Scholar] [CrossRef]
- Zhang, T.; Lin, X.; Sassenrath, G. Current irrigation practices in the central United States reduce drought and extreme heat impacts for maize and soybean but not for wheat. Sci. Total Environ. 2015, 508, 331–342. [Google Scholar] [CrossRef] [PubMed]
- Grassini, P.; Cassman, K. High-yield maize with large net energy yield and small global warming intensity. Proc. Natl. Acad. Sci. USA 2011, 109, 1074–1079. [Google Scholar] [CrossRef] [PubMed]
- Blanke, A.; Rozelle, S.; Lohmar, B.; Wang, J.; Huang, J. Water saving technology and saving water in China. Agric. Water Manag. 2007, 87, 139–150. [Google Scholar] [CrossRef]
- Liu, Y.; Huang, J.; Wang, J.; Rozelle, S. Determinants of agricultural water saving technology adoption: An empirical study of 10 provinces of China. Ecol. Econ. 2008, 4, 462–472. [Google Scholar]
- Cremades, R.; Wang, J.; Morris, J. Policies, Economic incentives and the adoption of modern irrigation technology in China. Earth Syst. Dyn. 2015, 6, 399–410. [Google Scholar] [CrossRef]
- Huang, Q.; Wang, J.; Li, Y. Do water saving technologies save water? Empirical evidence from North China. J. Environ. Econ. Manag. 2017, 82, 1–16. [Google Scholar] [CrossRef]
- Zhang, Q. Strategies for developing Green Super Rice. Proc. Natl. Acad. Sci. USA 2007, 104, 16402–16409. [Google Scholar] [CrossRef] [PubMed]
- Marcaida, M., III; Li, T.; Angeles, O.; Evangelista, G.; Fontanilla, M.; Xu, J. Biomass accumulation and partitioning of newly developed Green Super Rice (GSR) cultivars under drought stress during the reproductive stage. Field Crop. Res. 2014, 162, 30–38. [Google Scholar] [CrossRef]
- Chen, H.; Sun, J. Changes in drought characteristics over China using the standardized precipitation evapotranspiration index. J. Clim. 2015, 28, 5430–5447. [Google Scholar] [CrossRef]
Figure 1.
Illustration of the study region. The shaded area is northern China, which includes the Northeast, North and Northwest regions of China, as shown in the top-right figure. The number indicates the provinces involved in the study. 1: Heilongjiang; 2: Jilin; 3: Liaoning; 4: Beijing; 5: Hebei; 6: Tianjin; 7: Shandong; 8: Henan; 9: Inner Mongolia; 10: Shanxi; 11: Shaanxi; 12: Ningxia; 13: Gansu; 14: Qinghai; 16: Xinjiang.

Figure 2.
Percentage of irrigated area relative to the area of cultivated land (a); Crop yields for the four crops weighted in each county by sown area (b).
Figure 2.
Percentage of irrigated area relative to the area of cultivated land (a); Crop yields for the four crops weighted in each county by sown area (b).

Figure 3.
Model-estimated percentage yield changes for (a) 1 °C warmer mean-growing-season average temperature (Tavg); (b) 0.5 unit lower Standardized Precipitation Evapotranspiration Index (SPEI); and (c) 10% higher percentage of irrigated area (PIA). Each of the shaded areas shows the 95% confidence interval in the bootstrap analysis.
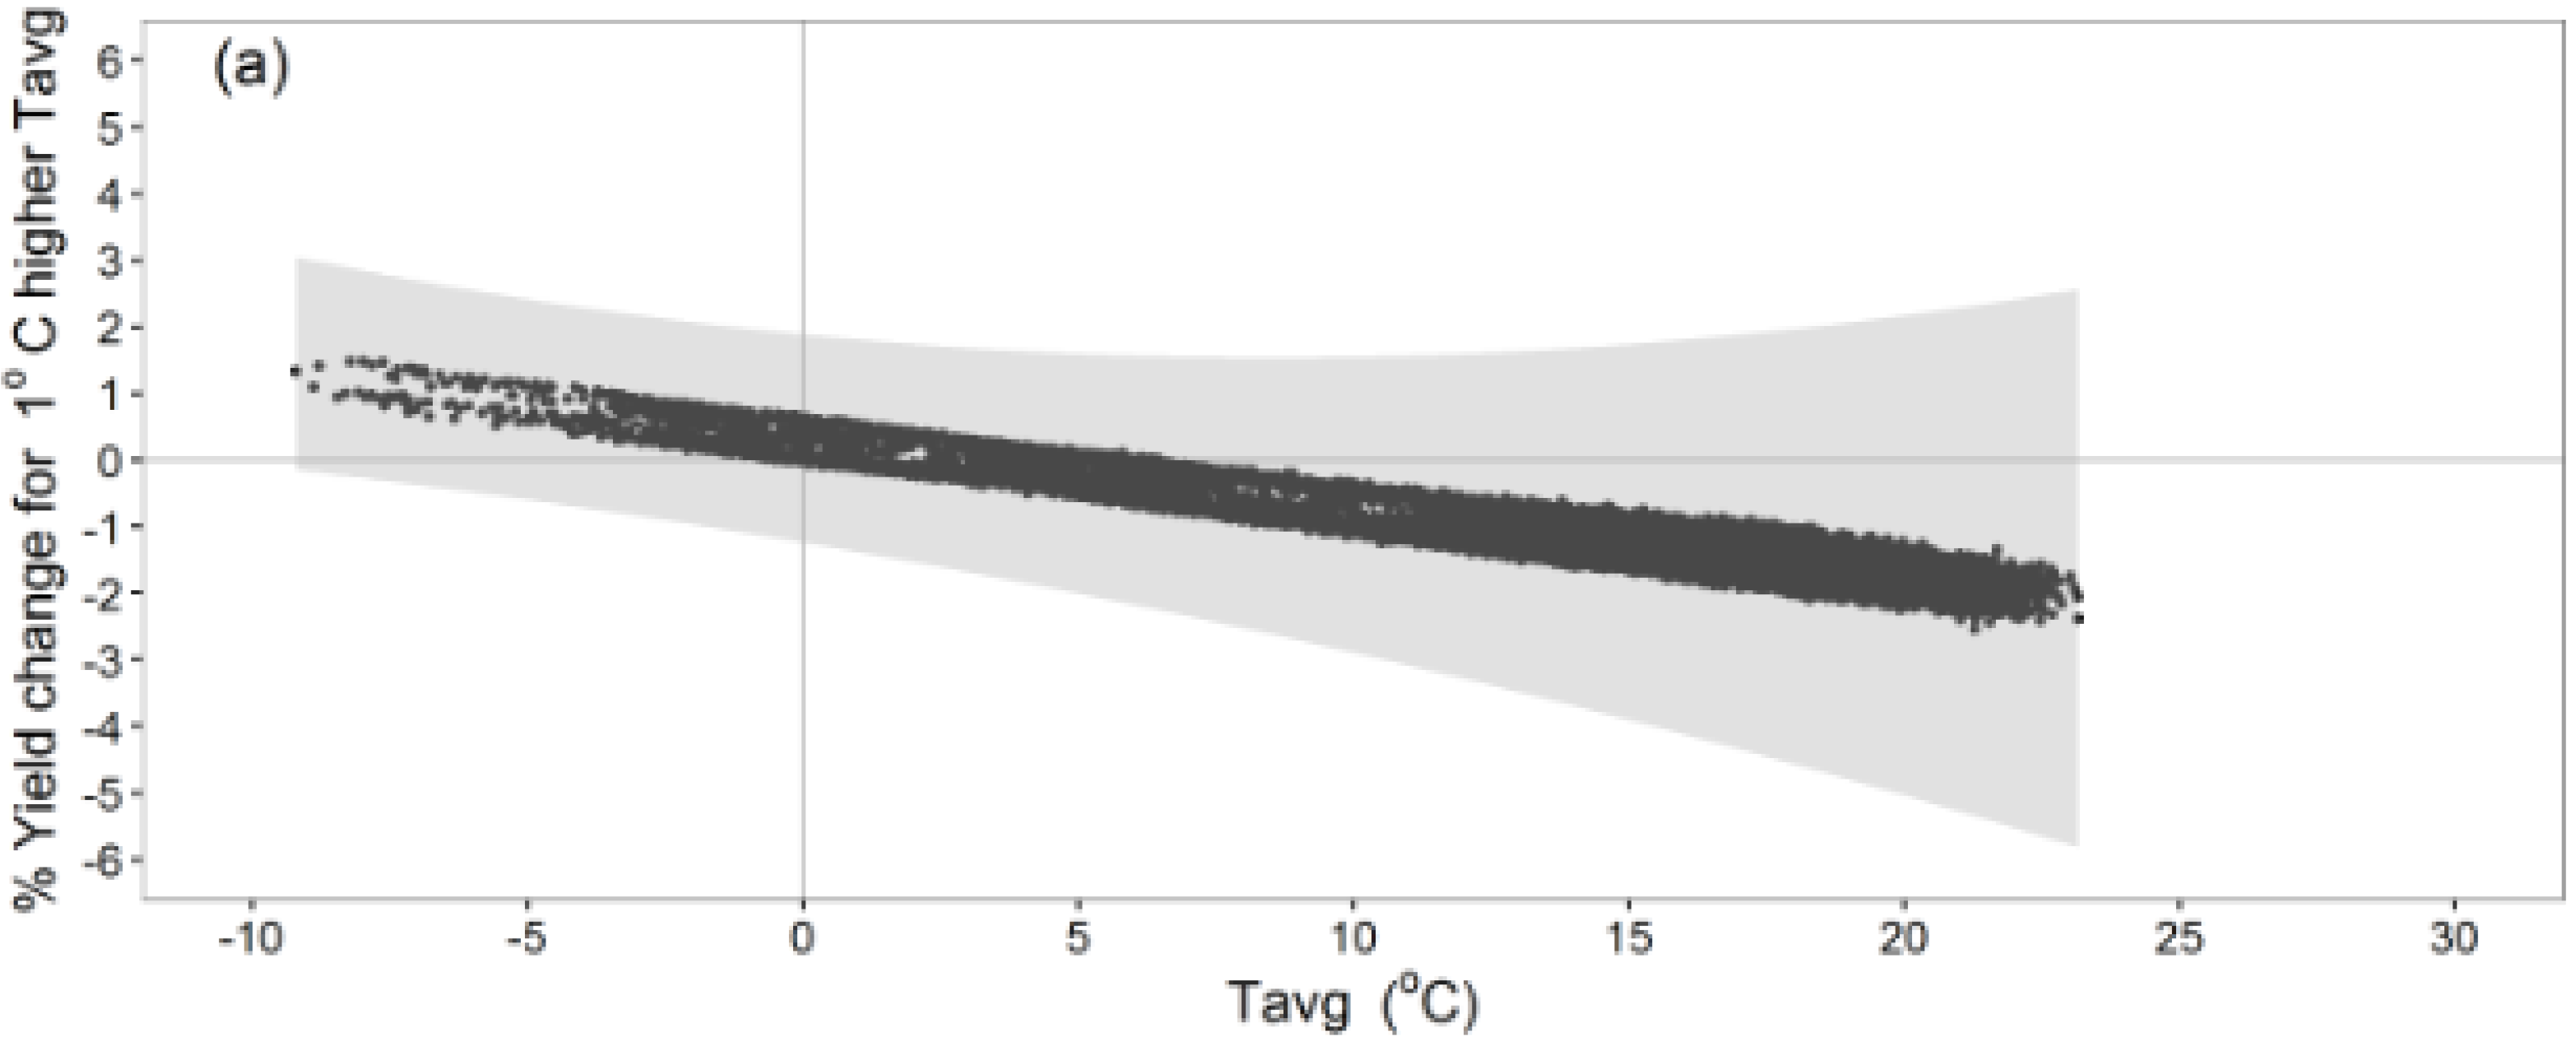
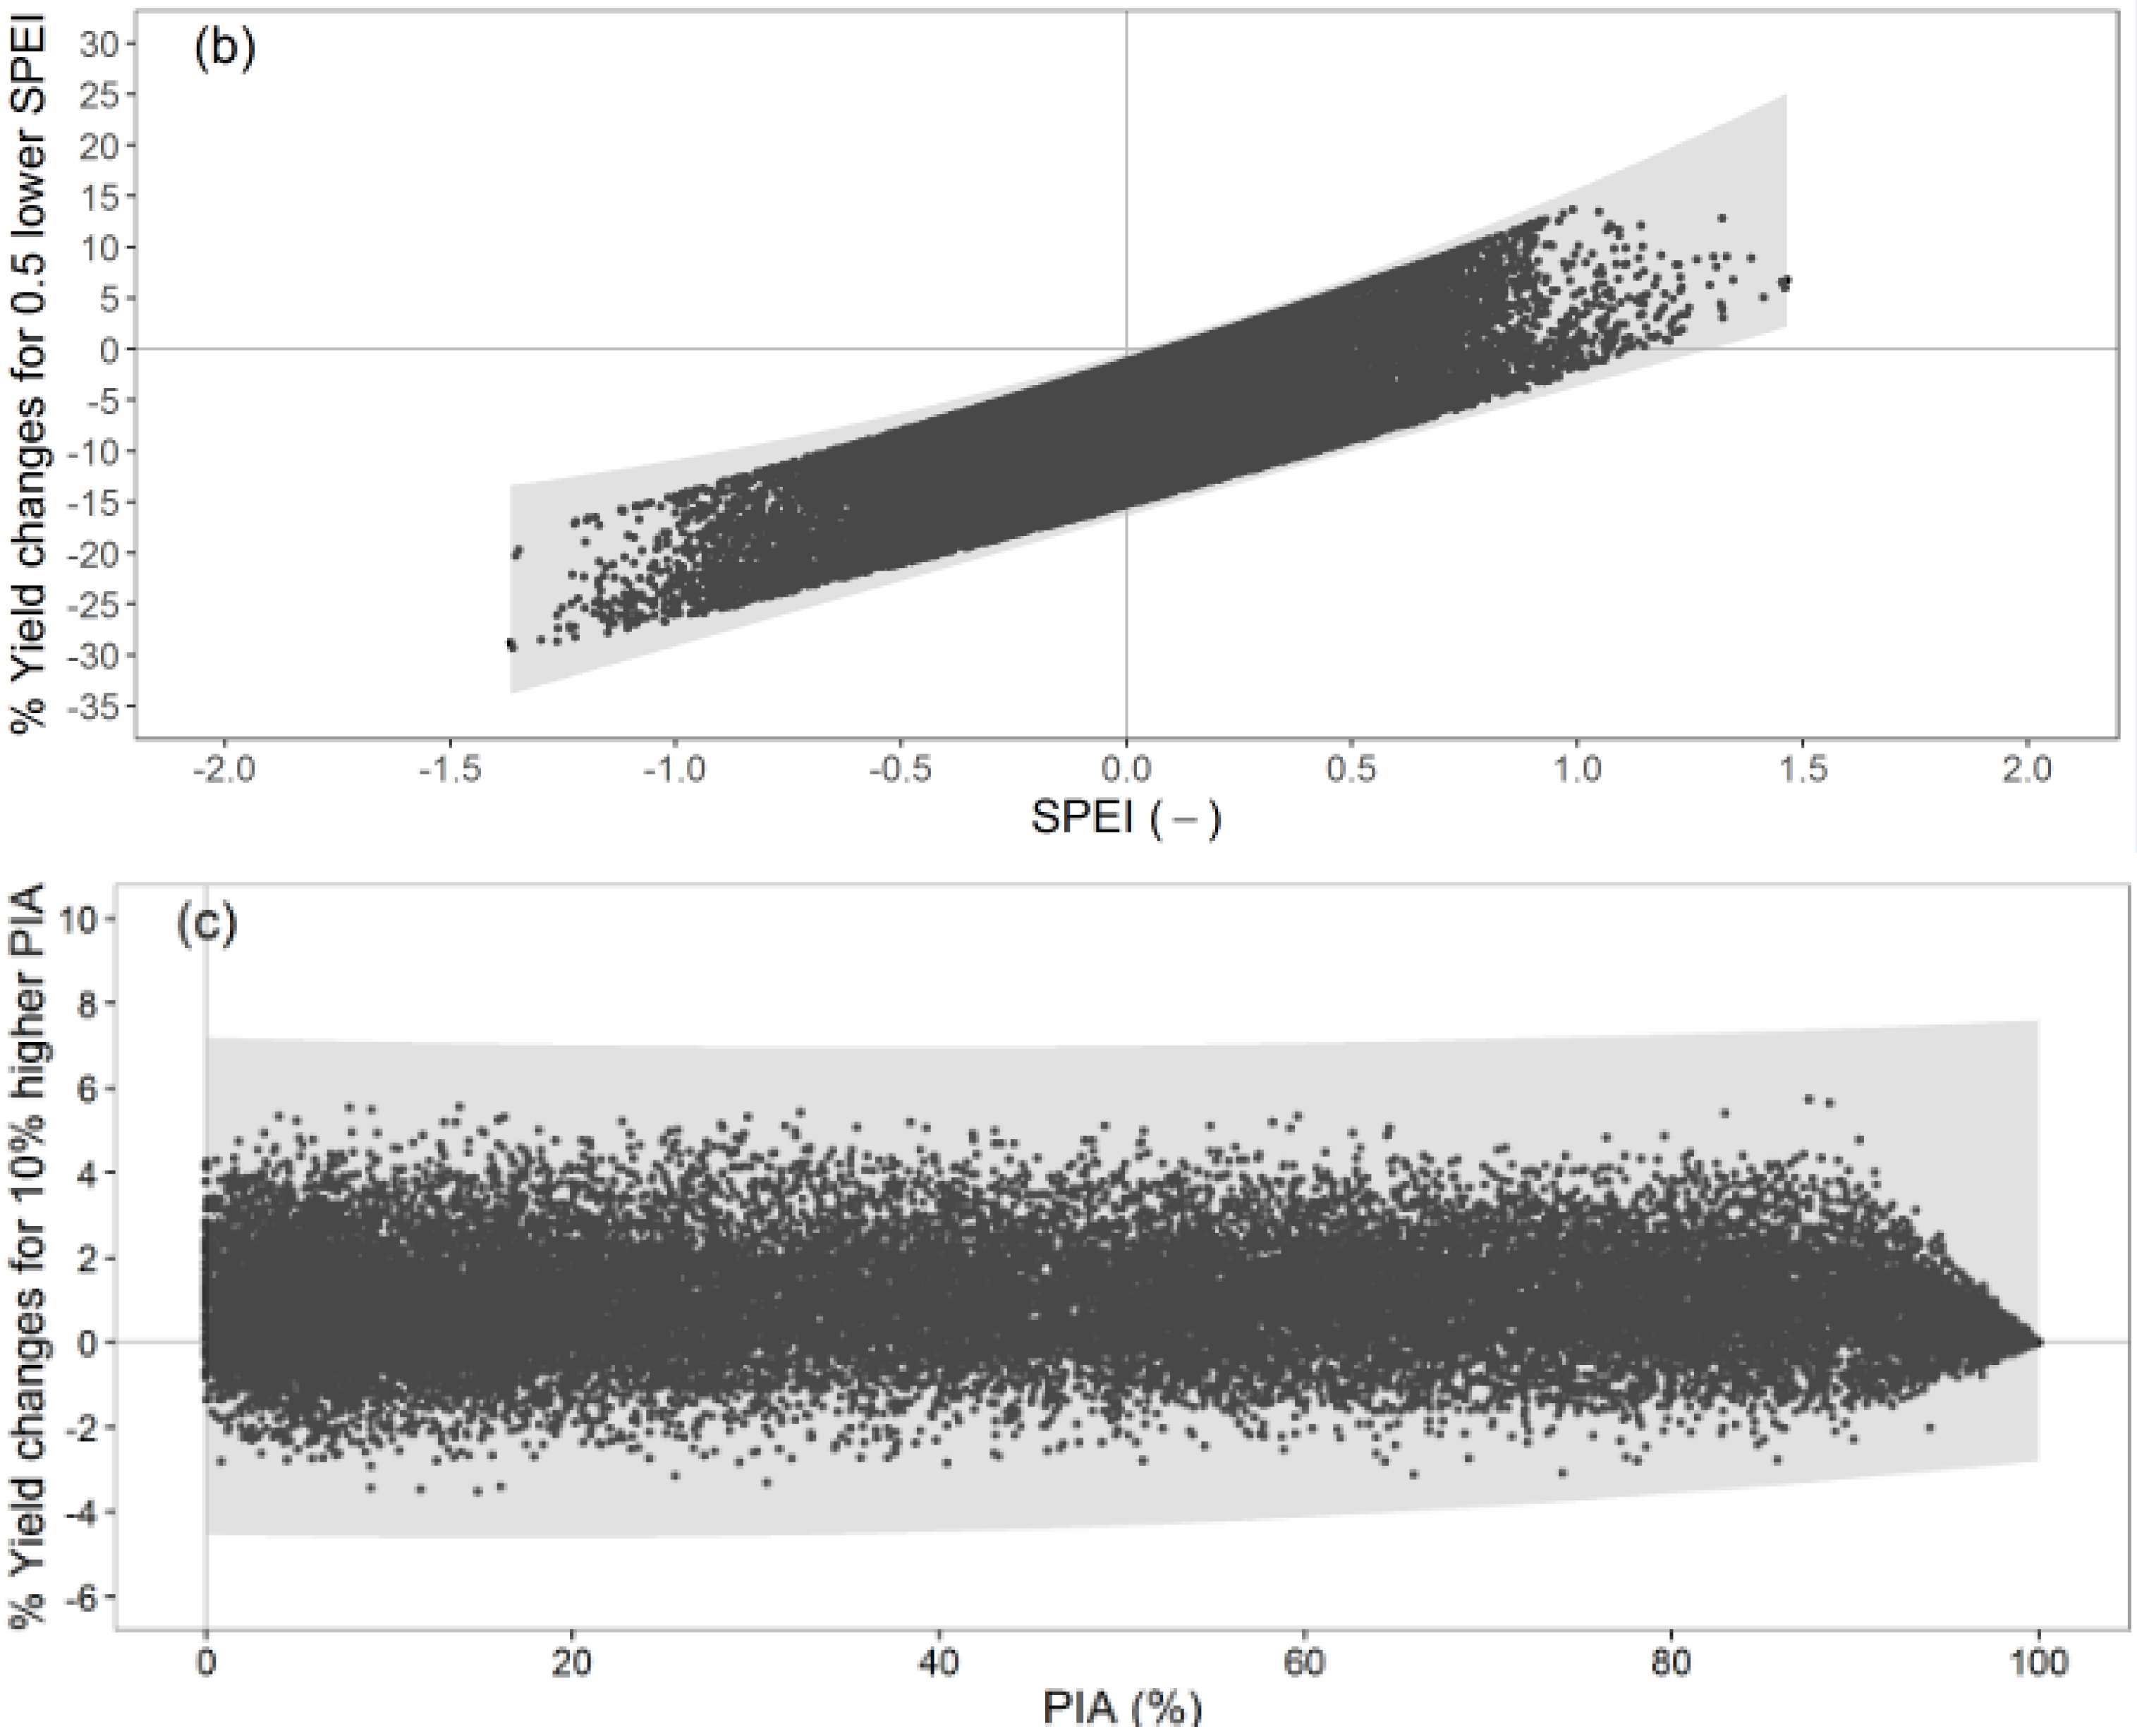
Figure 4.
Changes in mean growing season Tavg and SPEI in the 2030s (2020–2039) under RCP2.6 (a,b) and RCP8.5 (c,d).
Figure 4.
Changes in mean growing season Tavg and SPEI in the 2030s (2020–2039) under RCP2.6 (a,b) and RCP8.5 (c,d).

Figure 5.
Model-estimated percentage changes in crop yields when (a) PIA is constant; (b) PIA was increased by 4.4%; (c) PIA was increased by 10% and (d) PIA was increased by 15% under RCP2.6. The results under RCP8.5 are shown in the bottom panel (e–h).
Figure 5.
Model-estimated percentage changes in crop yields when (a) PIA is constant; (b) PIA was increased by 4.4%; (c) PIA was increased by 10% and (d) PIA was increased by 15% under RCP2.6. The results under RCP8.5 are shown in the bottom panel (e–h).


Table 1.
Growing season of four crops for each province and mean growing season temperature.
| Provinces | ID | Rice Sowing | Harvest | Tavg | Wheat Sowing | Harvest | Tavg | Maize Sowing | Harvest | Tavg | Soybean Sowing | Harvest | Tavg |
|---|---|---|---|---|---|---|---|---|---|---|---|---|---|
| Northeast | |||||||||||||
| Heilongjiang | 1 | 1 May | 30 September | 17.5 | 1 April | 31 July | 14.8 | 1 May | 30 September | 17.5 | 1 May | 30 September | 17.5 |
| Jilin | 2 | 1 May | 30 September | 18.1 | 1 April | 31 July | 15.5 | 1 May | 30 September | 18.1 | 1 May | 30 September | 18.1 |
| Liaoning | 3 | 1 May | 30 September | 20.4 | 1 April | 31 July | 17.8 | 1 May | 30 September | 20.4 | 1 May | 30 September | 20.4 |
| North | |||||||||||||
| Beijing | 4 | 1 April | 30 September | 20.1 | 1 October | 30 Jun. | 6.5 | 1 June | 30 September | 22.5 | 1–30 June | 30 September | 22.5 |
| Hebei | 5 | 1 April | 30 September | 21.4 | 1 October | 30 June | 8.4 | 1 June | 30 September | 23.7 | 1–30 June | 30 September | 23.7 |
| Tianjin | 6 | 1 April | 30 September | 22.3 | 1 October | 30 June | 9.0 | 1 June | 30 September | 24.7 | 1–30 June | 30 September | 24.7 |
| Shandong | 7 | 1 April | 30 September | 22.0 | 1 October | 30 June | 10.0 | 1 June | 30 September | 24.5 | 1–30 June | 30 September | 24.5 |
| Henan | 8 | 1 April | 30 September | 22.6 | 1 October | 30 June | 11.4 | 1 June | 30 September | 24.8 | 1–30 June | 30 September | 24.8 |
| Inner Mongolia | 9 | 1May | 30 September | 17.0 | 1 April | 31 July | 14.7 | 1May | 30 September | 17.0 | 1May | 30 September | 17.0 |
| Northwest | |||||||||||||
| Shanxi | 10 | 1 May | 30 September | 19.2 | 1 October | 30 June | 5.5 | 1 May | 30 September | 19.2 | 1 May | 30 September | 19.2 |
| Shaanxi | 11 | 1 May | 30 September | 20.3 | 1 October | 30 June | 8.2 | 1 May | 30 September | 20.3 | 1 May | 30 September | 20.3 |
| Ningxia | 12 | 1 May | 30 September | 18.1 | 1 October | 30 June | 4.4 | 1 May | 30 September | 18.1 | 1 May | 30 September | 18.1 |
| Gansu | 13 | 1 April | 30 September | 16.0 | 1 October | 30 June | 3.8 | 1 May | 30 September | 16.0 | 1 May | 30 September | 16.0 |
| Qinghai | 14 | NA | NA | NA | 1 March | 31 July | 3.2 | 1 May | 30 September | 8.1 | 1 May | 30 September | 8.1 |
| Xinjiang | 15 | 1 May | 30 September | 17.3 | 1 October | 30 June | 1.5 | 1 May | 30 September | 17.3 | 1 May | 30 September | 17.3 |
Note: ID matches with the numbers in Figure 1; NA denotes no such crop in the province.
Table 2.
Regression coefficients of the regression model, t-statistic and 95% confidence interval estimated using the bootstrap re-sampling approach.
Table 2.
Regression coefficients of the regression model, t-statistic and 95% confidence interval estimated using the bootstrap re-sampling approach.
| Variables | Regression Coefficients | t-Statistic | 95% CI |
|---|---|---|---|
| PIA | 0.000372 | 0.41 | (−0.0013,0.0019) |
| PIA2 | −4.68 × 10⁻⁶ | −1.07 | (−1.53 × 10−5,5.618 × 10−6) |
| Tavg | −0.0107 | −1.39 | (−0.031,0.0088) |
| Tavg2 | −0.00052 * | −1.84 | (−0.001,−0.0001) |
| SPEI | 0.260 *** | 36.2 | (0.24,0.28) |
| SPEI2 | −0.143 *** | −21.72 | (−0.16,−0.12) |
| PIA × Tavg | 6.66 × 10⁻⁵ ** | −25.88 | (0.00002,0.00013) |
| PIA × SPEI | −0.00306 ** | 2.08 | (−0.0033,−0.0027) |
| Sample size | 28341 | ||
| R2 | 0.9771 | ||
| F-value | 330.9 | ||
| p-value | <0.001 |
* p-value < 0.05; ** p-value <0.01; *** p-value < 0.001.
Table 3.
Projected changes in temperature, SPEI and yields under the four irrigated area scenarios in the study area. The average value has been weighted by sown area.
Table 3.
Projected changes in temperature, SPEI and yields under the four irrigated area scenarios in the study area. The average value has been weighted by sown area.
| RCP | RCP2.6 | RCP8.5 |
|---|---|---|
| Temperature change (°C) | 1.6 | 2.0 |
| SPEI change (−) | −0.2 | −0.3 |
| Percentage yield change with no change in irrigated area (%) | −4.7 | −7.3 |
| Percentage yield change with 4.4% increase in irrigated area (%) | −4.0 | −6.5 |
| Percentage yield change with 10% increase in irrigated area (%) | −3.2 | −5.5 |
| Percentage yield change with 15% increase in irrigated area (%) | −2.5 | −4.6 |
© 2017 by the authors. Licensee MDPI, Basel, Switzerland. This article is an open access article distributed under the terms and conditions of the Creative Commons Attribution (CC BY) license (http://creativecommons.org/licenses/by/4.0/).
Share and Cite
MDPI and ACS Style
Zhang, T.; Wang, J.; Teng, Y. Adaptive Effectiveness of Irrigated Area Expansion in Mitigating the Impacts of Climate Change on Crop Yields in Northern China. Sustainability 2017, 9, 851. https://doi.org/10.3390/su9050851
AMA Style
Zhang T, Wang J, Teng Y. Adaptive Effectiveness of Irrigated Area Expansion in Mitigating the Impacts of Climate Change on Crop Yields in Northern China. Sustainability. 2017; 9(5):851. https://doi.org/10.3390/su9050851
Chicago/Turabian StyleZhang, Tianyi, Jinxia Wang, and Yishu Teng. 2017. "Adaptive Effectiveness of Irrigated Area Expansion in Mitigating the Impacts of Climate Change on Crop Yields in Northern China" Sustainability 9, no. 5: 851. https://doi.org/10.3390/su9050851
Note that from the first issue of 2016, this journal uses article numbers instead of page numbers. See further details here.