Abstract
This study was conducted to evaluate the yield and composition of milk from 30 indigenous South African goats of different genotypes, namely Nguni, Boer, and non-descript, reared under a free-ranging system. Milk yield and composition (milk fat, protein, lactose, solid non-fat, and minerals) from Nguni (10), Boer (10) and non-descript (10) goats were measured and analysed per week at each stage of lactation. Results showed that Nguni goats produced (1.2 ± 0.09, 1.3 ± 0.11 and 1.2 ± 0.07 L per day) more milk (p < 0.05) at early, mid-, and late stages of lactation than Boer (0.6 ± 0.10, 1.0 ± 0.17, and 0.6 ± 0.09 L per day) and non-descript (0.3 ± 0.10, 0.3 ± 0.12, and 0.3 ± 0.09 L per day) goats, respectively. The mean value of milk fat, protein, and lactose content from Nguni goats was 3.98, 3.54, and 5.31; Boer goats, 2.9, 3.59, and 5.04 and non-descript goats, 4.05, 3.39, and 5.02, respectively. There was a significant effect (p < 0.05) of genotypes on milk fat, milk magnesium, and sodium contents of Nguni, Boer, and non-descript goats. It could be concluded that Nguni goats produced more milk than Boer and non-descript goats, but the non-descript goat had a higher mean percentage of milk fat compared to Nguni and Boer goats.
1. Introduction
With malnutrition, poverty, and a daily increase in the human population in South Africa (rural areas being the worst hit), alternative sources of animal protein need to be investigated. The utilization of cheaper available animal protein by rural dwellers may help to manage the issue of the increasing cases of food insecurity. The Eastern Cape Province of South Africa has been reported to have a high percentage (42.2%) of poverty [1]. With this in mind, there exists the possibility of using goats as a potential protein source (milk and meat) and for income generation (hide and skin) to improve the livelihoods of people, especially those in the rural areas.
The use of goat and its product to alleviate poverty and improve human nutrition may be attributed to their distinct traits to adapt and produce under unfavourable conditions with little or no supplementation [2] when compared to sheep and cattle. Goats possess the potential to produce milk for rural households when cow milk is limited [3]. In addition, most communal goat farmers may not be able to afford to keep exotic goat breeds for the purpose of milk production because of financial constraints and the expertise to manage them in communal areas [4]. Exotic dairy goat breeds are more expensive and are often susceptible to disease and parasite infestation than indigenous goat breeds that are well-adapted to harsh environmental conditions and are less expensive to maintain [5].
Goats can be easily managed by young people and even women when compared to cattle [6]. This attribute makes it an ideal animal, which can be used by resource-limited farmers and rural house-holders for sustenance and as food [7]. The nutritional [8] and therapeutic properties of goat milk [9] for human benefits have been reported, although, most indigenous South African goat breeds are not used for milk production and very little is known on the yield and the nutritional composition of the milk. According to Rumosa-Gwae et al. [10], the indigenous South African goat breeds are the most abundant and readily available farm animals owned by communal farmers and most rural households compared to sheep and cattle. Information on the yield and nutritional composition (minerals, fat, and protein) in milk is, therefore, vital to promote the right formulation of feeds for goat kids and as food for humans, especially infants [11,12].
There are different goat genotypes kept in the rural areas [10], which would potentially have different milk yields. On the basis of lacking literature, it will be worthwhile to conduct an on-farm study on the milk yield and composition of goats from communal areas. Findings about the nutritional composition of milk from indigenous goats may help to give scientific information of the nutritional grade of milk from these local goats when compared with goats from other parts of the world. Information on the mineral composition of milk from free ranging goats may also be vital for feed and health management of goat kids. Likewise, information on the nutritional composition of goat milk from local goats may help to promote the choice of consuming goat milk as an alternative animal protein source for rural dwellers in South Africa [3]. The objective of this study was to assess the influence of lactation stages and goat genotypes on milk yield, milk protein, milk fat, solid non-fat (SNF), lactose, density, and milk mineral composition of Nguni, Boer, and non-descript goats raised under natural grazing conditions.
2. Materials and Methods
2.1. Study Site
The study was conducted at the Nkonkobe Municipality of the Central Eastern Cape Province of South Africa. The geographical location of the area falls within longitude 32°78′ E and latitude 26°85′ S with an altitude of about 450–500 m above sea level and a mean annual rainfall of 480 mm. The annual mean temperature of the area is about 18.7 °C. The major vegetation of the area includes grass species, such as Cympopogon plurinodis, Sporobolus africanus, Aristida congesta, Cynodon dactylon, Themeda triandra, Sporobolus fimbriatus, Digitaria eriantha, and Eragrostis. The predominant tree plants in the area are Vachellia karroo, Maytenus polyacantha, and Scutia myrtina [13].
2.2. Animal Selection and Management
A total of thirty goats from three different genotypes were selected from local farmers who were willing to participate in the study in Nkonkobe Municipality of South Africa. Overall, these goats included Nguni (10), Boer (10), and non-descript (10) goats, and met the same conditions (including similar time of kidding and time of milk sample collection) from the start to the end of the study for uniformity of all of the parameters that were measured. The non-descript goats are a group of cross-bred goats in the local community. The average age of all goats used in the study was five years and have kidded at least once before. The average weight of the goats used was 40.07 kg. Goats selected were clinically healthy and categorized into three different genotypes based on phenotypic characterization (as officially recognized in the herd books of the three breeds) by trained personnel from the Department of Livestock and Pasture Science, University of Fort Hare, South Africa. All goats were ear-tagged for ease of identification. Goats were herded by herdsmen in the morning to freely graze on available pastures for approximately 8 h after which they were returned to the kraals before sunset. Goats had regular access to drinking water.
2.3. Milk Sample Collection and Yield Determination
Milk samples were collected by hand milking once a day (between 0800–0900 hours) from the different goat genotypes. Milk samples were collected after seven days to allow kids suckle colostrum from their dams. Before milking, goat teats were cleaned with cotton wool and methylated spirits to remove any form of dirt. Milk yield was done by collecting samples into a 500 mL glass measuring cylinder tube and readings were taken from the lower meniscus of the glass cylinder. Milk yield per day was obtained by multiplying the milk yield after every milking session by a factor of two [14]. Milk samples were collected twice at each lactation stage (i.e., at 8, 28, and 49 days after parturition) with the mean value used to calculate the milk yield per day [14].
2.4. Determination of Milk Fat, Protein, Lactose, and Solid Non-Fat
About 45 mL of milk samples were collected from each goat in a 50 mL plastic bottle and kept in a cooler box before taking them to the laboratory for analyses. Milk samples from each goat were analysed for milk fat, protein, lactose, solid non-fat (SNF) using the Speedy lab milk analyser (ASTORI TECHNICA, di Fagotti Giovanni and C. Snc, Via Stelle, 11, 25020 Poncarale (BS), Italy). Before analyses, milk samples were pre-heated in warm water and thoroughly mixed to evenly distribute fat globules and dissolve any milk residue for proper reading according to the manufacturer’s instruction.
2.5. Determination of Minerals in Goat Milk
Milk minerals from the respective samples were determined using a wet digestion method [15]. Briefly, 25 mL milk sample was added to a beaker and heated to near dryness. A solution of 10 mL of HNO3 (0.25% of HNO3) was added into the milk sample and then mixed before heating to get a colour change from milk-white to yellow indicating the oxidation process had taken place in the milk. After heating, samples were filtered using a What-man filter paper to get a clear solution and the aliquot was made up to 100 mL with distilled water. Mineral compositions from these aliquots (digested milk samples) were analysed by flame atomic absorption spectroscopy (FAAS; air-acetylene flame: model: Thermo Fisher iCE3500 spectrometer, Beijing, China). During the analysis, deuterium background correction was used and limits of quantification (LOQ) and detection (LOD) were taken into account. The wavelengths for the Ca, K, Mg, Na, and Fe were 422.7 nm (slit 0.5 nm), 766.5 (slit 0.5 nm), 285.2 (slit 0.5 nm), 589 (slit 0.2 nm), and 248 (slit 0.2 nm), respectively. All measurements were carried out in triplicate.
2.6. Data Analyses
Data were analysed using the general linear model procedure in the Statistical Analysis System software package (version 1.9, 2007) [16] to determine the effect of goat genotypes and the lactation stage on milk yield, milk fat, protein, lactose, density, and minerals (calcium, magnesium, sodium, potassium, and iron). Significant differences between the least square means for genotypes and lactation stages were performed using the PDIFF procedure of SAS, with a significance level of p < 0.05. Correlation analysis between milk yield and milk composition was done for fat, protein, lactose, solid non-fat, and density using the PROC CORR procedure of SAS (version 1.9 of 2007) [16].
The following model was used:
where Yijk = Milk yield, milk fat, protein, lactose, density and milk mineral compositions (Ca, Mg, Na, K, and Fe) measurements on each goat; µ = overall mean; Gi = effect of the ith goat genotype (Nguni, Boer, non-descript); Lj = effect of the jth lactation stages (early, mid, late); (GL)ij = interactions between genotypes and lactation stages; eij = random error.
Yijk = µ + Gi + Lj + (GL)ij + eijk
3. Results
3.1. Milk Yield and Genotypic Effect on Milk Composition of Nguni, Boer, and Non-Descript Goats
Results from Table 1 show that there is a significant difference (p < 0.05) in milk yield from the three goat genotypes, with Nguni having the highest amount (1.3 L/d) of milk production, followed by Boer (1.0 L/d) and the non-descript goats (0.3 L/d) respectively. The milk yield of Nguni goats was significantly (p < 0.05) higher than that of Boer and non-descript goats at the three different stages of lactation. There was no correlation between the milk yield and milk composition parameters of the three genotypes (Table 2, Table 3 and Table 4). However, there was a positive correlation (p < 0.05) between protein and fat for Nguni goats (Table 2), but not in Boer (Table 3) and non-descript goats (Table 4). There was no significant difference (p < 0.05) in the milk composition (protein, lactose, solid non-fat) among the three different goat genotypes (Table 5). There was a significant difference (p < 0.05) in the milk fat among the three different goat genotypes (Figure 1). The mean milk composition (lactose and non-solid fat) of Nguni goats was numerically higher than those of Boer and non-descript goats.

Table 1.
Table showing the effect of goat genotypes on milk yield of Nguni, Boer, and non-descript goats.
Table 2.
Table showing the correlation coefficients between milk yield and milk composition of Nguni goats.
Table 3.
Table showing the correlation coefficients between milk yield and milk composition of Boer goats.
Table 4.
Table showing the correlation coefficients between milk yield and milk composition of non-descript goats.
Table 5.
Genotypic effects on milk fat, protein, lactose, density, and solid non-fat (SNF) of Nguni, Boer, and non-descript goats.
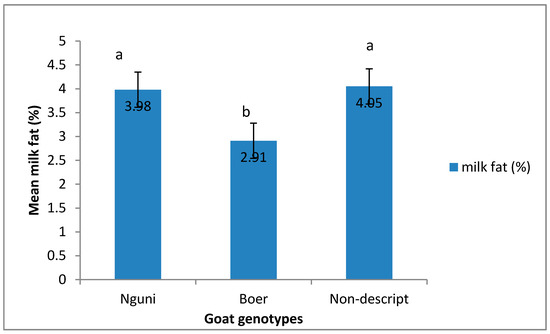
Figure 1.
The effect of genotypes on milk fat percentage of Nguni, Boer, and non-descript goats, a,b means of milk fat percentage with different superscripts differ significantly (p < 0.05).
3.2. Effect of Lactation Stages on Milk Composition of Nguni, Boer, and Non-Descript Goats
The effect of different lactation stages on milk composition of Nguni, Boer, and non-descript goats is presented in Table 6. There was a significant difference (p < 0.05) in the milk protein, milk lactose, and solid non-fat of Nguni goats at different lactation stages, except for milk density. The milk fat of Nguni goat was higher (p < 0.05) during the early stage (5.60%) of lactation, but statistically similar with the milk fat content at mid-lactation (4.20%). Meanwhile, Figure 2 shows that the least milk fat content of Nguni goats was recorded during the late lactation stage (2.20%). Furthermore, the result showed that protein, lactose, and SNF percentage of Nguni goats were significantly (p < 0.05) higher during the early stage of lactation. Table 6 also reveals that the percentage of milk protein, milk lactose, and SNF for Nguni goats are the same during the mid- and late lactation stages. No significant difference (p > 0.05) was recorded in all of the milk composition traits for Boer and non-descript goats during the early, mid-, and late stages of lactation (Table 6).
Table 6.
Effect of lactation stages on milk protein, milk lactose, SNF, and milk density within individual animal of Nguni, Boer, and non-descript goats.
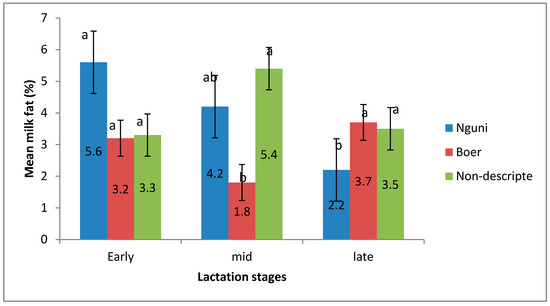
Figure 2.
The effect of lactation stages on milk fat percentage of Nguni, Boer, and non-descript goats. a,b within each stage of lactation, means of milk fat percentage with different superscripts differ significantly (p ˂ 0.05).
The mean values of milk fat of Nguni goats decreased from early to mid- and late lactation, respectively (Figure 2). However, the mean values of milk protein (3.80 ± 0.06%), lactose (5.70 ± 0.08%), and non-solid fat (10.30 ± 0.16%) were higher at the early and late lactation stages in Nguni goats, but decreased slightly in the mid-lactation stage. Conversely, there were no significant effects of lactation stages on milk composition (milk fat, protein, lactose, and non-solid fat) for Boer and non-descript goats (Table 6). There was a decrease in protein, lactose, and non-solid fat levels in non-descript goats as the lactation stage progressed from early to mid- and late lactation (Table 6).
3.3. Effect of Goat Genotypes and Lactation Stages on Milk Mineral Compositions
The effect of milk mineral composition of Nguni, Boer, and non-descript goats is presented in Table 7. The mineral composition of milk magnesium and milk sodium differ significantly (p < 0.05) among the three different goat genotypes (Table 7). The Boer goat had a higher mean value of milk magnesium (231.21 ± 22.33 mg/L) and sodium (283.02 ± 14.52 mg/L) when compared to the Nguni (136.76 ± 17.59 mg/L and 213.97 ± 11.21 mg/L) and non-descript (218.73 ± 22.33 mg/L and 282.77 ± 14.52) goats. The mean value of the mineral composition of milk was highest in potassium, followed by sodium, magnesium, calcium, and iron, respectively, in the three different goat genotypes. Conversely, Boer goats had a numerically higher mean value of milk calcium when compared to Nguni and non-descript goats.
Table 7.
A table showing the interactions between genotypes and lactation stages on milk mineral compositions of Nguni, Boer, and non-descript goats.
The effect of lactation stages on milk minerals of Nguni, Boer, and non-descript goats is shown in Table 7. The milk calcium, magnesium, and sodium levels of Nguni, Boer, and non-descript goats were influenced (p < 0.05) by the stage of lactation. The milk calcium was higher at the early lactation stage compared to the mid- and late lactation stages. However, the percentages of milk magnesium and milk sodium was highest at the late lactation stage compared to the early and mid-lactation stages, respectively.
The milk potassium was numerically higher at the late lactation stage compared to the early and mid-lactation stages. However, the milk iron was numerically higher at the early lactation stage compared to the mid and late lactation stages. There was significant interaction (p < 0.05) between goat genotypes and lactation stages for milk calcium and milk sodium, but not for milk magnesium, potassium, and iron (Table 7).
4. Discussion
The peak mean value of milk yield for Nguni goats was comparable to the findings of [5] who reported the milk yield of Nguni goats to be 1.42 L/d. The result of the mean value for goat milk yield of Boer goats from our finding was also comparable to that of [3] who reported the milk yield of Boer goats to be 0.80 L/d. However, in another study by [5], the milk yield (0.65 L/d) for Nguni goats was less compared to our finding. The possible reason for the low milk production of the three goat genotypes when compared to exotic breeds could be due to the fact that most indigenous South African goats are traditionally used for meat and they are often not considered for dairy purpose [3].
However, Boer goats are generally believed to produce more milk than any other (non-dairy goats) indigenous South African goats [3,5]; this was in contrast with our findings where Nguni goats produced higher milk yields than the Boer goats. The reason for our findings may not be clearly understood, however, according to Basic et al. [17], difference in milk yield of goats could possibly be as a result of differences in the parity of the animals. The lesser milk yield of the non-descript goats compared to the Nguni and the Boer goats as observed from this study was expected, the reason being that, they possess smaller body and udder size when compared to the Nguni and Boer goats. The milk yield of non-descript goats were observed to be consistent at the different stages of lactation as observed in this study. This finding is in line with the study by [18] who reported persistency in the milk yield of local Egyptian goat breed from early to late stage of lactation.
In Kenya, the milk yield of local goat breeds (Indigenous Kenyan goat × Toggenburg) was 0.90 L/d [19], which is comparable to the milk yield of Nguni and Boer goats as observed from this study. In another study by [20], the milk yield for local goats ranged between 0.24–0.40 L/d which is comparable to the milk yield of the nn-descript goat, but lesser compared to those of Nguni and Boer goats as observed in our study. Furthermore, [21,22] in their study reported that, the milk yield of local Egyptian goats ranges between 0.66 and 0.80 L/d; while in Greece, the milk yield of local breeds of goats ranges between 0.55–0.75 L/d [23]. In Nigeria, the milk yield of Sokoto Red goats (local breed) was reported to give 0.62 L/d [24], 0.14 L/d [25], and 0.42 L/d [14], respectively. These findings are comparable to the milk yield reported for non-descript goats as observed in this present study but, lesser when compared to those of Nguni and Boer goats which indicates that, the milk production of Nguni and Boer goats are more in terms of quantity than other local goat breeds from other countries. In another study by [26], the milk yield for West African Dwarf goats was reported to be 0.32 L/d which is comparable to the milk yield of non-descript goats, but less compared to those of Nguni and Boer goats, as observed from our finding.
According to Morand-Fehr et al. [27], the reasons for the differences in milk yield of different goat breeds in several countries may be attributed to variations in several factors including genetic, environmental factors, and the type of management systems practiced in these different countries. With the Nguni goats showing a superior milk production potential compared to the Boer and non-descript goats, they (Nguni goats) may be recommended as a possible alternative animal protein source (for milk purpose) for local farmers and small holder farmers raising goats under the communal farming system in South Africa.
Conversely, according to a previous study by [28], it was reported that, milk fat, protein, and solid non-fat were negatively correlated to increase in milk yield. In addition, ref. [5] reported a negative correlation between solid non-fat and milk yield and not between milk yield and milk fat or protein content. This was contrary to our finding as there was no correlation observed between milk yield and milk compositions for Nguni, Boer, and non-descript goats. However, there was a positive correlation between protein and fat as observed from the present study for Nguni goats. This finding is similar to previous studies by [5,29] who also reported a positive correlation between protein and fat content. An increase in milk production has been reported to be a major reason for the increase in milk composition, and vice versa [30].
Several factors have been identified to influence the composition of milk in ruminant animals, which include age, breed, parity, nutrition, lactation stage, and management, among others [31,32,33]. Generally, the quality of milk produced by livestock is usually determined by the constituents that make up the milk, including fat, protein, lactose, non-solid fat, and density. In this study, the milk constituents from the three goat genotypes were comparable to goats of other breeds. The mean values of milk composition observed in this study (from the three goat genotypes) fall within the range of accepted values of quality milk [9,34]. The milk constituents (fat, protein, lactose, solid non-fat, and density) were relatively stable throughout the lactation stages.
There was no significant difference in most of the milk compositions including milk protein, lactose, solid non-fat, and density among the three different goat genotypes. The reason for the similar milk composition as observed from the present study could be due to the fact that these goats were grazed under the same vegetative environment. A similar observation was made by [35] who reported that there was no significant difference in the milk composition of Damascus goats and a crossbred (German Fawn × Hair goat) reared under similar environmental conditions. According to Shamay et al. [36], stressful environmental conditions may not change the milk composition of goats if they are well-adapted to their environment.
The fat, protein, lactose, and solid non-fat percentages observed for Nguni and non-descript goat genotypes in this study were higher than the values (3.27%, 3.60%, 4.09%, and 7.74%) reported for Baladi dairy goats [37]. However, the mean percentage for the Boer goats as observed from this study was lower in fat (2.91%), but higher in protein, lactose, and solid non-fat (3.59%, 5.04%, and 9.48%) than the Baladi dairy goats, as was reported by [37]. In another study by [3], the percentages of fat, protein, lactose, and solid non-fat in extensively raised Boer (6.4%, 5%, 4.5%, and 10.7%) and Nguni goats (6%, 4.5%, 4.5%, and 9.6%) were slightly higher compared to the values observed for Nguni, Boer, and non-descript goats in the current study.
It was reported by [14] that, the value of fat, protein, and solid non-fat in the milk of Red Sokoto goats were 3.91%, 4.93%, and 10.27%, which is comparable to the values obtained for Nguni and non-descript goats, but higher than those of Boer goats as observed in this study. Berhane and Eik [38] reported higher values of fat, protein, and solid non-fat (7.04%, 3.53%, and 8.77%) and (8.71%, 4.16%, and 9.88%) for Begait and Abergelle goats, respectively. These values were higher compared to the values observed in the present study. It was reported by [39] that the decrease in the level of milk fat in goat milk is a result of the increase in the molar percentage of propionic acid and the decline in the molar percentage of acetic acids found in the rumen of goats.
In a related study by [30], the mean percentages for fat, protein, and lactose for Boer (4.7%, 4.05%, and 4.9%) and Somali goats (4.90%, 4.34%, and 4.97%) were comparable to the results observed from the present study for Nguni and non-descript goats, but were higher than the values observed for Boer goats. Conversely, the mean milk composition (protein, fat, and lactose) reported by [40] for goat breeds in Croatia (3.10%, 3.43%, and 4.17%) and Slovenia (3.11%, 3.34%, and 4.36%) were, respectively, lower compared to those of the three goat genotypes as observed in this present study. The reason for the variations in milk composition from our findings as compared to other different goat breeds could be due to variations in age, breed, parity, nutrition, stage of lactation, and management systems [31,32,33].
There was a stable increase in protein percentage in the early lactation and in the late lactation for Nguni, non-descript, and Boer goats. This is in agreement with the findings by [37]. The reason for the increase in the protein content of milk in the early and late lactation may be due to an interplay of several other factors (e.g., age, climatic conditions, etc.) apart from breeds and nutrition [3].
In line with several other studies, the percentage values of fat, lactose and solid non-fat increased in the early and late lactation stages for Nguni and Boer goats. According to Mestawet et al. [30] and Ibnelbachyr et al. [41], there was increase in fat, protein, and lactose percentages during the early and late lactation periods. In agreement with the present finding, ref. [42,43] also observed an increase in fat content in the early and late lactation stages in their study. However, this was contrary to the finding by [29] who reported lower milk fat and protein percentages at early and late lactation compared to the mid-lactation for Arsi-Bale goats. According to Gajdusek et al. [44], the increase in the fat content of goats in relation to lactation stages could be as a result of the process called lipolysis caused by natural or bacteria enzymes in the mammary glands at the late stage of lactation.
Contrary to our finding on the lactose content of milk for Nguni Boer and non-descript goats, some researchers have reported a decrease in lactose content in goat milk at the late lactation stage compared to the early and mid-lactation stages [37,45,46]. However, in agreement with our finding, it was observed that, lactose content in milk increased at early and late lactation [41]. The reason for the increase in lactose at the early and late lactation stages for different breeds is unclear. However, Greyling et al. [3] stated that, the energy balance of goats is very vital to milk composition, including fat and protein, than the composition of animal diet that goat feed on during lactation.
The mineral compositions in milk play a vital part in the structural organization of other components, such as the casein micelles, protein, as well as maintaining some physiological functions of livestock during lactation. These minerals include, among others, sodium (Na), magnesium (Mg), calcium (Ca), potassium (K), and iron (Fe). There was no genotypic effect on the milk minerals as observed in the present study. This could possibly be attributed to the fact that all of the goats (Nguni, Boer, and non-descript) used in the study grazed on the same veld type. In agreement with our finding, Mestawet et al. [30] reported that, there was no significant difference in the milk mineral compositions of four different Ethiopian goat breeds raised on natural pastures and supplemented with concentrates.
However, in another study on dairy cows (Jersey, Friesian, Jersey × Friesian) it was reported that, genotypes had a significant effect on some milk mineral compositions, including magnesium, phosphorus, and calcium, with crossbreeds (Jersey × Friesian) having a higher composition of minerals, even though the animals grazed on the same pasture [47]. The reason for the higher milk mineral compositions in the crossbreed compared to Jersey and Friesian cows were attributed to heterosis [47].
The calcium levels observed in the present study were considerably low in comparison to the values previously reported by other researchers [48,49]. In one of the previous studies on milk mineral compositions, the mean percentage for calcium was given to be 805.1 mg/L which is higher compared to the present study [50]. The reason for the variation in the mineral composition for these different studies could be attributed to differences in locality, management systems, diet type, and different seasons of milk production [47,51].
According to Haenlein and Anke [52], higher levels of some mineral compositions in milk (including Ca, Mg, Zn, and Fe) could also be attributed to some deficiencies of other minerals (e.g., cadmium) in the animal feed. The milk magnesium concentrations of Nguni, Boer, and non-descript goats in the current study were higher compared to the value reported in a previous study by [53]. Slacanac, et al. [50] reported the mean mineral composition for goat milk to be 104.3 mg/L (magnesium) and 0.56 mg/L (iron). The value for magnesium as reported by [50] was lower, but the concentration for iron was comparable to the values observed for Nguni, Boer, and non-descript goats in the present study.
5. Conclusions
Nguni goats produced more milk at the early and late stages of lactation than Boer and non-descript goats. Non-descript goats had a higher mean value of milk fat compared to Nguni and Boer goats. In addition, the stage of lactation had an influence on the milk fat, milk lactose, milk protein, and milk SNF of Nguni goats, but not on Boer and non-descript goats. Boer goats had a higher mean value of milk magnesium and sodium content compared to Nguni and non-descript goats. The stage of lactation had an effect on the milk calcium, milk magnesium, and milk sodium of Nguni, Boer, and non-descript goats and not on milk potassium and iron.
Acknowledgments
The authors are grateful to Falowo Bamidele and Oyeagu Chika for critiquing the manuscript. The authors wish to thank Govan Mbeki Research Development Centre (GMRDC), University of Fort Hare and the Department of Science and Technology/National Research Foundation (T359) for financial assistance.
Author contributions
Emrobowansan M. Idamokoro, Patrick J. Masika, and Voster Muchenje conceptualized and design the work; Emrobowansan M. Idamokoro operated the experiment; Emrobowansan M. Idamokoro collected and analysed the data; Emrobowansan M. Idamokoro, Patrick J. Masika, and Voster Muchenje visualized the results; Emrobowansan M. Idamokoro wrote the paper; and Patrick J. Masika and Voster Muchenje proofread the paper.
Conflicts of Interest
The authors declare that there are no conflicts of interest.
References
- Van Heerden, G. Assets and incomes. In South Africa Survey 2014/2015; Cronje, F., Kane-Berman, J., Eds.; Institute of Race Relations: Johannesburg, South Africa, 2014; pp. 279–325. [Google Scholar]
- Lehloenya, K.C.; Greyling, J.P.C.; Schwalbach, L.M.J. Reproductive performance of South African indigenous goats following oestrus synchronisation and AI. Small Rumin. Res. 2005, 57, 115–120. [Google Scholar] [CrossRef]
- Greyling, J.P.C.; Mmbengwa, V.M.; Schwalbach, L.M.J.; Muller, T. Comparative milk production potential of indigenous and Boer goats under two feeding systems in South Africa. Small Rumin. Res. 2004, 55, 97–105. [Google Scholar] [CrossRef]
- Maphosa, V.; Sikosana, J.L.N.; Muchenje, V. Effect of doe milking and supplementation using Dichrostachys cinerea pods on kids and doe performance in grazing goats during the dry season. Trop. Anim. Health Prod. 2009, 41, 535–541. [Google Scholar] [CrossRef] [PubMed]
- Mmbengwa, V.M.; Schwalbach, L.M.; Greyling, J.P.C.; Fair, M.D. Milk production potential of South African Boer and Nguni goats. S. Afr. J. Anim. Sci. 2000, 30 (Suppl. 1), 76–77. [Google Scholar] [CrossRef]
- Oluwatayo, I.B.; Oluwatayo, T.B. Small Ruminants as a Source of Financial Security: A case Study of Women in Rural Southwest Nigeria. Inst. Money Technol. Financ. Incl. 2012, 2, 1–2. [Google Scholar]
- Casey, N.H.; Van Niekerk, W.A. The Boer goat 1. Origin, adaptability, performance testing, reproduction and milk production. Small Rumin. Res. 1988, 1, 291–302. [Google Scholar] [CrossRef]
- Silanikove, N.; Merin, U.; Leitner, G. On effects of subclinical mastitis and stage of lactation on milk quality in goats. Small Rumin. Res. 2014, 122, 76–82. [Google Scholar] [CrossRef]
- Yangilar, F. As a potentially Functional Food: Goats’ Milk and Products. J. Food Nutr. Res. 2013, 1, 68–81. [Google Scholar]
- Rumosa-Gwaze, F.; Chimonyo, M.; Dzama, K. Communal goat production in Southern Africa: A review. Trop. Anim. Health Prod. 2009, 41, 1157–1168. [Google Scholar] [CrossRef] [PubMed]
- Zhou, S.J.; Sullivan, T.; Gibson, R.A.; Lonnerdal, B.; Prosser, C.G.; Lowry, D.J.; Makrides, M. Nutritional adequacy of goat milk infant formulas for term infants; a double-blind randomised controlled trial. Br. J. Nutr. 2014, 111, 1641–1651. [Google Scholar] [CrossRef] [PubMed]
- Thum, C.; Cookson, A.; McNabb, W.C.; Roy, N.C.; Otter, D. Composition and enrichment of caprine milk oligosaccharides from New Zealand Saanen goat cheese whey. J. Food Compost. Anal. 2015, 42, 30–37. [Google Scholar] [CrossRef]
- Mucina, L.; Rutherford, M.C. (Eds.) The Vegetation of South Africa, Lesotho and Swaziland; Strelitzia 19; South African Biodiversity Institute: Pretoria, South Africa, 2006.
- Otaru, S.M.; Adamu, A.M.; Ehoche, O.W.; Makun, H.J. Effects of varying the level of palm oil on feed intake, milk yield and composition and postpartum weight changes of Red Sokoto goats. Small Rumin. Res. 2011, 96, 25–35. [Google Scholar] [CrossRef]
- Birghila, S.; Dobrinas, S.; Stanciu, G.; Soceanu, A. Determination of major and minor elements in milk through ICP-AES. Environ. Eng. Manag. J. 2008, 7, 805–808. [Google Scholar]
- Statistical Analysis System Institute (SAS). SAS User’s Guide: Statistics, version 9.1; SAS Institute Inc.: Cary, NC, USA, 2007. [Google Scholar]
- Basic, Z.; Dzidic, A.; Kostelic, A. The effect of prestimulation on milking characteristics during machine milking of goat. Mljekarstvo 2009, 59, 83–87. [Google Scholar]
- Peters, K.J.; Laes-Fettback, C. A comparative study of performance of Egyptian goat breeds 1. Reproductive and dairy performance. Arch. Tierz. 1995, 38, 93–102. [Google Scholar]
- Ruvuna, F.; Kogi, J.K.; Taylor, J.F.; Mkuu, S.M. Lactation curves among crosses of Galla and East African with Toggenburg and Anglo Nubian goats. Small Rumin. Res. 1995, 16, 1–6. [Google Scholar] [CrossRef]
- Degen, A. Sheep and goat milk in pastoral societies. Small Rumin. Res. 2007, 68, 7–9. [Google Scholar] [CrossRef]
- El-Gallad, T.T.; Gihad, E.A.; Allam, S.M.; El-Bedaway, T.M. Effect of energy intake and roughage ratio on the lactation of Egyptian Nubian (Zaraibi) goats. Small Rumin. Res. 1988, 1, 327–341. [Google Scholar] [CrossRef]
- Marzouk, K.M.; El Feel, F.M.R.; Hassan, H.A.; Sallam, M.T. Evaluation of French Alpine goats under Egyptian conditions. In Proceedings of the 7th International Conference on Goats, Tours, France, 15–21 May 2000; pp. 236–238. [Google Scholar]
- Serradilla, J.M. Use of high yielding goat breeds for milk production. Livest. Prod. Sci. 2001, 71, 59–73. [Google Scholar] [CrossRef]
- Malau-Aduli, B.S.; Eduvie, L.; Lakpini, C.; Malua-Aduli, A.E.O. Crop-residue supplementation of pregnant does influences birth weight and weight gain of kids, daily milk yield but not the progesterone profile of Red Sokoto goats. Reprod. Nutr. Dev. 2004, 44, 111–121. [Google Scholar] [CrossRef] [PubMed]
- Makun, H.J.; Ajanusi, J.O.; Ehoche, O.W.; Lakpini, C.A.M.; Otaru, S.M. Growth rates and milk production potential of Sahelian and Red Sokoto breeds of goats in Northern Guinea Savannah. Pak. J. Biol. Sci. 2008, 11, 601–606. [Google Scholar] [CrossRef] [PubMed]
- Ahamefule, F.O.; Ibeawuchi, J.A. Milk yield and composition of West African Dwarf does fed Pigeon Pea-Cassava peel based diets. J. Anim. Vet. Adv. 2005, 4, 991–999. [Google Scholar]
- Morand-Fehr, P.; Fedele, V.; Decandia, M.; Le Frileux, Y. Influence of farming and feeding systems on composition and quality of goat and sheep milk. Small Rumin. Res. 2007, 68, 20–34. [Google Scholar] [CrossRef]
- Simos, E.; Voutsinas, L.P.; Pappas, C.P. Composition of milk of Native Greek goats in the region of Metsovo. Small Rumin. Res. 1991, 4, 67–74. [Google Scholar] [CrossRef]
- Dereje, A.; Negesse, T.; Tolera, A. Milk yield and composition of grazing Arsi-Bale Does supplemented with dried stinging nettle (Urtica simensis) leaf meal and growth rate of their suckling kids. Adv. Biol. Res. 2016, 10, 191–199. [Google Scholar]
- Mestawet, T.A.; Girma, A.; Adnoy, T.; Devold, T.G.; Narvhus, J.A.; Vegarud, G.E. Milk production, compostion and variation at different lactation stages of four goat breeds in Ethiopia. Small Rumin. Res. 2012, 105, 176–181. [Google Scholar] [CrossRef]
- Al-Saiady, M.Y. Effect of restricted feeding, breed and diet on sheep milk yield. J. Appl. Anim. Res. 2006, 30, 85–88. [Google Scholar]
- Oravcova, M.; Margetin, M.; Peskovicova, D.; Dano, J.; Milerski, M.; Hetenyi, L.; Polak, P. Factors affecting ewe’s milk fat and protein content and relationships between milk yield and milk components. Czech J. Anim. Sci. 2007, 52, 189–198. [Google Scholar]
- El-Tarabany, M.S.; El-Bayoumi, K.M. Reproductive performance of backcross Holstein x Brown Swiss and their Holstein contemporaries under subtropical environmental conditions. Theriogenology 2015, 83, 444–448. [Google Scholar] [CrossRef] [PubMed]
- Claeys, L.W.; Varraes, C.; Cardoen, S.; De Block, J.; Huyghebaert, A.; Raes, K.; Dewettinck, K.; Herman, L. Consumption of raw or heated milk from different species: An evaluation of the nutritional and potential health benefits. Food Control 2014, 42, 188–201. [Google Scholar] [CrossRef]
- Keskin, M.; Avsar, Y.K.; Bicer, O.; Guler, M.B. A comparative study on the milk yield and milk composition of two different goat genotypes under the climate of the Eastern Mediterranean. Turk. J. Vet. Anim. Sci. 2004, 28, 531–536. [Google Scholar]
- Shamay, A.; Mabjeesh, S.J.; Shapiro, F.; Silanikove, N. Adrenocorticotrophic hormone and dexamethasone failed to affect milk yield in dairy goats: Comparative aspects. Small Rumin. Res. 2000, 38, 255–259. [Google Scholar] [CrossRef]
- El-Tarabany, M.S.; El-Tarabany, A.A.; Roushdy, E.M. Impact of lactation stage on milk composition and blood biochemical and haematological parameters of dairy Baladi goats. Saudi J. Biol. Sci. 2016. [Google Scholar] [CrossRef]
- Berhane, G.; Eik, L.O. Effect of vetch (Vicia sativa) hay supplementation on performance of Begait and Abergelle goats in northern Ethiopia: I. Milk yield and composition. Small Rumin. Res. 2006, 64, 225–232. [Google Scholar] [CrossRef]
- Morand-Fehr, P.; Sauvant, D. Composition and yield of goat milk as affected by manipulation. J. Dairy Sci. 1980, 63, 1671–1680. [Google Scholar] [CrossRef]
- Klir, Ž.; Potočnik, K.; Antunovic, Z.; Novoselec, J.; Barac, Z.; Mulc, D.; Kompan, D. Milk production traits from alpine breed of goats in Croatia and Slovenia. Bulg. J. Agric. Sci. 2015, 21, 1064–1068. [Google Scholar]
- Ibnelbachyr, M.; Boujenane, I.; Chikhi, A.; Noutfia, Y. Effect of some non-genetic factors on milk yield and composition of Draa indigenous goats under an intensive system of three kiddings in 2 years. Trop. Anim. Health Prod. 2015, 47, 727–733. [Google Scholar] [CrossRef] [PubMed]
- Strzalkowska, N.; Jóźwik, A.; Bagnicka, E.; Krzyżewski, J.; Horbańczuk, K.; Pyzel, B.; Horbańczuk, J.O. Chemical composition, physical traits and fatty acid profile of goat milk as related to the stage of lactation. Anim. Sci. Pap. Rep. 2009, 27, 311–320. [Google Scholar]
- Mahmoud, N.M.A.; El Zubeir, I.E.M.; Fadlelmoula, A.A. Effect of stage of lactation on milk yield and composition of first kidder Damascus does in the Sudan. J. Anim. Prod. Adv. 2014, 4, 355–362. [Google Scholar]
- Gajdusek, S.; Jelinek, P.; Pavel, J.; Fialowa, M. Changes in composition of fatty acids of the fat in goat milk during lactation. Zivocisna Vyroba 1993, 38, 849–858. [Google Scholar]
- Pavic, V.; Antunac, N.; Mioi, B.; Ivankovii, A.; Havranek, J.I. Influence of stage of lactation on the chemical composition and physical properties of sheep milk. Czech J. Anim. Sci. 2002, 47, 80–84. [Google Scholar]
- Olechnowicz, J.; Sobek, Z. Factors of variation influencing production level, SCC and basic milk composition in dairy goats. J. Anim. Feed Sci. 2008, 17, 41–49. [Google Scholar] [CrossRef]
- Nantapo, C.T.W.; Muchenje, V. Winter and spring variation in daily milk yield and mineral composition of Jersey, Friesian cows and their crosses under a pasture-based dairy system. S. Afr. J. Anim. Sci. 2013, 43, s17–s21. [Google Scholar] [CrossRef]
- Franco, I.; Prieto, B.; Bernardo, A.; Gonzalez Prieto, J.; Carballo, J. Biochemical changes through the ripening of a traditional Spanish goat cheese variety (Barbiana-Laciana). Int. Dairy J. 2003, 13, 221–230. [Google Scholar] [CrossRef]
- Garcia, M.I.H.; Puerto, P.P.; Baquero, M.F.; Rodriguez, E.R.; Martin, J.D.; Romero, C.D. Mineral and trace element concentrations of dairy products from goat’s milk produced in Tenerife (Canary Islands). Int. Dairy J. 2006, 16, 182–185. [Google Scholar] [CrossRef]
- Slacanac, V.; Hardi, J.; Lučan, M.; Komlenic, D.K.; Kratanović Jukić, M. Concentration of nutritional important minerals in Croatian goat and cow milk and some dairy products made of these. Croat. J. Food Sci. Technol. 2011, 3, 21–25. [Google Scholar]
- Dobrzański, Z.; Kolacz, R.; Górecka, H.; Chojnacka, K.; Bartkowiak, A. The content of microelements and trace elements in raw milk from cows in the Silesian region. Pol. J. Environ. Stud. 2005, 14, 685–689. [Google Scholar]
- Haenlein, G.F.W.; Anke, M. Mineral and trace element research in goats: A review. Small Rumin. Res. 2011, 95, 2–19. [Google Scholar] [CrossRef]
- Guler, Z. Levels of 24 minerals in local milk, its strained yoghurt and salted yoghurt (tuzlu yoghurt). Small Rumin. Res. 2006, 71, 130–137. [Google Scholar] [CrossRef]
© 2017 by the authors. Licensee MDPI, Basel, Switzerland. This article is an open access article distributed under the terms and conditions of the Creative Commons Attribution (CC BY) license (http://creativecommons.org/licenses/by/4.0/).